Review

Spine Deformity Assessment for Scoliosis Diagnostics Utilizing Image Processing Techniques: A Systematic Review

by
Nurhusna Najeha Amran
1,
Khairul Salleh Basaruddin
2,3,
Muhammad Farzik Ijaz
4,5,*,
Haniza Yazid
1,3,
Shafriza Nisha Basah
6,
Nor Amalina Muhayudin
2 and
Abdul Razak Sulaiman
7
1
Faculty of Electronic Engineering & Technology, Universiti Malaysia Perlis, Arau 02600, Malaysia
2
Faculty of Mechanical Engineering & Technology, Universiti Malaysia Perlis, Arau 02600, Malaysia
3
Medical Devices and Health Sciences, Sports Engineering Research Center (SERC), Universiti Malaysia Perlis, Arau 02600, Malaysia
4
Mechanical Engineering Department, College of Engineering, King Saud University, Riyadh 11421, Saudi Arabia
5
King Salman Center For Disability Research, Riyadh 11614, Saudi Arabia
6
Faculty of Electrical Engineering & Technology, Universiti Malaysia Perlis, Arau 02600, Malaysia
7
Department of Orthopaedics, School of Medical Science, Universiti Sains Malaysia, Kota Bharu 16150, Malaysia
*
Author to whom correspondence should be addressed.
Appl. Sci. 2023, 13(20), 11555; https://doi.org/10.3390/app132011555
Submission received: 11 August 2023 / Revised: 18 October 2023 / Accepted: 19 October 2023 / Published: 22 October 2023
(This article belongs to the Special Issue Advanced Imaging in Orthopedic Biomechanics)

Abstract

:
Spinal deformity refers to a range of disorders that are defined by anomalous curvature of the spine and may be classified as scoliosis, hypo/hyperlordosis, or hypo/hyperkyphosis. Among these, scoliosis stands out as the most common type of spinal deformity in human beings, and it can be distinguished by abnormal lateral spine curvature accompanied by axial rotation. Accurate identification of spinal deformity is crucial for a person’s diagnosis, and numerous assessment methods have been developed by researchers. Therefore, the present study aims to systematically review the recent works on spinal deformity assessment for scoliosis diagnosis utilizing image processing techniques. To gather relevant studies, a search strategy was conducted on three electronic databases (Scopus, ScienceDirect, and PubMed) between 2012 and 2022 using specific keywords and focusing on scoliosis cases. A total of 17 papers fully satisfied the established criteria and were extensively evaluated. Despite variations in methodological designs across the studies, all reviewed articles obtained quality ratings higher than satisfactory. Various diagnostic approaches have been employed, including artificial intelligence mechanisms, image processing, and scoliosis diagnosis systems. These approaches have the potential to save time and, more significantly, can reduce the incidence of human error. While all assessment methods have potential in scoliosis diagnosis, they possess several limitations that can be ameliorated in forthcoming studies. Therefore, the findings of this study may serve as guidelines for the development of a more accurate spinal deformity assessment method that can aid medical personnel in the real diagnosis of scoliosis.

1. Introduction

Three types of spinal deformities—scoliosis, lordosis, and kyphosis—are a set of disorders that are characterized by anomalous spinal curvature. A spine is deemed to be in good health when it is perfectly straight in the frontal plane, whereas it has lordosis in the lumbar and cervical region and kyphosis in the thoracic in the sagittal plane.
The most prevalent kind of deformity is scoliosis, which is a complicated three-dimensional curvature that is unable to be viewed from a single angle [1]. Scoliosis can be categorized into many types; hence, the most common scoliosis is adolescent idiopathic scoliosis, which can occur in and affects approximately 2% to 4% of adolescents [2]. Spinal deformity evaluation is a vital stage in deciding treatment since a good diagnosis of scoliosis can result in a better plan of care for scoliotic patients. Treatment is developed for scoliosis followed by diagnosis, which depends on the severity of the disease in the person [2,3,4], such as bracing, surgery, and changes in daily lifestyle.
Scoliosis can be confirmed through clinical examination and specific radiological exams with a key metric that is currently used by clinicians, which is the Cobb angle. Clinicians used a protractor to draw two lines that are perpendicular to each other where each line must lie at the most tilted vertebrae [3]. This process was undertaken to calculate the Cobb angle between the superior endplate of the upper extremity curvature and the inferior endplate of the lower extremity of the vertebrae [5]. Even though this measurement is the golden principle for identifying scoliosis, however, the measurement’s accuracy can be questionable, as it is manually measured by the clinicians, which might lead to human error. The measurement also can vary from one clinician to another clinician due to their eye observation of the most curved vertebrae [6,7]. The Ferguson angle is an alternative measurement that identifies the three markers of a scoliotic curve: the geometric centers of the upper, apical, and lower vertebrae [1]. Both metrics require medical professionals to manually choose the vertebrae, which might result in bias based on the medical professionals that leads to inaccurate diagnosis. Typically, medical professionals need to know the patient’s background, such as the patient’s age, the size of the curve, the location of the curve, and the condition, in identifying scoliosis, so they know what they are dealing with when treating patients. The patient’s age is an unreliable indicator of potential progression, while the degree of spinal curvature can be estimated by measuring the angle of the curve, thereby giving insight into its severity. According to the studies conducted by Shrestha et al. [7] and Horng [8], an individual can be considered to have no scoliosis if the Cobb angle measures less than 10 degrees. In cases when the Cobb angle ranges from 10 to 20 degrees, this indicates mild scoliosis, and scoliosis is classified as severe when the Cobb angle exceeds 40 degrees. Moreover, the Lenke Classification system [9] enables surgeons to obtain a comprehensive understanding of a patient’s condition by assessing the location and type of curvature from a two-dimensional perspective.
Modern three-dimensional medical imaging offers emerging opportunities and potential in assessing spinal deformities. These opportunities offered by emerging imaging diagnostic equipment, such as computers and software applications, can avoid or lessen the shortcomings highlighted in the past and meet the demands of the medical community. The current diagnosis of scoliosis can be established via radiographic examination [10], and four imaging modalities that are relevant to the diagnosis are plane radiography (X-rays), computed tomography (CT), magnetic resonance imaging (MRI), and back surface topography (ST) [1]. While CT and MRI could provide detailed images of the spine in three dimensions, radiography can only provide a basic view of the spine in two potential projections—anterior–posterior and lateral. ST is a photogrammetric technique that involves reconstructing an object’s forms, sizes, and relative placements. Hence, each modality has its pros and cons, which can affect the performance of the diagnosis.
Much research has investigated the assessment method in identifying scoliosis in every aspect to acquire a good diagnosis. The current body of research on the assessment methodology for diagnosing scoliosis through the utilization of image-processing techniques that can be applied in practical scenarios is restricted. What remains unknown is the optimal diagnostic mechanism that employs these approaches and that can be effectively executed in real-world scenarios.
In this regard, several researchers have attempted to create novel methods that might enhance the way spinal deformity is currently assessed, such as raster stereography, the artificial intelligence (AI) scoliosis detection method, and many more. There are studies on the golden parameter which is the Cobb Angle measurement, using AI methods performed by Vyas [11] and Sun [12] for detecting deformities. Research [13] on a new angle, a polar angle using non-invasive methods to assess scoliosis, also has been explored. Due to the recent development of these methods, there exists a scarcity of comprehensive reviews that concentrate on summarizing the assessment methods employed in diagnosing scoliosis deformities. In addition, certain reviews have a limited range that is not particularly relevant to our field of interest in image-processing approaches for scoliosis diagnosis. Previous reviews [14] focus on summarizing assessment methods and imaging modalities with chest and trunk deformation as the parameters. Considering the vast range of potential variables that can be employed in the assessment methods, including the parameters evaluated, imaging modality, plane, and software tool utilized, it is plausible that certain articles may have been inadvertently disregarded in previous reviews. Hence, the aim of this systematic review paper is to provide a summary and to gain an understanding systematically of the current and latest scoliosis diagnostic method that utilizes image processing techniques. It aims to find gaps and possible best variables that can be utilized in scoliosis deformity assessment methods that can be helpful for future works when developing accurate diagnostic methods. Therefore, the advantages and disadvantages of the diagnostic methods presented in this review paper can help to find appropriate methods to assess scoliosis severity.

2. Materials and Methods

The 2020 Preferred Reporting Items for Systematic Reviews and Meta-Analyses (PRISMA) standard [15] was followed for this systematic review.

2.1. Search Strategy

Article search was performed through the electronic databases and was restricted to ten years of publication. Three databases were used to obtain the articles, which were Scopus (2012–2022), ScienceDirect (2012–2022), and PubMed (2012–2022). The following search keywords were used to identify research addressing the assessment and diagnosis of spine deformities using imaging techniques: “spinal deformity”, “assessment”, “diagnostic,” “treatment”, and “image”. The Boolean operator “AND” was used in searching the papers. The search was limited to only complete English textual articles and included research articles and studies only.
This study started with the PICO (Population, Intervention, Comparison, Outcome) strategy as follows: The population interested in this study was humans who encounter spinal deformity diseases, especially scoliosis, and the intervention of the interest was the assessment method to diagnose the scoliosis utilizing image processing techniques. The outcome of the interest was the effectiveness and how successful the method was in diagnosing scoliosis.

2.2. Eligibility Criteria

The articles were evaluated using following inclusion criteria: (1) studies regarding assessment methods to diagnose scoliosis using images, (2) Cobb and Ferguson angles or any parameters used as parameters to measure scoliosis, (3) full-text English research articles only, (4) reliability and/or validity of the scoliosis assessment measurement was evaluated, (5) included the selected search keywords in abstract and/or title and/or keywords of the study.
Exclusion criteria for articles were (1) studies with other spinal deformities (such as lordosis and kyphosis), (2) books, letters, survey or literature reviews, case reports, (3) not able to be accessed, (4) unavailable full-text articles, (5) studies that were not able to provide details of their methodology and protocol design study or experiment.

2.3. Selection and Screening of the Studies

The results of the search were assessed and retrieved according to the keywords by the two reviewers (N.N.A. and K.S.B.). Articles authored by the same individual were eliminated to prevent duplication. Titles and abstracts of the articles were read thoroughly, and a selection was made in accordance with the inclusion and exclusion criteria. A comprehensive analysis of the full-text articles was conducted in instances during the screening process if the articles disclosed inadequate information in the titles and abstract. The articles that were rejected were rescreened to prevent any unnoticed information. The final papers were subject to individual scrutiny by two reviewers in accordance with the established criteria for eligibility to reduce bias. In instances where there was contradiction, the two reviewers engaged in discussion to resolve the matter, ultimately reaching a consensus. This study did not impose any limitations on the subjects’ ages, genders, body mass indices (BMIs), or medical histories.

2.4. Data Extraction

The relevant data extracted from each study were author and publication year, data characteristics, variables of scoliosis deformity assessment (imaging modality; parameters evaluated for scoliosis measurement; assessment method; software/tools used for scoliosis analysis), protocol or design study, and outcome measure.

2.5. Assessment of Research Quality

There is no standardized or validated method to evaluate the credibility of the identified articles. In this paper, the articles were assessed using a systematic quality method to analyze and review them by the two reviewers. This method can be instrumental in obtaining the most pertinent and significant information from the articles. Questions were adapted from previously published articles by Kavita et al. [16] and Wen et al. [17] as a reference to evaluate the credibility of the articles, and several questions were excluded, as they failed to justify spine deformity assessment and diagnosis. Some of the questions underwent modifications based on our aim in this study, which is imaging method. Each of the questions was valued with a score of “2” if it fulfilled the questions, whereas a score of “1” was valued if it had lack of detailed information. A score of “0” or “no” was given if there was no information provided and “NA” for questions that were not applicable. The questions are as follows below:
  • Has the objective of the study been articulated with clarity?
  • Does the study design have a clear and detailed outline?
  • Are the subject/data characteristics and details presented distinctly?
  • Is method used to assess the spinal deformity clearly defined and described?
  • Does the study involve imaging method to diagnose spine deformity?
  • Is parameter measured used in the method clearly described?
  • Does it use the appropriate numerical methods in data analysis, and is the analysis clearly verified or validated?
  • Does study have clear outcome?
  • Did the study state the limitations?
  • Does the study have a clear conclusion?

3. Results

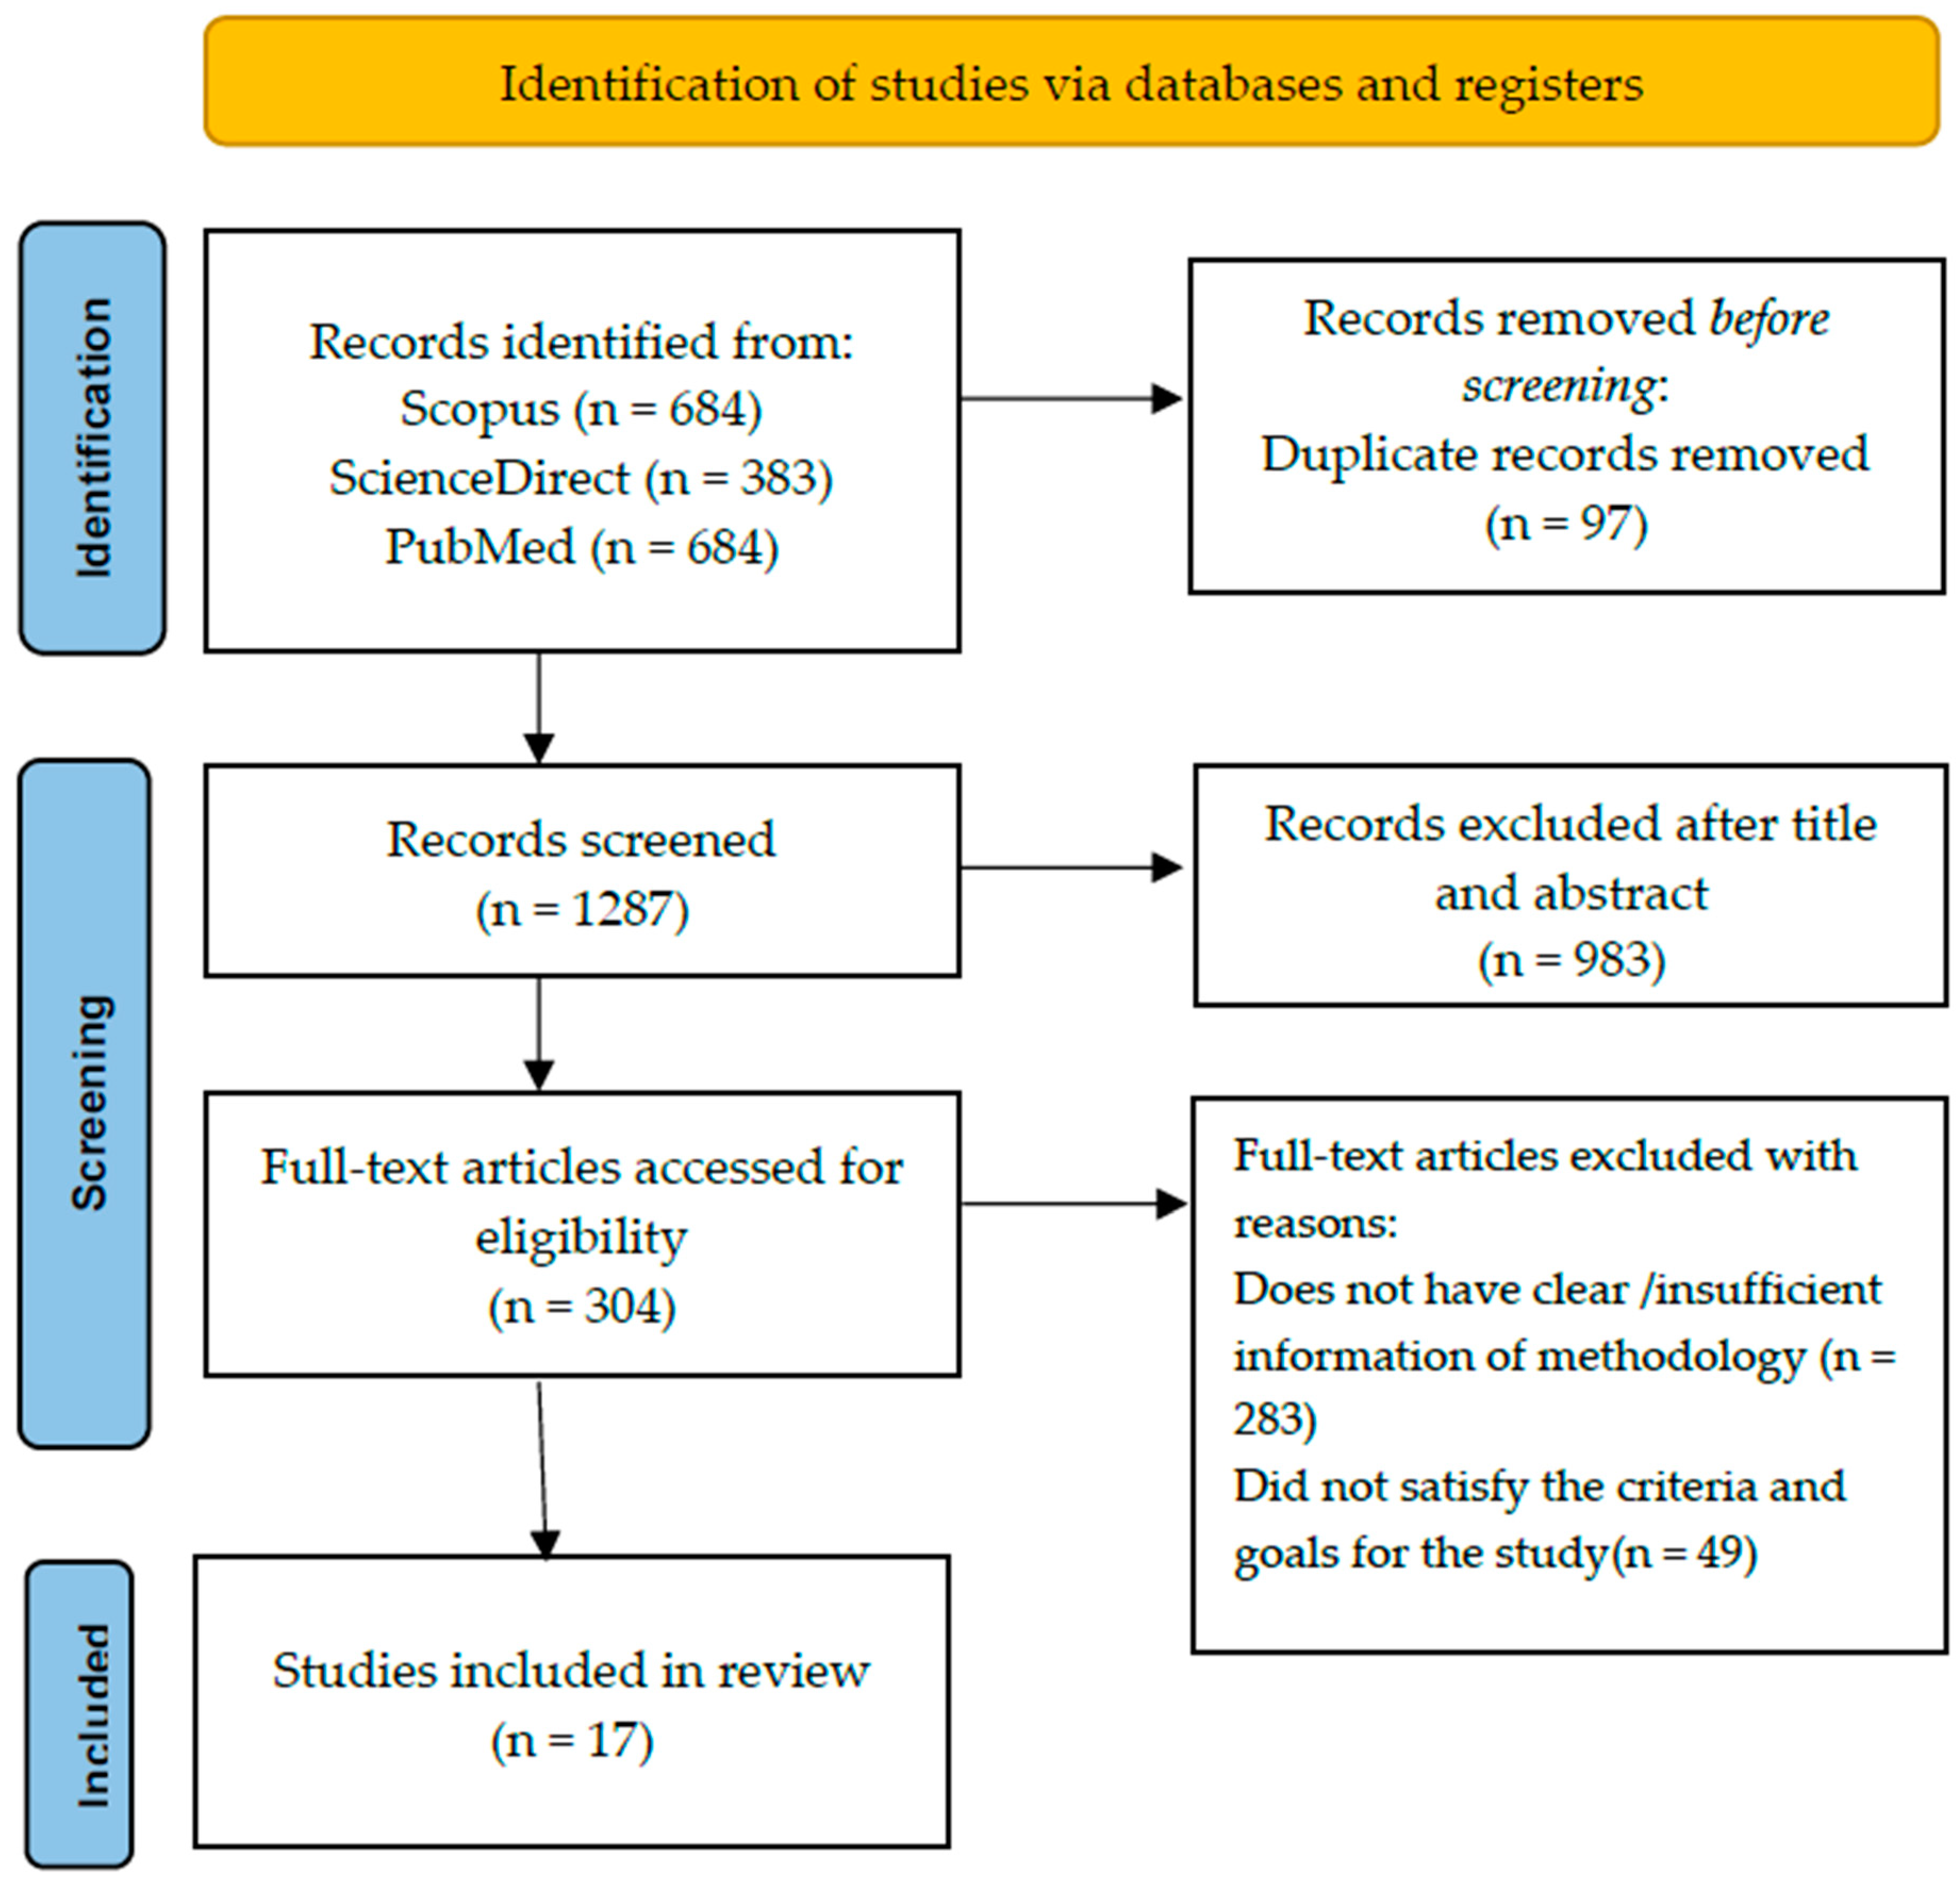
3.1. Primary Search Results

Seventeen articles were selected after a meticulous screening procedure, and Figure 1 provides the selection procedure of the systematic review of the articles. A total of 1384 articles were identified based on the search keyword and research article criteria, with inclusion restricted to those written in the English language throughout the entire process. Following the process, 97 of these articles were identified as duplicates and eliminated. The titles and abstracts of the articles were reviewed to evaluate the relevancy of the article studies, and 983 articles were then eliminated. An additional screening was performed by reading the full text of the articles to ascertain the goals of the studies based on the eligibility criteria that were assessed, and 304 articles were eliminated. A total of 283 articles were rejected because the studies did not provide clear details on the methodology or the protocol or design of their study, while 49 articles were discarded because they were unable to satisfy the inclusion and exclusion criteria established. Some of the articles merely presented their methodological studies in a generic and ambiguous manner, lacking information pertaining to the whole diagnostic process and unable to provide clear objectives or results of their studies. There were 17 articles retrieved for further review that related to and met the criteria. The final articles were scientific research articles pertaining to the evaluation of scoliosis deformity that were deemed suitable for inclusion in this investigation. In this study, the researchers conducted empirical inquiries for their scholarly exploration, wherein they formulated and designed their inquiries that encompassed regulated variables and deliberate data. Certain researchers utilized randomized controlled studies in their studies, wherein they compared their approach with the existing method. Conversely, others adopted a single-case design, focusing solely on the development of their novel approach, providing their own control for comparison, and demonstrating the efficacy of their method instead of evaluating disparities with the current approach.

3.2. Analyzed Data Quality of Assessment Articles

The quality scores of the 17 reviewed articles are presented in Table 1. The reviewed articles exhibit quality scores in the range of 70% to 95%. The articles with scores above 85% are considered good, as they satisfactorily answered all the questions and provided in-depth information regarding their objectives, design study, outcomes, and conclusions. Only 2 out of the 17 papers achieved a score of less than 80%, and most of them achieved more than 80%. These findings indicate the reviewed papers are of high quality.

3.3. Data Characteristics and Details

Table 2 presents a list of the data used from the 17 reviewed articles. The sources of the data can be categorized into two, which are the patients and images. Most of the articles used subjects that were patients to obtain images, and only four articles [18,19,20,21] used solely readily images as their dataset. Three studies used private datasets, and one paper did not state the source of the dataset. The number of subjects or data that participated in the studies varied with the highest being 3240 images and the lowest being 10 patients. Three studies involved a wide age range of individuals (aged between 11 and 86) [20,22,23], and ten studies focused on adolescents and middle-aged individuals (aged between 10 and 30 years old) [18,24,25,26,27,28,29,30,31,32], while four studies did not provide the age information of the dataset. Fourteen studies provided the required details of the data included in the investigations, such as the inclusion and exclusion criteria. The other three studies did not provide extensive and clear details on the dataset, which led to bias.
Table 1. Overall Rating Score of the Reviewed Articles.
Authors and YearQuestionsOverall ScoreOverall
(%)
12345678910
Dubousset et al. (2014) [24]122112222116/2080.0
Colombo et al. (2021) [25]222222221219/2095.0
Yang et al. (2019) [18]21222NA121114/1877.8
Yildirim et al. (2021) [26]222221221016/2080.0
Grunwald et al. (2023) [22]122212121216/2080.0
Rothstock et al. [27]221222121217/2085.0
Liu et al. (2022) [19]222221221117/2085.0
Wang et al. (2015) [28]222222221118/2090.0
Zheng et al. (2016) [29]222221112217/2085.0
Lukovic et al. (2019) [30]222221121217/2085.0
Navarro et al. (2019) [31]222211222218/2090.0
Celan et al. (2015) [23]212202220114/2070.0
Yang et al. (2022) [33]221222221218/2090.0
Sikidar et al. (2022) [32]222201221216/2080.0
Roy et al. (2020) [20]221222211217/2085.0
Hurtado-Aviles et al. (2022) [21]221122221217/2085.0
Glowka et al. (2020) [34]221222220116/2080.0
Table 2. Data Characteristics and Details of the reviewed studies.
AuthorsData SampleNumber
Subject/
Data
GenderDetails of Subject/Data
Dubousset et al. [24]Patients49Male: 4
Female: 45
Age: 13–17 years old
Colombo et al. [25]Healthy and
scoliotic
patients
298Male: 135
Female: 163
Inclusion criteria: -
Age: 14–30 years old
Male or female
Exclusion criteria: -
Clinical background of vertebrae pathological
condition of vertebrae whether congenital or
acquired.
Medical history of vertebral fractures and/or
vertebral surgery.
Disc protrusion/hernia in any level of the spine
diagnosis.
Diagnosis of scoliosis is secondary to neurological, rheumatological, and/or congenital conditions.
AIS diagnosis through X-rays with Cobb angle greater than 45°.
Any neurological and/or rheumatological condition diagnosis.
Yang et al. [18]Labeled images of
unclothed backs and standing
posterior–anterior X-ray images of spine or
ultrasound
images from
normal and
scoliosis patients
3240Male: 1029
Female: 2211
Age: 10–20 years old
Exclusion criteria: -
Subjects exhibit nontrue scoliosis (attributed to pain or leg discrepancy, amongst other factors).
Other spine disorders or abnormalities in the back region (such as soft tissue mass, thoracic cage diseases, etc.).
Yildirim et al. [26]Patients42Male: 10
Female: 32
Age: 10–20 years old
Caucasian ethnic group
Exhibits a double spinal curve with convexity
towards the right in thoracic region and convexity towards left in lumbar region.
Exclusion criteria: -
Gap between the umbilicus-medial malleolus and SIAS-medial malleolus on both right and left side must exceeds one centimeter.
Grunwald et al. [22]Patients10Male: 5
Female: 5
Age: 11–50 years old
Show signs of spinal deformation.
Able to stand upright without support.
Rothstock et al. [27]Patients50NM *Age: 12–15 years old
Adolescent idiopathic scoliosis patients and are scheduled to have initial bracing to eliminate any
potential artifacts from prior treatments or
operations.
Liu et al. [19]X-ray images in anterior–posterior (AP) and lateral (LAT) position400 images of 200 patientsNM *Height–width ratios of the image ratio from 1.85 to 2.16.
Average image resolution was 3560 × 1740 × 3 pixels and resized into 1024 × 512 × 3 pixels.
Wang et al. [28]Patients16Female: 16Inclusion criteria:
Adolescent female
Age: 10–18 years
Cobb angle: 10°–80°
No previous surgical treatments.
MRI examination of the entire spine on the study day without the use of a brace.
Zheng et al. [29]Patients49Male: 15
Female: 34
Age: 11–23 years
Exclusion criteria:
Have metallic implants.
BMI higher than 25 kg/m².
Cobb angle larger than 50°.
Lukovic et al. [30]Patients35Male: 15
Female: 20
Age: 11 to 18 years
Navarro et al. [31]Patients61NM *Age: 7–18 years
Eligibility criteria:
Doctors requested to conduct a full-spine
radiography.
Have ability to maintain an upright position
independently.
Did not undergo surgical procedure in the spinal region.
Absence of spina bifida, sixth lumbar vertebra, or fewer than 12 thoracic vertebrae.
Celan et al. [23]Patients275Male: 129
Female: 146
Age: 16–82 years
Distributed into 2 groups, which were scoliosis group that was clinically confirmed scoliosis (28
patients) and control group that was clinically confirmed physiological spinal curvatures
(247 patients).
Yang et al. [33]Patients30Male: 9
Female: 21
-
Sikidar et al. [32]Patients16All femaleInclusion criteria:
Age: 12–22 years
Cobb angle: (healthy controls (HC) < 20°, 20° < mild scoliosis (MS) < 40°, severe scoliosis (SS) > 40°)
Height range: 130–170 cm
Weight range: 25–65 kg
Exclusion criteria:
Neurodegenerative disorders, such as ataxia,
dystonia, Parkinson’s, etc.
Roy et al. [20]Computed
tomography (CT) images
26Male: 14
Female: 12
Age: 18 to 86 years
Hurtado-Aviles et al. [21]X-ray images21NM *Image resolution was 283.46 pixels/mm and printed in dimensions of 350 by 430 mm.
Glowka et al. [34]Patients41NM *Inclusion criteria:
Presence of a main curve either in thoracic or lumbar region.
Imaging modalities conducted throughout duration of the hospitalization: high-quality plain-standing X-rays (PA and lateral) and thoracic and lumbar spine CT scans conducted as part of the preoperative
protocol.
Exclusion criteria:
Scoliosis type other than the idiopathic, a lack of CT or PA and lateral standing X-ray data, and poor-quality X-rays.
* NM—Not mentioned.

3.4. Assessment Methods for Scoliosis Diagnosis

The goal of conducting a systematic review is to reduce the likelihood of potential biases by thoroughly searching and examining all published papers. All the characteristics and design studies in diagnosing scoliosis, such as the imaging modality/instrumentation, the parameter/landmark evaluated, the software or tools used, the assessment mechanism, and the plane/view used, have an influence on the accuracy and precision of the study. These variables have an impact on the method that must be considered in the evaluation of both the outcomes and inferences. Table 3 presents the variables utilized by the reviewed articles of the assessment method for scoliosis diagnosis. These data can help to provide supplementary information by comparing methods in scoliosis diagnosis studies.
The instrumentation or imaging modality is crucial in capturing the structure of the spine to obtain good image quality because it affects the accuracy of scoliosis diagnosis. Six out of eighteen studies used common and conventional imaging modalities, such as X-rays, computed tomography (CT), and ultrasounds [18,19,20,28,33,34], while other researchers [21,22,23,24,25,26,27,29,30,31,35] used uncommon instrumentation, like rasterstereography, cameras, EOS imaging, scanners, and 3D laser profilemeters. Special mention goes to Sikidar et al. [32], as the study did not collect data as images that used electromyogram (EMG) and ground reaction force (GRF) data.
The critical aspect of the diagnosis of scoliosis deformities is the parameters or landmarks evaluated during the assessment, as they are utilized as a metric that determines the existence of scoliosis in a person. The gold-standard parameter that current clinicians use is the Cobb angle, which [21,27] utilized in their studies. Study [18] provided no evaluated parameter, as the study used image processing for the assessment, whereas the authors constructed new parameters or improvised from the current parameter to evaluate scoliosis. The new parameters used for scoliosis evaluation are the vertebrae as a landmark [22,24], rasterstereographic measurements [25], the center of laminae (COL) [28], the Scolioscan angle [29], a digital image-based postural assessment (DIPA) [31], the bending asymmetry index (BAI) [33], EMG and GRF [32] data, and a 3D scoliosis angle [34].
Three possible approaches have been employed for the assessment method of scoliosis diagnosis where five scholarly articles devoted to the study of artificial intelligence [18,19,25,27,32], nine articles studied image processing [20,22,24,26,28,31,33,34], and four articles studied building a system to diagnose scoliosis [21,23,29,30]. Digital image processing has become the most common form in the medical field, as it is the most efficient and cheapest method. Previous studies have tested scoliosis assessment by using various image processing techniques, including 3D reconstructions of the spine and rib cage [24], segmentation and superimposition [26], the COL [28], photogrammetry [31], the BAI method [33], automatic analysis and measurement of 3D spine images [20,34]. Studies on artificial intelligence implemented deep learning, machine learning, and supervised learning in the assessment of scoliosis, while computer-aided systems including graphic user interface (GUI) analysis tools, the Scolioscan system, the ScolioMedIS system, and 3D laser triangulation systems were built to identify and recognize scoliosis.
Four out of eighteen studies used MATLAB software for scoliosis diagnosis and analysis studies [18,20,30,31], and two studies [23,33] do not mention, while others used a variety of custom software.
Table 3. Variables of Scoliosis Deformity Assessment studies.
AuthorsInstrumentation/
Imaging Modality
Parameters Evaluated for Scoliosis MeasurementAssessment Method of
Scoliosis Diagnosis
Software/
Tools Used for Scoliosis Analysis
Dubousset et al. [24]EOS imaging
system
Thoracic: Thoracic volume, mean spinal penetration (SPIm), apical spinal
penetration (SPIa)
Spinal and pelvic: T4/T12 kyphosis, L1/S1 lordosis, Cobb angles of different curves; (lumbar, main thoracic, proximal thoracic), apical vertebral rotation (AVR), torsion index of main thoracic curve
Three-dimensional
reconstructions of spine and rib cage from EOS low-dose biplanar stereoradiography
IdefX (version 4.8.4, Arts et Metiers
ParisTech, Paris, France)
Colombo et al. [25]RasterstereographyRasterstereographic
Measurements: 40 VRS
features including thoracic kyphosis angle, lumbar
lordosis angle, lumbar fle’che, cervical fle´che,
kyphotic apex
Supervised and unsupervised machine learning (ML)Video–Raster–Stereography (VRS), Formetric 4D system
Yang et al. [18]Camera
X-ray
Ultrasound
NA *Deep learning algorithms (DLAs): Faster-RCNN and ResnetMATLAB
Yildirim et al. [26]Hand-held 3D scanner deviceDistance, angle, and
geometric measurements
Image processing after 3D scanning (segmentation and superimposition) and 3D
analysis (point-to-point
distance calculation and
colored deviation map)
Artec studio software 2013,
Netfabb Basic software (version 6.0.0146, Netfabb GmbH 2013 Lupburg Germany), GraphPad Prism software (version 6.05, San Diego, CA, USA)
Grunwald et al. [22]Body scanner
system
incorporates both an infrared depth sensor and an RGB video camera
Thoracic, lumbar,
thoraco-lumbar region.
GUI of body scanner image
analysis tools
Computer-Aided Design (CAD), FEBio software
Rothstock et al. [27]3D depth sensorCobb angle and
Augmented
Lehnert-Schroth (ALS)
Machine learning (ML)Python 3.1 (Beaverton, OR, USA),
Artec studio software (Artec 3D, Luxembourg)
Liu et al. [19]2-plane view X-ray3D coordinate of spinal curvatureA multi-scale keypoint
estimation network and a
self-supervision module
Pytorch
platform on NVIDIA RTX 2080Ti GPU
Wang et al. [28]Ultrasound
MRI
COLMeasurements center of
laminae (COL)
Custom
developed
software
Zheng et al. [29]ScolioscanScolioscan angle3D ultrasound imaging method: Scolioscan systemScolioscan
Lukovic et al. [30]Formetric DIERS rasterstereography scanner and
digital photo
camera
Cobb angle and spinal
curvature
Ontology-based of the
information system
ScolioMedIS
MATLAB
Navarro et al. [31]Digital camera (Sony Cybershot DSC-F717, 5.0
megapixels,
512 Mb of memory, 5× optical zoom and 10× digital
zoom) and
radiography
Digital image-based
postural assessment (DIPA) angle and Cobb
angle
Photogrammetry and
radiographic evaluation
DIPA software and MATLAB v7.9.
Celan et al. [23]3D laser
profilemeter
Extreme points in
the anteroposterior (AP) and left-right (LR) views
3D laser triangulation systemNM
Yang et al. [33]X-rayBending asymmetry index (BAI)Semi-automatic X-ray-based BAI method.
2 stages are involved, which are manual annotation and adjustment of pelvis level inclination and automatic generation of BAI values.
NM
Sikidar et al. [32]SMART DX100Electromyogram (EMG) and ground reaction force (GRF)Supervised learning modelMokka open-source software (Version 0.6.2, 64-bit,
Windows,
Biomechanical Toolkit)
Roy et al. [20]Computed
tomography (CT) scans
Circularity, difference
between the areas located on the left and right of the spinous process (LRAsm) and difference between the ratios of width/depth on each side of the centroid of the contour (ASR).
Automatic analysis of 3D structure of human torso by quantifying asymmetry in transverse contours.MATLAB2019a and 3D slicer
software
Hurtado-Aviles et al. [21]X-rayCobb angleComputer-aided measurement systemTraumaMeter software (v.874, Jose Hurtado Aviles and Fernando Santonja Median, registration number 08/2021/374, Murcia, Spain)
Glowka et al. [34]Computed
tomography and digitally
reconstructed
radiographs (DRRs)
3D scoliosis angleMeasurement of the 3D angles between the upper end
vertebra’s upper endplate (three points coordinate) and lower-end vertebra’s lower endplate (three-point
coordinate).
DeVide
Software (The Delft University of Technology, The Netherlands)
* NA—Not available.

3.5. Other Variability Used in This Study

The outcome and findings of the reviewed articles can be summarized in Table 4. There are two possible approaches that have been used for the investigation of scoliosis where thirteen studies performed their design study in quite the same pattern where the patients needed to perform quite the same procedure for the data collection and acquisition. The patients needed to execute the validated posture in front of the instrumentation or imaging modality to obtain the spinal images. But this differs from authors [18,19,20,21] where the data acquisition was collected from previous or available data from a repository collection.
It can be observed from the articles that scoliosis can be identified from multiple planes’ views, which are from the frontal, sagittal, lateral, transverse, and anterior–posterior planes. The majority of the scholars studied scoliosis deformity using only one view plane, which was the coronal or frontal plane [18,21,26,28,29,31,33], while five studies used two planes, and four studies used three view planes [20,22,24,27] to assess the scoliosis deformity. The selection of a view plane during the scoliosis deformity assessment plays an important role in giving a better view of the spine.
Based on the reviewed articles, the outcome measures showed the reliability and validity of the method of the scoliosis assessment, which can be proven in the findings in Table 4. A total of five studies [18,25,27,30,32] were evaluated in their methodology through the application of performance classification, which involved the utilization of measures such as accuracy, sensitivity, and specificity. When classifying scoliosis, the majority of artificial intelligence studies [18,25,27,32] achieved above 70%, where the highest accuracy was 90.7%, and the lowest accuracy was 55%. The maximum registered accuracy level was 90.7%, whereas the minimum was 55%. It can be noted that accuracy values above 70% can be considered satisfactory, whereas there was one case that achieved low accuracy in the study [18] for algorithm 3 compared to the other two algorithms. Other than that, a variety of statistical significance methods were used to validate the method of scoliosis assessment, and this can be proven in the findings in Table 4. Seven studies were compared based on their developed method for measuring the Cobb angle where the validity of the measurement was appraised using the Pearson correlation coefficient (r-value) and p-value as evaluation measures. Most of them have satisfactory validity results that achieved an r-value of more than 0.7, which indicates a good to strong correlation level. Two studies [28,29] underwent both reliability and validity assessment, which evaluated both the intra- and inter-rater reliability using the ICC as the evaluation index, as well as the Pearson coefficient. From the reliability results where the ICC value achieved more than 0.9, it can be said that their methods had excellent reliability levels. While other authors abstained from drawing comparisons between their approach and alternative methods, they solely presented the accomplished measurement outcomes attained through their devised methodology.
Table 4. Design Study and Outcome Measures from reviewed articles.
AuthorsProtocol/Design of StudyPlane/ViewOutcome Measures
Dubousset et al. [24]Patients in standing position for less than 15 min to obtain their specific 3D spinal reconstruction with the EOS system.
Thoracic parameters were computed, and spinal and pelvic parameters were
measured during the reconstructions.
Axial
Frontal
Sagittal
Mean pelvic incidence 54.3° (±14)
Rotation of axial pelvic ranged between 2° and 6°
Spinal parameters (Mean ± standard
deviation)
Cobb angle of main thoracic (61.2 ± 13°)
AVR (19.9 ± 7°)
Torsion index 15.8 ± 6
Proximal thoracic Cobb angle (30 ± 11°)
Lumbar Cobb angle (42 ± 11°)
T4-T12 kyphosis (18 ± 13°)
L1-S1 lordosis (53.7 ± 14°)
Thoracic parameters (Mean ± standard
deviation)
Thoracic volume (5056 mm³ ± 869)
SPIa (13.3% ± 1.7)
SPIm (8.7% ± 1.2)
Colombo et al. [25]Patients maintain a static stance in an
upright posture at a predetermined
distance from camera for 6 s.
Data acquisition (sample of pictures)
obtained with Formetric 4D system. Then, data underwent cleaning and
normalization before proceeding to
machine learning procedure.
Frontal
Sagittal
Accuracy for unsupervised classifier ML for full set
features achieved 61.7% and minimal set features achieved 72.2%.
Accuracy for supervised classifier ML for full set
features achieved 87.5% and 86.3%. While accuracy of minimal set features achieved 83.7% and 85.5%.
Yang et al. [18]Subjects need to stand naturally for data acquisition conducted using multiple cameras. The patient’s back was captured disrobing above hip.
Data collected from 3240 patients with images of labeled back and entire spine standing posterior–anterior X-ray images or ultrasound images, which were used for training validation dataset. For
external validation, 400 images were used for the process. Both training and external validation were performed for three
algorithms, which are cases with curve ≥10°, cases with curve ≥20°, and curve
severity grading.
FrontalPerformance of DLAs was measured with accuracy, sensitivity, and specificity, which the results are shown as below: -
Algorithm 1:
Accuracy = 75%, Sensitivity = 80.67%,
Specificity = 58%
Algorithm 2:
Accuracy = 87%, Sensitivity = 84%,
Specificity = 90%
Algorithm 3:
Accuracy = 55%
Yildirim et al. [26]Patients’ back surfaces scanned with 3D hand-held scanner in three distinct
positions (P1: stand with arms hanging at the sides, P2: stand with arms
extended, P3: bend forward). Patients required to stabilize their body position as much as possible while maintaining normal breathing.
Distance patients with scanner adjusted according to the distance indicator in
Artec Studio software and 3D surfaces of the patients acquired.
FrontalThe RMS and Cobb values in the thoracic were observed to have a significant
correlation coefficency (r) (P1 = 0.80, P2 = 0.76, P3 = 0.71) and lumbar region (P1 = 0.56, P2 = 0.65, P3 = 0.63);
Grunwald et al. [22]Patients need to maintain static and
vertical stance with their arms slightly abducted in front of the scanner. The scanning duration took no more than 10 s.
Coronal
Transverse
Sagittal
Correlation coefficients of ρs > 0.87
indicates strong correlation between Cobb angle and lateral deviation, between Cobb angle and rotation of the vertebrae.
Parameters have potential to offer supplementary information.
Rothstock et al. [27]Patients need to be positioned in vertical stance with their arms slightly extended away laterally from the torso on an
electronic tumtable for full torso 360° 3D scanning.
Reconstruction of 3D trunk surface was performed with 3D software for data acquisition.
Data analysis and classification were performed in terms of radiographic analysis and 3D surface topography.
Coronal
Transverse
Sagittal
Accuracy classification for curve severity = 90%.
Accuracy classification for ALS = 50–72%.
Liu et al. [19]Data acquisition of 400 full spine
radiography images in anterior and
lateral views from 200 patients.
The dataset images were resized and
partitioned into two sets, training set (340
images) and validation set (60 images).
Conventional augmentation method
applied to the dataset. (Add Gaussian noise and rotated up to 10 degrees
randomly).
Anterior–posterior and lateralAverage precision, AP = 81.5 AP with
regarding both AP and LAT views.
Pearson correlation
coefficient (ρ) = 0.925.
Statistical significance test: p-value = 0.02134.
Null hypothesis states that there is no
significant difference in the AP between proposed method and the average
outcome of the other established method.
Requires verification in real-world
scenario.
Wang et al. [28]Ultrasound scan was performed with
following parameters: a frequency of 2.5 MHz, an 18 cm penetration depth, gain of 10%.
Patients’ backs palpated and marked from C7 to S1 using a water-soluble marker for the scanning process.
The patient laid on the scanning couch in supine position and received a total of 6 scans that were evaluated by 2 raters, with each rater with 3 scans.
CoronalHas significant intra- and
inter-rater reliability to measure the
coronal curvatures. (Both with ICC, (2, K) > 0.9, p < 0.05)
There was no significant difference (p < 0.05) found in COL method in ultrasound
during measurement of coronal curvature at supine position.
Bland–Altman method evinced an accord between these two methods, and it was found that Pearson’s correlation
coefficient (r) has a high value (r > 0.9, p < 0.05).
Zheng et al. [29]Subjects stands in front of the Scolioscan according to the locations of the four
supporters at the scanner. Subjects scanned using the Scolioscan probe along the screening region.
CoronalScolioscan angle
measurement shows a remarkably
commendable intra-rater and intra-
operator reliability with ICC larger than 0.94 and 0.88, respectively. The angle measurement between Scolioscan angle and Cobb angle provides moderate to strong associations with R2 greater than 0.72 for both thoracic and lumbar regions.
It was observed that Scolioscan angle tends to slightly underestimate the extent of spinal deformity compared to Cobb
angle.
Lukovic et al. [30]System developed with the aid of an
ontology-based module that
implements four fundamental steps, which are specification,
conceptualization, formalization, and
implementation.
Frontal
Sagittal
The system has capacity to classify spinal curvatures and produce statistical
markers about spinal curvature
frequency, degree progression, and Lenke
classification system.
Navarro et al. [31]Photogrammetry method:
Patients subjected to a photographic
register in orthostatic posture and have the same position as the radiograph method for the upper and lower limbs.
The spinous process of the C7, T2, T4, T6, T8, T10, T12, l2, l4, and S2 vertebrae was marked using double-sided tape to indicate as reference anatomical
landmarks.
Radiologic method:
Patients assumed a relaxed orthostatic posture with the trunk pressed against the grid and kept the upper limbs at the side of the body and the feet while radiologist obtained the full-spine radiographs. Inspiratory apnea
maintained during the process of the
radiograph.
Coronal for
photogrammetry and anteroposterior for radiography
Thoracic, lumbar, and
thoracolumbar scoliotic curve
topographies were used to categorize the
analyses. All the areas of the spine had high correlations (ranging from 0.72 to 0.81) and significant correlation
coefficients (between 0.75 and 0.88). The mean difference was quite near zero, while the root mean square error ranged from 5 to 11 degrees. The area under the curve, which ranged between 95% and 99 percent, was outstanding and
noteworthy.
Celan et al. [23]Patients in upright standing position and leaning against a foam affixed to the wall during the measurements. Arms were
allowed to hang freely near body while holding their breath.
Transversal
Frontal
The distances between the extreme points of the spine in the AP view were found to be marginally different between the groups (p = 0.1); however, the distances between the LR extreme points were observed to have a greater significant difference in the
scoliosis group compared to the control group (p < 0.001). The quotient LR/AP was determined to be statistically
different in both groups (p < 0.001). Thus, this indicates that the method is proficient enough to differentiate between scoliotic and healthy subjects based on statistical differences.
Yang et al. [33]Patients underwent X-ray scanning in three adopted postures, which were
anterior–posterior (AP) supine, left and right bending.
CoronalBetween BAI and S-Cobb, the correlation value was R² = 0.730 (p 0.05). Out of 30
patients, 1 case was proven to have been
incorrectly diagnosed while using the Lenke classification before and has now been corrected. All scoliotic curve types were correctly identified.
Sikidar et al. [32]Dataset was obtained while the subjects were in static pose (standing), and
approximately 2 to 6 trials were
captured during gait (walking) per
subject, contingent on the subject’s level of comfort. Placement of markers adopted from Helen Hayes protocol at a sampling frequency of 500 Hz.
NAThe classification accuracy for SS, MS, and HC groups was 90.6%. The proposed model has capability to detect AIS in its early stages and can be utilized by
medical professionals to strategize
treatments and remedial measures.
Roy et al. [20]Data collected from the study conducted by the radiology department and
underwent analysis of CT images.
Sagittal
Coronal
Transverse
Patients with thoracic scoliosis have larger values for both LRAsm and ASR, which the degree of asymmetry was more
pronounced in thoracic than in the
lumbar region.
Lumbar scoliosis patients have smaller values for both LRAsm and ASR, which the asymmetry was less pronounced in
thoracic than in the lumbar region.
Circularity factor does not provide any
indications of scoliosis-related
asymmetries.
Hurtado-Aviles et al. [21]X-ray images collected from a digital
image repository.
CoronalUtilization of the software TraumaMeter (mean bias
error (MBE) = 1.8°, standard deviation (SD) = 0.65°)
depicts a lower intra-
observer measurement error compared to the
conventional manual Cobb angle (MBE = 2.31°, SD = 0.83°). The MBE values of the inter-group (expert and
novice) distributions differ significantly when using TraumaMeter or the manual method.
The use of the software leads to reduction in the difference in error between the
novice and expert observers in a
statistically significant way.
Glowka et al. [34]The study consists of four steps, which are: -
(1) 3D scoliosis angle calculation of computed tomography (CT).
(2) 3D scoliosis angle calculation of digitally reconstructed radiographs (DRRs).
(3) 3D scoliosis angle calculation comparison of CT versus DRRs.
(4) Reproducibility and reliability evaluation of the proposed method of X-rays (PA and lateral).
Posterior–anterior (PA) and lateralThe 3D angle measurements obtained with DRRs and CT (p > 0.05) were not
significantly different. However, a
significant difference was found between the 3D scoliosis angle and the Cobb angle measurements performed based on the X-rays. The 3D angle measurements had high
reproducibility and reliability values.

4. Discussion

The purpose of this systematic review study was to evaluate the technique or mechanism for diagnosing scoliosis by examining the characteristics and metrics that are frequently employed in imaging. Analyzing the advantages and disadvantages of parameters employed in each inquiry in depth is necessary to comprehend the assessment mechanism to find possible accurate diagnostic methods. Seventeen publications were considered in the current study for thorough review. Quality evaluation functioned as the primary methodological consideration to address the inconsistent methodological reporting by ensuring that the constraints of the examined research were considered. None of the articles that were assessed received a score below 70%, which was regarded as the acceptable average.
Participants’ characteristics, parameters/landmarks, assessment methods, modalities, software, and instruments utilized in the research outcomes may all be further examined in the evaluated articles. The data characteristics were varied, and there was a propensity to group data according to gender, quantity, and the details of the data (age, inclusion criteria, and exclusion criteria); thus, it limited the analysis for certain groups in this reviewed paper. The dataset suggested has a broader range of ages and is not limited to adolescents and a young age. This is because scoliosis can happen to all generations. From the details provided of the data used in the studies, most of the data confirmed have a scoliosis diagnosis from the clinicians. Thus, it is proposed to use data that do not have confirmation of scoliosis by the clinicians for variability. As we can see, researchers have established several useful methods for diagnosing scoliosis deformity. Choosing appropriate factors, such as the instrumentation, imaging modality, and parameter or landmark evaluation, is crucial to the success of the study.
In this review, most methods focus on two-dimensional or one-dimensional views, and just a few use three-dimensional views for their data. A recent study of scoliosis deformity assessment has an interest in the three-dimensional view because it gives a better and more specific view of the spine so that clinicians can grasp an accurate diagnosis of scoliosis. A three-dimensional view gives an image of the spine in three positions which are the frontal, sagittal, and transverse, which is far better compared to others because it can clearly show the abnormal angle rotation of the scoliosis that cannot be viewed in the frontal plane. The one-view plane, which is the frontal plane, is suitable for quick, early spinal deformities, but this cannot give specific and accurate information about the curve severity and the spine deformities angle. This is quite significant in decision-making by the clinicians for the follow-up treatment.
Next, various parameters or landmark evaluations in scoliosis detection were utilized in their studies. The Cobb angle is the most common metric in determining the level of scoliosis that categorizes a person as having mild, moderate, or severe scoliosis. It is also quite simple and easier for computation for all assessment approaches whether in image processing or artificial intelligence since it is just calculating angles from two points of abnormal spine curvature; however, this can be implemented in the frontal plane only. Next, the Scolioscan angle, DIPA, and 3D scoliosis angle are the improvement metrics adapted from the Cobb angle that significantly exerts evaluation in diagnosing because they are evaluated in a three-dimensional view and have the same diagnosis concept as the Cobb angle. Metrics that evaluate the curve severity of the spine by utilizing points or coordinates on the spine, such as the BAI and extreme points or 3D coordinates, exert specific diagnosis values in the curvature of the spine. Identifying the curvature severity of the spine can aid clinicians in planning treatment accurately rather than just categorizing patients into mild, moderate, and severe categories. Some papers used human anatomy for the evaluation parameters, such as the vertebrae in thoracic, spinal, and pelvic regions, and rasterstereographic measurements, which present the abnormality of the spine clearly, but these metrics are quite complex and tedious for diagnosis for study [20,23,24,25]. Since it is necessary to obtain and evaluate the specific characteristics of abnormal measurements and values that manifest on the spine, which are outlined in Table 3, the parameters outlined in study [24] must be assessed in each thoracic, spinal, and pelvis region, while study [25] examined 40 VRS features. Consequently, it is imperative to ensure utmost precision in order to capture comprehensive measurement particulars and mitigate the risk of misdiagnosis. However, GRF and EMG have proven to be effective metrics, but the ability of the metric to detect scoliosis in real-world scenarios is limited since the instrument used for analysis can only be used through experiments in the laboratory.
Apparently, three studies use the common imaging modality of X-ray, and two studies use MRI or CT scans to acquire spine images. MRI or CT scans set out higher quality images than X-ray, but still, radioactivity from CT scans should be considered since X-ray has low radioactivity, which is safer and cheaper. MRI is advantageous in terms of radiation exposure due to its utilization of a magnetic field during the scanning process, which proves to be safer when compared to plane radiographs and CT scans. However, it is most commonly employed for patients exhibiting presumed atypical characteristics of idiopathic scoliosis or those in the juvenile phase, where radiation is not a viable option for conducting scanning [5,36]. Both CT scans and MRI scans contribute to high precision in image quality and enhance medical diagnosis. Unfortunately, these scans are accompanied by a hefty price tag and are limited to patients with congenital and severe curvatures, and they are commonly utilized subsequent to the diagnosis of patients using X-ray scanning. Clinicians commonly use X-ray imaging for scoliosis detection, and it is particularly suitable for first-time diagnosis or detection of scoliosis in its early stages. Several studies [37,38] have proven that X-ray can be a good modality accompanied by advanced algorithm mechanisms in scoliosis diagnosis. Another 11 studies implemented new and atypical modalities in obtaining the spine image that need to consider the cost-effectiveness and image quality obtained when using the modalities. The image quality used is very important, as it can affect the outcome of diagnosis, and thus modalities that can yield high-quality images are the best; however, other factors, such as radioactivity and cost, need to be considered for the assessment. Therefore, the choices of imaging modality depend on the needs and requirements during the diagnosis.
From the assessment methods of scoliosis diagnosis in Table 3, researchers have come up with different diagnostic methods that have certain limitations. As we can see, it is found that some studies implemented back surface topography techniques in the diagnosis to obtain the measurements, as they can reduce the exposure of radioactivity to humans. Methods in this review that implement this concept are rasterstereography, photogrammetry, 3D reconstructions of the spine and rib cage, 3D structure analysis of the human torso, and a triangulation system that integrates back surface analysis and landmark localization. However according to study [39], the author said that back surface topography techniques need to be performed with great precision due to the uneven and variable nature of human back anatomy. The parameters use in these notions for scoliosis measurement require more elaboration and details of human geometry, as we can see in the studies [20,22,23,24,25,31,34], and this must be followed with an advanced mathematical algorithm or image processing for the analysis. This requires the utilization of advanced instruments or tools that are not familiar to medical practitioners and may not stimulate them to use the instruments due to the distinct and complicated procedures [40].
The most current research focuses on scoliosis diagnosis using artificial intelligence and particularly image processing approaches. Image processing involves many steps, including acquisition, enhancement, restoration, recognition, and segmentation, and the steps may engage in the process according to the desired needs, and it is the process of converting an image into a digital format and then executing various operations to extract relevant information. Studies that apply artificial intelligence (AI) [18,19,25,27,32,33] to diagnose scoliosis can improve the accuracy and efficiency of the diagnosis outcomes. AI in medicine can analyze complicated algorithms and self-learning that can work in a manner comparable to human brain, and it can have several subfields, such as machine learning (ML), deep learning (DL), and computer vision [41]. Three studies [25,27,32] in this review employed machine learning where it consisted of pattern recognition and analysis that can improve with experience from provided datasets. This can be supported with another study [7,42] in which a machine learning algorithm, such as a regression linear and support vector machine, has successfully detected scoliosis in the early stage. Study [18] diagnosed scoliosis using deep learning as an assessment mechanism, and the DL algorithms are Faster-RCNN and Resnet, which are commonly use in the medical field [43]. However, this study only classifies the scoliosis according curve severity grading and did not give specific measurements on the abnormality of the spine curve; thus, this is not quite suitable and does not help health professionals to plan treatment since they need specific data regarding the diagnosis. According to numerous studies [43,44,45,46,47], deep learning may be a strong technique with a high reputation in biomedical segmentation; however, there are several limitations in terms of execution and process resources in this vertebral segmentation study. Computer vision is a process through which a computer learns and comprehends information and understanding from a sequence of images or videos [41], and refs [21,22,29,30] employ this approach. This is the highest level of difficulty since it involves building an autonomous system that can detect, diagnose, and process the provided data and then analyze them accurately, which then portrays the analyzed information to the user. Thus, this gives much help to clinicians and can facilitate their efficiency in diagnosing scoliosis. These approaches have given ease to humans and can reduce human error, especially in precise medical diagnosis, yet the challenging journey to successfully utilized these in scoliosis assessment needs to be taken into consideration. It was revealed that diagnostic assessment studies involved with artificial intelligence had average to high accuracy performance, and regarding one case of low accuracy, we speculated that the specific DL algorithm was not suitable for the dataset images, while studies involving image processing presented that most of them had good to strong correlation when compared to the manual Cobb angle, which proves the validity of their methods, and two of these studies showed excellent reliability assessment. For studies on the computer-aided systems approach, the developed systems had lower error differences between using the system and the manual method, a strong correlation coefficient, and could classify scoliosis by its severity. Overall, in the context of evaluating scoliosis deformity that can be effectively implemented in a clinical setting, it is advisable to employ X-ray as the preferred imaging modality, specifically utilizing two-dimensional frontal and sagittal plane views to capture the spine images. This preference stems from the numerous advantages associated with X-ray, as well as its widespread use and accessibility among clinicians especially in early detection. However, it is crucial to strengthen this approach with a sturdy method that combines image processing and artificial intelligence. This combination approach is vital for addressing the limitations presented by the low resolution of X-ray images. Numerous studies compare their proposed scoliosis evaluation approach either to the method currently used by clinicians or existing approaches to demonstrate their method’s validity and achieve better performance of assessment. Since the new assessment methods are validated by the authors themselves and there is no validation from real-world scenarios, it is quite challenging to compare findings from the reviewed papers since different studies employed various explicit and implicit statistical techniques for the evaluation of their proposed method. A technique to diagnose scoliosis that combines artificial intelligence with image processing research may be suggested, and the lack of research on automatically determining the degree of spinal curvature can be considered for future study.
The main limitation of this article is its lack of standardization across the studies. Each study evaluated the diagnosis of scoliosis using different parameters for measuring scoliosis and different imaging modalities, which resulted in diverse results. Additionally, the literature primarily focuses on diagnostic methods that measure the abnormal curvature of the spine, with only a few addressing the entire human anatomy. This can introduce bias into the findings. Although we followed the PRISMA guidelines for systematic evaluation, our review still has some limitations that can be addressed in future studies. The search method used for this review was restricted to English language articles, and we only utilized three databases for article retrieval. As a result, some articles may have been overlooked. The criteria for identifying scoliosis deformity were limited to imaging, excluding data from other methods of evaluation. Methodologically, when conducting literature research for quality assessment, we relied on a previously published systematic review paper for guidance. However, the assessment questions in that paper were quite generic and may not be adequate for this specific field of diagnostics. Currently, there are standardized guidelines available for conducting systematic reviews that could have informed a more thorough quality appraisal. All of these limitations can be addressed and improved upon in future studies.

5. Conclusions

The present study highlights seventeen publications, which were published from 2012 to 2022, pertaining to the assessment of scoliosis deformity. This review specifically centers on the assessment aspect, alongside other variable factors, such as the imaging modality, plane view, research design or protocol, and parameters evaluated in the detection of scoliosis deformity. The data collected in this paper satisfied the fundamental assessment requirements that could impact the ability to predict outcomes.
A wide screening of studies that performed scoliosis diagnostics focusing on imaging approaches have been provided in order to identify more accurate and suitable methods to conduct assessment of spinal deformity. The practical application that might be related to the findings obtained from this study can be used in the healthcare area where healthcare professionals, especially doctors, assess spinal deformity. These findings can ease doctors to diagnose patients of spinal deformity, specifically scoliosis, accurately. Thus, they can make a good treatment plan according to every scoliosis case and lead to patient recovery from the deformity. First, we found that there are three possible approaches addressed in the assessment method of diagnosing scoliosis, which are image processing, artificial intelligence, and building a diagnosis system, and all were successful in diagnosing scoliosis. The studies suggested that the most common approach is the image processing assessment mechanism; however, other approaches are applicable to diagnose scoliosis. Next, all the analyzed studies implemented a variety of variables in the assessment methods according to their approaches. Since there is growing in the development of more advanced scoliosis assessments in this area, new potential assessment methods can be suggested to be implemented into real-practice scenarios. Consistent evaluation methods are needed because of the irregularity and inconsistency of the evaluations from the reviewed studies for comparison so that the superiority of the assessment methods can be demonstrated. To gain a more comprehensive insight into the scoliosis deformity assessment process, various elements linked to scoliosis evaluation could be further explored to enhance and augment knowledge in this area.

Author Contributions

Conceptualization, K.S.B. and A.R.S.; methodology, N.N.A. and K.S.B.; validation, S.N.B., M.F.I. and A.R.S.; investigation, H.Y., M.F.I. and S.N.B.; resources, N.N.A. and N.A.M.; writing—original draft preparation, N.N.A. and N.A.M.; writing—review and editing, K.S.B. and M.F.I.; supervision, K.S.B. and H.Y.; funding acquisition, M.F.I. All authors have read and agreed to the published version of the manuscript.

Funding

The authors extend their appreciation to the King Salman Center For Disability Research for funding this work through Research Group no. KSRG-2022-033.

Institutional Review Board Statement

Not applicable.

Informed Consent Statement

Not applicable.

Data Availability Statement

No new data were created or analyzed in this study. Data sharing is not applicable to this article.

Acknowledgments

The authors extend their appreciation to the King Salman Center For Disability Research for funding this work through Research Group no. KSRG-2022-033.

Conflicts of Interest

The authors declare no conflict of interest.

References

  1. Adam, C.; Dougherty, G. Applications of Medical Image Processing in the Diagnosis and Treatment of Spinal Deformity. In Medical Image Processing; Springer: New York, NY, USA, 2011; pp. 227–248. [Google Scholar] [CrossRef]
  2. Adolescent Idiopathic Scoliosis: Diagnosis and Management|AAFP. Available online: https://www.aafp.org/pubs/afp/issues/2014/0201/p193.html (accessed on 13 February 2023).
  3. Addai, D.; Zarkos, J.; Bowey, A.J. Current concepts in the diagnosis and management of adolescent idiopathic scoliosis. Child’s Nerv. Syst. 2020, 36, 1111–1119. [Google Scholar] [CrossRef] [PubMed]
  4. Kelly, J.J.; Shah, N.V.; Freetly, T.J.; Dekis, J.C.; Hariri, O.K.; Walker, S.E.; Borrelli, J.; Post, N.H.; Diebo, B.G.; Urban, W.P.; et al. Treatment of adolescent idiopathic scoliosis and evaluation of the adolescent patient. Curr. Orthop. Pr. 2018, 29, 424–429. [Google Scholar] [CrossRef]
  5. Karpiel, I.; Ziębiński, A.; Kluszczyński, M.; Feige, D. A survey of methods and technologies used for diagnosis of scoliosis. Sensors 2021, 21, 8410. [Google Scholar] [CrossRef]
  6. Samuvel, B.; Thomas, V.; Mini, M.G.; Kumar, J.R. A mask based segmentation algorithm for automatic measurement of cobb angle from scoliosis x-ray image. In Proceedings of the 2012 International Conference on Advances in Computing and Communications, Cochin, India, 9–11 August 2012; IEEE: Piscataway, NJ, USA, 2012; pp. 110–113. [Google Scholar] [CrossRef]
  7. Shrestha, P.; Singh, A.; Garg, R.; Sarraf, I.; Mahesh, T.R.; Madhuri, G.S. Early Stage Detection of Scoliosis Using Machine Learning Algorithms; Early Stage Detection of Scoliosis Using Machine Learning Algorithms. In Proceedings of the 2021 International Conference on Forensics, Analytics, Big Data, Security (FABS), Bengaluru, India, 21–22 December 2021; Volume 1. [Google Scholar] [CrossRef]
  8. Horng, M.-H.; Kuok, C.-P.; Fu, M.-J.; Lin, C.-J.; Sun, Y.-N. Cobb angle measurement of spine from X-ray images using convolutional neural network. Comput. Math. Methods Med. 2019, 2019, 1–18. [Google Scholar] [CrossRef] [PubMed]
  9. Ovadia, D. Classification of adolescent idiopathic scoliosis (AIS). J. Child. Orthop. 2013, 7, 25–28. [Google Scholar] [CrossRef]
  10. Scaramuzzo, L. Special Issue: “Spinal Deformity: Diagnosis, Complication and Treatment in Adolescent Patients”. J. Clin. Med. 2023, 12, 525. [Google Scholar] [CrossRef]
  11. Vyas, D.; Ganesan, A.; Meel, P. Computation and Prediction Of Cobb’s Angle Using Machine Learning Models. In Proceedings of the 2022 2nd International Conference on Intelligent Technologies (CONIT), Hubli, India, 24–26 June 2022; IEEE: Piscataway, NJ, USA, 2022. [Google Scholar] [CrossRef]
  12. Sun, Y.; Xing, Y.; Zhao, Z.; Meng, X.; Xu, G.; Hai, Y. Comparison of manual versus automated measurement of Cobb angle in idiopathic scoliosis based on a deep learning keypoint detection technology. Eur. Spine J. 2022, 31, 1969–1978. [Google Scholar] [CrossRef]
  13. Roy, S.; Grünwald, A.T.; Lampe, R. A non-invasive method for scoliosis assessment—A new mathematical concept using polar angle. PLoS ONE 2022, 17, e0275395. [Google Scholar] [CrossRef]
  14. Gaitero, A.S.R.; Shoykhet, A.; Spyrou, I.; Stoorvogel, M.; Vermeer, L.; Schlösser, T.P.C. Imaging Methods to Quantify the Chest and Trunk Deformation in Adolescent Idiopathic Scoliosis: A Literature Review. Healthcare 2023, 11, 1489. [Google Scholar] [CrossRef]
  15. Moher, D.; Liberati, A.; Tetzlaff, J.; Altman, D.G. Preferred Reporting Items for Systematic Reviews and Meta-Analyses: The PRISMA Statement. J. Clin. Epidemiol. 2009, 62, 1006–1012. [Google Scholar] [CrossRef]
  16. Gunasekaran, K.; Basaruddin, K.S.; Muhayudin, N.A.; Sulaiman, A.R. Corrective Mechanism Aftermath Surgical Treatment of Spine Deformity due to Scoliosis: A Systematic Review of Finite Element Studies. BioMed Res. Int. 2022, 1–14. [Google Scholar] [CrossRef] [PubMed]
  17. Ku, P.X.; Abu Osman, N.A.; Wan Abas, W.A.B. Balance control in lower extremity amputees during quiet standing: A systematic review. Gait Posture 2014, 39, 672–682. [Google Scholar] [CrossRef]
  18. Yang, J.; Zhang, K.; Fan, H.; Huang, Z.; Xiang, Y.; Yang, J.; He, L.; Zhang, L.; Yang, Y.; Li, R.; et al. Development and validation of deep learning algorithms for scoliosis screening using back images. Commun. Biol. 2019, 2, 1–8. [Google Scholar] [CrossRef] [PubMed]
  19. Liu, T.; Wang, Y.; Yang, Y.; Sun, M.; Fan, W.; Bunger, C.; Wu, C. A multi-scale keypoint estimation network with self-supervision for spinal curvature assessment of idiopathic scoliosis from the imperfect dataset. Artif. Intell. Med. 2022, 125, 102235. [Google Scholar] [CrossRef]
  20. Roy, S.; Grünwald, A.T.; Alves-Pinto, A.; Lampe, R. Automatic analysis method of 3D images in patients with scoliosis by quantifying asymmetry in transverse contours. Biocybern. Biomed. Eng. 2020, 40, 1486–1498. [Google Scholar] [CrossRef]
  21. Hurtado-Avilés, J.; Santonja-Medina, F.; León-Muñoz, V.J.; de Baranda, P.S.; Collazo-Diéguez, M.; Cabañero-Castillo, M.; Ponce-Garrido, A.B.; Fuentes-Santos, V.E.; Santonja-Renedo, F.; González-Ballester, M.; et al. Validity and Absolute Reliability of the Cobb Angle in Idiopathic Scoliosis with TraumaMeter Software. Int. J. Environ. Res. Public Health 2022, 19, 4655. [Google Scholar] [CrossRef] [PubMed]
  22. Grünwald, A.T.; Roy, S.; Lampe, R. Scoliosis assessment tools to reduce follow-up X-rays. J. Orthop. Transl. 2023, 38, 12–22. [Google Scholar] [CrossRef]
  23. Čelan, D.; Papež, B.J.; Poredoš, P.; Možina, J. Laser triangulation measurements of scoliotic spine curvatures. Scoliosis 2015, 10, 1–6. [Google Scholar] [CrossRef]
  24. Dubousset, J.; Ilharreborde, B.; Le Huec, J.-C. Use of EOS imaging for the assessment of scoliosis deformities: Application to postoperative 3D quantitative analysis of the trunk. Eur. Spine J. 2014, 23, 397–405. [Google Scholar] [CrossRef]
  25. Colombo, T.; Mangone, M.; Agostini, F.; Bernetti, A.; Paoloni, M.; Santilli, V.; Palagi, L. Supervised and unsupervised learning to classify scoliosis and healthy subjects based on non-invasive rasterstereography analysis. PLoS ONE 2021, 16, e0261511. [Google Scholar] [CrossRef]
  26. Yıldırım, Y.; Tombak, K.; Karaşin, S.; Yüksel, I.; Nur, A.H.; Ozsoy, U. Assessment of the reliability of hand-held surface scanner in the evaluation of adolescent idiopathic scoliosis. Eur. Spine J. 2021, 30, 1872–1880. [Google Scholar] [CrossRef]
  27. Rothstock, S.; Weiss, H.-R.; Krueger, D.; Paul, L. Clinical classification of scoliosis patients using machine learning and markerless 3D surface trunk data. Med. Biol. Eng. Comput. 2020, 58, 2953–2962. [Google Scholar] [CrossRef]
  28. Wang, Q.; Li, M.; Lou, E.H.M.; Wong, M.S. Reliability and validity study of clinical ultrasound imaging on lateral curvature of adolescent idiopathic scoliosis. PLoS ONE 2015, 10, e0135264. [Google Scholar] [CrossRef] [PubMed]
  29. Zheng, Y.-P.; Lee, T.T.-Y.; Lai, K.K.-L.; Yip, B.H.-K.; Zhou, G.-Q.; Jiang, W.-W.; Cheung, J.C.-W.; Wong, M.-S.; Ng, B.K.-W.; Cheng, J.C.-Y.; et al. A reliability and validity study for Scolioscan: A radiation-free scoliosis assessment system using 3D ultrasound imaging. Scoliosis 2016, 11, 1–15. [Google Scholar] [CrossRef] [PubMed]
  30. Luković, V.; Ćuković, S.; Milošević, D.; Devedžić, G. An ontology-based module of the information system ScolioMedIS for 3D digital diagnosis of adolescent scoliosis. Comput. Methods Programs Biomed. 2019, 178, 247–263. [Google Scholar] [CrossRef]
  31. Navarro, I.J.R.L.; Candotti, C.T.; Furlanetto, T.S.; Dutra, V.H.; Amaral, M.A.D.; Loss, J.F. Validation of a Mathematical Procedure for the Cobb Angle Assessment Based on Photogrammetry. J. Chiropr. Med. 2019, 18, 270–277. [Google Scholar] [CrossRef]
  32. Sikidar, A.; Vidyasagar, K.E.C.; Gupta, M.; Garg, B.; Kalyanasundaram, D. Classification of mild and severe adolescent idiopathic scoliosis (AIS) from healthy subjects via a supervised learning model based on electromyogram and ground reaction force data during gait. Biocybern. Biomed. Eng. 2022, 42, 870–887. [Google Scholar] [CrossRef]
  33. Yang, D.; Lee, T.T.Y.; Lai, K.K.L.; Lam, T.P.; Castelein, R.M.; Cheng, J.C.Y.; Zheng, Y.P. Semi-automatic method for pre-surgery scoliosis classification on X-ray images using Bending Asymmetry Index. Int. J. Comput. Assist. Radiol. Surg. 2022, 17, 2239–2251. [Google Scholar] [CrossRef]
  34. Główka, P.; Politarczyk, W.; Janusz, P. The method for measurement of the three-dimensional scoliosis angle from standard radiographs. BMC Musculoskelet. Disord. 2020, 21, 475-1–475-7. [Google Scholar] [CrossRef] [PubMed]
  35. Wong, Y.-S.; Lai, K.K.-L.; Zheng, Y.-P.; Wong, L.L.-N.; Ng, B.K.-W.; Hung, A.L.-H.; Yip, B.H.-K.; Chu, W.C.-W.; Ng, A.W.-H.; Qiu, Y.; et al. Is Radiation-Free Ultrasound Accurate for Quantitative Assessment of Spinal Deformity in Idiopathic Scoliosis (IS): A Detailed Analysis With EOS Radiography on 952 Patients. Ultrasound Med. Biol. 2019, 45, 2866–2877. [Google Scholar] [CrossRef] [PubMed]
  36. Cassar-Pullicino, V.; Eisenstein, S. Imaging in Scoliosis: What, Why and How? Clin. Radiol. 2002, 57, 543–562. [Google Scholar] [CrossRef] [PubMed]
  37. Saylor, A. Artificial Neural Network for the Estimation of Clinical Parameters from X-rays of Scoliotic Spines. Master’s Thesis, Widener University, Chester, PA, USA, 2020. [Google Scholar]
  38. Vertebra Segmentation for Spinal Deformity Assessment from X-ray Images—ProQuest. Available online: https://www.proquest.com/docview/2570358625/F320EB77D7BE4628PQ/1?accountid=33397 (accessed on 13 February 2023).
  39. Drerup, B. Rasterstereographic measurement of scoliotic deformity. Scoliosis 2014, 9, 1–14. [Google Scholar] [CrossRef]
  40. Navarro, I.J.R.L.; da Rosa, B.N.; Candotti, C.T. Anatomical reference marks, evaluation parameters and reproducibility of surface topography for evaluating the adolescent idiopathic scoliosis: A systematic review with meta-analysis. Gait Posture 2019, 69, 112–120. [Google Scholar] [CrossRef] [PubMed]
  41. Kaul, V.; Enslin, S.; Gross, S.A. History of artificial intelligence in medicine. Gastrointest. Endosc. 2020, 92, 807–812. [Google Scholar] [CrossRef]
  42. Chen, K.; Zhai, X.; Sun, K.; Wang, H.; Yang, C.; Li, M. A narrative review of machine learning as promising revolution in clinical practice of scoliosis. Ann. Transl. Med. 2021, 9, 67. [Google Scholar] [CrossRef] [PubMed]
  43. Patel, S. Deep learning models for image segmentation. In Proceedings of the 2021 8th International Conference on Computing for Sustainable Global Development (INDIACom), New Delhi, India, 17–19 March 2021; pp. 149–154. [Google Scholar]
  44. Ronneberger, O.; Fischer, P.; Brox, T. U-net: Convolutional networks for biomedical image segmentation. In Medical Image Computing and Computer-Assisted Intervention—MICCAI 2015; Lecture Notes in Computer Science (Including Subseries Lecture Notes in Artificial Intelligence and Lecture Notes in Bioinformatics); Springer: Cham, Switzerland, 2015; Volume 9351, pp. 234–241. [Google Scholar] [CrossRef]
  45. Zhang, Q.; Du, Y.; Wei, Z.; Liu, H.; Yang, X.; Zhao, D. Spine Medical Image Segmentation Based on Deep Learning. J. Health Eng. 2021, 2021, 1–6. [Google Scholar] [CrossRef]
  46. Cheng, P.; Yang, Y.; Yu, H.; He, Y. Automatic vertebrae localization and segmentation in CT with a two-stage Dense-U-Net. Sci. Rep. 2021, 11, 1–13. [Google Scholar] [CrossRef]
  47. Weng, W.; Zhu, X. INet: Convolutional Networks for Biomedical Image Segmentation. IEEE Access 2021, 9, 16591–16603. [Google Scholar] [CrossRef]
Figure 1. PRISMA flowchart of study selection procedure from reviewed articles.
Applsci 13 11555 g001
Disclaimer/Publisher’s Note: The statements, opinions and data contained in all publications are solely those of the individual author(s) and contributor(s) and not of MDPI and/or the editor(s). MDPI and/or the editor(s) disclaim responsibility for any injury to people or property resulting from any ideas, methods, instructions or products referred to in the content.

