Article

Effects of Micro-Scale Environmental Factors on the Quantity of Questing Black-Legged Ticks in Suburban New York

1
Department of Civil and Environmental Engineering, Rutgers University, Piscataway, NJ 08854, USA
2
Department of Biological Sciences, Hunter College, The City University of New York, New York, NY 10065, USA
3
Graduate Center, The City University of New York, New York, NY 10016, USA
4
Department of Physiology and Biophysics & Institute for Computational Biomedicine, Weil Cornell Medical College, New York, NY 10021, USA
5
Department of Geography and Environmental Science, Hunter College, The City University of New York, New York, NY 10065, USA
*
Author to whom correspondence should be addressed.
Appl. Sci. 2023, 13(20), 11587; https://doi.org/10.3390/app132011587
Submission received: 5 September 2023 / Revised: 19 October 2023 / Accepted: 19 October 2023 / Published: 23 October 2023
(This article belongs to the Section Ecology Science and Engineering)

Abstract

:
The questing behaviors of blacklegged ticks (Ixodes scapularis) are largely regulated by environmental factors such as temperature, humidity, and vegetation. While this relationship is relatively clear at the macro- and meso-spatial scales, it is inadequately examined at the micro scale. Our field work in the New York City suburbs during 2017–2018 revealed significant local variations in the quantity of questing blacklegged ticks. The purpose of this study is to identify and test the environmental factors that impact the number of questing blacklegged ticks at the micro-spatial scale. In addition to the number of ticks, surface temperature, and relative humidity data collected in the field, geospatial technologies were leveraged to extract micro-scale spatial and environmental measures, including vegetation index, land cover, elevation, and ecotone, from high-resolution digital imagery and LiDAR data. Regression models were then built to identify the key factors that influence the spatiotemporal patterns of questing blacklegged ticks. The results largely align with the existing research but display characteristics of complexity such as multicollinearity, nonlinearity, and thresholds in relation to temperature, humidity, and vegetation composition at the micro scale, whereas mixed hardwood and dwarf shrubs tend to have higher numbers of questing ticks.

1. Introduction

The tick-borne Lyme disease has become the most common vector-borne disease in the USA. During each year of the last decade, an average of more than 200,000 Lyme disease cases were reported according to the statistics in recent years [1]. The annual cost for tick-borne disease testing alone is estimated to be approximately 500 million USD [2]. The Northeastern US has been a hotspot for Lyme disease, especially Connecticut and New York in the past and Pennsylvania and Maryland in recent years [3]. The agent causing Lyme disease is Borrelia burgdorferi sensu stricto (hereafter, B. burgdorferi), a spirochete bacterium, and occasionally, Borrelia mayonii. The primary vector of these bacteria is Ixodes scapularis (hereafter, I. scapularis), commonly known as the blacklegged tick or deer tick in the USA. B. burgdorferi can be transferred to a human when an infected blacklegged tick feeds on blood meals from the person [4,5].
I. scapularis or the blacklegged tick is a member of the Ixodidae family of hard-bodied ticks, consisting of over 700 species globally [6]. The blacklegged tick is native to eastern, northeastern, and central–north US [7,8,9,10,11]. During a two-year life cycle, it consumes three blood meals, and its questing activity—that is, seeking a vertebrate host to feed itself—varies with its developmental stages [12]. First, after hatching in the early summer, larval black-legged ticks seek and feed on small mammals such as white-footed mice and chipmunks for approximately four days and then molt to nymph. These mammals are natural reservoirs for B. burgdorferi, and the tick may become infected when it feeds on them. Second, nymphal ticks overwinter on the ground and quest again in the late spring and early summer of the next year. Normally, they stay poised on the surface of grass or shrub before they attach to passing hosts that brush against the surface. These nymphs then feed on such small hosts for 4–6 days and mature to adults in 4–5 weeks. The infected ticks could pass B. burgdorferi to those hosts. Afterward, adult ticks target large mammals such as white-tailed deer and dogs, and the engorged female ticks lay eggs after mating before the winter [13,14]. Note that in some high latitude areas such as southeastern Canada where the spring and summer are relatively short, black-legged ticks may have prolonged life spans if they fail to feed or molt before winter [15,16].
Although vertebrate hosts play a critical role in their lifecycles, ticks such as black-legged ticks in the US and Ixodes ricinus (the sheep ticks) in Europe spend more than 90% of their lifetime off the host [17,18,19]. Being cold-blooded, ticks are highly susceptible to environmental stressors, owing to their conservative physiology. The direct linkage between the environment and ticks, as well as the indirect linkage via hosts, is crucial for understanding the complexity of the tick ecology and for modeling the abundance, mortality, and host-seeking activity of the local tick population [20]. The existing studies on tick ecology are mostly in controlled or semi-controlled lab settings or in the natural environments at macro scales, with some notable exceptions [21]. Researchers have examined how ticks respond to temperature and humidity within controlled environments [22,23,24,25]. Additionally, the influence of land cover and vegetation types on ticks was also studied in semi-controlled or natural settings. In uncontrolled natural environments, most of the published studies focus on the relationship between environmental factors and tick population at macro geographic scales [26,27,28].
More specifically, ambient temperature is found nonlinearly and positively related to the rates of development and host-seeking activity of blacklegged ticks when it is between the upper (~30 °C) and lower (~0 °C) thresholds for tick survival [22,24,25]. Temperatures higher than 30 °C tend to increase the mortality rate of blacklegged ticks and to reduce their host-seeking activities [6,17,29,30]. In addition, blacklegged ticks depend on a moist atmosphere to slow the water loss from transpiration [16,20,31]. A low relative humidity (RH) exerts overwhelming stress on blacklegged ticks [32]. When such stress is present during a questing period, a blacklegged tick responds by descending from the grass or shrub to moister surroundings near the ground for water absorption, which consequently reduces the total duration of host seeking [20].
In addition to suitable temperature and humidity, vegetated habitats are particularly important for the survival and questing activity of blacklegged ticks [33]. Vegetation conditions the microclimate, mitigates the effects of environmental extremes, and provides forage for tick hosts [34,35]. Woodlands and forests are especially effective in maintaining humidity and reducing microclimatic stresses [23,36]. In addition, the numbers of blacklegged ticks may fluctuate because of the varying abundance and diversity of their hosts across a vegetated landscape [34]. For instance, more adult blacklegged ticks are expected along forest edges or in the areas with smaller forest patch sizes since white-tailed deer, their primary hosts, are more prevalent in these areas [37,38,39,40]. Furthermore, as ticks feed on hosts of varying body sizes in different life stages, spatially heterogeneous landscapes are more likely to sustain these hosts and, therefore, benefit ticks across life stages and support the transmitting cycles of tick-borne pathogens [41].
The macro-scale tick ecology studies commonly applied regression models with yearly or monthly climatic data and achieved high fitness in projecting tick abundance [26,42]. Although these studies have found robust correlations between environmental variables and tick abundance at macro scales, it is unclear if they still hold at local scales with substantial spatiotemporal variations. Additionally, it is useful to differentiate tick abundance from tick questing activities [43]. Tick abundance is the demographic aspect of tick population and is mainly determined by the macro-scale environment in a longer term, while the questing activity is the behavioral aspect and is also regulated by the local, short-term environmental factors that may not influence tick abundance [43,44]. For example, ticks’ questing activities, given the same abundance, are much lower in hot and dry days than in warm and humid days because they would descend near the ground, under the debris for shade and moisture; therefore, they are less likely to quest for hosts. In this study, we focus on the quantity of actively questing blacklegged ticks, which integrates both tick abundance and questing behaviors.
From the perspective of public health, the quantity and density of questing black-legged ticks, instead of the tick abundance, indicate the Lyme disease risk. The objective of this study is to investigate the relationship between environmental factors and the quantity of questing blacklegged ticks at the micro-scale in four state parks around New York City. During our field surveys, it was quite common to observe significant variations in the numbers of questing ticks with similar macro-scale humidity and temperature. For example, the numbers of questing ticks varied from zero to over seventy while there was little change in the measured temperature and humidity in two sampling sites. Therefore, we hypothesize that the spatial patterns of questing tick quantities are driven by specific local environmental factors at micro-scales. Through analyzing the relationship between the numbers of questing blacklegged ticks and local environmental conditions, our analysis and modeling results could help environmental management agencies to effectively develop eco-friendly vector controlling methods and to reduce potential human–tick encounters in the suburban areas of New York City.

2. Materials and Methods

To examine the relationship between the quantity of questing ticks and environmental factors at the micro scale in suburban New York, we combined a field survey and the environmental data obtained through geospatial technologies. Statistical analyses, particularly generalized linear regression models and generalized additive models, were applied to discover their linear and nonlinear relationships and to test their significances.
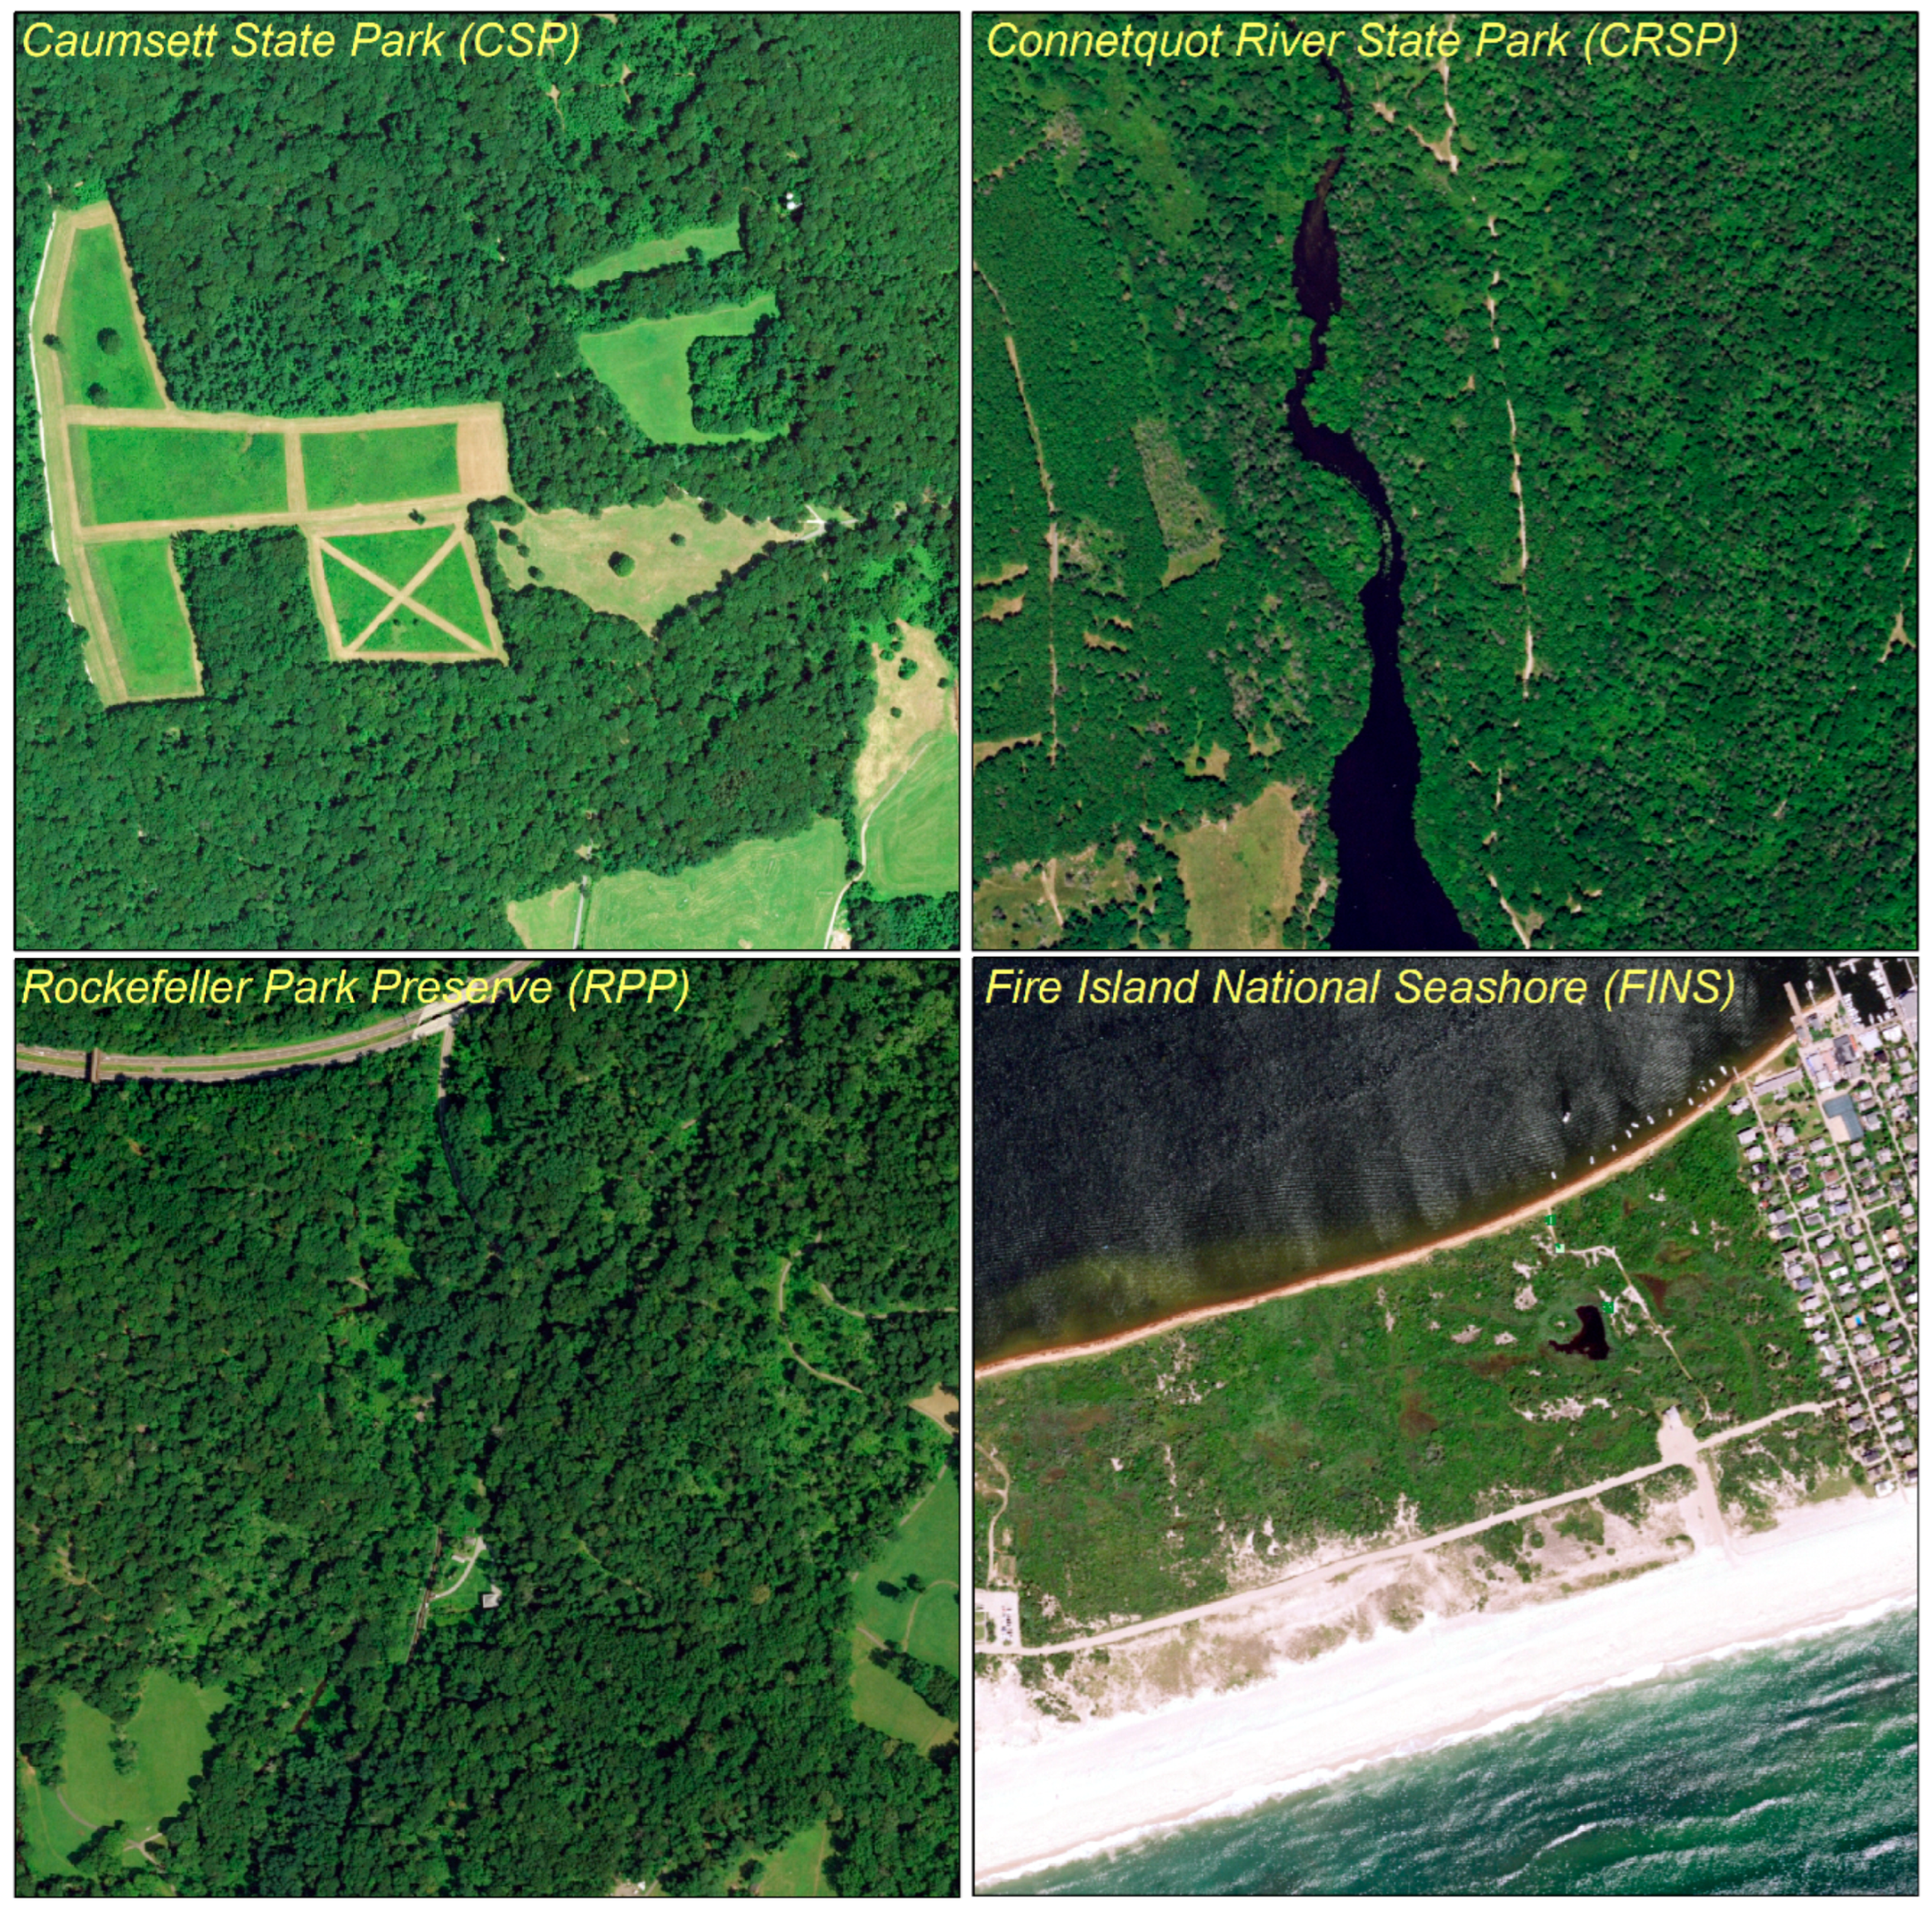
First, our study areas focus on the suburban area around New York City, where the presence of black-legged ticks is well-documented [44,45,46]. Four state parks in Westchester and Long Island—Caumsett State Park (CSP), Connetquot River State Park (CRSP), Rockefeller Park Preserve (RPP), and Fire Island National Seashore (FINS)—were chosen for their representativeness of the typical suburban environment (Figure 1). These four parks have distinctive local landscapes and wildlife, which are related to the diversity and abundance of black-legged ticks and their host species (Table 1). Of particular importance for this study is the vegetation coverage and composition, the diversity of land-cover types, and the structure or fragmentation of the woodlands (Figure 2).
Second, we conducted field surveys in these four parks to sample questing blacklegged ticks and to measure local environmental factors. During nine days from 2017 spring to 2018 spring, we collected blacklegged ticks from 124 sampling sites in those four parks. The locations of the sampling sites were randomly selected with minimal overlapping from the off-trail vegetated areas that were physically safe to access. To allow a micro-scale study, these sites were restricted to 5 m by 5 m. Within each quadrat, the sampling task was carried out by two team members sweeping flags, and the duration was restricted to 10 min, which indicated the actual sweeping time. A 10-min timer was initiated once the team members started sweeping, and it was paused when they stopped to check and collect attached ticks on the flags. This was because collecting ticks is time-consuming and sometimes can take even longer than sweeping, especially in a tick hotspot. The geographic coordinates and boundaries of these sites were recorded using a handheld Garmin GPSMAP 64x. Each tick sampling session lasted approximately 4 h, from 10:00 to 14:00 on the scheduled dates. Each sampling day was at least two days after the last rain because precipitation could hinder black-legged ticks’ questing activities and the wet ground could soak the flags used to collect ticks [47].
To collect black-legged ticks, each team member swept a cloth flag (~0.75 m × 1 m) attached to a pole (1 m) over the ground, foliage, shrubs, and fallen trees within the boundary of a sampling site. Since black-legged ticks may not be the only tick species encountered (e.g., Amblyomma americanum, the lone star ticks, were frequently observed during field works), the ticks attached to the flag were first identified, and only black-legged ticks were collected and counted. Although widely employed, such a “cloth-lure” technique is known to have several limitations such as being ineffective on non-questing ticks, restricted by densely wooded areas, time consuming, and labor intensive [48,49]. The accuracy of estimating the abundance of black-legged ticks, therefore, may vary with respect to the thoroughness of tick sampling in a study area [50]. The flagging sampling method, however, can systematically reflect the quantity of actively questing ticks [43,44,51,52]. As we applied the same protocol to the flagging sampling method across the four parks, our data are consistent across these sites over time. The systematic errors caused by the flagging method would be unlikely to cause significant bias in our analysis and modeling because the ratios of counted questing black-legged ticks to actual questing ticks were roughly equal for all samples.
To model the numbers of questing ticks against environmental factors, a group of variables, including temperature, humidity, vegetation cover, elevation, solar radiation, and landscape fragmentation, were identified based on the literature, prior to our fieldwork. Temperature is a well-known factor in tick ecology. Although precipitation is often used as a variable to represent moisture, studies indicate that relative humidity performs better in depicting the microclimate of tick habitats, especially in micro-scale studies [42]. Within each sampling site, both temperature and relative humidity were measured at three random spots with an “Extech 45158 Anemometer & Humidity Meter”, held approximately 40 cm above the ground to match the average questing heights of blacklegged ticks. These values were averaged for the site.
In addition to the temperature and relative humidity measured during fieldwork, we obtained LiDAR and NAIP (National Agriculture Imagery Program) images of 1 m resolution from the Discover GIS Data NY and USGS Earth Explorer websites (Figure 2). Applying geospatial methods, we derived other environmental variables, including elevation, solar radiation, normalized difference vegetation index (NDVI), and ecotone length. All these variables were confined and/or averaged within the bound of each sampling site.
Specifically, we used the LiDAR data to derive elevation and solar radiation. Prior research suggests that elevation is correlated with tick activity and abundance [42,53]. Solar radiation is the amount of solar energy received at the ground level and is largely determined by seasonality, vegetation, and terrain factors such as slope and aspect. Solar radiation directly impacts temperature, humidity, vegetation, and therefore, the questing activities of black-legged ticks. Using geoprocessing tools in ArcGIS, both the elevation and solar radiation were calculated from the LiDAR data, the coordinates of the sampling sites, and the dates when the sampling was conducted.
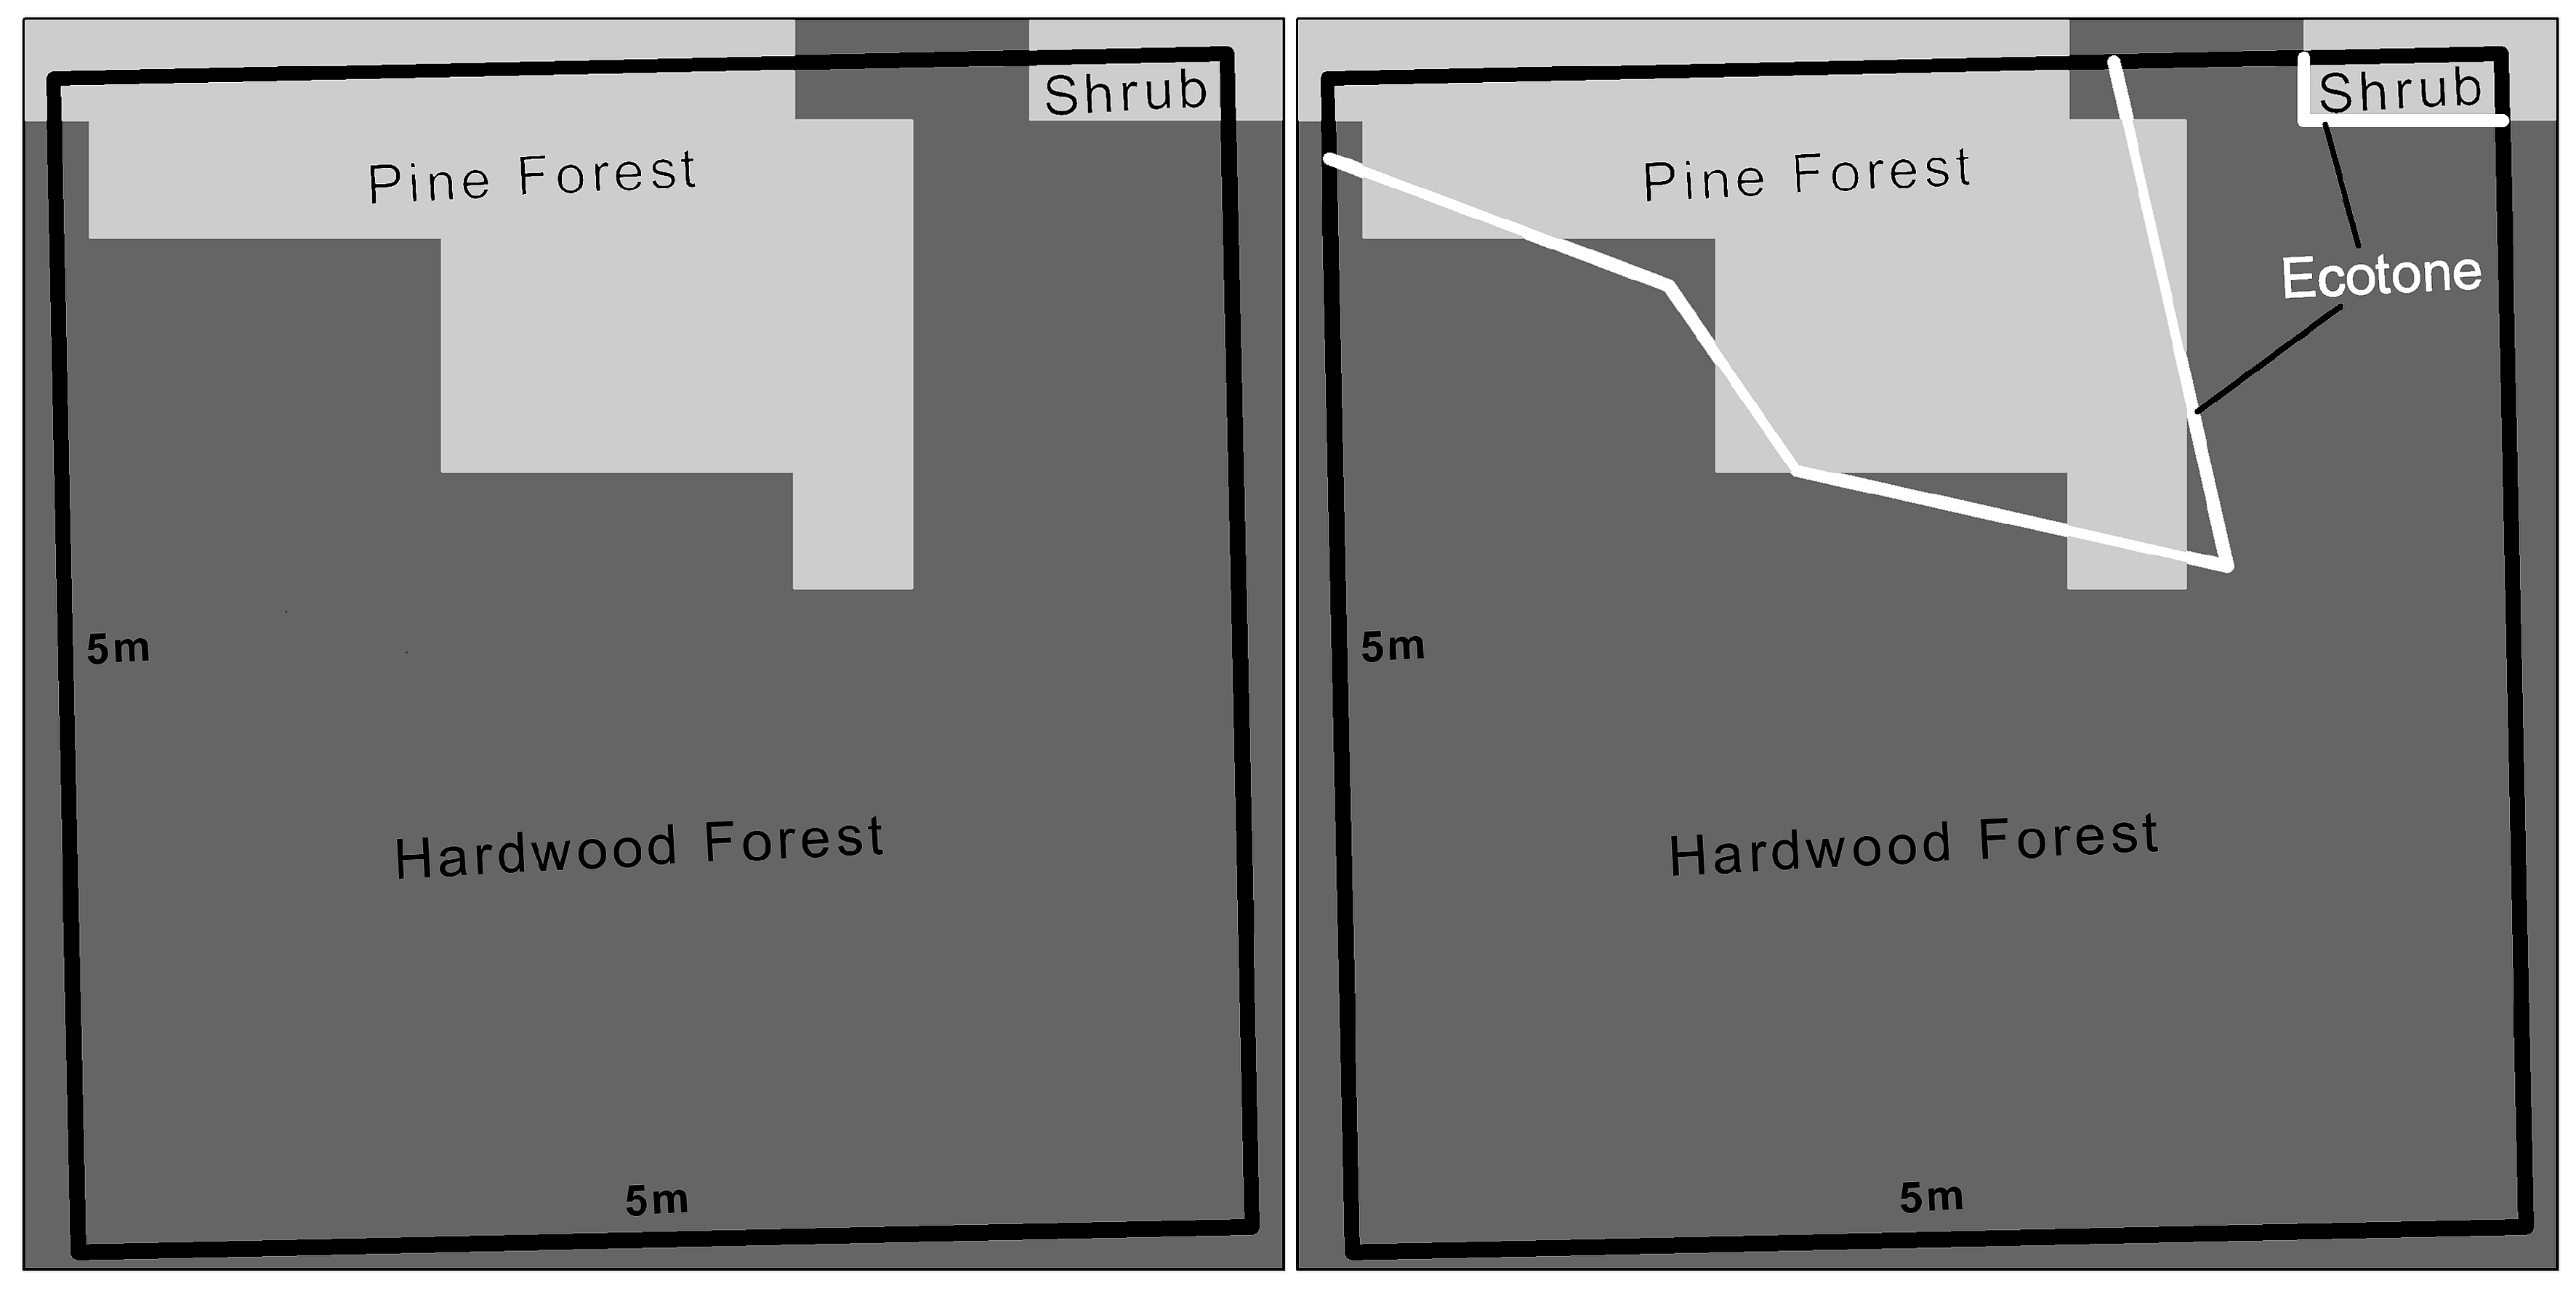
With the NAIP aerial imagery, we applied supervised maximum likelihood image classification to derive land cover and vegetation types and calculated NDVI, as well as ecotone boundary length. NDVI primarily measures the greenness and the density of vegetation and is a well-known predictor for tick abundance [54,55]. Ecotone is the transitional area at the boundary between two different plant communities. Therefore, we extracted the total length of ecotone boundaries in each sampling site to represent the degree of diversity and fragmentation of vegetation. This essentially measures the length of the edges between different vegetation land cover types (Figure 3). To carry this out, we converted the classified vegetation images to vector polygons to avoid overestimation. Within each 5 m by 5 m sampling site, the total length of the edges between polygons of different vegetation types was then calculated.
With data in hand, we applied descriptive analysis and regression to investigate the variation in the numbers of questing ticks against environmental variables. Since tick expeditions were scheduled across different state parks and seasons, they could have significant spatiotemporal variations, for which we illustrated the trends in both linear and nonlinear fashions.
To formally establish the quantitative relationships between the number of questing ticks and micro-scale environmental factors, we built multiple generalized linear regression models based on the negative binomial distribution. Negative binomial regression is particularly applicable to over-dispersed count data, which is the case for the questing ticks in our study [56]. Unlike Poisson distribution ( v a r Y = μ ), the variance of a variable following a negative binomial distribution is greater than its mean and controlled by an extra parameter ( v a r Y = μ + μ 2 / k ). We also used the corrected Akaike information criterion (AICc) to calibrate and choose a model with the highest fitness [57,58,59].
More specifically, we constructed four negative binomial regression models to test the explanatory power of the environmental variables on the quantity of questing black-legged ticks. We started from a “full” model containing all variables. Using the corrected Akaike information criteria (AICc) as guidance, we also developed a “calibrated” model that had the lowest AICc and, therefore, the best fitness. This was carried out by dropping the insignificant variables and variables that were highly correlated. For example, NDVI was correlated with specific land-cover types such as mixed hardwoods and dwarf shrubs. To allow comparison with the existing studies, we also created an “alternative” model, which did not fit the data so well as the “calibrated” model but retained theoretically relevant variables such as season, NDVI, and the length of ecotone boundaries. Finally, we compared these models, using AICc and pseudo-R2, against a “null” model that contains a constant term only. The null model provides a baseline scenario where the relationships between explanatory variables and response variables are random.
Furthermore, we applied generalized additive models (GAM) to examine which factors have nonlinear interactions with the number of questing ticks [60,61]. While the negative binomial models are effective at testing the impacts of environmental predictors on the numbers of questing blacklegged ticks, they assume linearity. However, the general pattern visualizations showed signs of nonlinearity. Therefore, we applied GAM, with the same negative binomial distribution and log link function, to explore this nonlinearity. GAM is a type of non-linear regression technique, which is essentially a penalized GLM with a smoothing basis and especially useful for “wiggly” data that are common in environmental and ecological applications. GAM commonly applies high-order polynomial smoothing functions to predictors to smooth and fit complex patterns.
Together, these methods offer a comprehensive depiction of the complex relationships between the quantity of questing blacklegged ticks and the micro-scale environmental factors at those four parks. They are particularly valuable at exploring multicollinearity, nonlinearity, and thresholds from different perspectives.

3. Results

3.1. General Pattern and Correlation

We collected 897 blacklegged ticks in nine field trips to the four parks around New York City, of which 88.3% (792) were adults and 11.7% (105) were nymphs. The field data show little temporal overlap between adult and nymphal ticks (Table 2). In seven out of the nine days of sampling, we collected adult ticks without finding any nymphs. On 7 June 2018, we collected 101 nymphs and 10 adult ticks. Moreover, one week later, on 14 June 2018, only four nymphal blacklegged ticks were collected. Temporally, the questing of adult blacklegged ticks was active in May and November, i.e., the late spring and late fall; nymphs were active in June, the early summer. It must be pointed out that this only applies to blacklegged ticks. We did observe a fair number of questing nymphs of lone star ticks during the field trip on 24 May 2018.
To visually inspect the data, we plotted the distribution of questing blacklegged ticks across the four parks over time (Figure 4). Obviously, there were significant spatiotemporal variations. For example, 113 adult blacklegged ticks were collected across 16 sites (mean per site is 7.06) on 27 October 2017 in CSP, and 209 were collected across 30 sites (mean is 6.74) on 1 November 2017 in CRSP. However, only 88 were collected from over 35 sites (mean is 2.44) on 15 November 2017, two weeks later, in RPP. At FINS, which has a very different landscape, only four nymphal blacklegged ticks were collected without any adult ticks. With the dates and parks being tangled together, it is difficult to identify clear patterns, even though preliminary visualization suggested the possible correlation between temperature and average number of questing ticks per site.
A simple t-test suggests that the season makes a difference, as the average number of questing blacklegged ticks is significantly higher in the spring than in the fall (t = −4.253, p < 0.001). However, this pattern is skewed by the specific data point of 15 November 2017 in RPP. The average air temperature on that day was approximately −1 °C. Although 88 adult ticks were collected across 35 sites (mean = 2.44, standard deviation = 1.91) on that day, the number is much lower than expected as the temperature was below the lower threshold (4 °C) of tick questing activity. When excluding tick survey data from 15 November the average number of questing ticks during the fall is actually higher than the spring. However, the difference is not statistically significant (t = 0.684, p = 0.496).
The tick surveys in RPP and FINS revealed significant inconsistencies in the counts of questing black-legged ticks from those in CSP and CRSP. The distributions of tick counts from the sampling areas within CSP and CRSP show slight differences in both mean (triangles) and median (orange lines), and a t-test revealed these differences were not significant (t = −0.586, p = 0.562). However, the areas classified as hotspots—sites with tick counts ≥ 20—in CRSP generally had higher tick observations than the hotspots in CSP. For example, the maximum questing ticks collected from a single site in CRSP was 70, followed by a site where 46 ticks were collected. The maximum number of ticks collected from a single site in CSP was 31.
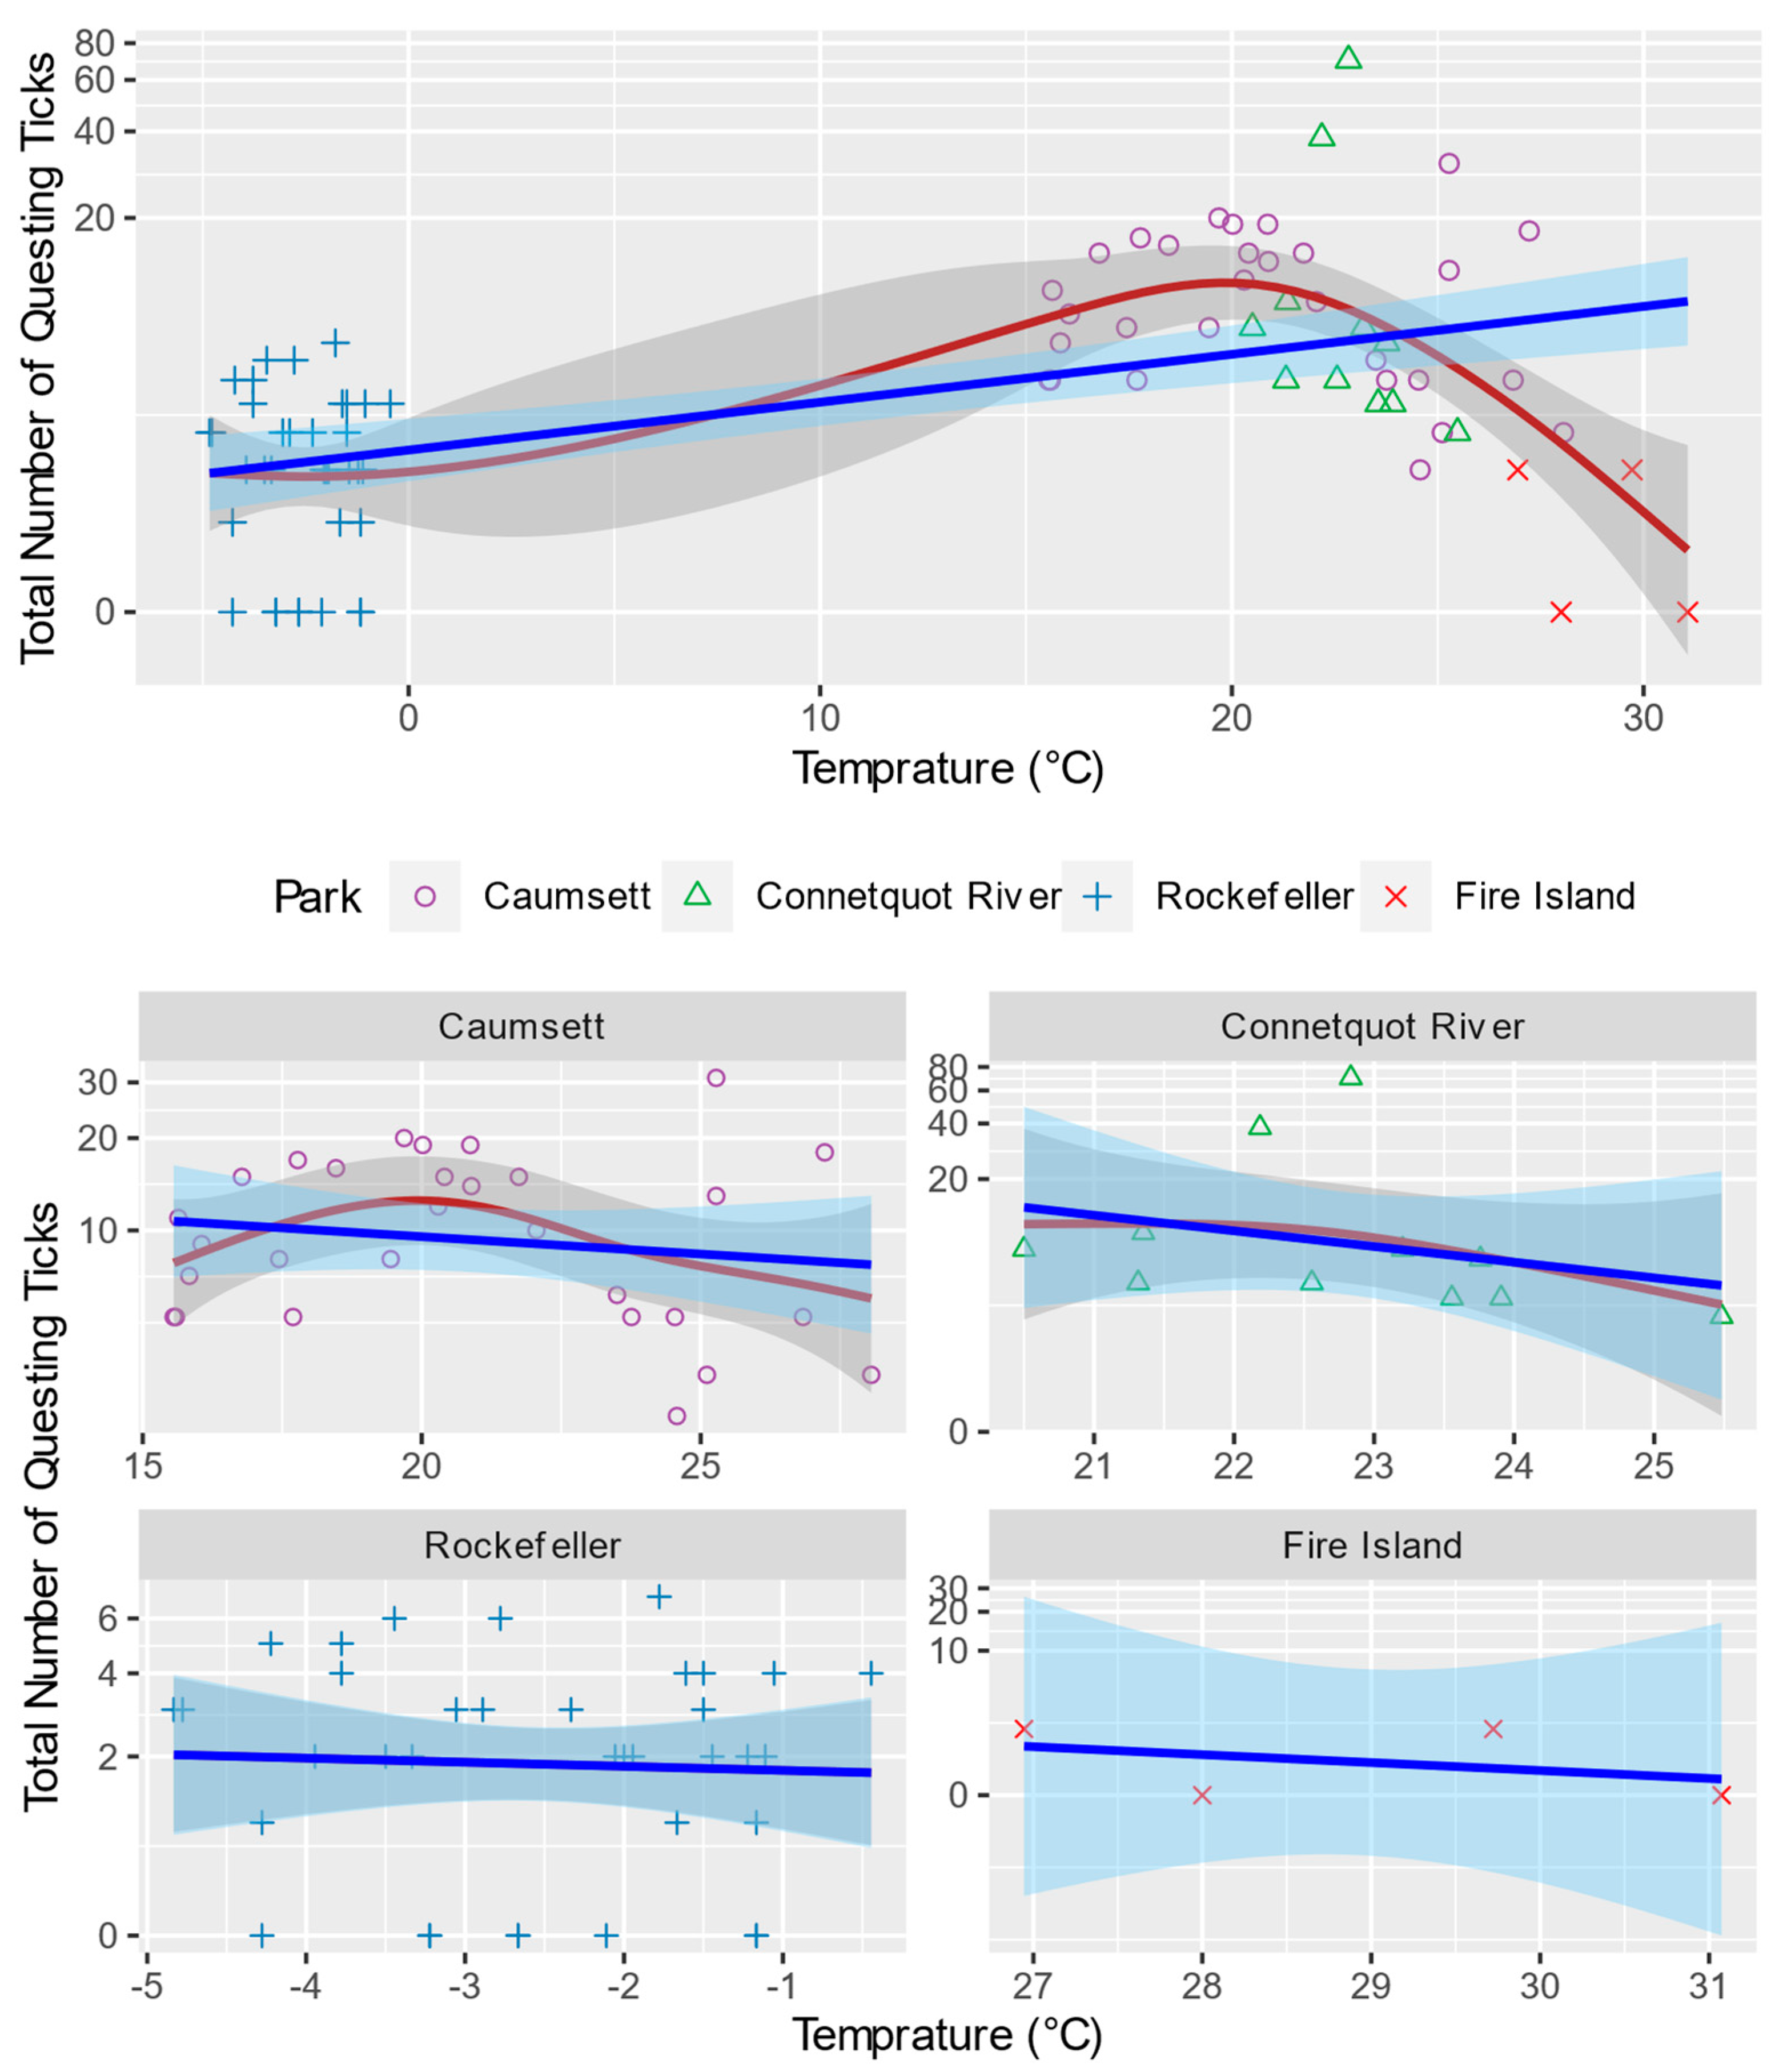
When the data from all parks on all dates are visualized with temperature and relative humidity, the numbers of questing black-legged ticks show nonlinear patterns that are consistent with the previous studies. While higher temperature generally leads to more questing ticks, the relationship is nonlinear (Figure 5). Specifically, the optimal temperature for tick questing behavior is approximately 20 °C in suburban New York. When the temperature is lower than 20 °C, a higher temperature promotes questing, while a temperature higher than 20 discourages questing. At the same time, questing activities seem indifferent to very high (≥25 °C) or very low (≤0 °C) temperatures.
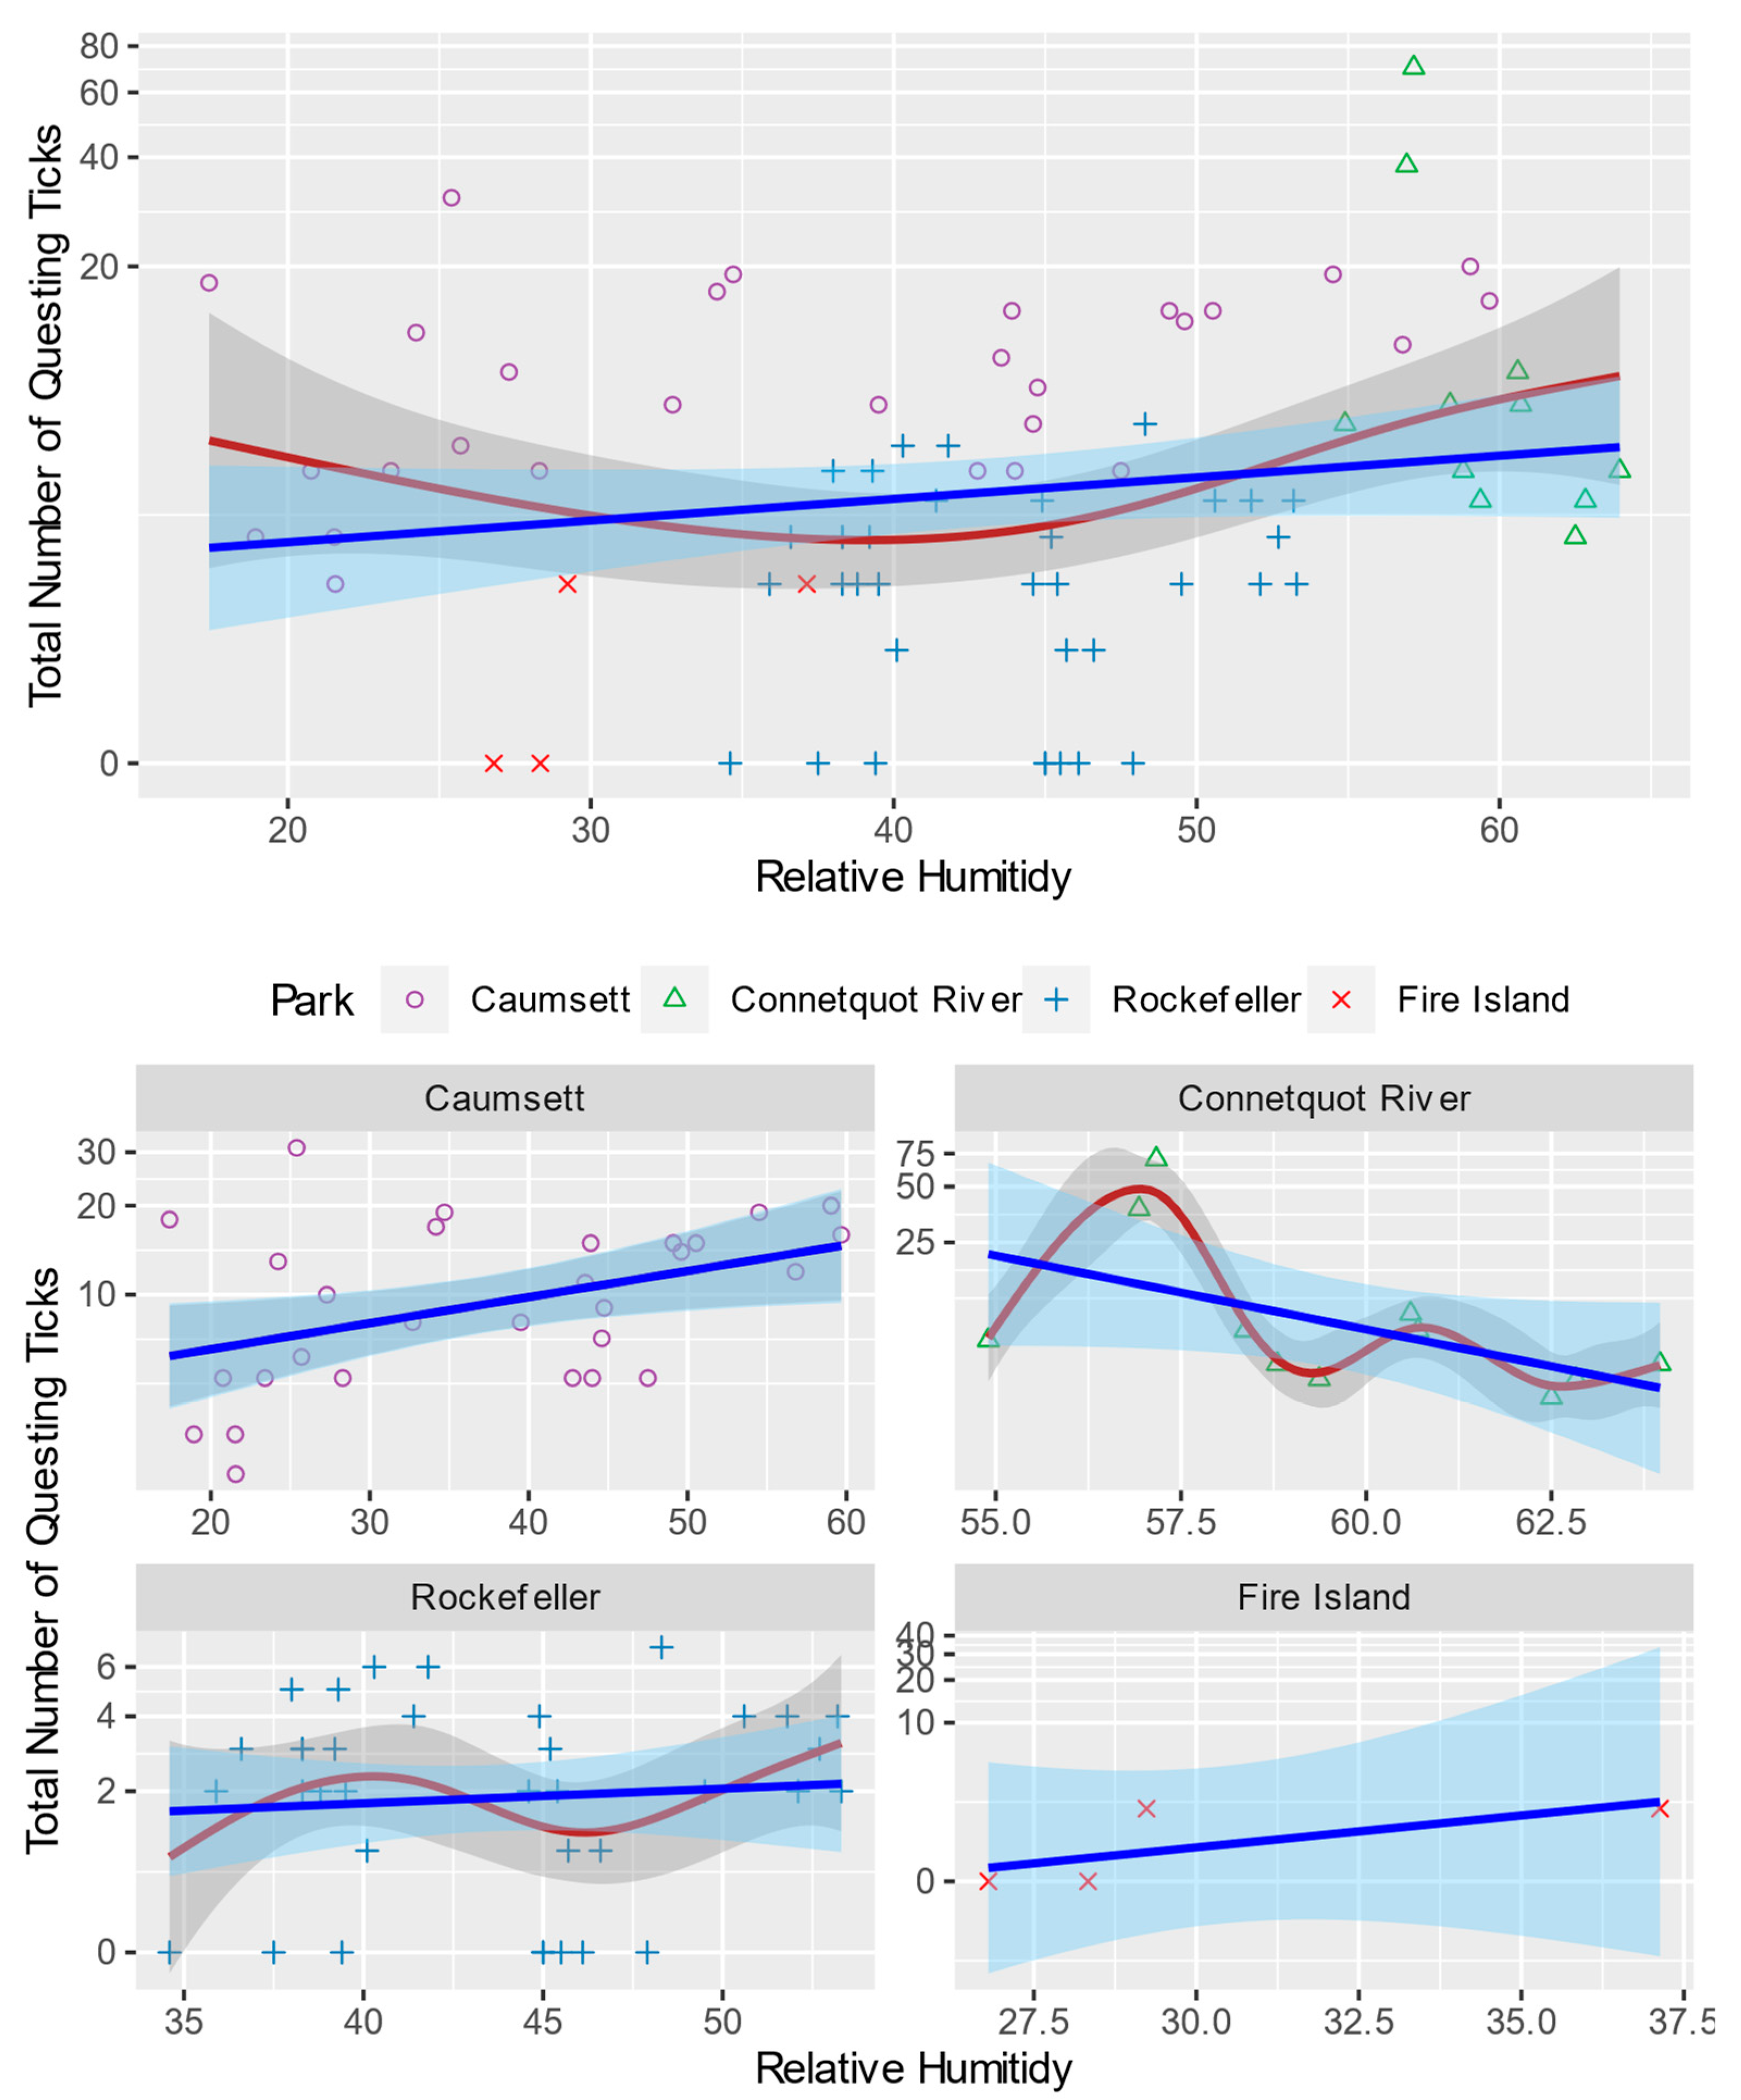
The case of relative humidity is even more complex than the temperature. While the linear trend suggests higher humidity leads to more questing activities, their relationship also indicates nonlinearity (Figure 6). Opposite to the temperature, the fitted curve shows a worse humidity level around 42%, and a lower or higher humidity level can increase ticks’ questing activities. However, this pattern is not supported at all individual parks as the nonlinear relationship only holds at CRSP. At CSP, the trend is clearly an upward linear one, which is consistent with the existing theories. The other two parks, RPP and FINS, have no obvious trend because the temperature at RPP is very low and the land cover at FINS has little vegetation.
Unlike the temperature and relative humidity, other environmental factors display few generalizable patterns due to the significant variations at local scales. Of course, the absence of patterns and the nonlinear relationships are not surprising as the black-legged ticks’ questing activities interact with local factors in intricate ways. On the one hand, the patterns revealed from our data, particularly the temperature, are in accordance with the published results from other researchers, which largely verifies our data collection method. On the other hand, the complexity of the patterns also requires more advanced statistical methods to examine the relationships among those factors in the presence of nonlinearity.

3.2. Negative Binomial Generalized Linear Regression Analysis

From the regression results, it is clear that the full, alternative, and calibrated models are significantly better than the null model as they have lower AICc and higher pseudo-R2 values (Table 3). The non-null models produce seemingly contradictory indictors for model fitness. The Nagelkerke’s pseudo-R2 from the full model is higher than the alternative and calibrated models; that is, 0.57 vs. 0.47 and 0.55. The AICc, however, strongly favors the calibrated model, as its value is lower than that of the full model by 14.32. As a general rule, if the AICc of one model is lower than another model by at least 2, we would rather pick the model with the lower AICc. Because the Nagelkerke’s pseudo-R2 does not account for the degree of freedom or the number of explanatory variables, it gives an advantage to models with more predictors. Using the adjusted McFadden pseudo-R2, which penalizes models including more independent variables, the calibrated model is better than the full and the alternative models. Note that those pseudo-R2 from the negative binomial models should not be interpreted as the (adjusted) R2 from regular Gaussian models, although they are useful for comparing competing models, as we see here.
Because our dataset is relatively small, we chose the simple leave-one-out cross validation method to further assess the models [62]. Essentially, the method leaves one sample out, re-runs the regression, and compares the predicted value and actual value from that sample. With N equals 80, the cross validation generated 80 predicted values. We used the root mean squared error (RMSE) to evaluate the overall prediction error and normalized it with the range of total number of ticks [63]. The results show that the calibrated model has a minimum prediction error of 5.12 among the four models, which is consistent with AICc in indicating its superiority to the others (Table 3). While the validation supports our selection of the calibrated model [64], the absolute prediction error is still quite large around 5, considering the mean value of the dependent variable is only 7.19. As such, these models, even the best one, have limited prediction power. Overall, the micro-scale environmental factors can improve the fitness of the model, yet relying on them to predict the quantity of questing ticks would be problematic as many critical factors might be still missing, and those included factors have complex interactions that may not be captured by the models.
From the calibrated negative binomial model, the six predictors are all statistically significant at the 0.05 level (Table 4). Their impacts on the quantity of questing black-legged ticks are also largely in line with the existing literature. Specifically, the ambient temperature and relative humidity positively contribute to the number of questing black-legged ticks. Vegetation also has a positive contribution in general. However, distinct vegetation types show various degrees of impact. From the estimated incidence rate ratios, which can be interpreted as the estimated coefficients from the regression model, dwarf shrubs have the highest contribution while pine forest has the lowest, with mixed hardwood and grassland in between. The alternative model, which is not as good as the calibrated model according to the AICc and pseudo-R2, sheds some light on the influences of seasonality and vegetation. When the season is added as a predictor, it is statistically significant, indicating there are more questing black-legged ticks in the fall season than in the spring. Unsurprisingly, the inclusion of season reduces the significance of temperature. In fact, the combination of season and elevation performs better than temperature in terms of increasing the model fitness. The coefficient of the humidity is lower with the presence of season, although its p value is still less than 0.05 and has the same signs as in the calibrated model. One major contribution of the alternative model is to illustrate the importance of NDVI, which has a statistically significant positive coefficient, although it is less superior than using the percentages of the specific land cover of vegetation. Unlike what we expected, the ecotone boundary length, an indicator of landscape fragmentation, has no significant impacts on the number of questing ticks, although the predictor does have a positive coefficient.
Overall, the generalized linear regression based on negative binomial distribution gave results that are consistent with the existing theories. Higher ambient temperature and relative humidity, when in the normal ranges, lead to more tick questing activities. Vegetation, characterized by NDVI, also has a positive effect on the number of questing ticks. More specifically, dwarf shrubs and mixed hardwoods have the highest positive impacts on ticks’ questing activities, while grassland and pine trees have much lower, yet still positive, impacts with residential land and paved roads being the baseline, which is also the consensus from a recent literature review [33].

3.3. Generalized Additive Model for Nonlinearity

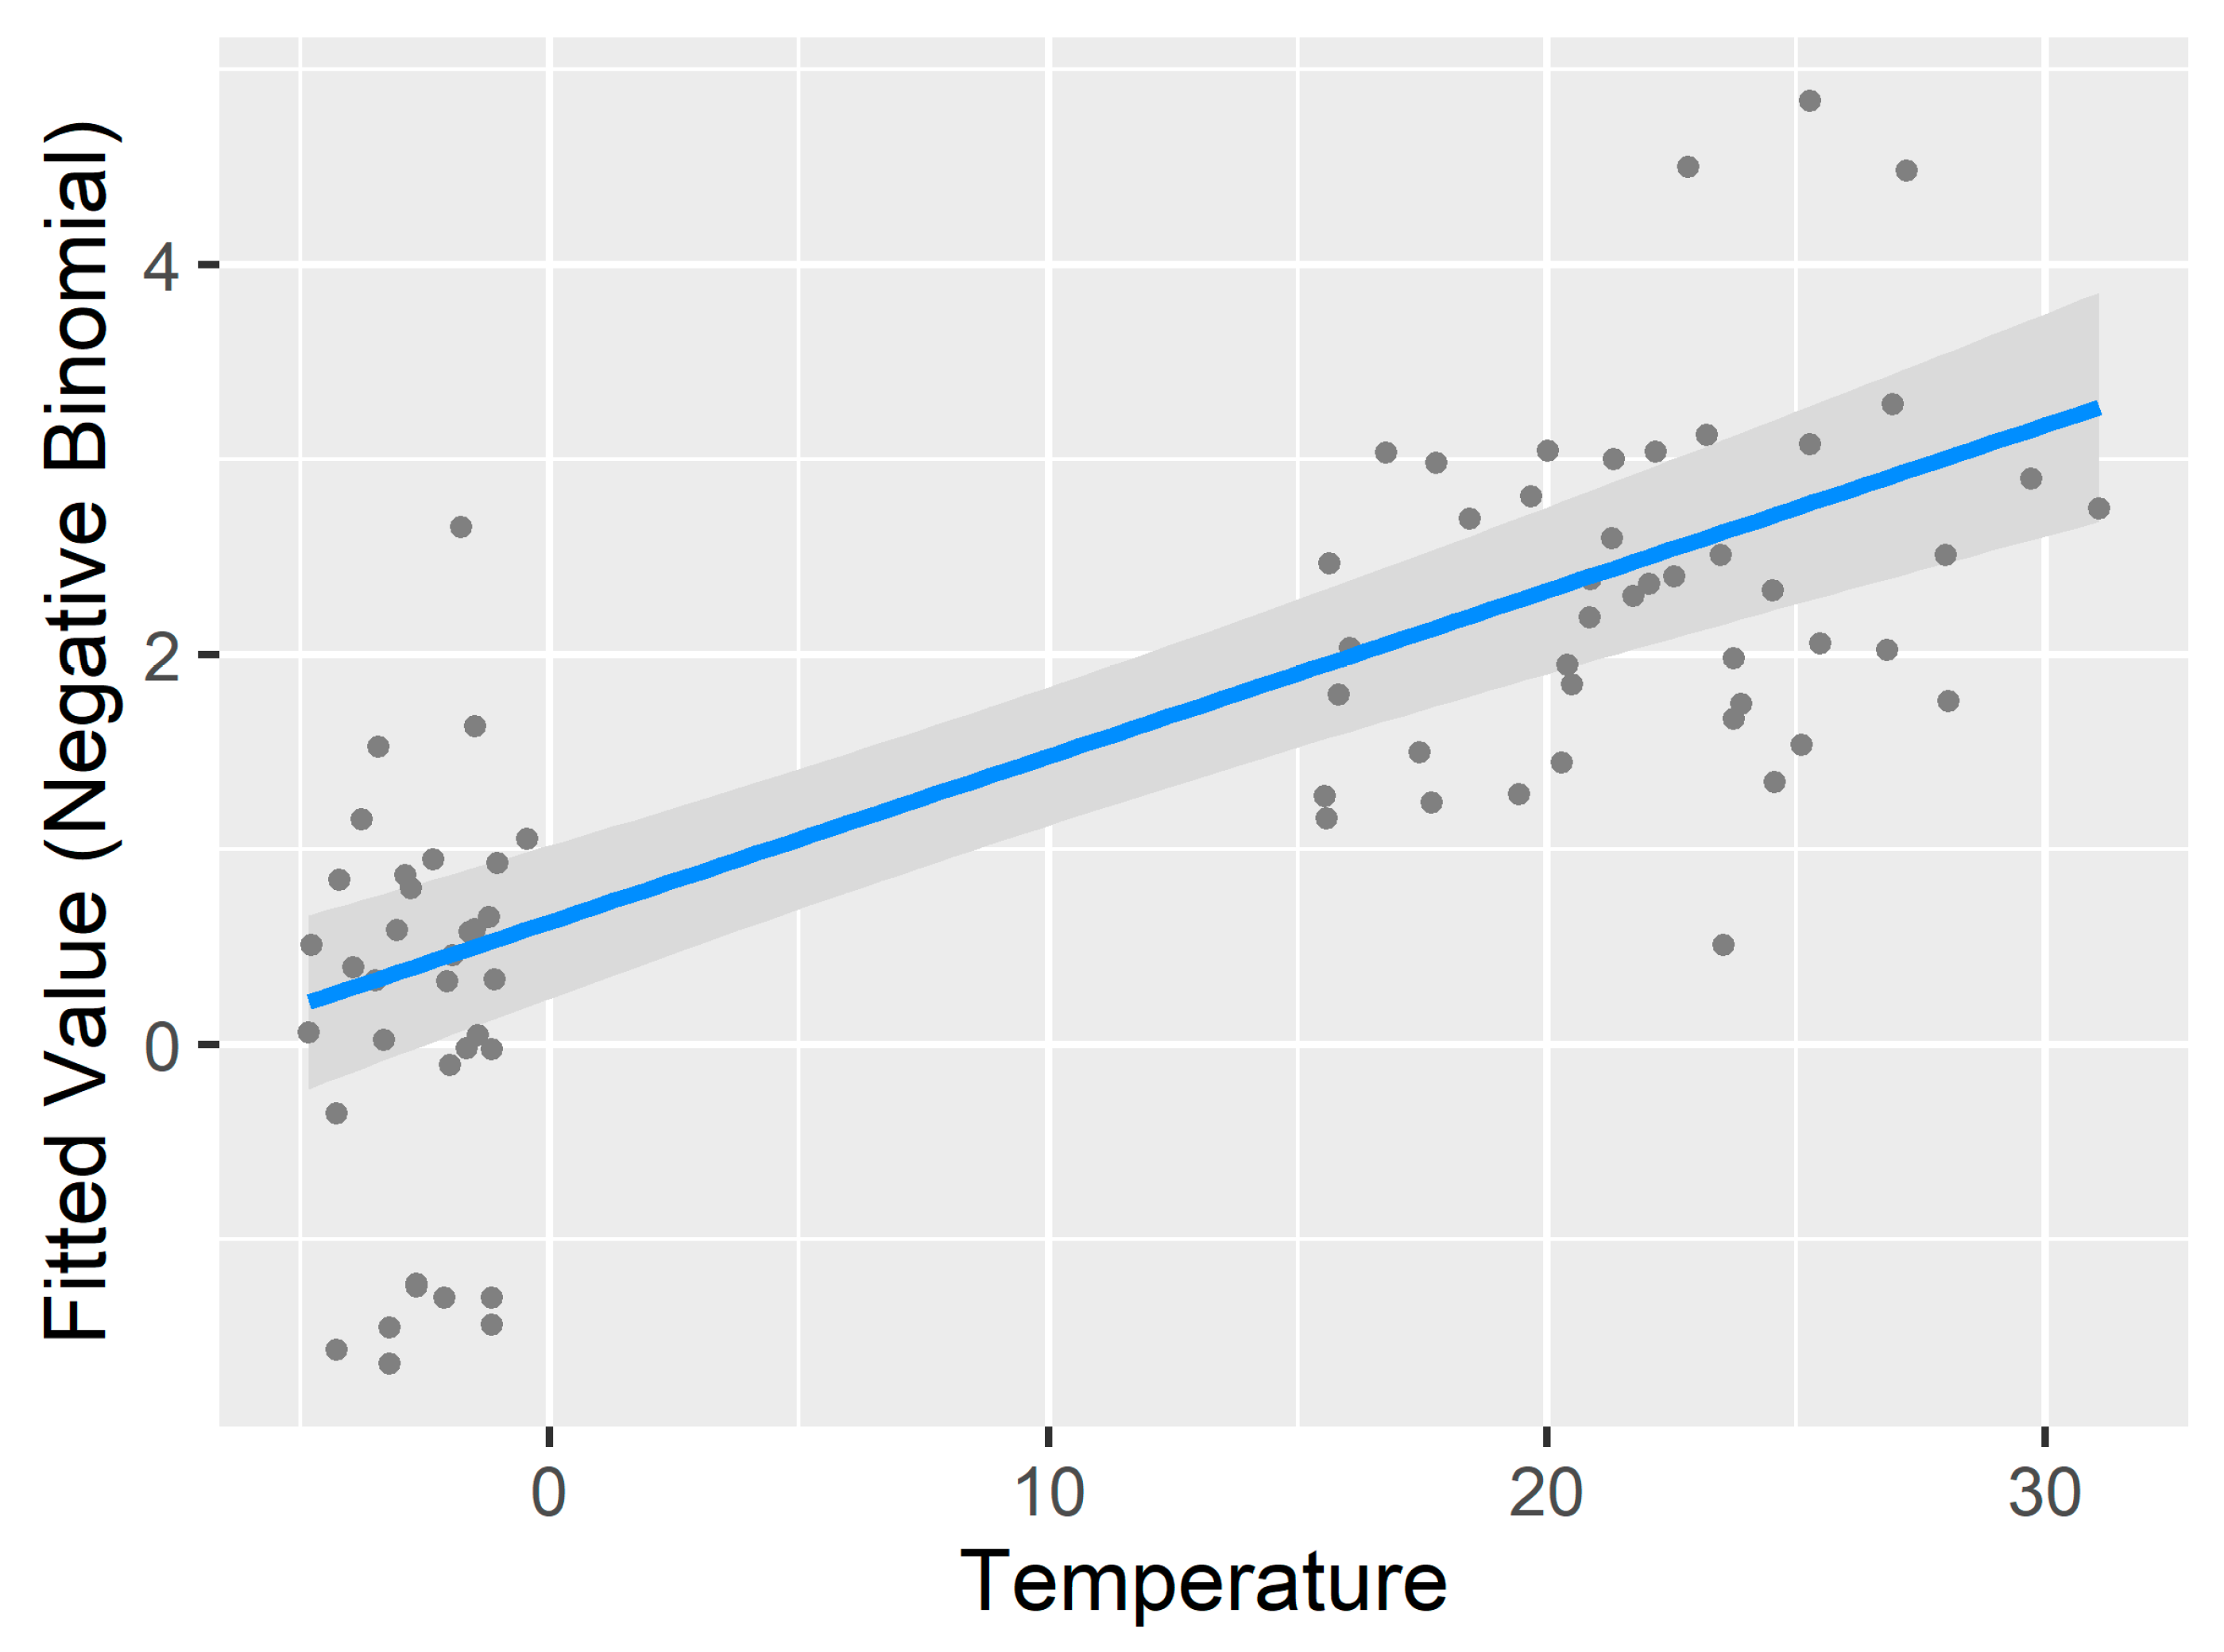
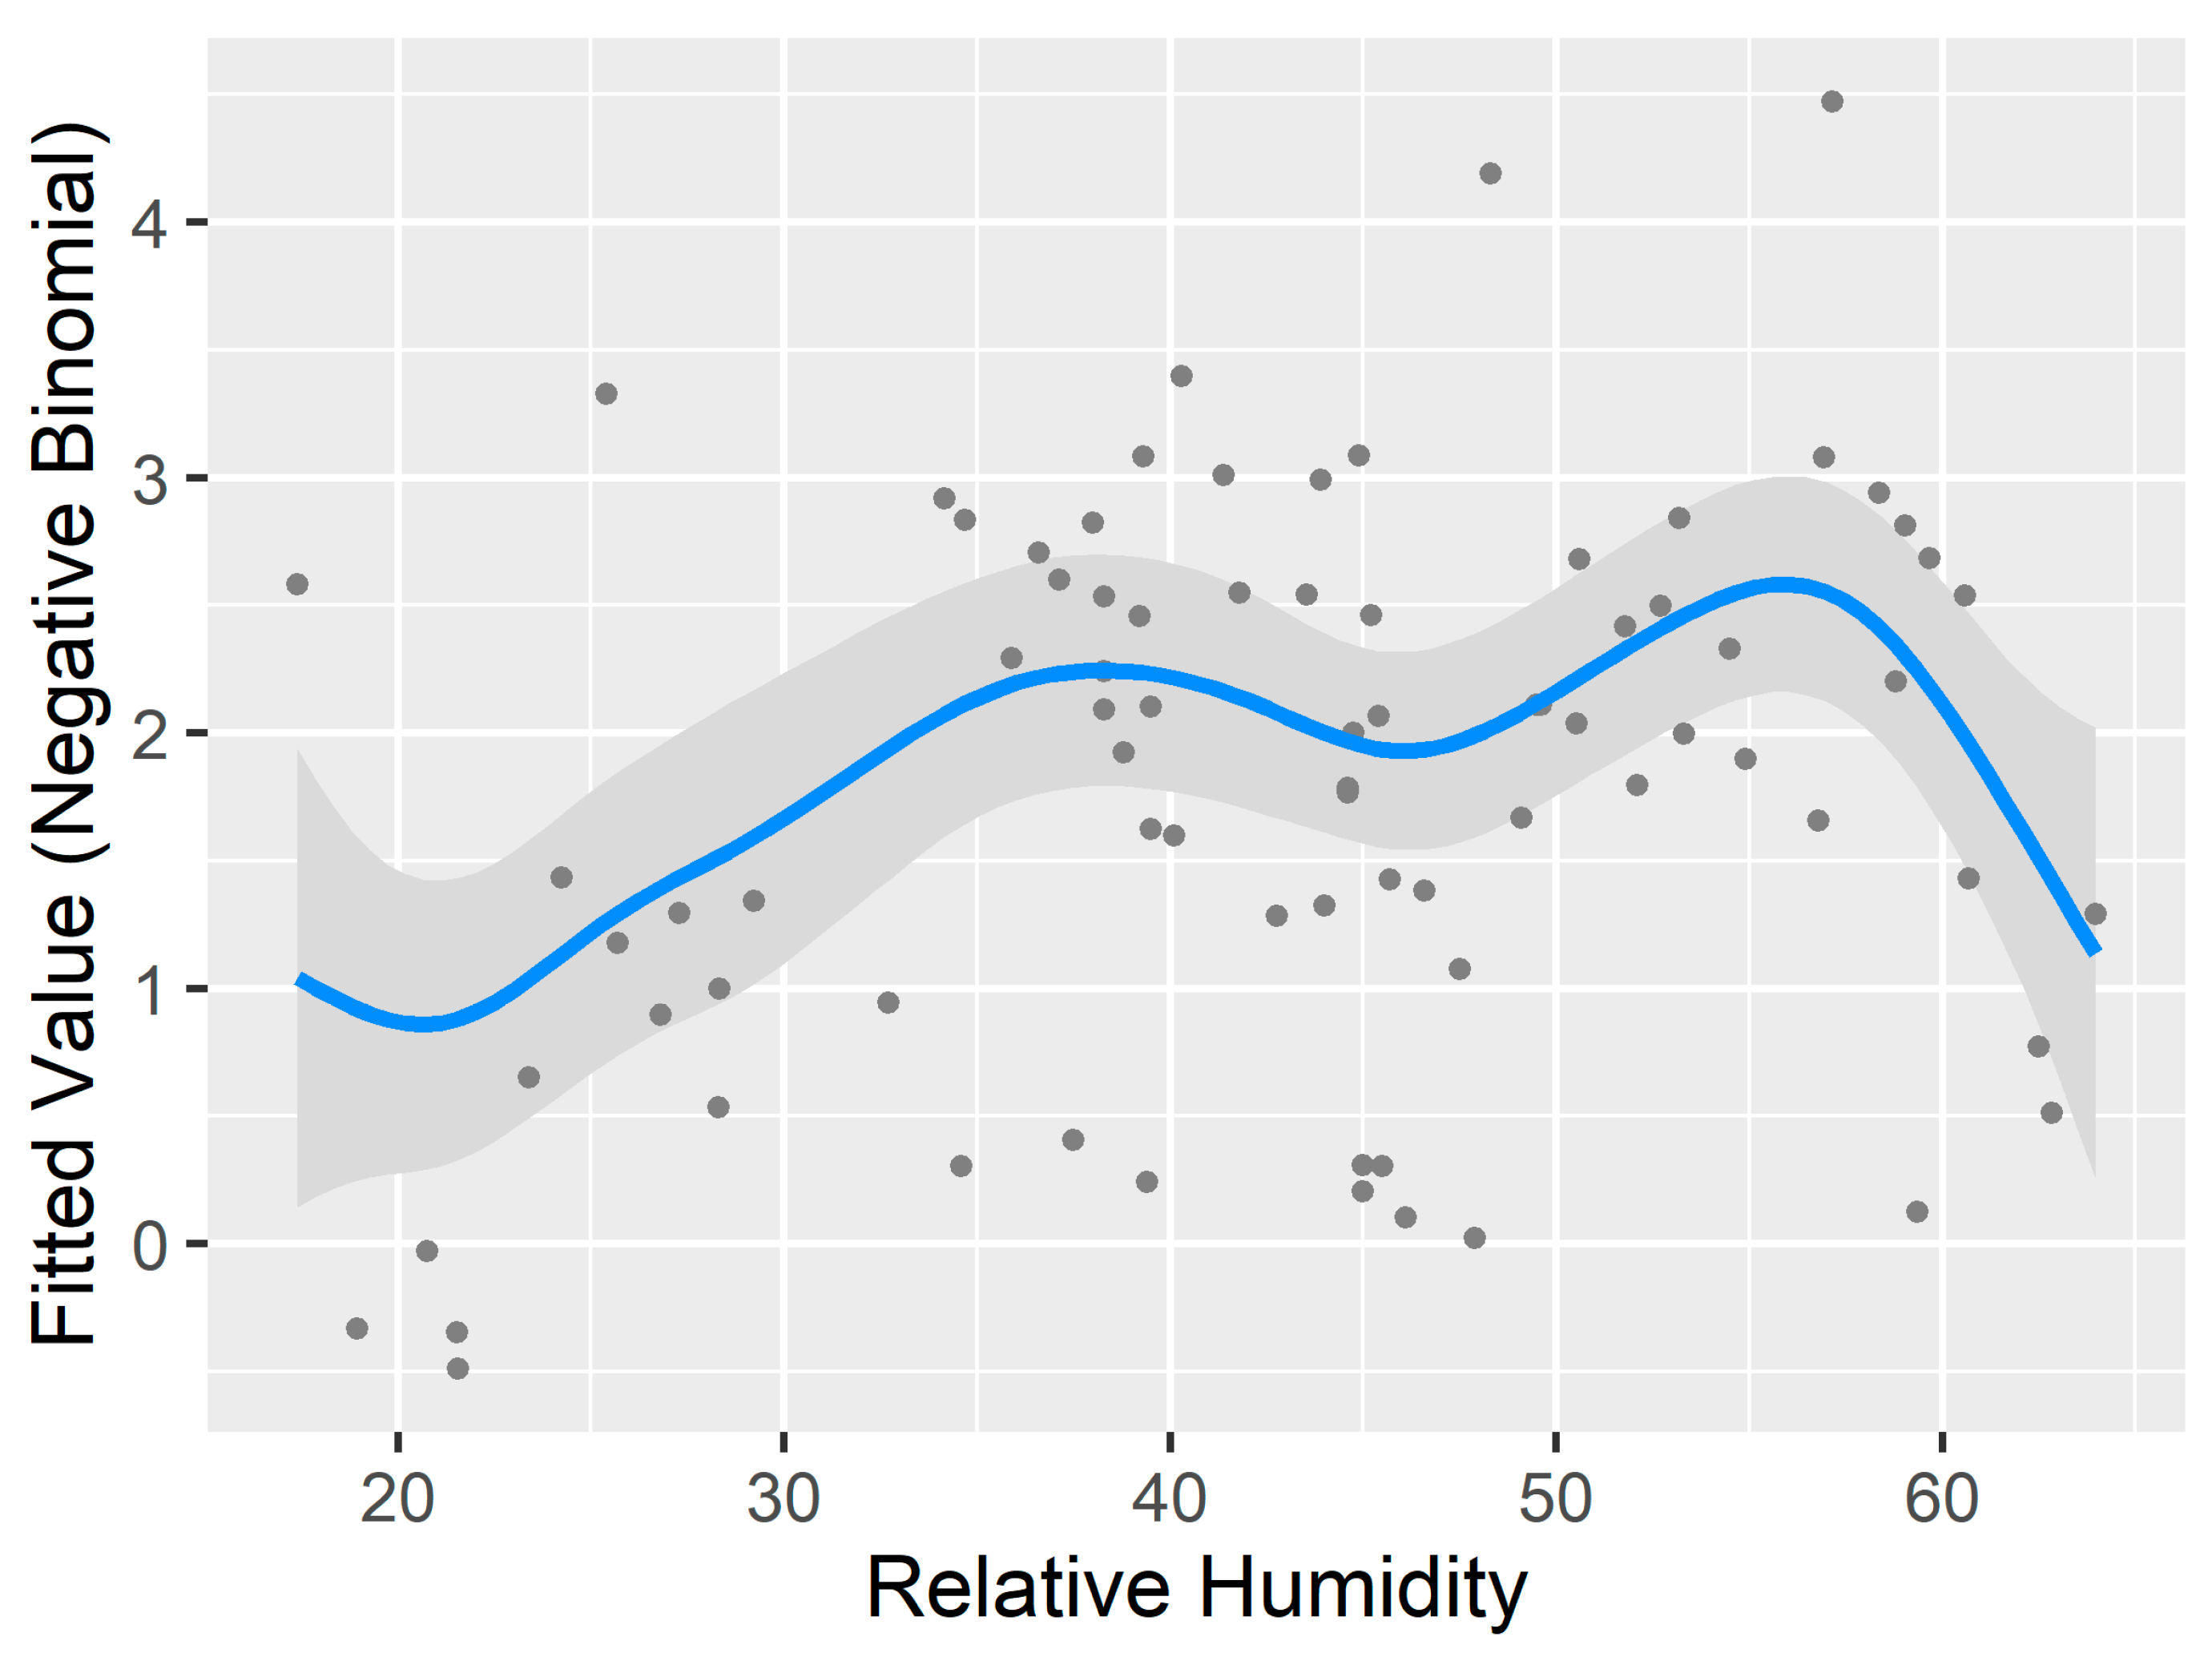
The GAM results have a few implications (Table 5). First, it further reduces the AICc by 2.04 from 440.90 to 438.86, which suggests that adding non-linear smoothing terms improved the fitness of the model. Note that the pseudo-R2 reported here is not comparable to those from negative binomial linear models. It is offered to show how much the model improves over the null model. Second, many predictors still show linear relationships. Of particular interest is the temperature. Although the general trend fitting in the “General Pattern and Correlation” section visually shows a non-linear relationship between ambient temperature and the number of questing ticks, such nonlinearity does not hold well in the GAM. This is because GAM penalizes adding complex smoothing terms, which is similar to adding more predictors to a linear regression. When the temperature is modeled as non-linear, the improvement to the model fitness does not offset the cost of adding more variables. Therefore, temperature turns out to be a linear predictor (Figure 7). By contrast, the relative humidity has a strong non-linear relationship. An EDF value of six means there are six knots or turning points in the fitted relationship (Figure 7). Again, this is different from the general trend in the “General Pattern and Correlation” section. However, the complex curve was estimated by the GAM and the smoothed term could significantly improve model fitness even with higher degree of freedom. Note that the y axis in Figure 7 is transformed by the negative binomial function, therefore, different from the y axis in Figure 5 and Figure 6.
The generalized additive model (GAM) allowed us to assess the nonlinearity of the environmental factors. Overall, the relative humidity has a strong non-linear relationship with the modeled quantity of questing ticks, as well as the percentage of the dwarf shrubs land cover. Other statistically significant factors, including temperature and other types of vegetation, reveal a linear relationship, which is rather unexpected but could be explained by the distribution of the sample data. The linearity of ambient temperature, for instance, mainly results from the bimodal distribution of lower temperature in the spring and higher temperature in the fall.

4. Discussion

While our study at the local scale largely aligns with the existing theories, it has uncovered certain micro-scale patterns that require deeper examination and discussion. Moreover, we have noted distinct patterns that vary across seasons and parks, which we endeavor to comprehend and explicate.
Before discussing the results, it is necessary to examine the issue of multicollinearity and nonlinearity in ecological multiple regressions. Multicollinearity in ecology refers to the situation where targeted ecological responses are linked to multiple explanatory variables that are correlated to each other [65,66]. Multicollinearity could present “spurious correlations”, instead of “synergistic relationships” [66]. From our dataset, the temperature is highly correlated with elevation and solar radiation and moderately with vegetation. In addition, NDVI is also correlated with the percentages of different types of vegetation land cover. As a result, while many environmental factors are seemingly related to the quantity of questing blacklegged ticks, only a few would be left in the regression models due to such multicollinearity. Furthermore, we applied GAM to address the issue of nonlinearity, where explanatory variables have non-linear relationships with the response variables. GAM, however, is not quite intuitive in terms of exposing the details of nonlinear relationships. As such, we will use the original data and our field observations to explain some of the significant patterns in the following sections.

4.1. Variability of Questing Tick Populations between Seasons and Parks

The most significant variability in the quantity of questing adult blacklegged ticks is between seasons and parks. Both abundance and host-seeking behavior of blacklegged ticks are bimodal, meaning that two peaks of questing blacklegged ticks can be observed in the spring and fall seasons every year. According to a ten-year tick study conducted in New Jersey, the highest levels of adult blacklegged ticks’ questing activity occur during two distinct seasons [67]. Specifically, from 14 April to 28 April in the spring, and from 27 October to 23 November in the fall, are the peak seasons for adult blacklegged ticks. However, the time points and duration of tick peak seasons may vary depending on geographic locations. For instance, peaks for adult tick activities in southeastern Missouri occur in February and November [68]. In addition, long-term field observations in these two studies show that peak adult tick activity in the fall is consistently higher than that in the spring despite significant annual fluctuations. In our study, the overall tick numbers are also higher in the fall than in the spring when excluding 15 November 2017, a day with extremely low temperature.
While temperature is susceptible to seasonal variations, vegetation is also influenced by the season. Seasonality impacts live green vegetation in terms of its greenness, moisture, and cooling effects, which can be represented by NDVI and is often correlated with the locally measured temperature and humidity. Note that the types and composition of vegetation land cover are rather stable across seasons, although they essentially define the microclimate in local tick habitats [69].
The specific variability in tick counts between parks can be explained by the vegetation composition and fragmentation, as well as by climate and weather factors, particularly the temperature. For example, pine forests in CRSP, even though sparsely distributed, serve to form a diverse and fragmented forest community. As a result, although CSP and CRSP appear to have the same median numbers of questing tick population around 5, the average per sampling site in CRSP (CRSPavg = 8.83) is higher than CSP (CSPavg = 7.23), suggesting a clustered pattern. The same phenomenon that more fragmented forests have higher questing tick populations is also noted in [36].
RPP was quite similar to CSP in landscapes including vast oak forest, dense tree canopy, and abundant tick host species, primarily the white-tailed deer. However, we collected many fewer blacklegged ticks at RPP than CSP; that is, 88 vs. 208 in total and 2.44 vs. 6.74 per site (5 m by 5 m). The reason for such a significant difference is that we conducted the tick sampling at RPP on 15 November 2017. A sharp plummet in air temperature on that day made measures of surface temperature much lower than those measured two weeks before at CSP. Interestingly, even though the temperature at RPP during the sampling was below the frozen point (about −1 °C), which is lower than the 4 °C lower air temperature threshold for tick activity as suggested by [70], blacklegged ticks were still actively seeking hosts. There are several possible reasons for this abnormality. The woodland habitats might have helped mitigate extremely low temperatures to a level that was not inhibitory for adult blacklegged ticks to quest; the plummet in air temperatures occurred so rapidly and some ticks were captured before moving back to warmer shelters; or such temperature thresholds are not universal and only apply to specific types of ticks at specific locations. Nevertheless, the overall number of questing blacklegged ticks appeared to be significantly lower in extremely cold weather on 15 November 2017 in RPP.
The desert-like landscape in FINS is clearly different from the oak-dominated mixed forests in the other three parks (Figure 8). Although most areas in FINS are vegetated, they are covered by dwarf bushes and shrubs. Large tree canopies are rarely present on the island. In addition, intense sea winds drain moisture from the air near the ground surface and make the habitats unsuitable for blacklegged ticks due to dryness [71]. Only four blacklegged tick nymphs were collected during our four-hour tick collection in FINS. Surprisingly, a considerable number of lone star ticks were observed in the field. Lone star ticks are much more tolerant to a dry environment than blacklegged ticks, and their prevalence is another indicator of the dry climate in FINS [39].

4.2. Influence of Environmental Factors

4.2.1. Temperature and Relative Humidity

The positive correlation between tick abundance and temperature is widely recognized by most of the studies projecting climate change [26,55,72,73,74]. Our micro-scale data and regression results are consistent with these theories as higher temperature generally stimulates more questing activities, while extremely low or high temperatures discourage such activities. Examining our raw field data, the surface temperature alone may not be a significant driving factor for the quantity of questing black-legged ticks at the micro scale [70]. However, significant changes in temperature that vary with seasons may function as a threshold determining the states of the tick host-seeking activity being either “occur” or “not occur” [75,76]. While a binary variable of season that differentiates the spring from the fall is statistically significant in one of our regression models, the temperature performs better in correlating with the quantity of questing blacklegged ticks because season is just a broad and coarse non-numerical proxy.
Our study also highlights the critical role that relative humidity plays in black-legged ticks’ questing activity, which is widely recognized in tick ecology [16]. At the local scale, relative humidity would outperform most meteorological variables (i.e., precipitation) in modeling tick questing activities because it is a straightforward indicator for tick water stress in the microclimate [42]. Although all relative humidity data measured in this study are below the 82% threshold of black-legged tick survival suggested in [20], they were the microclimatic relative humidity experienced by questing black-legged ticks in the natural habitat. In addition, ticks are adaptive vectors, and they actively change questing behaviors (e.g., questing height) in response to water stress in their surroundings [70]. Interestingly, we also observed the nonlinearity of humidity. Extremely low and high humidity may present a challenge for tick questing activity, which is also found in [47]. The fitted smooth curve suggested that higher moisture itself does increase the number of questing ticks but only when the relative humidity is above 40. As suggested by the generalized additive model, however, the relationship could be rather complex when considering other environmental factors.

4.2.2. Vegetation and Landscape Fragmentation

While the importance of vegetation in tick ecology studies is widely acknowledged, the role of NDVI is controversial because it indicates a variety of vegetation-related features [55] from the abundance or density of vegetation [77], to plant water content [78], and to relative humidity around the vegetation layer [79]. Despite this, NDVI is typically strongly correlated with black-legged tick populations and their host-seeking behavior, which is also supported by our alternative negative binomial regression model. In general, areas with higher NDVI are covered by thriving vegetation (with higher water content) or denser tree canopies, which create a microclimate conducive to black-legged ticks. The NDVI values in a specific area may also show seasonal patterns due to the presence of deciduous vegetation [77].
Our regression models also indicate that specific vegetation land-cover types, such as hardwood forests and dwarf shrubs, are more significant for tick ecology studies than the general NDVI. This has practical implications as a more detailed land cover and vegetation classification should be considered in addition to NDVI. Hardwood forests, characterized by large tree canopies, can capture snowmelt, maintain moisture with leaf litter, and provide a favorable habitat for black-legged ticks [80]. The calibrated regression model clearly shows the significant and positive effect of hardwood forests on the number of questing black-legged ticks. In contrast, pine forests, with needle-leaved tree canopies, do not create a cool and humid microenvironment as effectively as broad-leaved hardwood forests [81]. Tick sampling conducted by [36] in New Jersey showed that questing tick populations observed in hardwood forests (4.3 ± 1.1 across 8 sites) were approximately twice the questing tick populations in pine forests (2.1 ± 0.5 across 14 sites). Our study also showed a similar pattern, with mixed hardwood having a higher coefficient than pine forests or grassland in the calibrated regression model. We also found that dwarf shrubs tended to have more questing ticks than both, as black-legged ticks usually move to shrubs to attach to passing hosts.
In addition to hardwood forests, questing tick populations are often positively correlated with the total length of ecotone boundaries within each sampling site, as ticks usually reside and quest along forest boundaries. Goddard et al. [82] found that black-legged ticks are unlikely to appear in no-shade or totally shaded areas but are frequently observed along forest edges with 30% to 80% mixed shade. Therefore, totally forested areas, compared with forest ecotones, may have a lower tick population [83]. Additionally, ecotones in suburban areas usually create a more fragmented landscape, which supports larger black-legged tick populations because these areas usually have large and diverse populations of tick host species, including the white-tailed deer, white-footed mice, and chipmunks [84,85]. Furthermore, the effects of landscape fragmentation on deer populations are found to be especially striking in suburban areas due to the preferred forage provided by abundant ecotonal vegetation and the absence of predator species [77]. In our full and alternative regression models, the ecotone boundary length variable has a positive coefficient, which is in line with the existing theories. However, in the presence of other factors, such as the NDVI and percentages of vegetation land cover, the variable was not statistically significant. Therefore, while ecotone boundary length and vegetation fragmentation may have a significant impact on the number of questing black-legged ticks at a macro scale, their effect is less pronounced at the local level.

5. Conclusions

The quantity of questing black-legged ticks in suburban parks around New York City is influenced by a complex interplay of micro-scale environmental factors, including temperature, humidity, vegetation, and landscape characteristics. Seasonality also plays a significant role in the temporal pattern of questing tick populations. In general, habitats that are characterized by a warmer ambient temperature, higher relative humidity, and more vigorously growing vegetation are likely to have an increased number of questing black-legged ticks. While hardwood forests and dwarf shrubs are found to be more favorable than pine forests and short grass for questing black-legged ticks, the relationship between ecotone boundary edges and questing tick populations is less clear. The complexity of how micro-scale environmental factors impact the quantity of questing black-legged ticks can be attributed to two main reasons. First, the relationships are often nonlinear, in which extreme conditions, particularly the temperature and humidity, tend to have negative effects. They are also complicated by the multicollinearity of the environmental factors such as elevation, temperature, and vegetation at the micro-scale. Second, the thresholds such as the lowest survival temperature and minimum humidity that were established in the lab or semi-controlled settings at specific geographical areas may not apply in a natural setting at a different location. Our study illustrates well the spatial heterogeneity of these thresholds.

Author Contributions

Conceptualization, W.Q. and S.S.; methodology, C.D., B.S. and S.S.; software, C.D., B.S. and S.S.; formal analysis, C.D. and S.S.; investigation, C.D., B.S. and W.Q.; resources, W.Q. and S.S.; data curation, C.D. and S.S.; writing—original draft preparation, C.D.; writing—review and editing, S.S., B.S. and W.Q.; visualization, C.D. and S.S.; supervision, W.Q. and S.S.; funding acquisition, W.Q. and S.S. All authors have read and agreed to the published version of the manuscript.

Funding

This work was supported by the Professional Staff Congress—The City University of New York (PSC-CUNY) [grant number: 62807-0050] and the National Institute of Allergy and Infectious Diseases (NIAID) of the US National Institutes of Health (NIH) [grant number: AI139782].

Institutional Review Board Statement

Not applicable.

Informed Consent Statement

Not applicable.

Data Availability Statement

The data presented in this study are openly available in Mendeley Data at https://data.mendeley.com/datasets/d24yyp96dc/2 (accessed on 18 October 2023), reference number 10.17632/d24yyp96dc.2.

Acknowledgments

We thank Moses Cucura of the Suffolk County Vector Control, New York State for guidance for the fieldwork throughout the project.

Conflicts of Interest

The authors declare no conflict of interest. The funders had no role in the design of the study; in the collection, analyses, or interpretation of data; in the writing of the manuscript; or in the decision to publish the results.

References

  1. Kugeler, K.J.; Schwartz, A.M.; Delorey, M.J.; Mead, P.S.; Hinckley, A.F. Estimating the frequency of Lyme disease diagnoses, United States, 2010–2018. Emerg. Infect. Dis. 2021, 27, 616. [Google Scholar] [CrossRef] [PubMed]
  2. Centers for Disease Control and Prevention. Why Is CDC Concerned about Lyme Disease? Available online: https://www.cdc.gov/lyme/why-is-cdc-concerned-about-lyme-disease.html (accessed on 31 May 2021).
  3. Arsnoe, I.; Tsao, J.I.; Hickling, G.J. Nymphal Ixodes scapularis questing behavior explains geographic variation in Lyme borreliosis risk in the eastern United States. Ticks Tick-Borne Dis. 2019, 10, 553–563. [Google Scholar] [CrossRef] [PubMed]
  4. Burgdorfer, W.; Barbour, A.G.; Hayes, S.F.; Benach, J.L.; Grunwaldt, E.; Davis, J.P. Lyme disease-a tick-borne spirochetosis? Science 1982, 216, 1317–1319. [Google Scholar] [CrossRef] [PubMed]
  5. Ostfeld, R.S. The Ecology of Lyme-Disease Risk: Complex interactions between seemingly unconnected phenomena determine risk of exposure to this expanding disease. Am. Sci. 1997, 85, 338–346. [Google Scholar]
  6. Horak, I.G.; Camicas, J.-L.; Keirans, J.E. The Argasidae, Ixodidae and Nuttalliellidae (Acari: Ixodida): A world list of valid tick names. In Ticks and Tick-Borne Pathogens; Jongejan, F., Kaufman, W.R., Eds.; Springer: Dordrecht, The Netherlands, 2003; pp. 27–54. [Google Scholar]
  7. Brown, R.N.; Lane, R.S.; Dennis, D.T. Geographic distributions of tick-borne diseases and their vectors. In Tick-Borne Diseases of Humans; Goodman, J.L., Dennis, D.T., Sonenshine, D.E., Eds.; ASM Press: Washington, DC, USA, 2005; pp. 361–391. [Google Scholar]
  8. Ebel, G.D. Update on Powassan virus: Emergence of a North American tick-borne flavivirus. Annu. Rev. Entomol. 2010, 55, 95–110. [Google Scholar] [CrossRef]
  9. Homer, M.J.; Aguilar-Delfin, I.; Telford Iii, S.R.; Krause, P.J.; Persing, D.H. Babesiosis. Clin. Microbiol. Rev. 2000, 13, 451–469. [Google Scholar] [CrossRef]
  10. Piesman, J.; Eisen, L. Prevention of tick-borne diseases. Annu. Rev. Entomol. 2008, 53, 323–343. [Google Scholar] [CrossRef]
  11. Piesman, J.; Gern, L. Lyme borreliosis in europe and north america. Parasitology 2004, 129, S191–S220. [Google Scholar] [CrossRef]
  12. Ostfeld, R. Lyme Disease: The Ecology of a Complex System; Oxford University Press: New York, NY, USA, 2010. [Google Scholar]
  13. Kocan, K.M.; de la Fuente, J.; Coburn, L.A. Insights into the development of Ixodes scapularis: A resource for research on a medically important tick species. Parasites Vectors 2015, 8, 592. [Google Scholar] [CrossRef]
  14. Yuval, B.; Spielman, A. Duration and regulation of the developmental cycle of Ixodes dammini (Acari: Ixodidae). J. Med. Entomol. 1990, 27, 196–201. [Google Scholar] [CrossRef]
  15. Lindsay, L.R.; Barker, I.K.; Surgeoner, G.A.; McEwen, S.A.; Gillespie, T.J.; Addison, E.M. Survival and development of the different life stages of Ixodes scapularis (Acari: Ixodidae) held within four habitats on Long Point, Ontario, Canada. J. Med. Entomol. 1998, 35, 189–199. [Google Scholar] [CrossRef] [PubMed]
  16. Lindsay, L.R.; Barker, I.K.; Surgeoner, G.A.; McEwen, S.A.; Gillespie, T.J.; Robinson, J.T. Survival and development of Ixodes scapularis (Acari: Ixodidae) under various climatic conditions in Ontario, Canada. J. Med. Entomol. 1995, 32, 143–152. [Google Scholar] [CrossRef] [PubMed]
  17. Jaworski, D.C.; Sauer, J.R.; Williams, J.P.; McNew, R.W.; Hair, J.A. Age-related effects on water, lipid, hemoglobin, and critical equilibrium humidity in unfed adult lone star ticks (Acari: Ixodidae). J. Med. Entomol. 1984, 21, 100–104. [Google Scholar] [CrossRef]
  18. Lees, A.D. The effect of ageing and locomotor activity on the water transport mechanism of ticks. Acarologia 1964, 6, 915–923. [Google Scholar]
  19. Williams, J.P.; Sauer, J.R.; McNew, R.W.; Hair, J.A. Physiological and biochemical changes in unfed lone star ticks, Amblyomma americanum (Acari: Ixodidae), with increasing age. J. Med. Entomol. 1986, 23, 230–235. [Google Scholar] [CrossRef] [PubMed]
  20. Eisen, R.J.; Eisen, L.; Ogden, N.H.; Beard, C.B. Linkages of weather and climate with Ixodes scapularis and Ixodes pacificus (Acari: Ixodidae), enzootic transmission of Borrelia burgdorferi, and Lyme disease in North America. J. Med. Entomol. 2016, 53, 250–261. [Google Scholar] [CrossRef]
  21. Ginsberg, H.S.; Rulison, E.L.; Miller, J.L.; Pang, G.; Arsnoe, I.M.; Hickling, G.J.; Ogden, N.H.; LeBrun, R.A.; Tsao, J.I. Local abundance of Ixodes scapularis in forests: Effects of environmental moisture, vegetation characteristics, and host abundance. Ticks Tick-Borne Dis. 2020, 11, 101271. [Google Scholar] [CrossRef]
  22. Ogden, N.H.; Lindsay, L.R.; Beauchamp, G.; Charron, D.; Maarouf, A.; O’Callaghan, C.J.; Waltner-Toews, D.; Barker, I.K. Investigation of relationships between temperature and developmental rates of tick Ixodes scapularis (Acari: Ixodidae) in the laboratory and field. J. Med. Entomol. 2004, 41, 622–633. [Google Scholar] [CrossRef]
  23. Sonenshine, D.E.; Tigner, J.A. Oviposition and hatching in two species of ticks in relation to moisture deficit. Ann. Entomol. Soc. Am. 1969, 62, 628–640. [Google Scholar] [CrossRef]
  24. Vandyk, J.K.; Bartholomew, D.M.; Rowley, W.A.; Platt, K.B. Survival of Ixodes scapularis (Acari: Ixodidae) exposed to cold. J. Med. Entomol. 1996, 33, 6–10. [Google Scholar] [CrossRef]
  25. Balashov, Y.S. Bloodsucking ticks (Ixodoidea)--vectors of diseases of man and animals. Misc. Publ. Entomol. Soc. Am. 1972, 8, 163–376. [Google Scholar]
  26. Ogden, N.H.; Radojevic, M.; Wu, X.; Duvvuri, V.R.; Leighton, P.A.; Wu, J. Estimated effects of projected climate change on the basic reproductive number of the Lyme disease vector Ixodes scapularis. Environ. Health Perspect. 2014, 122, 631–638. [Google Scholar] [CrossRef]
  27. Estrada-Peña, A.; Alexander, N.; Wint, G.W. Perspectives on modelling the distribution of ticks for large areas: So far so good? Parasites Vectors 2016, 9, 179. [Google Scholar] [CrossRef] [PubMed]
  28. Li, S.; Heyman, P.; Cochez, C.; Simons, L.; Vanwambeke, S.O. A multi-level analysis of the relationship between environmental factors and questing Ixodes ricinus dynamics in Belgium. Parasites Vectors 2012, 5, 149. [Google Scholar] [CrossRef]
  29. Levin, M.L.; Fish, D. Density-dependent factors regulating feeding success of Ixodes scapularis larvae (Acari: Ixodidae). J. Parasitol. 1998, 84, 36–43. [Google Scholar] [CrossRef] [PubMed]
  30. Wharton, G.W. Uptake of water vapour by mites and mechanisms utilized by the Acaridei. In Comparative Physiology: Water, Ions and Fluid Mechanics; Schmidt-Nielsen, K., Bolis, L., Maddrell, S.H.P., Eds.; Cambridge University Press: Cambridge, UK, 1978; p. 79. [Google Scholar]
  31. Knülle, W.; Rudolph, D. Humidity relationships and water balance of ticks. In Physiology of Ticks; Obenchain, F.D., Galun, R., Eds.; Pergamon Press: Oxford, UK, 1982; pp. 43–70. [Google Scholar]
  32. Berger, K.A.; Ginsberg, H.S.; Gonzalez, L.; Mather, T.N. Relative humidity and activity patterns of Ixodes scapularis (Acari: Ixodidae). J. Med. Entomol. 2014, 51, 769–776. [Google Scholar] [CrossRef] [PubMed]
  33. Mathisson, D.C.; Kross, S.M.; Palmer, M.I.; Diuk-Wasser, M.A. Effect of Vegetation on the Abundance of Tick Vectors in the Northeastern United States: A Review of the Literature. J. Med. Entomol. 2021, 58, 2030–2037. [Google Scholar] [CrossRef]
  34. Lindsay, L.R.; Mathison, S.W.; Barker, I.K.; McEwen, S.A.; Gillespie, T.J.; Surgeoner, G.A. Microclimate and habitat in relation to Ixodes scapularis (Acari: Ixodidae) populations on Long Point, Ontario, Canada. J. Med. Entomol. 1999, 36, 255–262. [Google Scholar] [CrossRef]
  35. Morecroft, M.D.; Taylor, M.E.; Oliver, H.R. Air and soil microclimates of deciduous woodland compared to an open site. Agric. For. Meteorol. 1998, 90, 141–156. [Google Scholar] [CrossRef]
  36. Schulze, T.L.; Jordan, R.A. Influence of meso-and microscale habitat structure on focal distribution of sympatric Ixodes scapularis and Amblyomma americanum (Acari: Ixodidae). J. Med. Entomol. 2005, 42, 285–294. [Google Scholar] [CrossRef]
  37. Alverson, W.S.; Waller, D.M.; Solheim, S.L. Forests too deer: Edge effects in northern Wisconsin. Conserv. Biol. 1988, 2, 348–358. [Google Scholar] [CrossRef]
  38. Stafford, K.C., III. Reduced abundance of Ixodes scapularis (Acari: Ixodidae) with exclusion of deer by electric fencing. J. Med. Entomol. 1993, 30, 986–996. [Google Scholar] [CrossRef] [PubMed]
  39. Stafford, K.C., III. Survival of immature Ixodes scapularis (Acari: Ixodidae) at different relative humidities. J. Med. Entomol. 1994, 31, 310–314. [Google Scholar] [CrossRef] [PubMed]
  40. Wilson, M.L.; Adler, G.H.; Spielman, A. Correlation between abundance of deer and that of the deer tick, Ixodes dammini (Acari: Ixodidae). Ann. Entomol. Soc. Am. 1985, 78, 172–176. [Google Scholar] [CrossRef]
  41. Ferrell, A.M.; Brinkerhoff, R.J. Using landscape analysis to test hypotheses about drivers of tick abundance and infection prevalence with Borrelia burgdorferi. Int. J. Environ. Res. Public Health 2018, 15, 737. [Google Scholar] [CrossRef]
  42. Del Fabbro, S.; Gollino, S.; Zuliani, M.; Nazzi, F. Investigating the relationship between environmental factors and tick abundance in a small, highly heterogeneous region. J. Vector Ecol. 2015, 40, 107–116. [Google Scholar] [CrossRef]
  43. Burtis, J.C.; Sullivan, P.; Levi, T.; Oggenfuss, K.; Fahey, T.J.; Ostfeld, R.S. The impact of temperature and precipitation on blacklegged tick activity and Lyme disease incidence in endemic and emerging regions. Parasites Vectors 2016, 9, 606. [Google Scholar] [CrossRef]
  44. Tomkins, J.L.; Aungier, J.; Hazel, W.; Gilbert, L. Towards an evolutionary understanding of questing behaviour in the tick Ixodes ricinus. PLoS ONE 2014, 9, e110028. [Google Scholar] [CrossRef]
  45. Falco, R.C.; Fish, D. Potential for exposure to tick bites in recreational parks in a Lyme disease endemic area. Am. J. Public Health 1989, 79, 12–15. [Google Scholar] [CrossRef]
  46. Fish, D.; Dowler, R.C. Host associations of ticks (Acari: Ixodidae) parasitizing medium-sized mammals in a Lyme disease endemic area of southern New York. J. Med. Entomol. 1989, 26, 200–209. [Google Scholar] [CrossRef]
  47. James, M.C.; Bowman, A.S.; Forbes, K.J.; Lewis, F.; McLeod, J.E.; Gilbert, L. Environmental determinants of Ixodes ricinus ticks and the incidence of Borrelia burgdorferi sensu lato, the agent of Lyme borreliosis, in Scotland. Parasitology 2013, 140, 237–246. [Google Scholar] [CrossRef]
  48. Estrada-Peña, A. Distribution, abundance, and habitat preferences of Ixodes ricinus (Acari: Ixodidae) in northern Spain. J. Med. Entomol. 2001, 38, 361–370. [Google Scholar] [CrossRef]
  49. Vassallo, M.; Pichon, B.; Cabaret, J.; Figureau, C.; Pérez-Eid, C. Methodology for sampling questing nymphs of Ixodes ricinus (Acari: Ixodidae), the principal vector of Lyme disease in Europe. J. Med. Entomol. 2000, 37, 335–339. [Google Scholar] [CrossRef] [PubMed]
  50. Qviller, L.; Risnes-Olsen, N.; Bærum, K.M.; Meisingset, E.L.; Loe, L.E.; Ytrehus, B.; Viljugrein, H.; Mysterud, A. Landscape level variation in tick abundance relative to seasonal migration in red deer. PLoS ONE 2013, 8, e71299. [Google Scholar] [CrossRef]
  51. Dobson, A.D.M.; Finnie, T.J.R.; Randolph, S.E. A modified matrix model to describe the seasonal population ecology of the European tick Ixodes ricinus. J. Appl. Ecol. 2011, 48, 1017–1028. [Google Scholar] [CrossRef]
  52. Perret, J.L.; Guigoz, E.; Rais, O.; Gern, L. Influence of saturation deficit and temperature on Ixodes ricinus tick questing activity in a Lyme borreliosis-endemic area (Switzerland). Parasitol. Res. 2000, 86, 554–557. [Google Scholar] [CrossRef]
  53. Gilbert, L. Altitudinal patterns of tick and host abundance: A potential role for climate change in regulating tick-borne diseases? Oecologia 2010, 162, 217–225. [Google Scholar] [CrossRef] [PubMed]
  54. Garcia-Martí, I.; Zurita-Milla, R.; Van Vliet, A.J.H.; Takken, W. Modelling and mapping tick dynamics using volunteered observations. Int. J. Health Geogr. 2017, 16, 41. [Google Scholar] [CrossRef] [PubMed]
  55. Rosà, R.; Andreo, V.; Tagliapietra, V.; Baráková, I.; Arnoldi, D.; Hauffe, H.C.; Manica, M.; Rosso, F.; Blaňarová, L.; Bona, M. Effect of climate and land use on the spatio-temporal variability of tick-borne bacteria in Europe. Int. J. Environ. Res. Public Health 2018, 15, 732. [Google Scholar] [CrossRef]
  56. Lindén, A.; Mäntyniemi, S. Using the negative binomial distribution to model overdispersion in ecological count data. Ecology 2011, 92, 1414–1421. [Google Scholar] [CrossRef] [PubMed]
  57. Anderson, D.R.; Burnham, K.P.; White, G.C. AIC model selection in overdispersed capture-recapture data. Ecology 1994, 75, 1780–1793. [Google Scholar] [CrossRef]
  58. Galante, P.J.; Alade, B.; Muscarella, R.; Jansa, S.A.; Goodman, S.M.; Anderson, R.P. The challenge of modeling niches and distributions for data-poor species: A comprehensive approach to model complexity. Ecography 2018, 41, 726–736. [Google Scholar] [CrossRef]
  59. Burnham, K.P.; Anderson, D.R.; Huyvaert, K.P. AIC model selection and multimodel inference in behavioral ecology: Some background, observations, and comparisons. Behav. Ecol. Sociobiol. 2011, 65, 23–35. [Google Scholar] [CrossRef]
  60. Yee, T.W.; Mitchell, N.D. Generalized additive models in plant ecology. J. Veg. Sci. 1991, 2, 587–602. [Google Scholar] [CrossRef]
  61. Hastie, T.; Tibshirani, R. Generalized additive models: Some applications. J. Am. Stat. Assoc. 1987, 82, 371–386. [Google Scholar] [CrossRef]
  62. Fushiki, T. Estimation of prediction error by using K-fold cross-validation. Stat. Comput. 2011, 21, 137–146. [Google Scholar] [CrossRef]
  63. de Rooij, M.; Weeda, W. Cross-Validation: A Method Every Psychologist Should Know. Adv. Methods Pract. Psychol. Sci. 2020, 3, 248–263. [Google Scholar] [CrossRef]
  64. Yates, L.A.; Aandahl, Z.; Richards, S.A.; Brook, B.W. Cross validation for model selection: A review with examples from ecology. Ecol. Monogr. 2023, 93, e1557. [Google Scholar] [CrossRef]
  65. Cortina, J.M. Interaction, Nonlinearity, and Multicollinearity: Implications for Multiple Regression. J. Manag. 1993, 19, 915–922. [Google Scholar] [CrossRef]
  66. Graham, M.H. Confronting Multicollinearity in Ecological Multiple Regression. Ecology 2003, 84, 2809–2815. [Google Scholar] [CrossRef]
  67. Schulze, T.L.; Jordan, R.A. Seasonal and long-term variations in abundance of adult Ixodes scapularis (Acari: Ixodidae) in different coastal plain habitats of New Jersey. J. Med. Entomol. 1996, 33, 963–970. [Google Scholar] [CrossRef] [PubMed]
  68. Kollars, T.M., Jr.; Oliver, J.H., Jr.; Kollars, P.G.; Durden, L.A. Seasonal activity and host associations of Ixodes scapularis (Acari: Ixodidae) in southeastern Missouri. J. Med. Entomol. 1999, 36, 720–726. [Google Scholar] [CrossRef]
  69. Agoulon, A.; Malandrin, L.; Lepigeon, F.; Vénisse, M.; Bonnet, S.; Becker, C.A.M.; Hoch, T.; Bastian, S.; Plantard, O.; Beaudeau, F. A vegetation index qualifying pasture edges is related to Ixodes ricinus density and to Babesia divergens seroprevalence in dairy cattle herds. Vet. Parasitol. 2012, 185, 101–109. [Google Scholar] [CrossRef]
  70. Vail, S.G.; Smith, G. Vertical movement and posture of blacklegged tick (Acari: Ixodidae) nymphs as a function of temperature and relative humidity in laboratory experiments. J. Med. Entomol. 2002, 39, 842–846. [Google Scholar] [CrossRef] [PubMed]
  71. Randolph, S.E.; Storey, K. Impact of microclimate on immature tick-rodent host interactions (Acari: Ixodidae): Implications for parasite transmission. J. Med. Entomol. 1999, 36, 741–748. [Google Scholar] [CrossRef] [PubMed]
  72. Brownstein, J.S.; Holford, T.R.; Fish, D. A climate-based model predicts the spatial distribution of the Lyme disease vector Ixodes scapularis in the United States. Environ. Health Perspect. 2003, 111, 1152–1157. [Google Scholar] [CrossRef]
  73. Brownstein, J.S.; Holford, T.R.; Fish, D. Effect of Climate Change on Lyme Disease Risk in North America. EcoHealth 2005, 2, 38–46. [Google Scholar] [CrossRef]
  74. Estrada-Peña, A.; Cutler, S.; Potkonjak, A.; Vassier-Tussaut, M.; Van Bortel, W.; Zeller, H.; Fernández-Ruiz, N.; Mihalca, A.D. An updated meta-analysis of the distribution and prevalence of Borrelia burgdorferi s.l. in ticks in Europe. Int. J. Health Geogr. 2018, 17, 41. [Google Scholar] [CrossRef]
  75. Clark, D.D. Lower temperature limits for activity of several Ixodid ticks (Acari: Ixodidae): Effects of body size and rate of temperature change. J. Med. Entomol. 1995, 32, 449–452. [Google Scholar] [CrossRef]
  76. Duffy, D.C.; Campbell, S.R. Ambient air temperature as a predictor of activity of adult Ixodes scapularis (Acari: Ixodidae). J. Med. Entomol. 1994, 31, 178–180. [Google Scholar] [CrossRef]
  77. Brownstein, J.S.; Skelly, D.K.; Holford, T.R.; Fish, D. Forest fragmentation predicts local scale heterogeneity of Lyme disease risk. Oecologia 2005, 146, 469–475. [Google Scholar] [CrossRef] [PubMed]
  78. Barrios, J.M.; Verstraeten, W.W.; Maes, P.; Clement, J.; Aerts, J.-M.; Farifteh, J.; Lagrou, K.; Van Ranst, M.; Coppin, P. Remotely sensed vegetation moisture as explanatory variable of Lyme borreliosis incidence. Int. J. Appl. Earth Obs. Geoinf. 2012, 18, 1–12. [Google Scholar] [CrossRef]
  79. Benedetti, R.; Rossini, P. On the use of NDVI profiles as a tool for agricultural statistics: The case study of wheat yield estimate and forecast in Emilia Romagna. Remote Sens. Environ. 1993, 45, 311–326. [Google Scholar] [CrossRef]
  80. Olson, C.A.; Cupp, E.W.; Luckhart, S.; Ribeiro, J.M.C.; Levy, C. Occurrence of Ixodes pacificus (Parasitiformes: Ixodidae) in Arizona. J. Med. Entomol. 1992, 29, 1060–1062. [Google Scholar] [CrossRef] [PubMed]
  81. Schulze, T.L.; Jordan, R.A. Meteorologically mediated diurnal questing of Ixodes scapularis and Amblyomma americanum (Acari: Ixodidae) nymphs. J. Med. Entomol. 2003, 40, 395–402. [Google Scholar] [CrossRef]
  82. Goddard, J. Ecological studies of adult Ixodes scapularis in central Mississippi: Questing activity in relation to time of year, vegetation type, and meteorologic conditions. J. Med. Entomol. 1992, 29, 501–506. [Google Scholar] [CrossRef]
  83. Das, A.; Lele, S.R.; Glass, G.E.; Shields, T.; Patz, J. Modelling a discrete spatial response using generalized linear mixed models: Application to Lyme disease vectors. Int. J. Geogr. Inf. Sci. 2002, 16, 151–166. [Google Scholar] [CrossRef]
  84. Battaly, G.R.; Fish, D. Relative importance of bird species as hosts for immature Ixodes dammini (Acari: Ixodidae) in a suburban residential landscape of southern New York State. J. Med. Entomol. 1993, 30, 740–747. [Google Scholar] [CrossRef]
  85. Fish, D.; Daniels, T.J. The role of medium-sized mammals as reservoirs of Borrelia burgdorferi in southern New York. J. Wildl. Dis. 1990, 26, 339–345. [Google Scholar] [CrossRef]
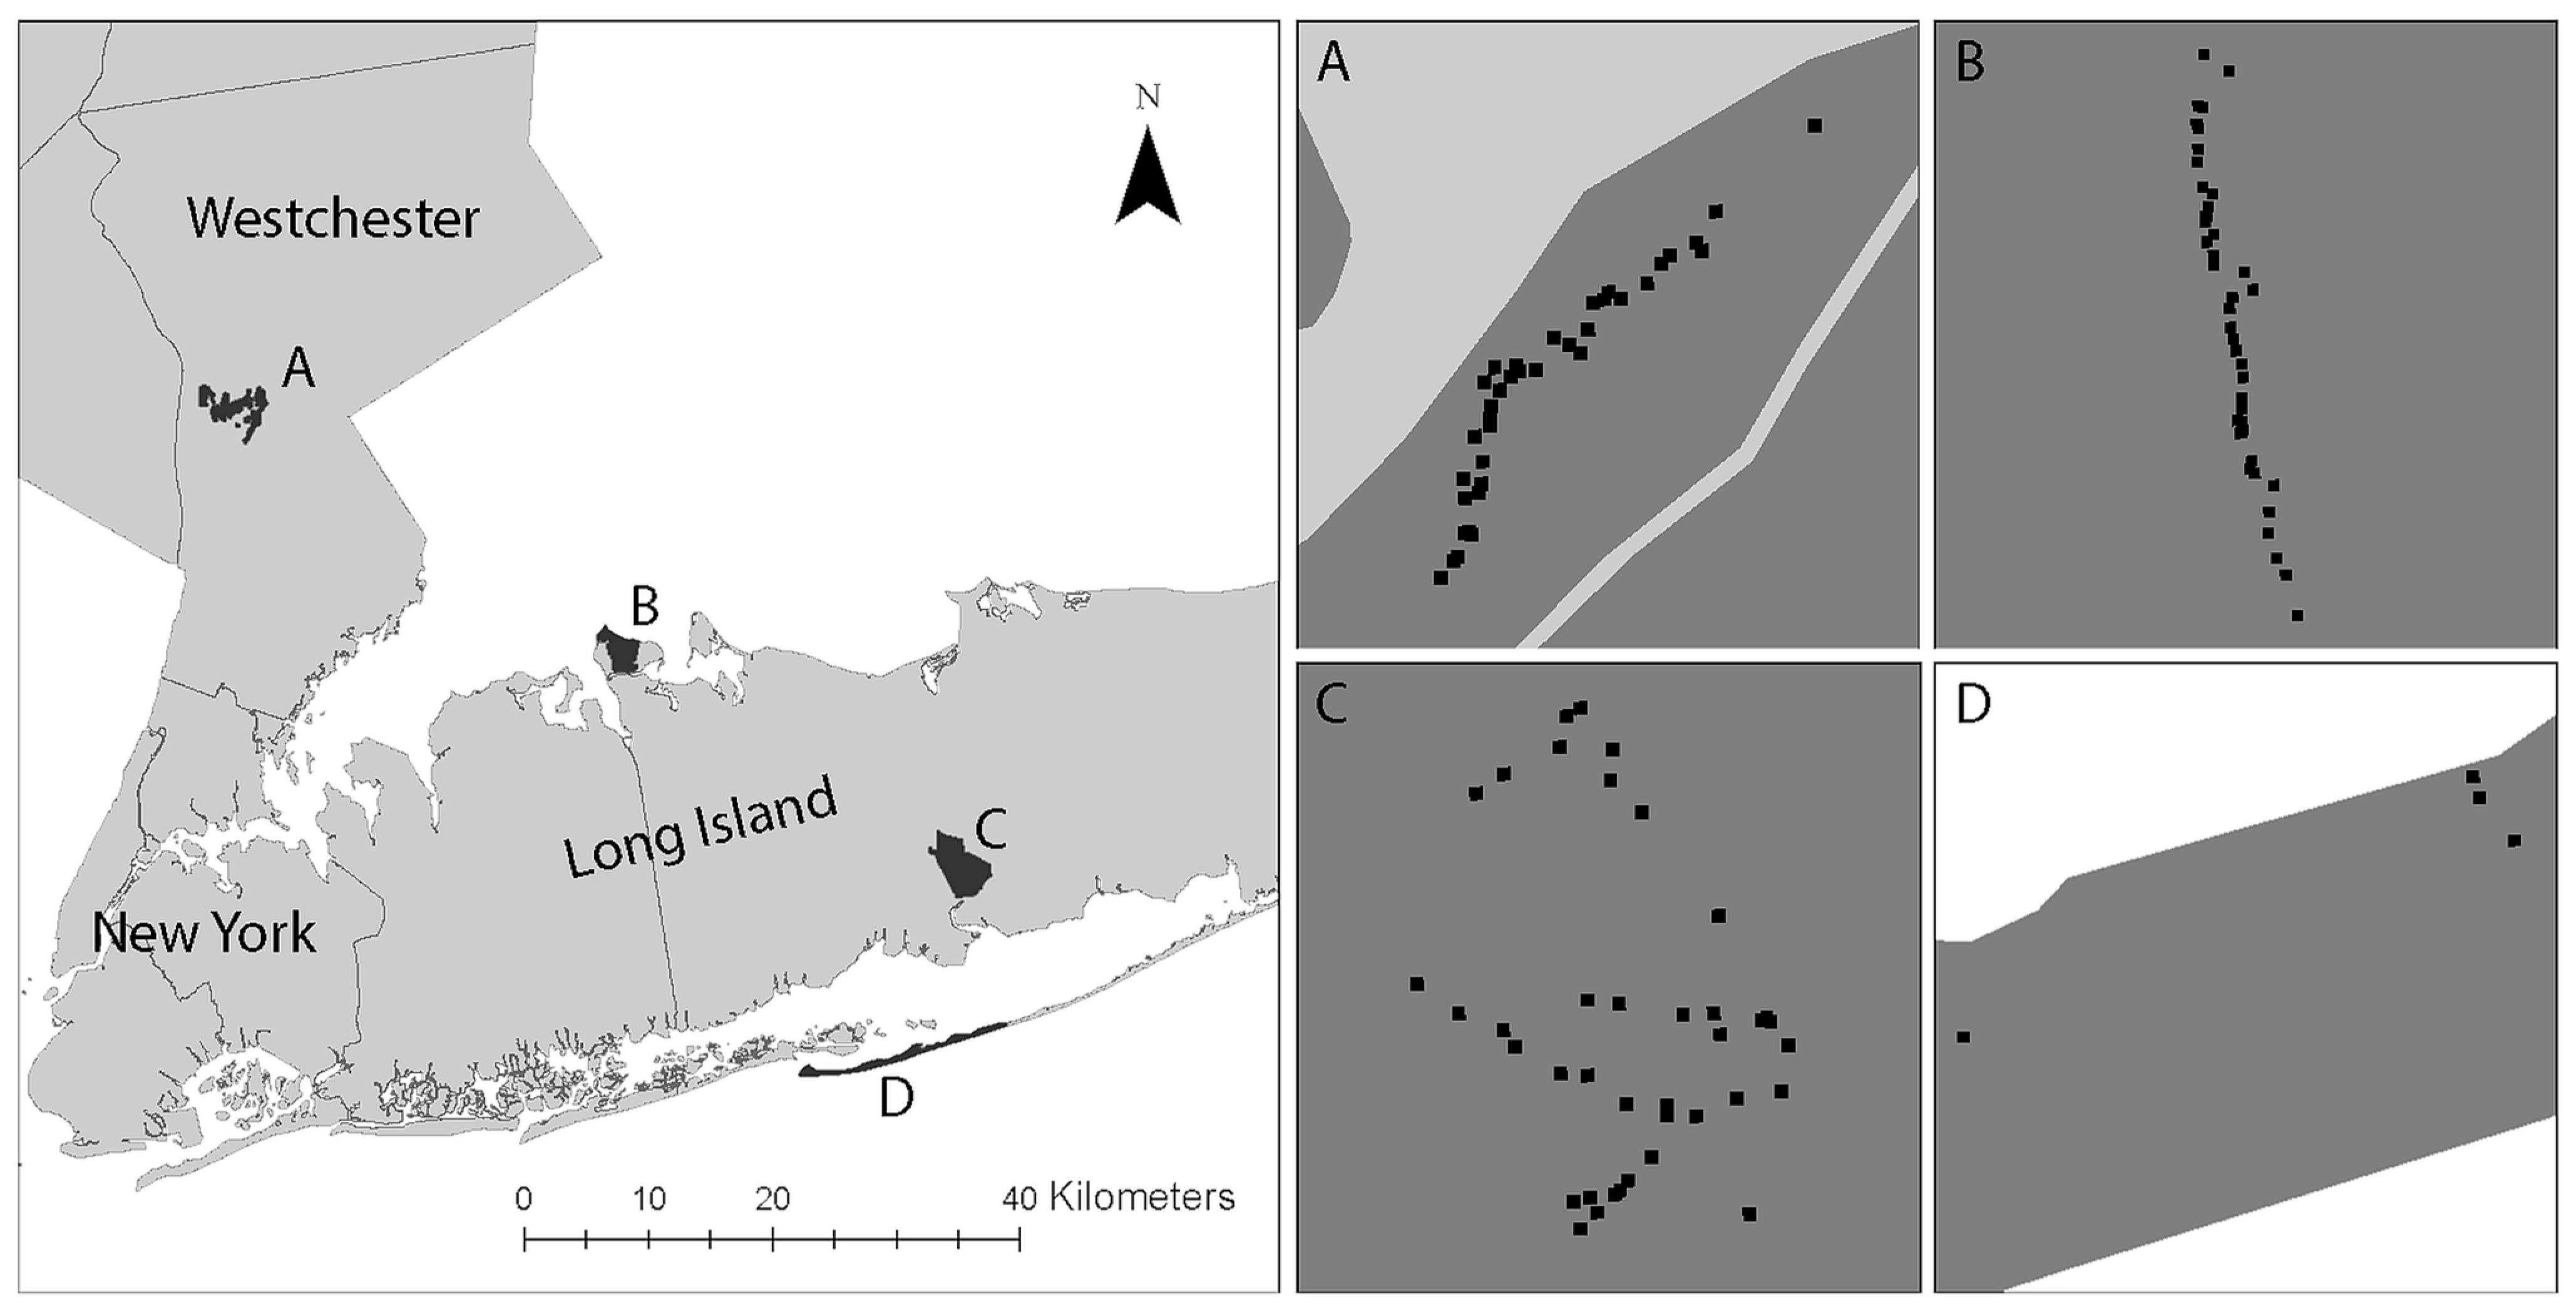
Figure 1. Study area and sampling sites: (A) Rockefeller Park Preserve, RPP; (B) Caumsett State Park, CSP; (C) Connetquot River State Park, CRSP; (D) Fire Island National Seashore, FINS. All four parks are near New York City and in suburban areas. The black dots are the locations of the 5 m by 5 m sampling sites where questing blacklegged ticks were collected.
Applsci 13 11587 g001
Figure 2. Landscapes of the Four New York City Suburban Parks. The parks represent the typical landscapes in suburban New York with various levels of fragmentation, diverse land-cover types, and different vegetation compositions.
Applsci 13 11587 g002
Figure 3. Ecotone Inside Sampling Site. An ecotone is the boundary between different vegetation land-cover types. The length of ecotone is one indicator of the diversity, fragmentation, and heterogeneity of the land-cover types.
Applsci 13 11587 g003
Figure 4. Statistics of Questing Black-legged Tick. The number of questing black-legged ticks varies significantly across time and between the four parks. Overall, temperature has a positive correlation with the questing tick numbers. Parks with more vegetation land cover also have higher numbers.
Applsci 13 11587 g004
Figure 5. Total Number of Questing Blacklegged Ticks and Temperature in Each Sampling Site. Blue and red lines are fitted total number of questing ticks using linear and generalized additive models, respectively. Shaded areas are their standard error bounds. The relationship between the number of questing ticks and temperature is nonlinear and varies across parks. The number peaks at approximately 20 °C. Black-legged ticks still quest under 0 °C.
Applsci 13 11587 g005
Figure 6. Total Number of Questing Blacklegged Ticks and Relative Humidity in Each Sampling Site. Blue and red lines are fitted total number of questing ticks using linear and generalized additive models, respectively. Shaded areas are their standard error bounds. In the natural environment, the influence of relative humidity on the questing activity of black-legged ticks is complex. Extreme low or high relative humidity seems to negatively affect the number of questing ticks.
Applsci 13 11587 g006
Figure 7. Linearity and nonlinearity revealed through the generalized additive model (GAM). The Y axes are transformed by the negative binomial function. GAM favors a linear relationship between temperature and the transformed number of questing ticks. By contrast, the relative humidity has a complex nonlinear relationship.
Applsci 13 11587 g007aApplsci 13 11587 g007b
Figure 8. Landscape of hardwood forest (CSP, left) and seashore (FINS, right). The two parks have drastically different land-cover types in the sampling sites. CSP has large areas covered by hardwood trees, whereas FINS is mainly covered by short shrubs in a very dry condition.
Applsci 13 11587 g008
Table 1. Environment of the Study Areas.
Study AreaLand CoverWildlife
Caumsett State Park
(CSP), Suffolk County,
New York
https://parks.ny.gov/ (access on 31 May 2019)
Dominated by oak–tulip forest (2.78 sq km). Other component land cover consists of costal oak–hickory forest (0.54 sq km), low salt marsh (0.36 sq km), successional shrubland (0.09 sq km), and salt shrubland (0.07 sq km).The major resident mammal species is the white-tailed deer. CSP is home to a wide variety of migratory bird species (e.g., Canada Geese).
Connetquot River State Park
(CRSP), Suffolk County,
New York
https://www.dec.ny.gov/outdoor/61668.html (access on 31 May 2019)
Land cover consisting of sandy pine barrens, wetlands, ponds, and oak brush plains provides refuge for more than 300 plant species.CRSP is home to several mammal species (e.g., white-tailed deer, red fox, eastern cottontail rabbit, chipmunks), reptiles, 200 birds.
Rockefeller Park Preserve
(RPP), Westchester County,
New York
https://www.inaturalist.org/ (access on 31 May 2019)
Primarily covered by hardwood forest. Dominant plant species include huge oak, tulip poplar, maple, and beech trees.RPP supports 202 species of resident and migratory birds, reptiles, amphibians, and mammals (e.g., white tailed deer, eastern grey squirrel).
Fire Island National Seashore
(FINS), Suffolk County,
New York
https://www.nps.gov/index.htm (access on 31 May 2019)
Main land cover includes beaches, sand dunes, interdune scrub, maritime forest, and wetland habitats. The severe environment only supports a few plant species (e.g., beach grasslands, pitch pine woodlands, bearberry dwarf scrubs).In addition to a number of terrestrial mammal species (e.g., white tailed deer, red fox, eastern cottontail rabbits, white footed mouse) identified on the seashore, it is home to a wide variety of species including migratory birds, marine mammals, and reptiles.
Table 2. Sampling Results.
DateLocation# of SitesTotal of Adult Ticks
( μ ,   σ )
Total of Nymph
( μ ,   σ )
12 May 2017Caumsett SP11109 (9.90, 4.99)0
27 October 2017Caumsett SP16113 (7.06, 3.86)0
1 September 2017Connetquot River SP30209 (6.74, 5.13)0
15 September 2017Rockefeller Park Preserve3588 (2.44, 1.91)0
26 April 2018Caumsett SP347 (15.67, 13.43)0
4 May 2018Connetquot River SP10162 (14.73, 20.80)0
24 May 2018Caumsett SP854 (6.75, 5.68)0
7 June 2018Caumsett SP710 (1.43, 1.27)101 (14.42, 3.46)
14 June 2018Fire Island NS404 (1, 1.15)
Total 124792105
Table 3. Negative Binomial Regression Modeling Results.
ModelSpecificationAICc
( Δ AICc)
θ ^ (se)CVc
(Normalized)
Pseudo-R2
NagelkerkeAdjusted McFadden
NullTick count ~ 1490.25 (0.00)0.94 (0.17)6.04 (0.086)0.000.00
FullTick count ~ temperature + relative humidity + season + solar + elevation + ndvi + ecotone length + land cover *455.22 (35.03)2.67 (0.62)5.86 (0.084)0.570.10
AlternativeTick count ~ elevation + relative humidity + season + ndvi + ecotone length449.15 (41.10)2.01 (0.43)5.57 (0.080)0.470.10
CalibratedTick count ~ temperature + relative humidity + land cover *440.90 (49.35)2.69 (0.70)5.12 (0.073)0.550.11
N = 80 (after excluding the records with incomplete items). * Land cover includes percentages of four land-cover types: mixed hardwoods, dwarf shrubs, grasslands, and pine forest. θ ^ (se) is the estimated dispersion parameter and standard error. When the dispersion is zero, the distribution becomes a Poisson. CVc is the corrected prediction error (RMSE) from a leave-one-out cross validation. It is normalized by Ymax − Ymin. The mean and standard deviation of Y are 7.19 and 9.91, respectively.
Table 4. Results of the Calibrated and Alternative Negative Binomial Regression Models.
VariableCalibrated ModelAlternative Model
log(IRR)95% CIlog(IRR)95% CI
Temperature0.07 ***0.05, 0.09--
Relative Humidity0.03 **0.01, 0.040.025 *0.00, 0.05
Land Cover Percentage
     Mixed Hardwood7.0 ***3.5, 12--
     Dwarf Shrub7.3 ***3.4, 13--
     Grassland6.2 *1.3, 13--
     Pine Forest5.1 *1.4, 11--
Season--3.51 ***1.6, 5.4
Elevation 0.023 *0.00, 0.05
NDVI--2.23 *0.26, 4.2
Ecotone Length--0.0046−0.02, 0.03
IRR = incidence rate ratio (equivalent to estimated coefficient). CI = confidence interval. Significance Level: 0 ‘***’ 0.001 ‘**’ 0.01 ‘*’ 0.05.
Table 5. Generalized Additive Model Estimation.
VariableEDF χ 2 p-Value
Temperature164.786<0.001 ***
Relative Humidity6.0529.834<0.001 ***
Vegetation Land Cover Percentage
     Mixed Hardwood112.029<0.001 ***
     Dwarf Shrub4.00222.226<0.001 ***
     Grassland17.0380.008 **
     Pine Forest15.9730.015 *
1 EDF = effective degree of freedom. An EDF of 1 means the model fits a linear relationship between the independent and dependent variables. A higher EDF implies more complex non-linear relationships. χ 2 is the test statistic for the significance of the smoothing terms. A I C c = 438.86 ,   P s e u d o R 2 = 0.52 . Significance Level: 0 ‘***’ 0.001 ‘**’ 0.01 ‘*’ 0.05.
Disclaimer/Publisher’s Note: The statements, opinions and data contained in all publications are solely those of the individual author(s) and contributor(s) and not of MDPI and/or the editor(s). MDPI and/or the editor(s) disclaim responsibility for any injury to people or property resulting from any ideas, methods, instructions or products referred to in the content.