

Three-Dimensional Numerical Simulation of the Water Flow Effect on a Temporary Pier with Three Columns in Series
Abstract
:1. Introduction
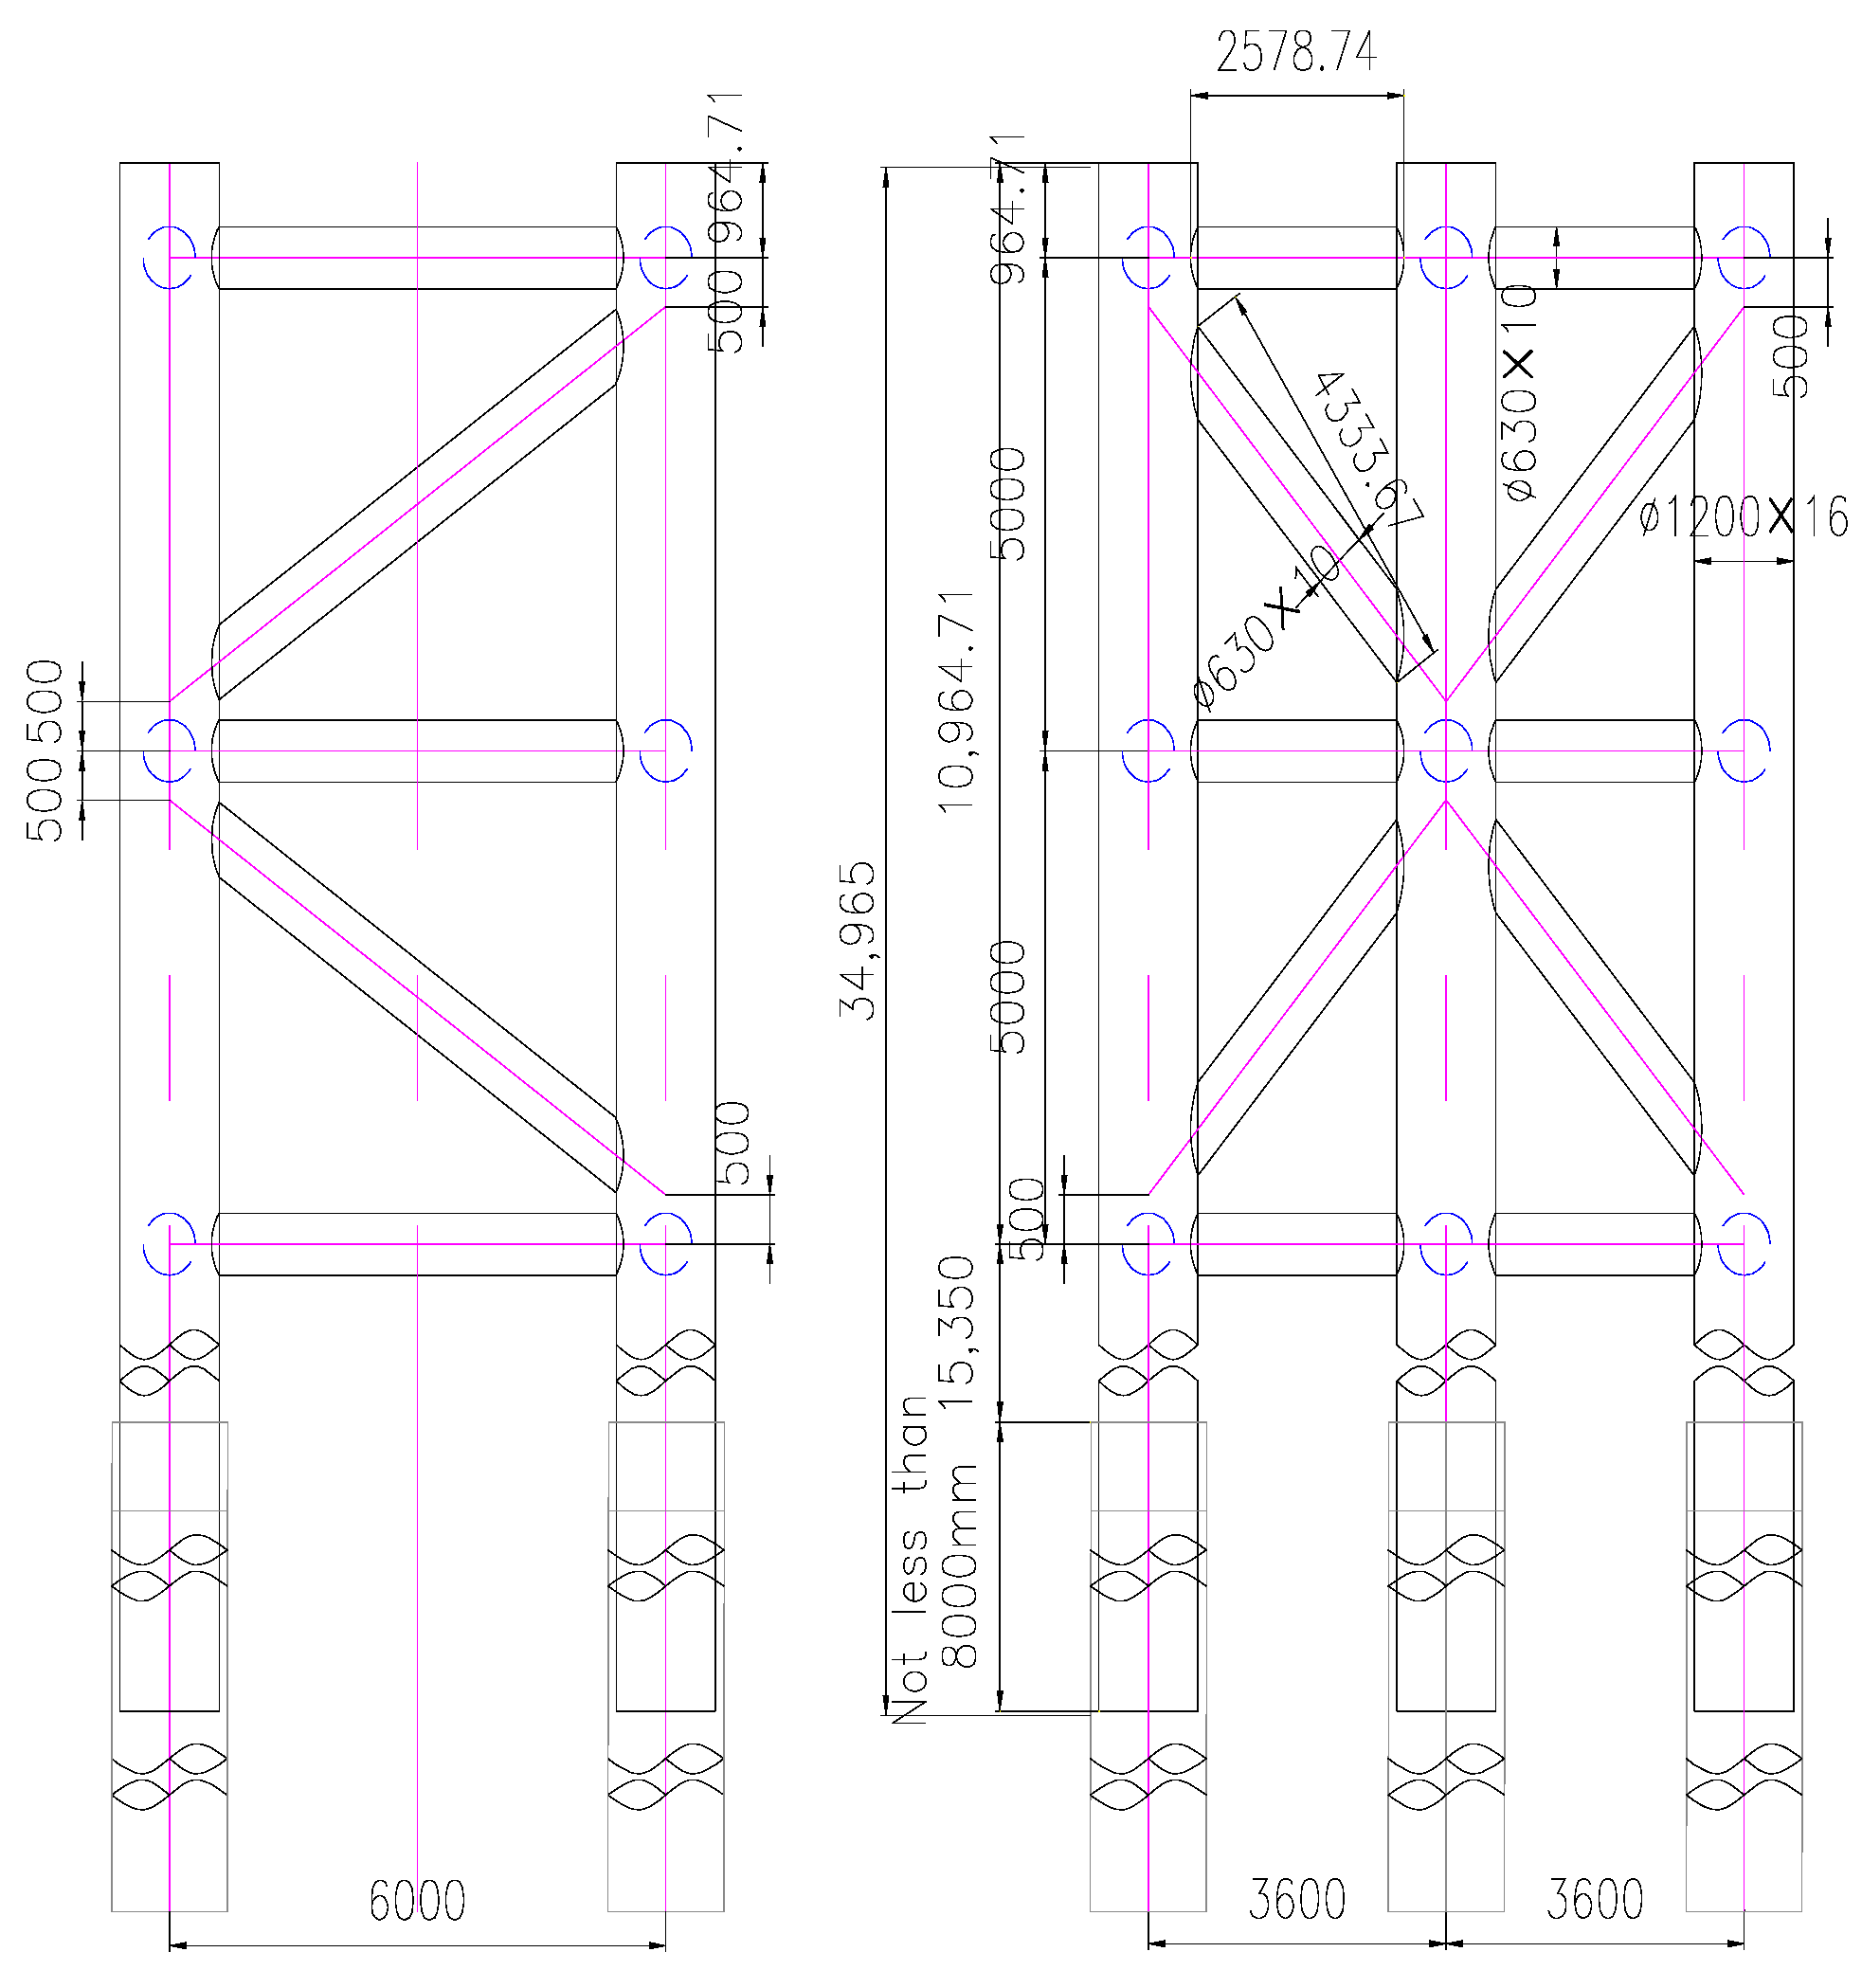
2. Project Overview
3. Numerical Simulation
3.1. Theoretical Model
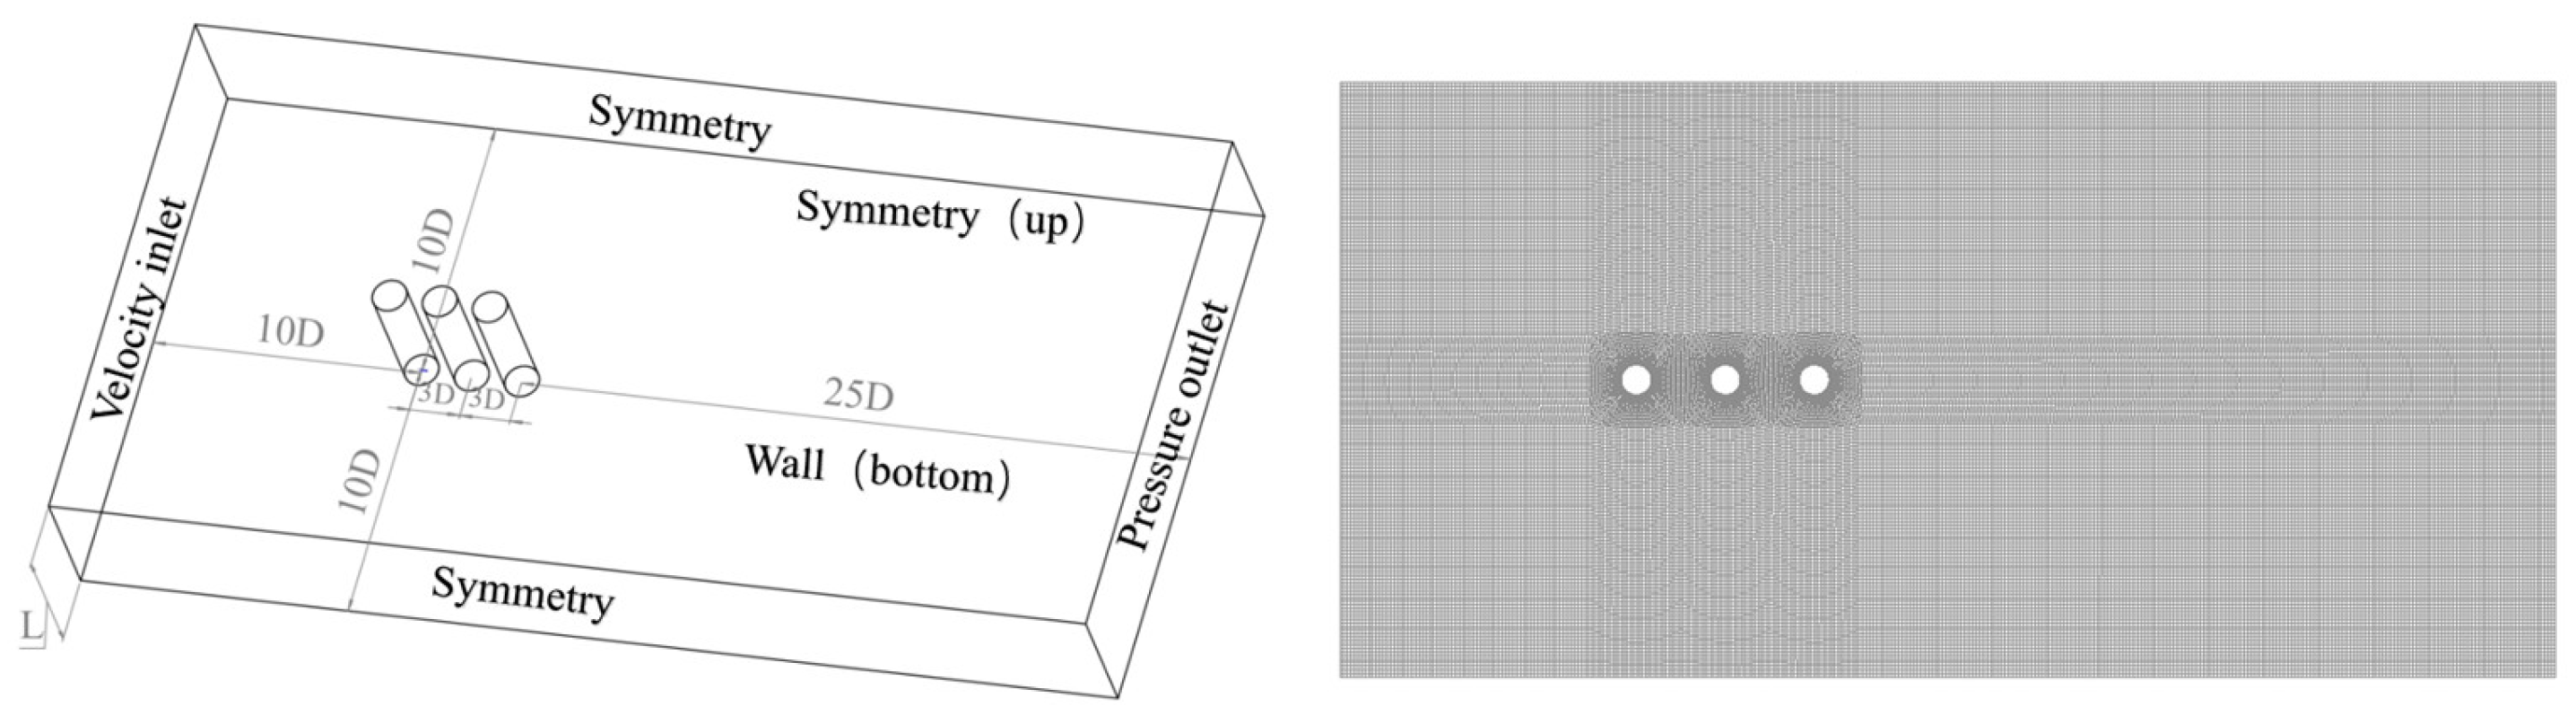
3.2. Numerical Model
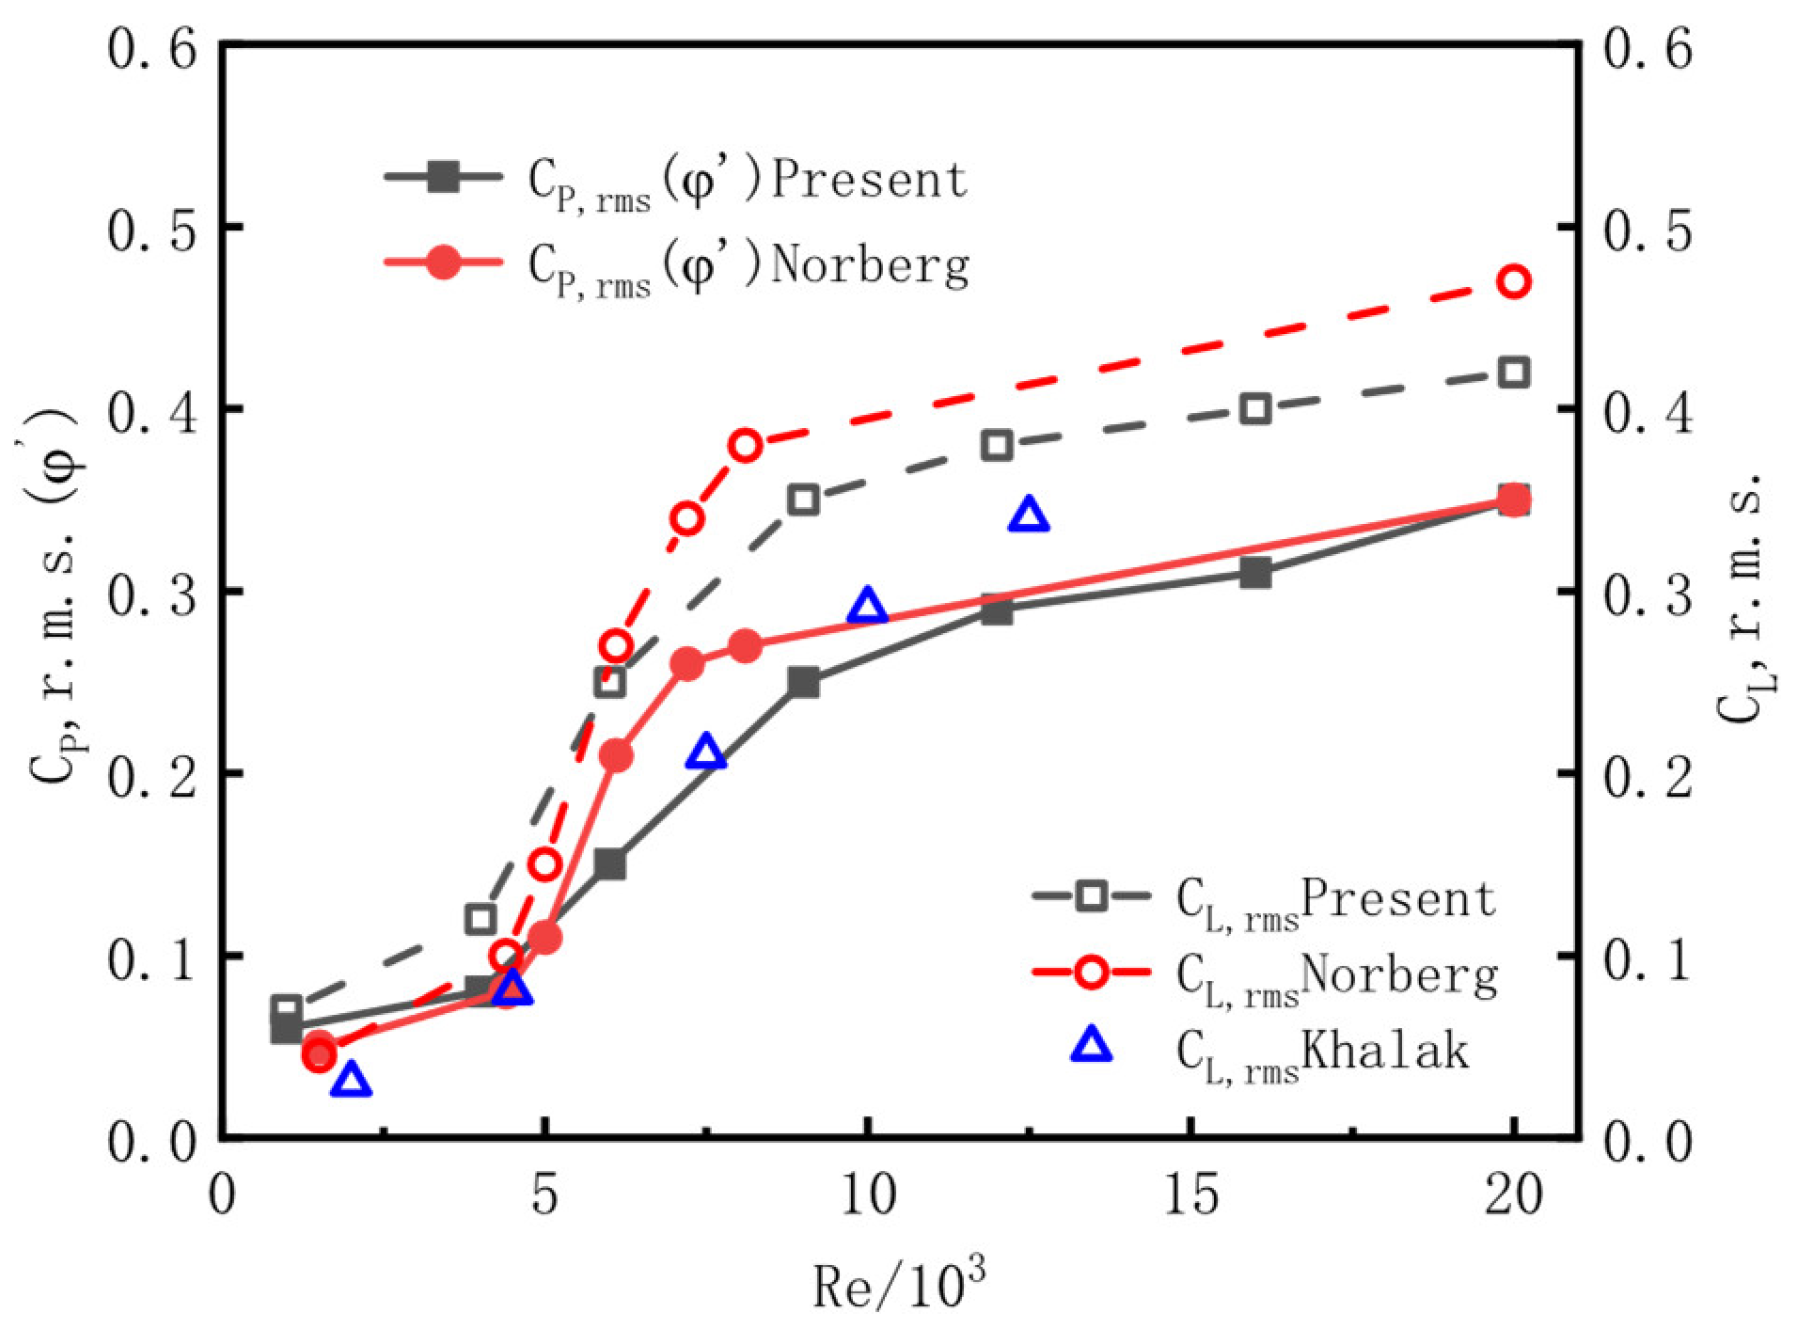
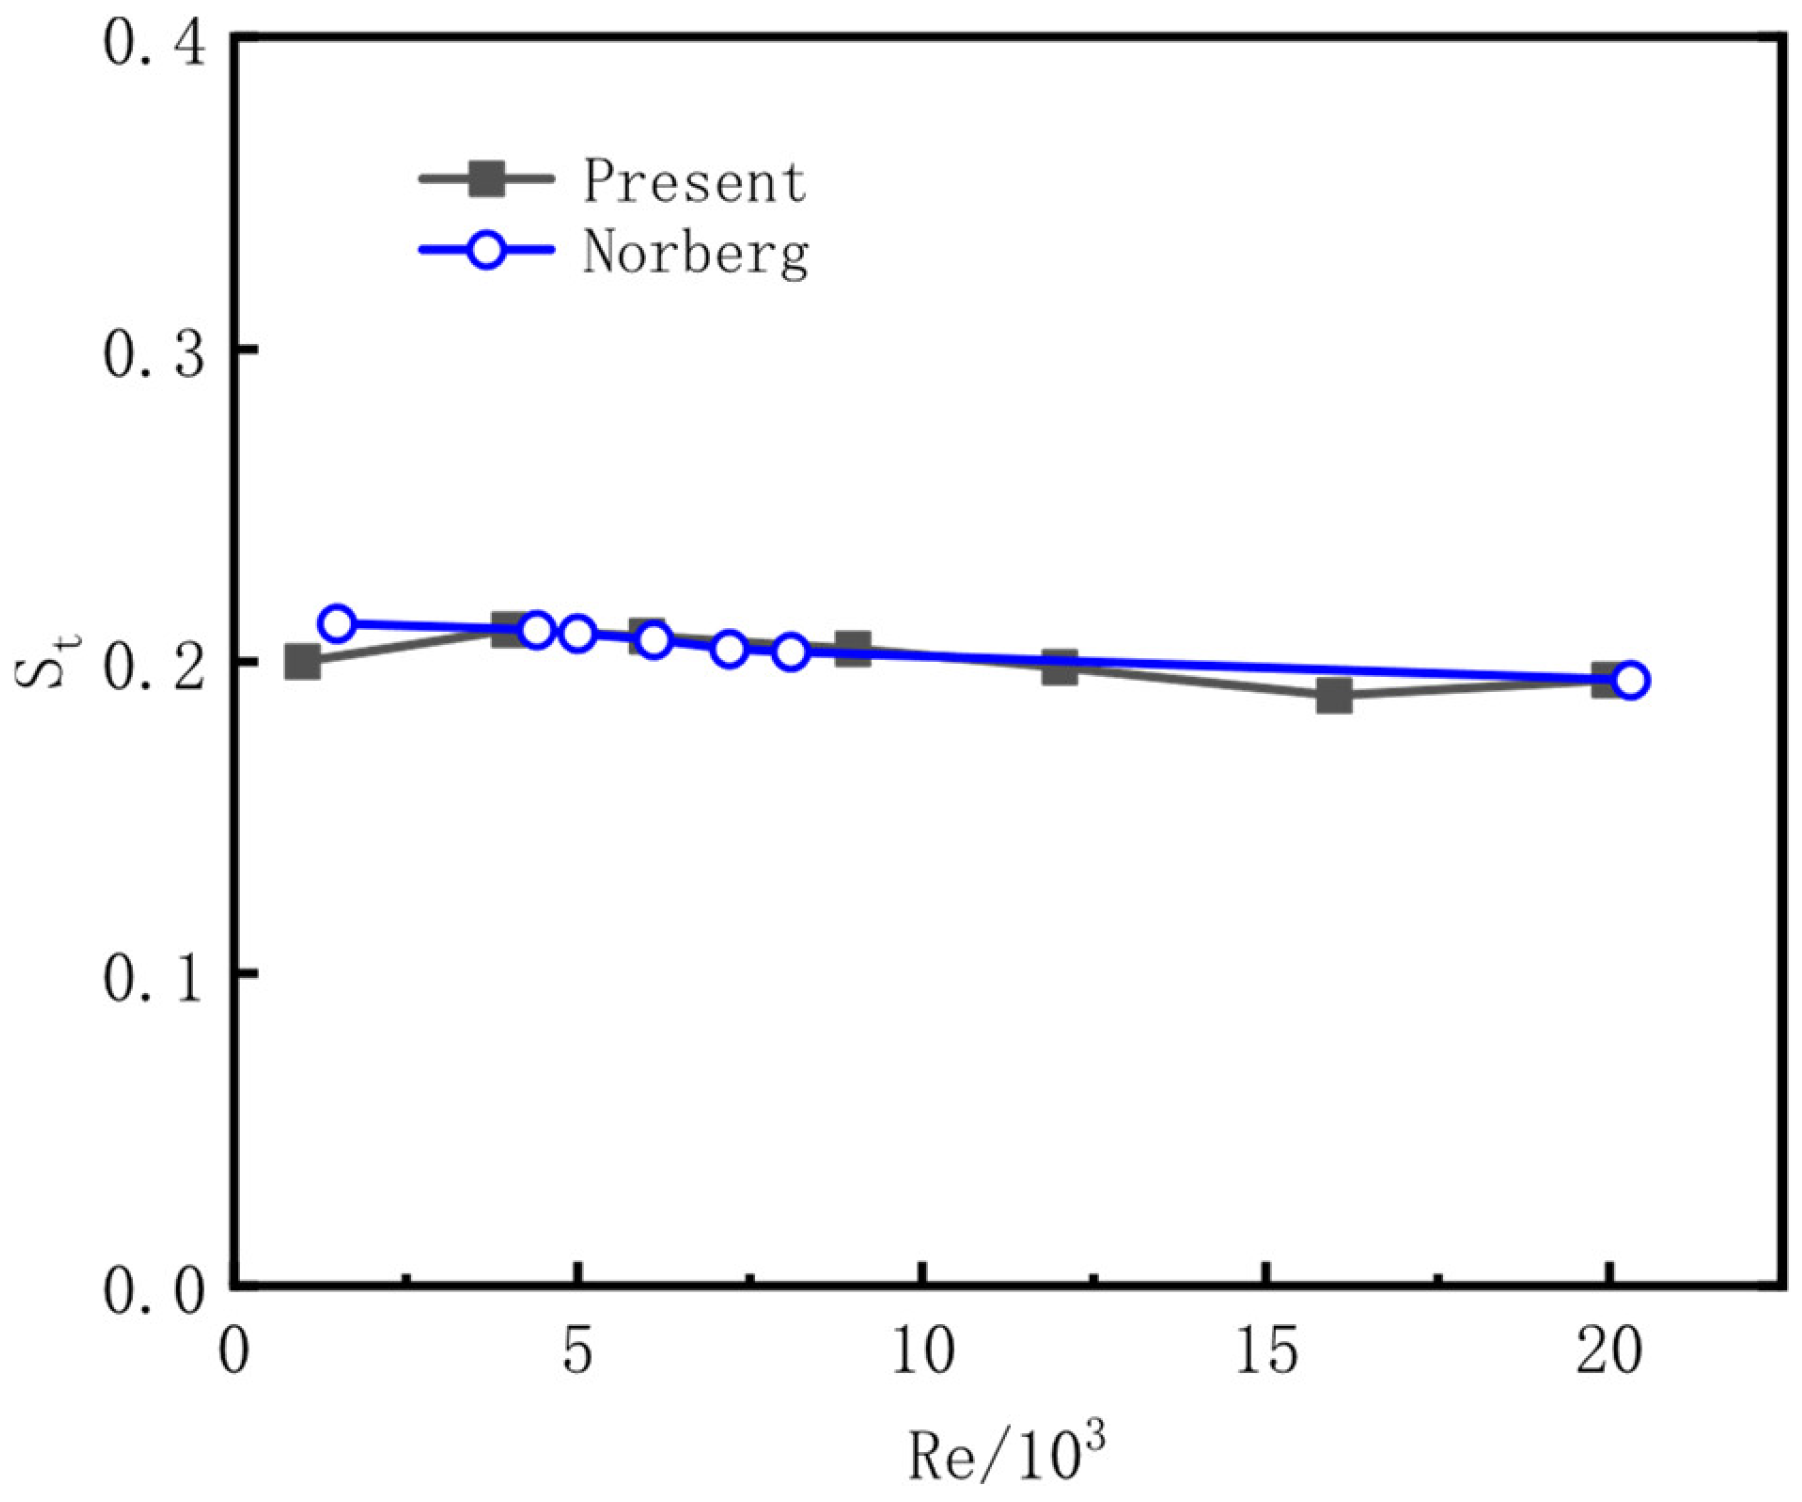
3.3. Parameter Selection and Model Correctness Verification
- is the frequency of vortex shedding and is the diameter of the cylinder.
- and are the lift coefficient and the drag coefficient, respectively, whose value depends on the characteristics of the cylinder surface and the Reynolds number. The expression iswhere is the fluid velocity; is the fluid density; is the downstream projection area of the submerged part of the temporary pier; and are resistance perpendicular to the flow direction and resistance in the downstream direction, respectively, namely the lift and resistance of the cylinder.
4. Comparison between Numerical Simulation and Analytical Methods
4.1. The Morison Equation Is Used by Calculating the Water Pressure
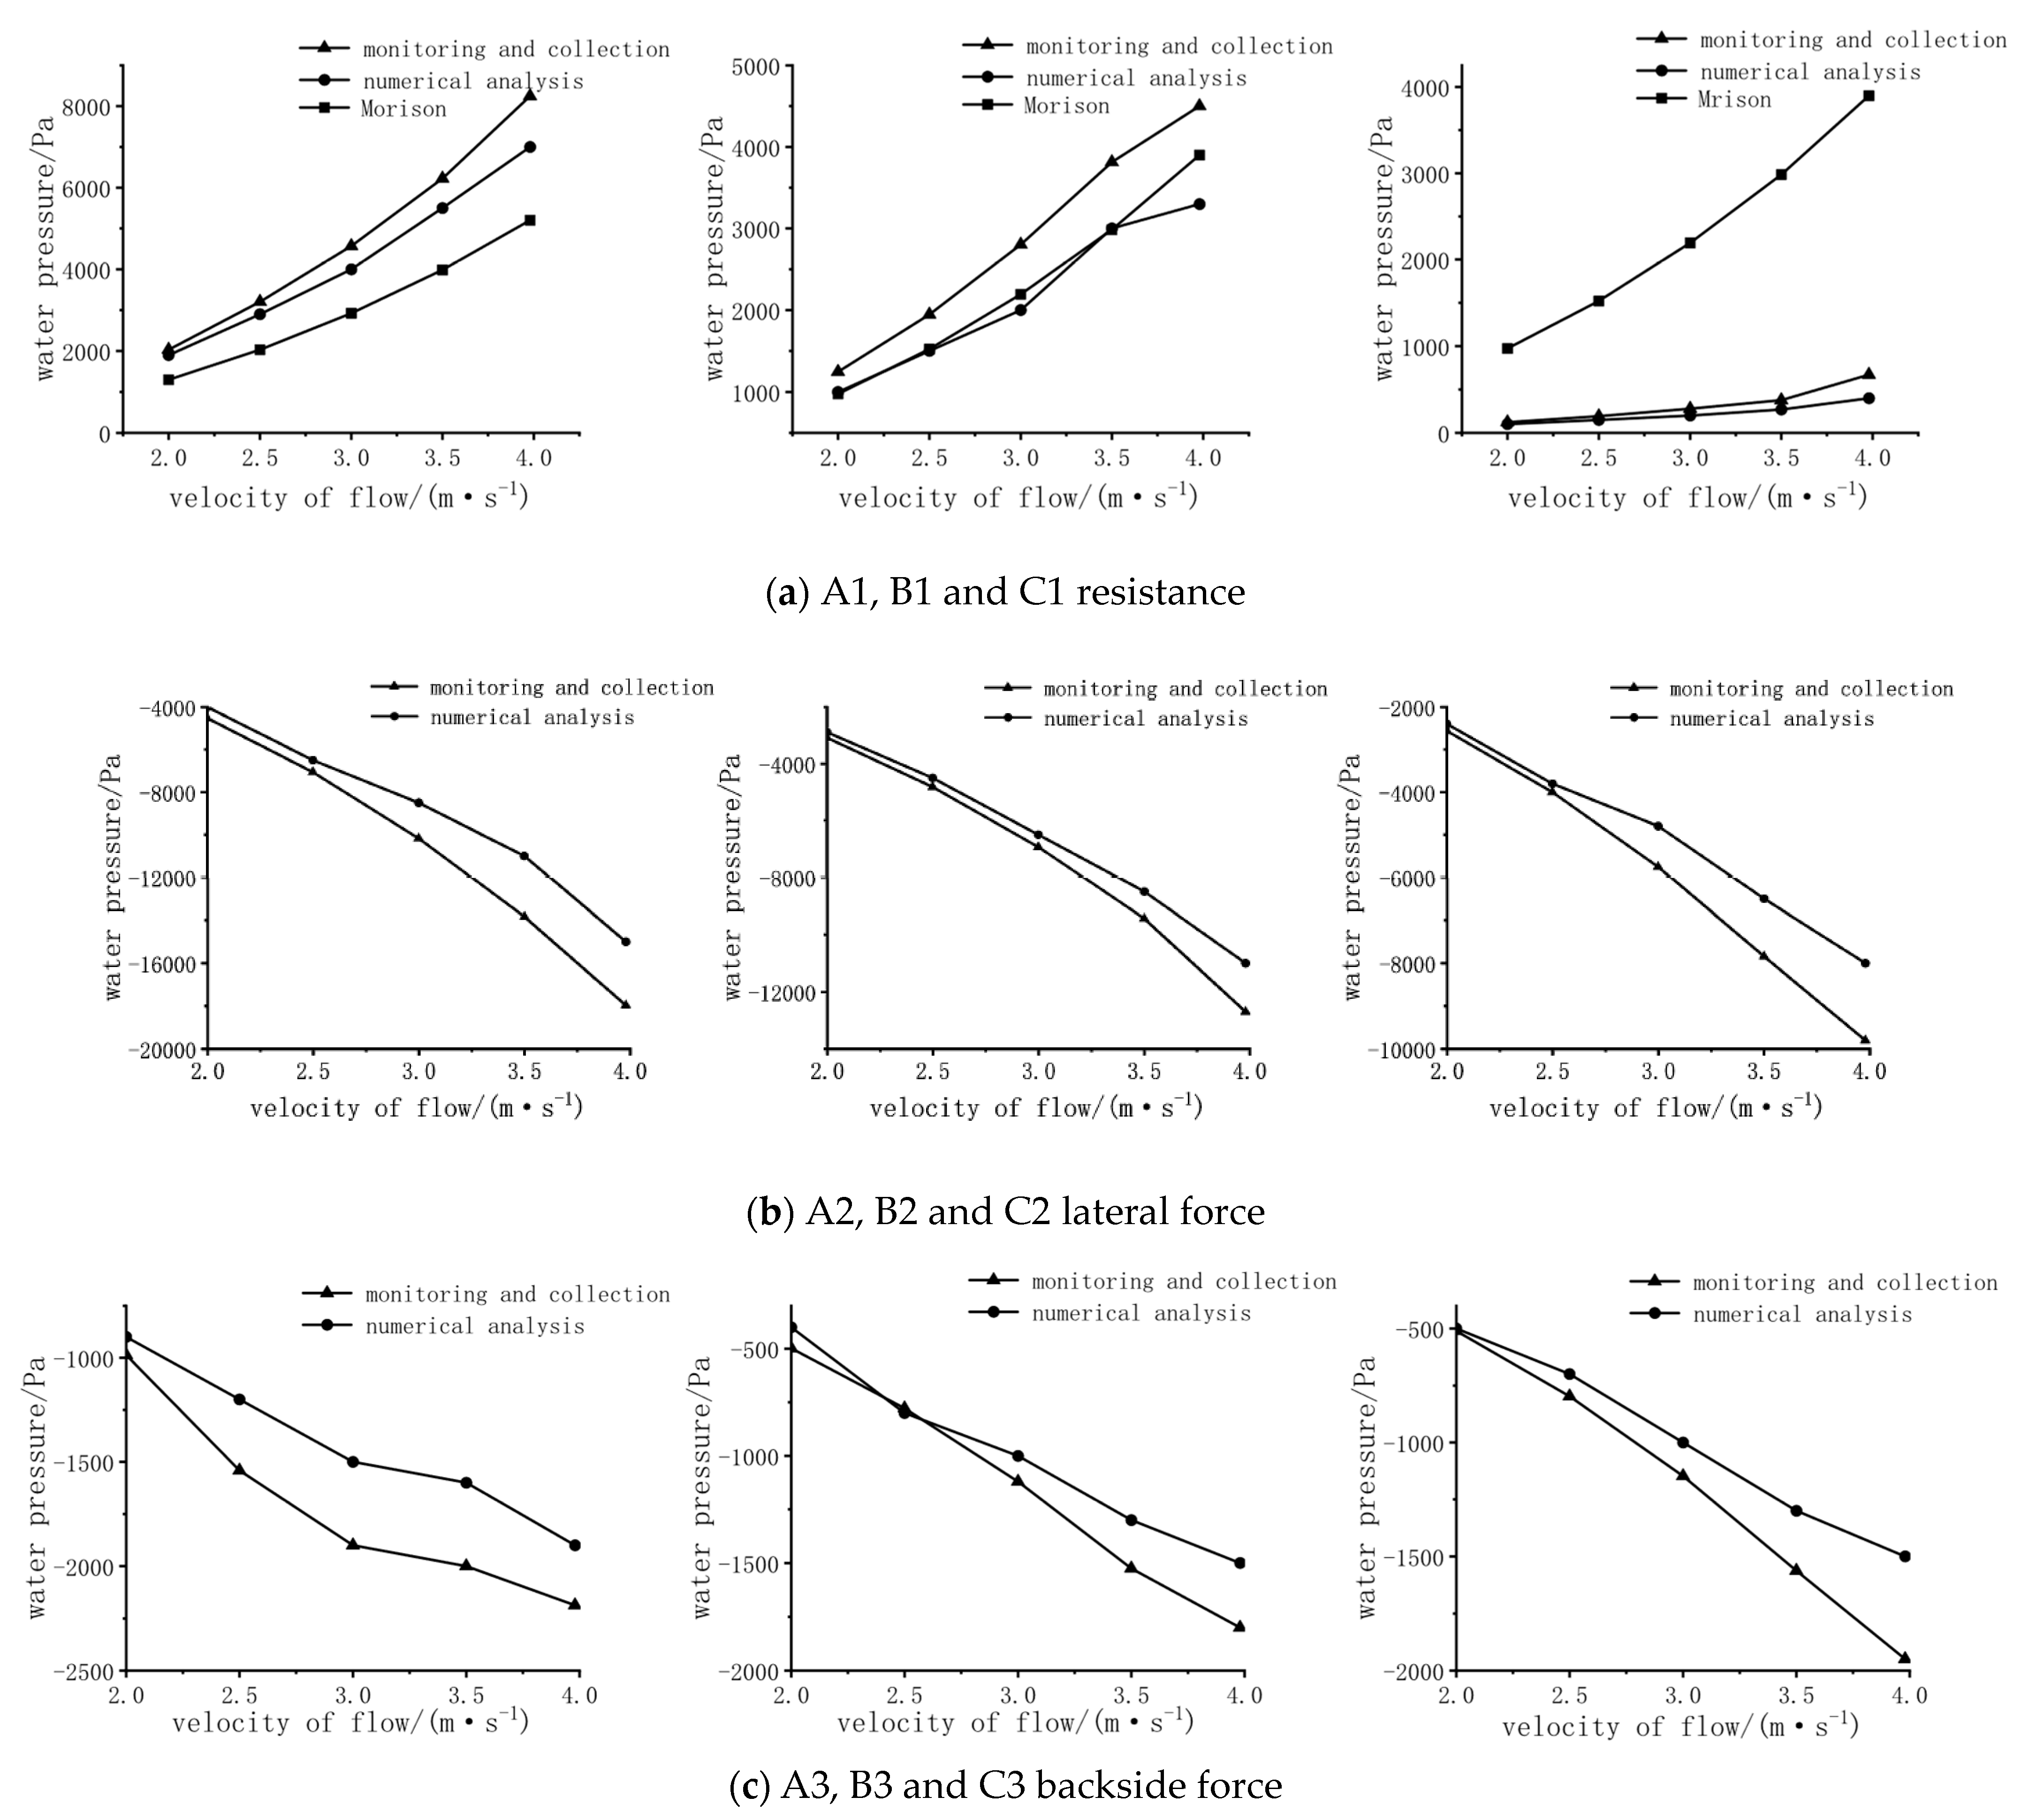
4.2. Data Comparison
5. Numerical Results and Discussions
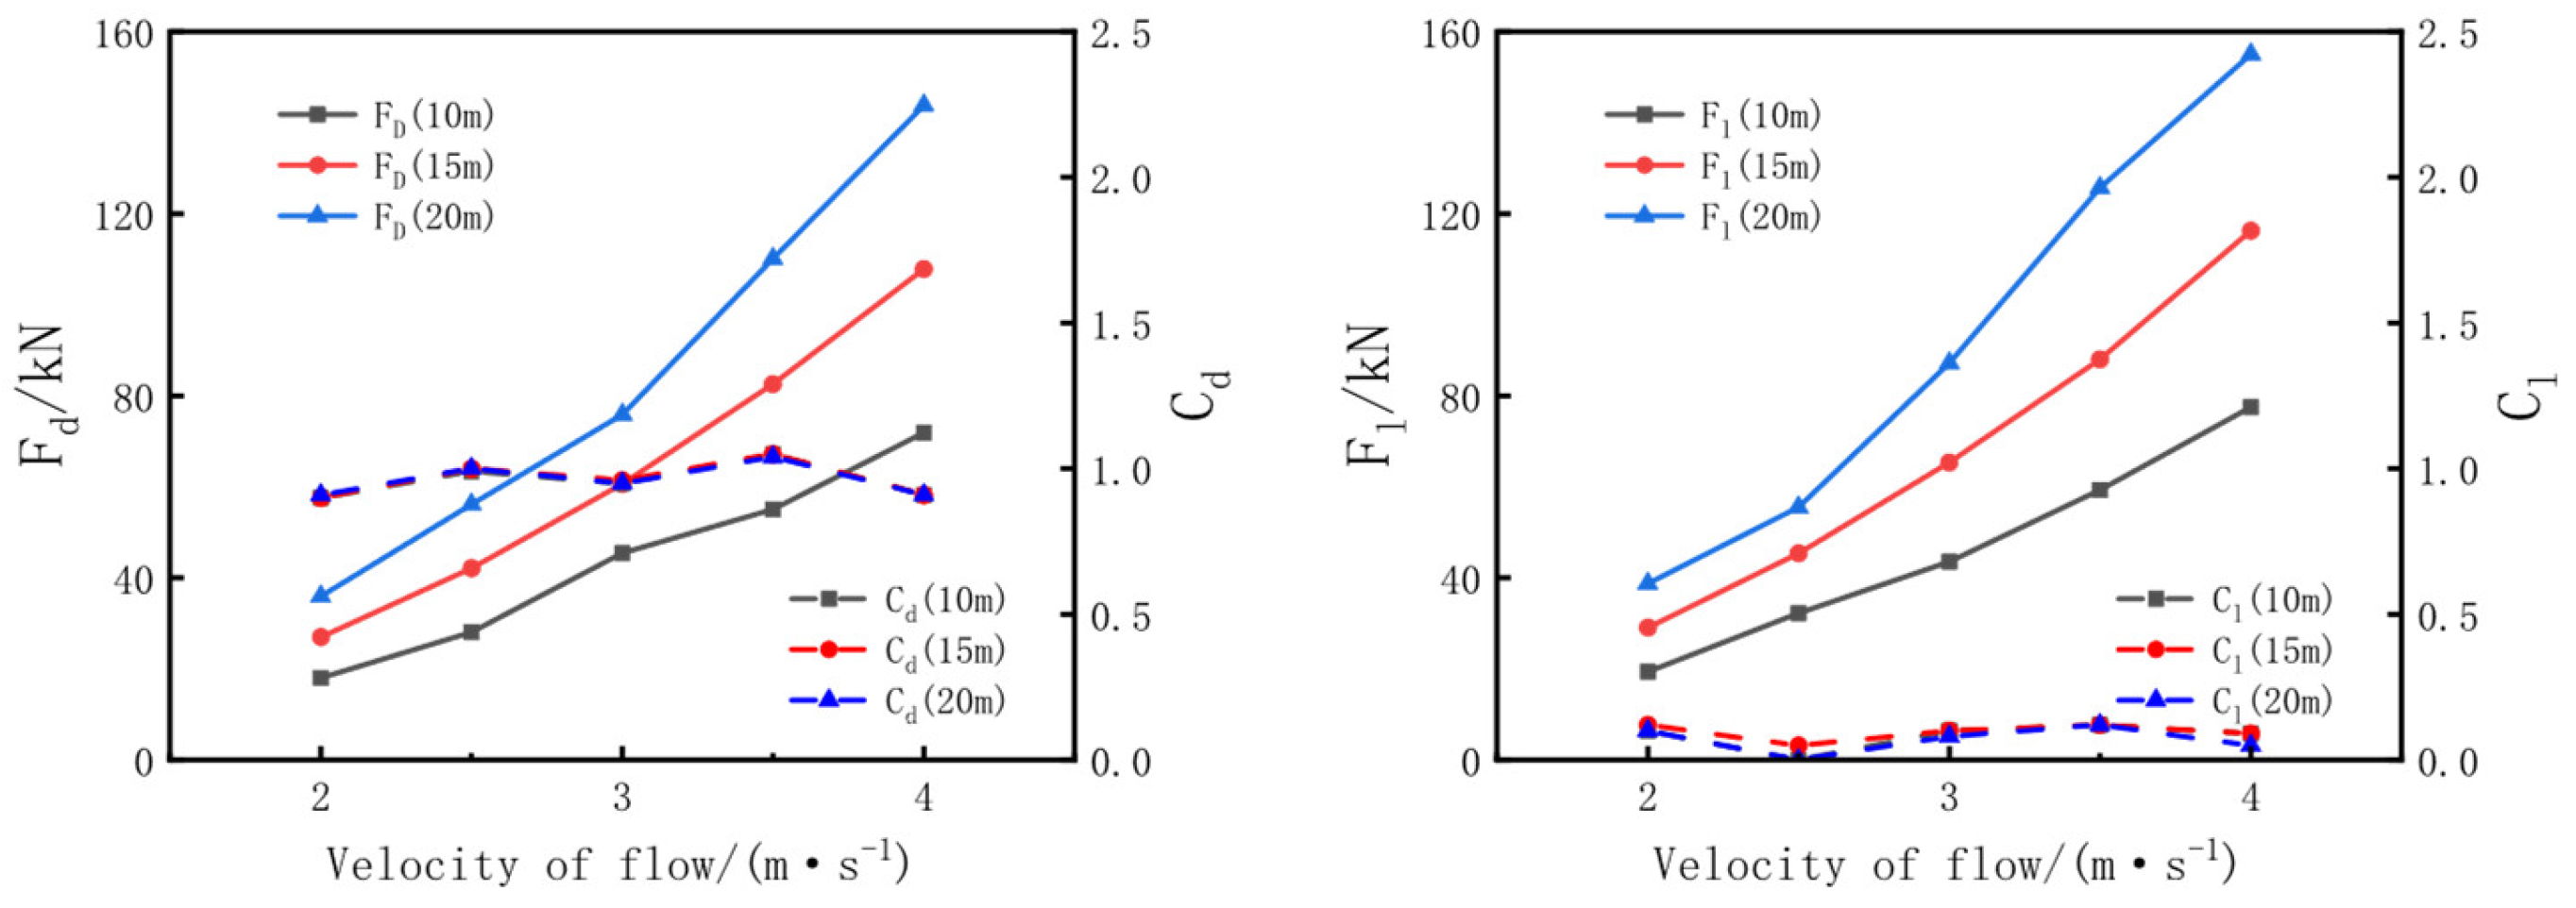
5.1. Water Force of Temporary Pier
5.2. Surface Pressure of the Temporary Pier
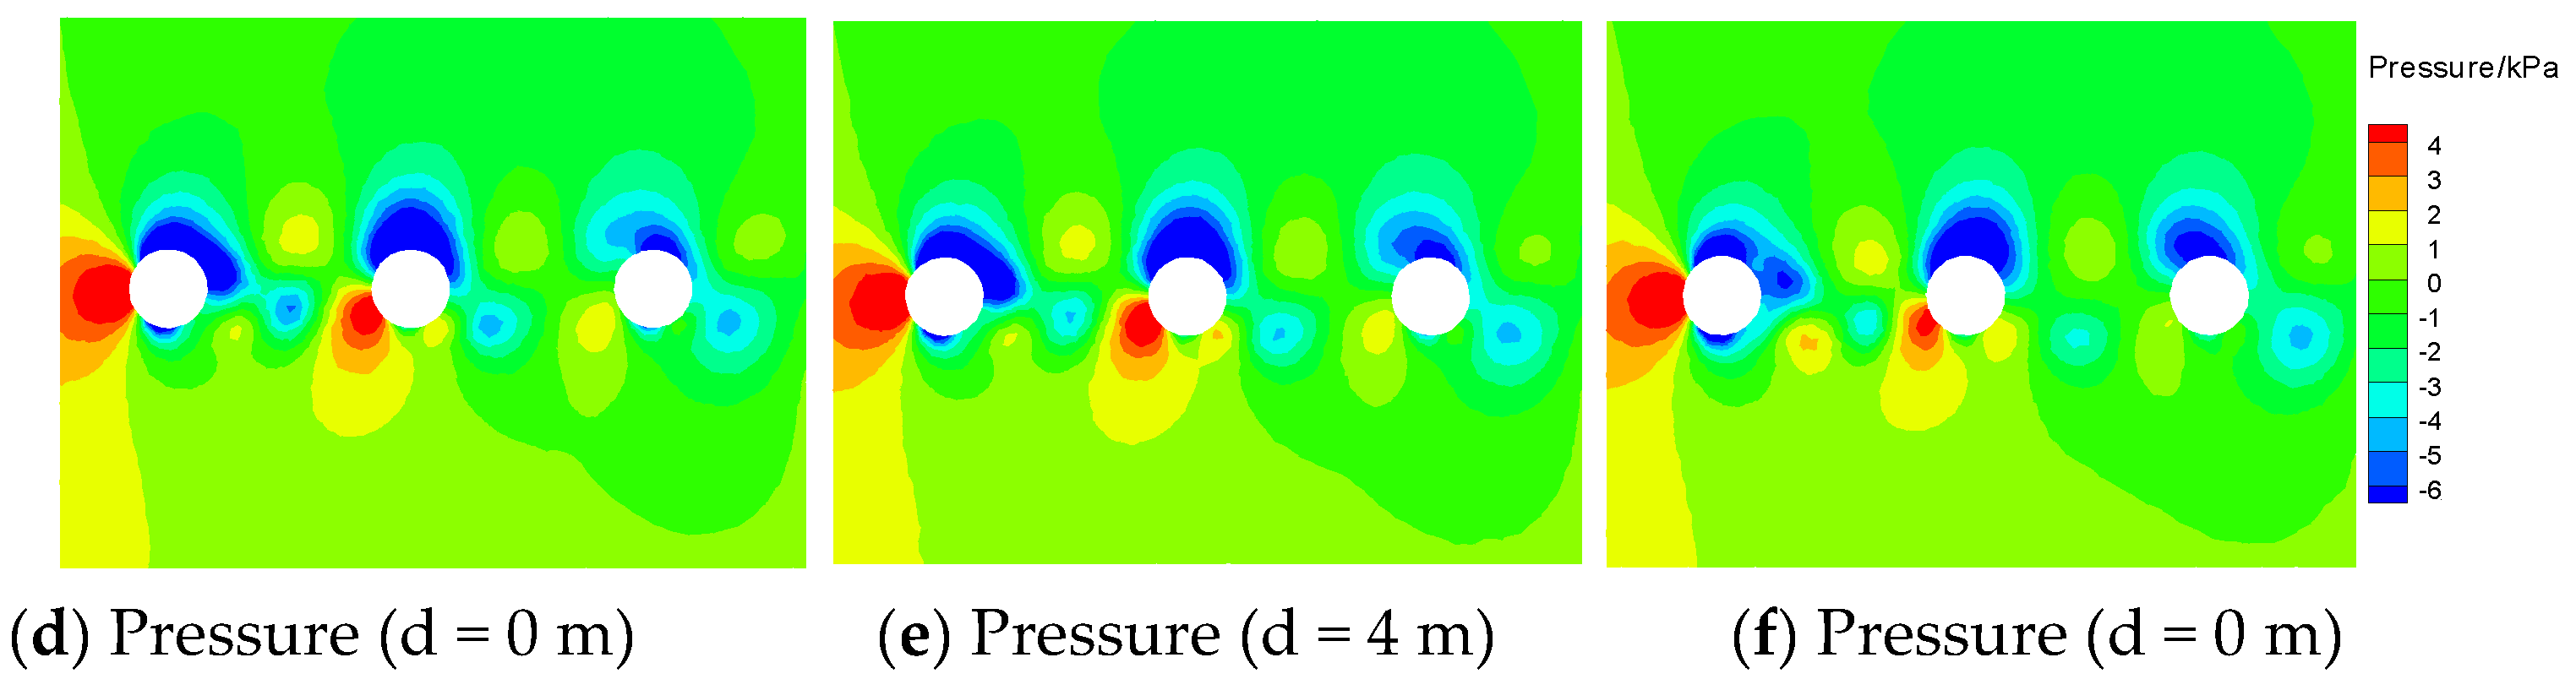
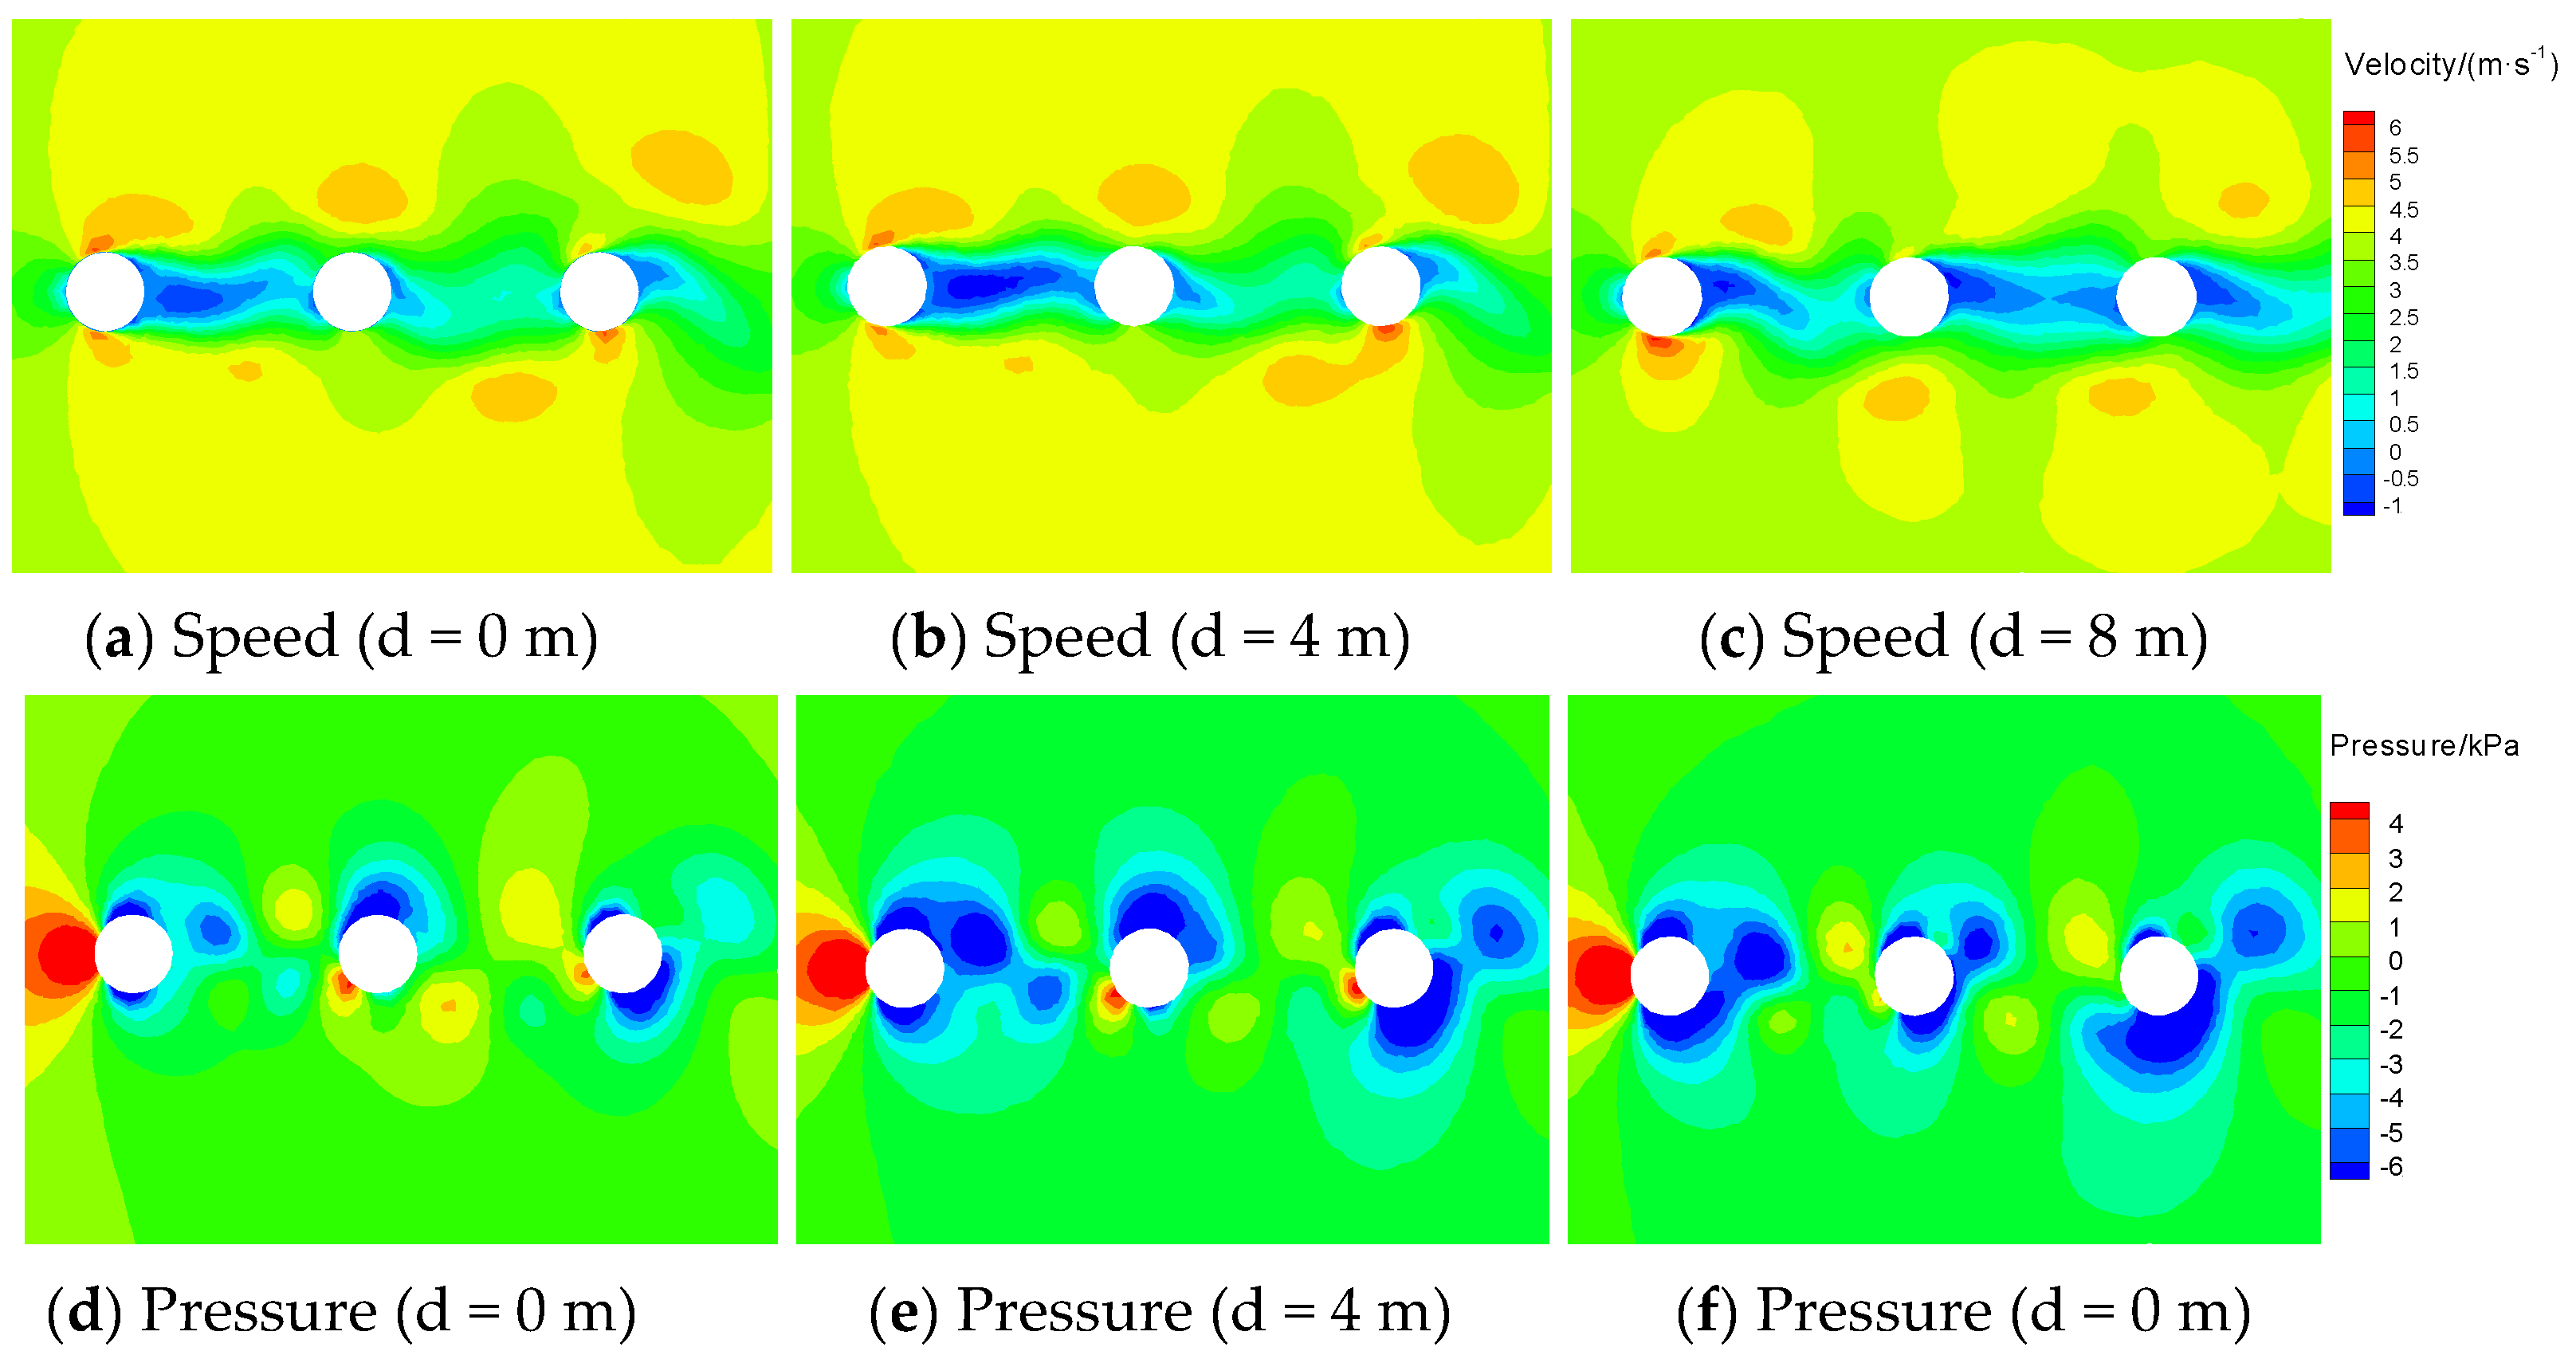
5.3. Speed and Pressure Field
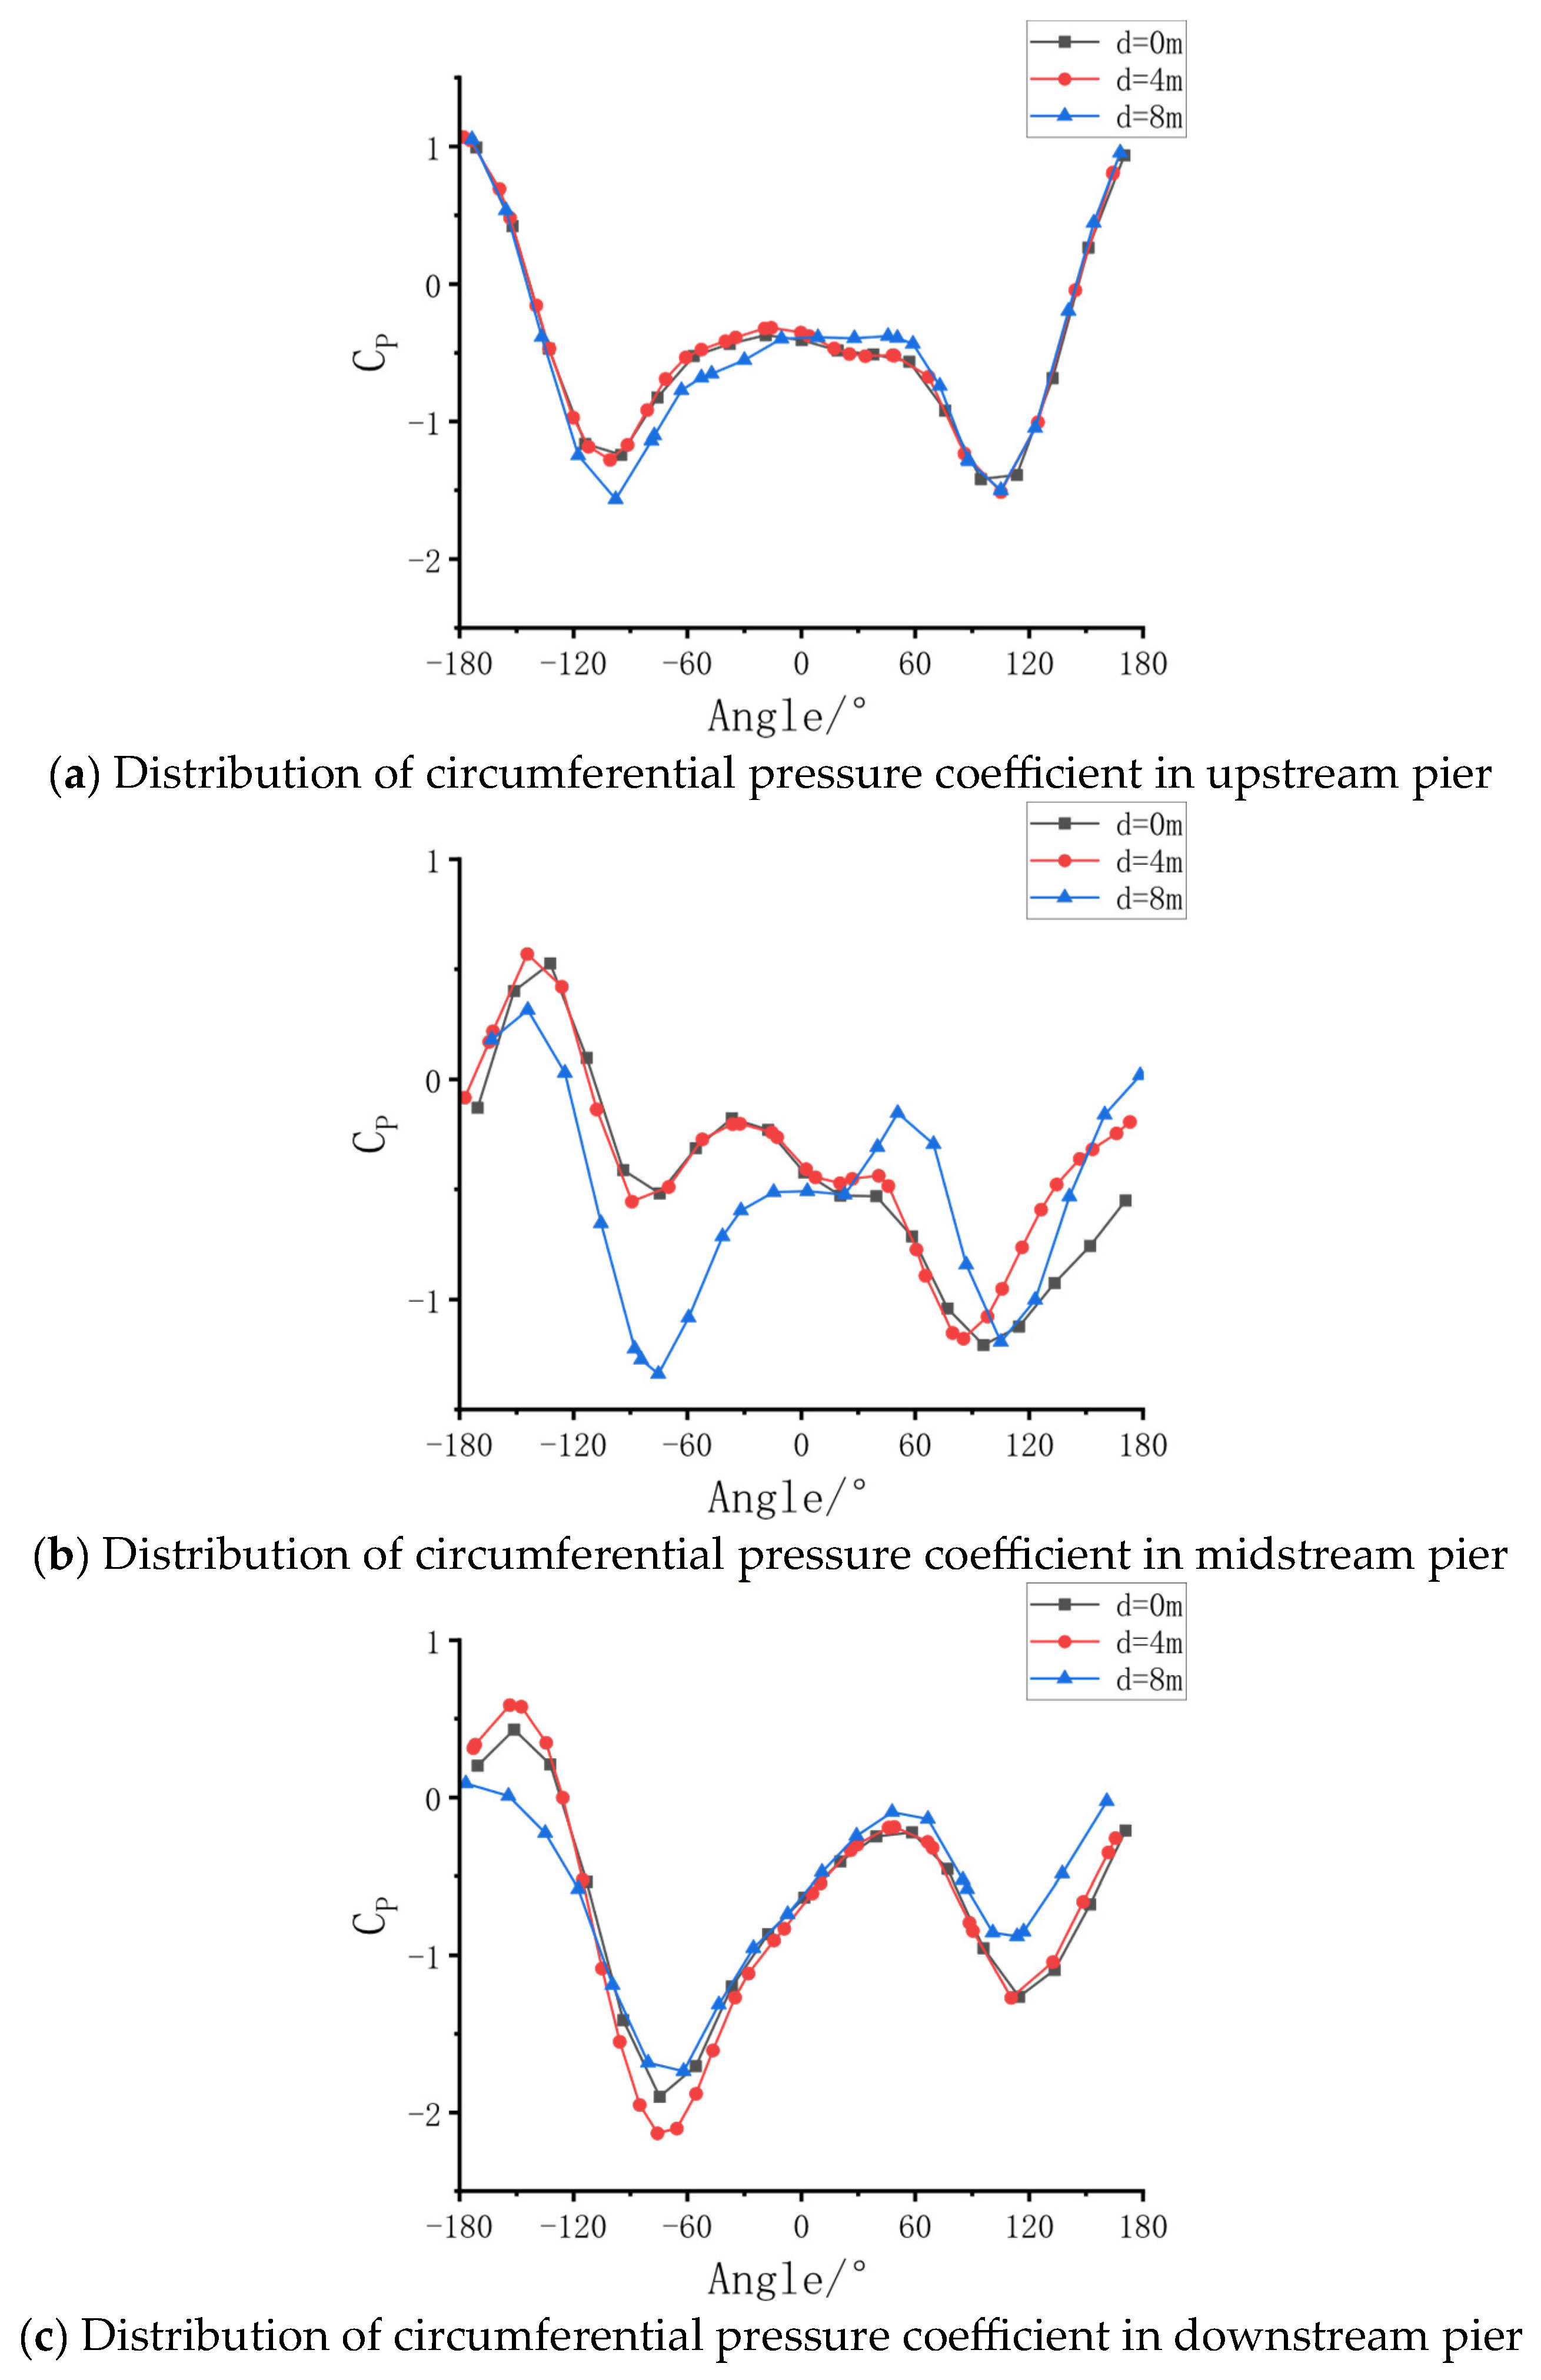
5.4. Surface Pressure Distribution
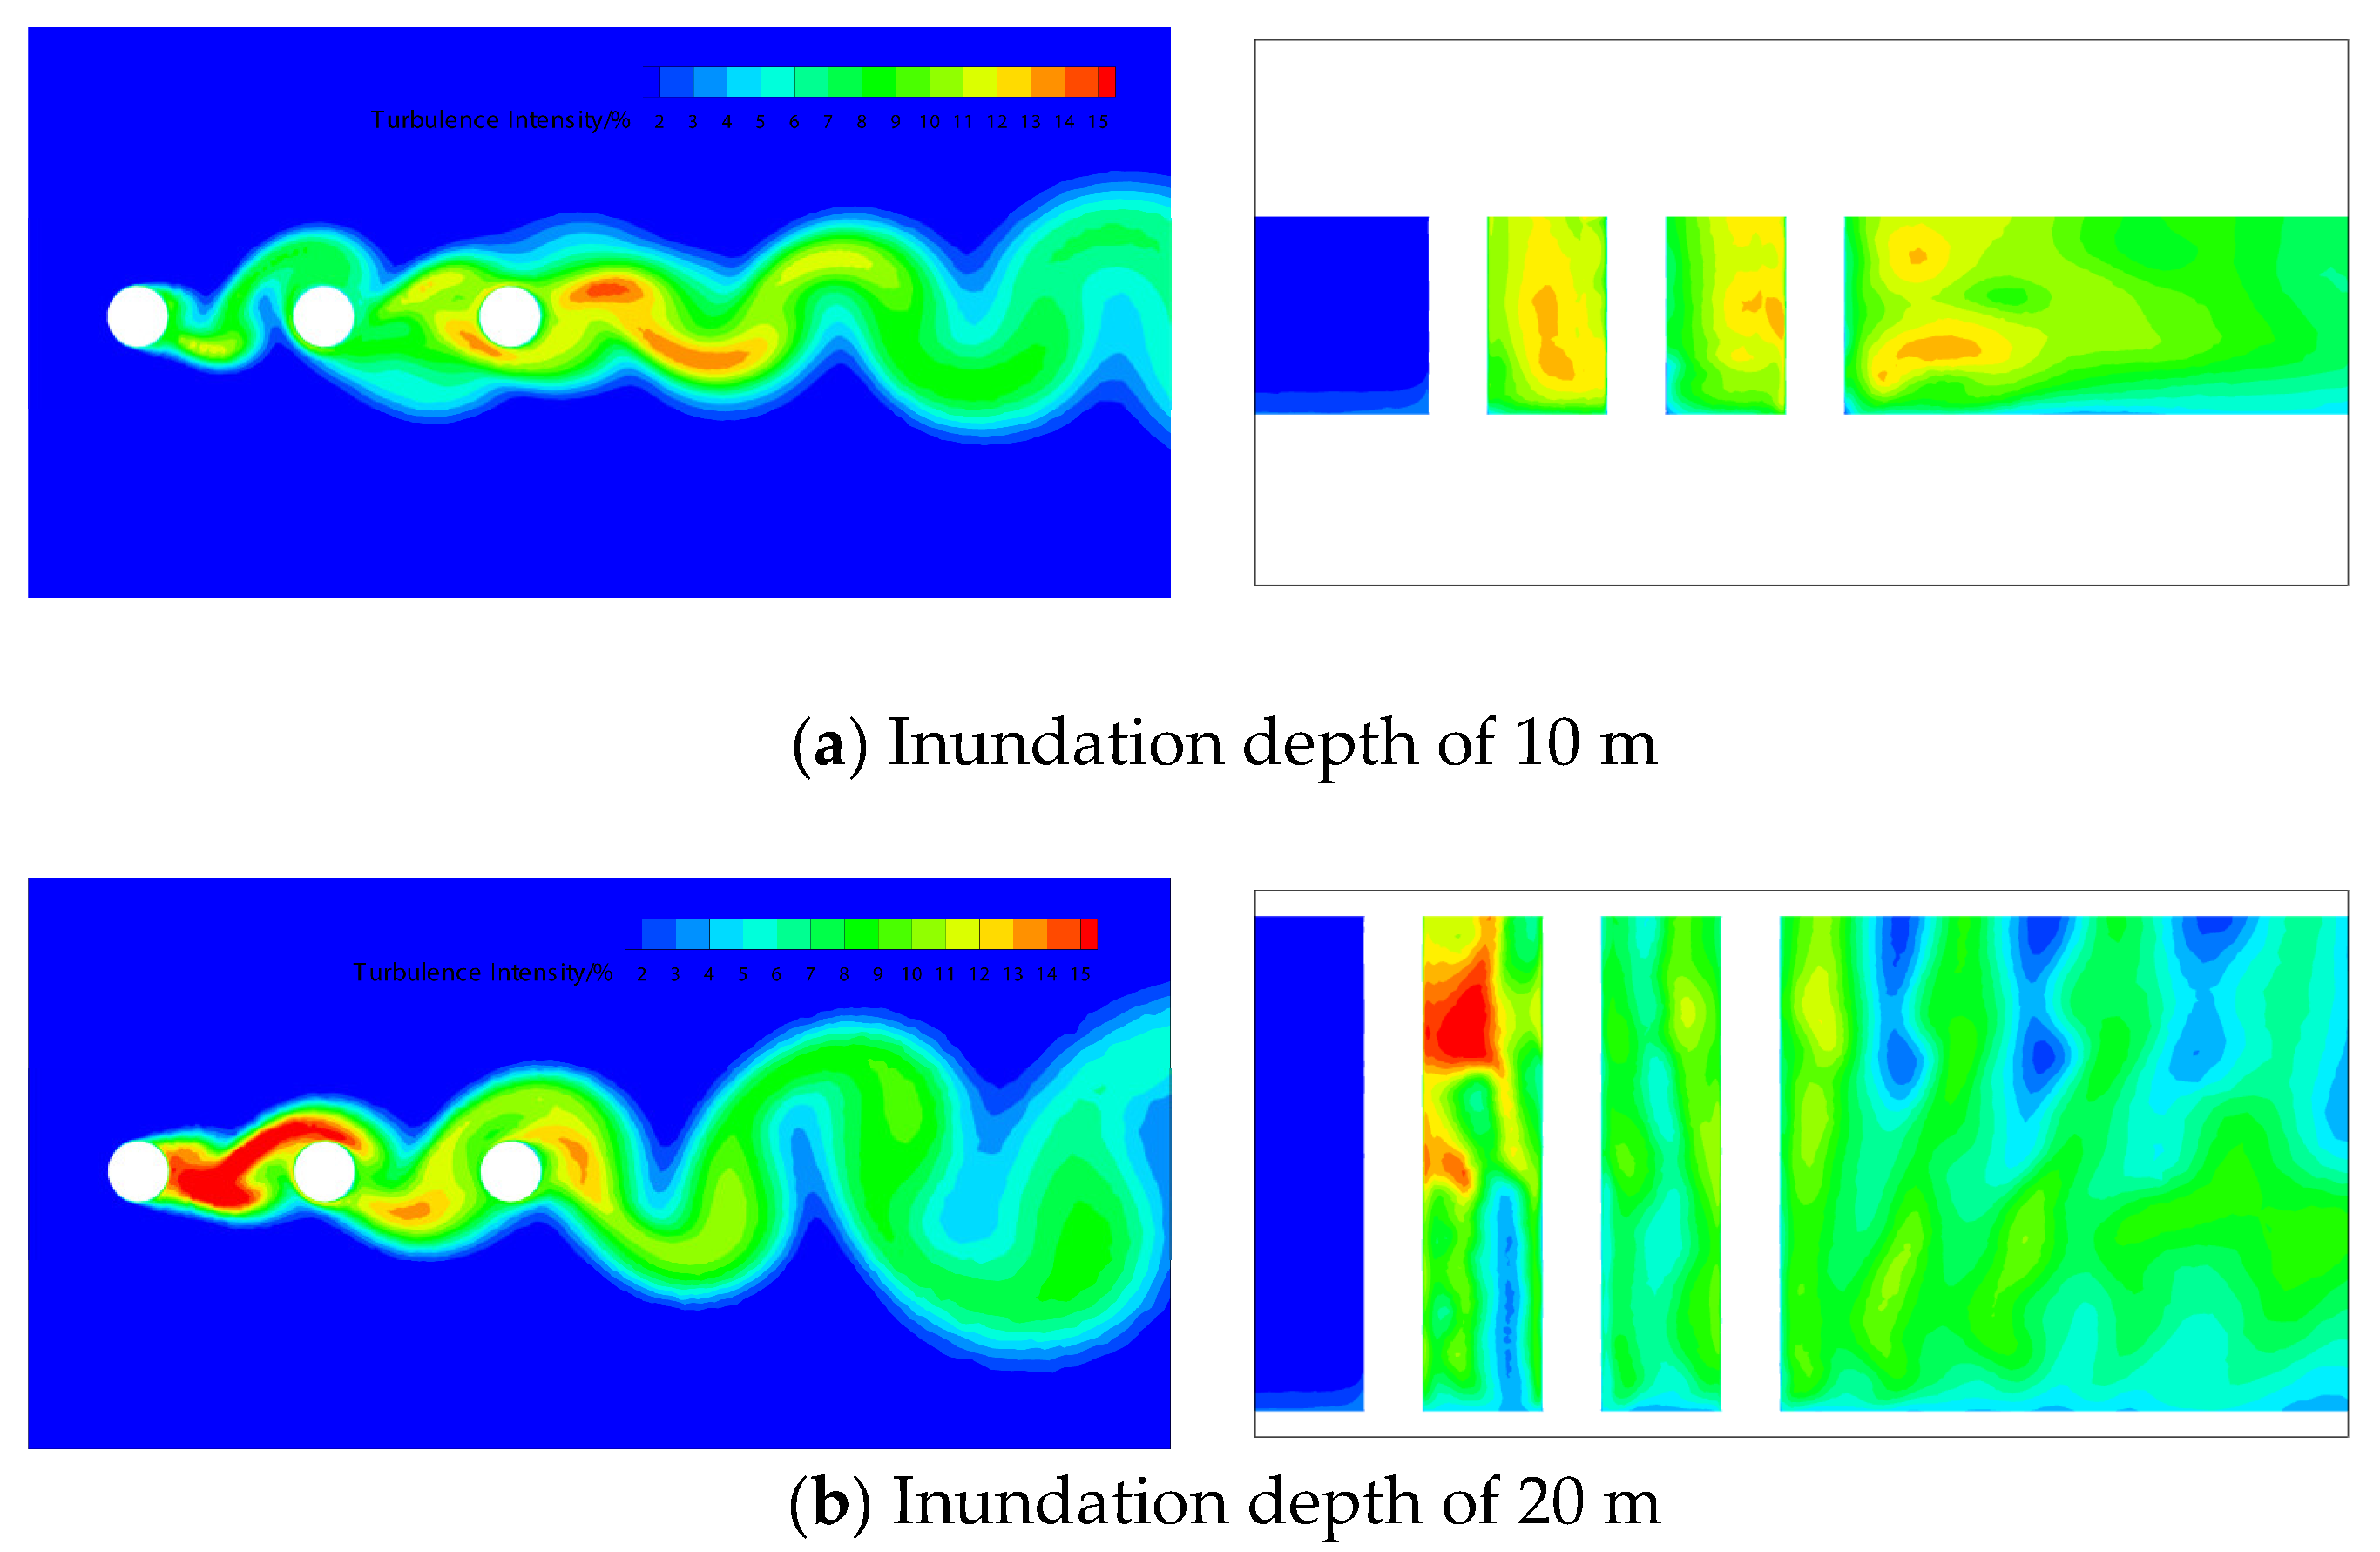
5.5. Turbulence Intensity
6. Conclusions
- The water flow characteristics of the temporary pier during the flood period were obtained through numerical simulation. When the water flows through the temporary pier, the vortex was generated behind it. This affects the distribution of water flow force around these three piers.
- The water pressure obtained from a numerical analysis was smaller than that from measurement, but the overall difference is not significant. By comparing the numerical simulation, the filed measurement and the results of the Morison equation, we found that the numerical simulation results are closer to the measured value and the numerical simulation method is more reliable than the semi-empirical method; thus, numerical simulation can be used as an important tool for studying water flow forces.
- The side of the temporary pier is subjected to significant negative pressure, which should be taken seriously in the structural design process.
- The circumferential pressure of the upstream pier is approximately symmetrically distributed around 0°, while vortex shedding occurs at the midstream pier. The maximum positive pressure position of the midstream and downstream pier appears near −140° (left front) and −150° (left front), respectively.
- The area with the highest turbulence intensity occurs between the upstream and midstream piers, and the turbulence intensity is affected by the flood depth.
- Except for the positive pressure on the upstream side, the surface of the temporary pier is subjected to negative pressure, and the lift and drag coefficient are not affected by the flow velocity and submergence depth of the temporary pier.
Author Contributions
Funding
Institutional Review Board Statement
Informed Consent Statement
Data Availability Statement
Conflicts of Interest
References
- Liu, Y.; Zhu, B.; Zhang, C.; Zhang, J. Experimental study on current force of dumbbell type occluded pile cofferdam. Railw. Stand. Des. 2020, 64, 72–76. [Google Scholar]
- Zhang, C.; Zhu, B.; Zhang, Z.; Zhao, Y.; Song, F. Study on calculation method of a new type dumbbell composite cofferdam structure in deep water foundation. J. Railw. Sci. Eng. 2020, 17, 1957–1969. [Google Scholar]
- Liu, T. Analysis of Force of Flow Around Single Column of Sea-Crossing Bridge. Ph.D. Thesis, Southwest Jiaotong University, Chengdu, China, 2018. [Google Scholar]
- Bei, J.; Mou, Y. Numerical analysis of impacting factors for current force over gear-type mixture embankment. Port Waterw. Eng. 2022, 593, 94–99. [Google Scholar]
- Agbaglah, G.; Mavriplis, C. Three-dimensional wakes behind cylinders of square and circular cross-section: Early and long-time dynamics. J. Fluid Mech. 2019, 870, 419–432. [Google Scholar] [CrossRef]
- Chen, J.; Yu, P.; Ouyang, H. Frequency characteristics of the three-dimensional flow past tandem cylinders with unequal diameters. Chin. J. Appl. Mech. 2022, 39, 386–393. [Google Scholar]
- Zhao, H.; Wang, C.; Ren, B.; Chen, W.; Wang, G. Numerical simulation of flow around two tandem cylinders at low Reynolds number using FDM-VBF. J. Dalian Univ. Technol. 2022, 62, 292–298. [Google Scholar]
- Du, X.; Lin, Z.; Wu, G. Mode characteristics and reconstruction of flow field around two tandem circular cylinders. J. Harbin Inst. Technol. 2022, 54, 49–57. [Google Scholar]
- Zhu, H.; Yao, Q.; Kanayama, H. Large-Scale Computations of Flow around Two Cylinders by a Domain Decomposition Method. Math. Probl. Eng. 2016, 2016 Pt 3, 4126123.1–4126123.8. [Google Scholar] [CrossRef]
- Deng, Y.; Yin, G.; Zhou, L.; Xi, G. Effect of spacing ratio on flow passed two circular cylinders in tandem arrangements near wall via experiment. Mach. Des. Manuf. 2022, 380, 174–177, 181. [Google Scholar]
- Zhao, K.; Wang, Z.; Cen, W.; Long, X. Application of lattice Boltzmann method in flow past two cylinders in tandem arrangement. J. Ship Mech. 2018, 22, 144–155. [Google Scholar]
- Zou, L.; Guo, C.; Xiong, C. Flow characteristics of the two tandem wavy cylinders and drag reduction phenomenon. J. Hydrodyn. 2013, 25, 737–746. [Google Scholar] [CrossRef]
- Zhang, Y.; Luo, L.; Chen, W. Numerical simulation of flow around two parallel cylinders with unequal diameters. Ship Sci. Technol. 2021, 43, 48–52. [Google Scholar]
- Lin, L.; Chen, W.; Lin, Y.; Li, Y. Numerical simulation of the characteristics and interaction of flow around two side-by-side arranged circular cylinders. Chin. J. Appl. Mech. 2021, 38, 844–850. [Google Scholar]
- Li, Y.; Su, Z.; Li, X. Three-dimensional numerical simulation of flow around two side-by-side cylinders at high Reynolds numbers using DES method. Chin. J. Hydrodyn. 2014, 29, 412–420. [Google Scholar] [CrossRef]
- Du, X.; Lin, W.; Shi, C.; Sun, Y. Large eddy simulation of flow around two side-by-side circular cylinders at a high Reynolds number. J. Harbin Inst. Technol. 2019, 51, 193–200. [Google Scholar]
- Chen, W.-L.; Xu, F. Investigation of a hybrid approach combining experimental tests and numerical simulations to study vortex-induced vibration in a circular cylinder. J. Sound Vib. 2012, 331, 1164–1182. [Google Scholar] [CrossRef]
- Ma, W.; Jiang, Y.; Yu, Y. The numerical simulation of flow around two circular cylinders. J. Fudan Univ. Nat. Sci. 2013, 52, 592–600. [Google Scholar]
- Harichandan, A.B.; Roy, A. Numerical investigation of low Reynolds number flow past two and three circular cylinders using unstructured grid CFR scheme. Int. J. Heat Fluid Flow 2010, 31, 154–171. [Google Scholar] [CrossRef]
- Tan, Z.; Xiong, M.; Wang, Y. LES on flow past three tandem cylinders at high Reynolds number. Port Waterw. Eng. 2022, 603, 25–33. [Google Scholar]
- Tu, J.; Wang, C.; Liang, J.; Deng, X.; Guo, X.; Zhang, P. Study on flow characteristics of three tandem cylinders at subcritical Reynolds number. J. Ship Mech. 2021, 25, 1159–1171. [Google Scholar]
- Yang, Q.; Liu, Q.; Liu, X. Time averaged pressure distribution and aerodynamic force of flow around three circular cylinders. J. Vib. Meas. Diagn. 2019, 39, 1011–1015, 1133. [Google Scholar]
- Zhang, Z.; Ji, C.; Xu, D.; Chen, W.; Yang, X. Response and wake characteristics of vortex-induced vibrations of three tandem circular cylinders with the upstream cylinder fixed. Chin. J. Hydrodyn. 2019, 34, 174–183. [Google Scholar]
- JTG D60-2015; General Specifications for Design of Highway Bridges and Culverts. People’s Communications Press: Beijing, China, 2015.
- American Petroleum Institute. Recommended Practice for Planning, Designing and Constructing Fixed Offshore Platforms-Working Stress Design, 22nd ed.; American Petroleum Institute: Washington, DC, USA, 2014. [Google Scholar]
- De Vanna, F.; Baldan, G.; Picano, F.; Benini, E. Effect of convective schemes in wall-resolved and wall-modeled LES of compressible wall turbulence. Comput. Fluids 2023, 250, 105710. [Google Scholar] [CrossRef]
- De Vanna, F.; Bernardini, M.; Picano, F.; Benini, E. Wall-modeled LES of shock-wave/boundary layer interaction. Int. J. Heat Fluid Flow 2022, 98, 109071. [Google Scholar] [CrossRef]
- Yang, Z. Large-eddy simulation: Past, present and the future. Chin. J. Aeronaut. 2015, 28, 11–24. [Google Scholar]
- Chipongo, K.; Khiadani, M.; Sookhak Lari, K. Comparison and verification of turbulence Reynolds-averaged Navier–Stokes closures to model spatially varied flows. Sci. Rep. 2020, 10, 19059. [Google Scholar] [CrossRef]
- Hanjalic, K. Will RANS survive LES? A view of perspectives. J. Fluids Eng. 2005, 127, 831. [Google Scholar] [CrossRef]
- Lamberti, L. Data Driven Modelling of Turbulent Flows Using Artificial Neural Networks. Master’s Thesis, University of Illinois, Chicago, IL, USA, 2020. [Google Scholar]
- Nguyen, T.H.T.; Ahn, J.; Park, S.W. Numerical and Physical Investigation of the Performance of Turbulence Modeling Schemes around a Scour Hole Downstream of a Fixed Bed Protection. Water 2018, 10, 103. [Google Scholar] [CrossRef]
- Wornom, S.; Ouvrard, H.; Salvetti, M.V.; Koobus, B.; Dervieux, A. Classical and variational multiscale Large-Eddy simulations of the flow around a circular cylinder on unstructured grids. Comput. Fluids 2010, 39, 1083–1094. [Google Scholar]
- Meyer, M.; Hickel, S.; Adams, N.A. Assessment of implicit Large-Eddy simulation with a conservative immersed interface method for turbulent cylinder flow. Int. J. Heat Fluid Flow 2010, 31, 368–377. [Google Scholar] [CrossRef]
- Hu, Z.; Liu, H.; Chen, N.; Hu, J.; Tong, F. Vortex shedding noise and flow mode analysis of cylinder with full/partial porous coating. Aerosp. Sci. Technol. 2020, 106, 106154. [Google Scholar] [CrossRef]
- Norberg, C. Fluctuating lift on a circular cylinder: Review and new measurements. J. Fluids Struct. 2003, 17, 57–96. [Google Scholar] [CrossRef]
- Khalak, A.; Williamson, C.H.K. Dynamics of a Hydroelastic Cylinder with Very Low Mass and Damping. J. Fluids Struct. 1996, 10, 455–472. [Google Scholar] [CrossRef]
- JTS 144-1-2010; Load Code for Harbour Engineering. People’s Communications Press: Beijing, China, 2010.
- JTGT3650-2020; Technical Specifications for Construction of Highway Bridges and Culverts. People’s Communications Press: Beijing, China, 2020.
- Luo, C.; Ding, B.; Tian, Z.; Cong, P.; Cao, H.; Dai, Y. Study on the Influence of Sheet Pile Cofferdam Based on Different Flow Pressure Theories. Eng. Technol. Ningxia 2021, 20, 162–166. [Google Scholar]


| Case | Reynolds Number/103 | Grid Size/mm | |||
|---|---|---|---|---|---|
| C1 | 20 | 0.5 | 0.01 | 1.08 | 0.231 |
| C1 | 20 | 0.001 | 1.07 | 0.229 | |
| C2 | 20 | 0.2 | 0.01 | 1.06 | 0.216 |
| C2 | 20 | 0.001 | 1.05 | 0.215 | |
| C3 | 20 | 0.1 | 0.01 | 1.04 | 0.215 |
| C3 | 20 | 0.001 | 1.05 | 0.213 | |
| Ouvard et al. [33] | 1.03 | 0.219 | |||
| Meyers et al. [34] | 1.05 | 0.210 |
| Mean Error (%) | A1 | C1 | |
|---|---|---|---|
| Numerical simulation | 10.2% | 7.9% | 10.5% |
| Morison equation | 36.3% | 20.0% | - |
Disclaimer/Publisher’s Note: The statements, opinions and data contained in all publications are solely those of the individual author(s) and contributor(s) and not of MDPI and/or the editor(s). MDPI and/or the editor(s) disclaim responsibility for any injury to people or property resulting from any ideas, methods, instructions or products referred to in the content. |
© 2023 by the authors. Licensee MDPI, Basel, Switzerland. This article is an open access article distributed under the terms and conditions of the Creative Commons Attribution (CC BY) license (https://creativecommons.org/licenses/by/4.0/).
Share and Cite
Tian, Z.; Liao, Z. Three-Dimensional Numerical Simulation of the Water Flow Effect on a Temporary Pier with Three Columns in Series. Appl. Sci. 2023, 13, 11683. https://doi.org/10.3390/app132111683
Tian Z, Liao Z. Three-Dimensional Numerical Simulation of the Water Flow Effect on a Temporary Pier with Three Columns in Series. Applied Sciences. 2023; 13(21):11683. https://doi.org/10.3390/app132111683
Chicago/Turabian StyleTian, Zhongchu, and Zhangying Liao. 2023. "Three-Dimensional Numerical Simulation of the Water Flow Effect on a Temporary Pier with Three Columns in Series" Applied Sciences 13, no. 21: 11683. https://doi.org/10.3390/app132111683