
The Effect of Crowdsourced Police Enforcement Data on Traffic Speed: A Case Study of The Netherlands


Abstract
:1. Introduction
2. Literature Review
2.1. Crowdsourced Data Usage in ITS
2.2. Traffic Speed Prediction
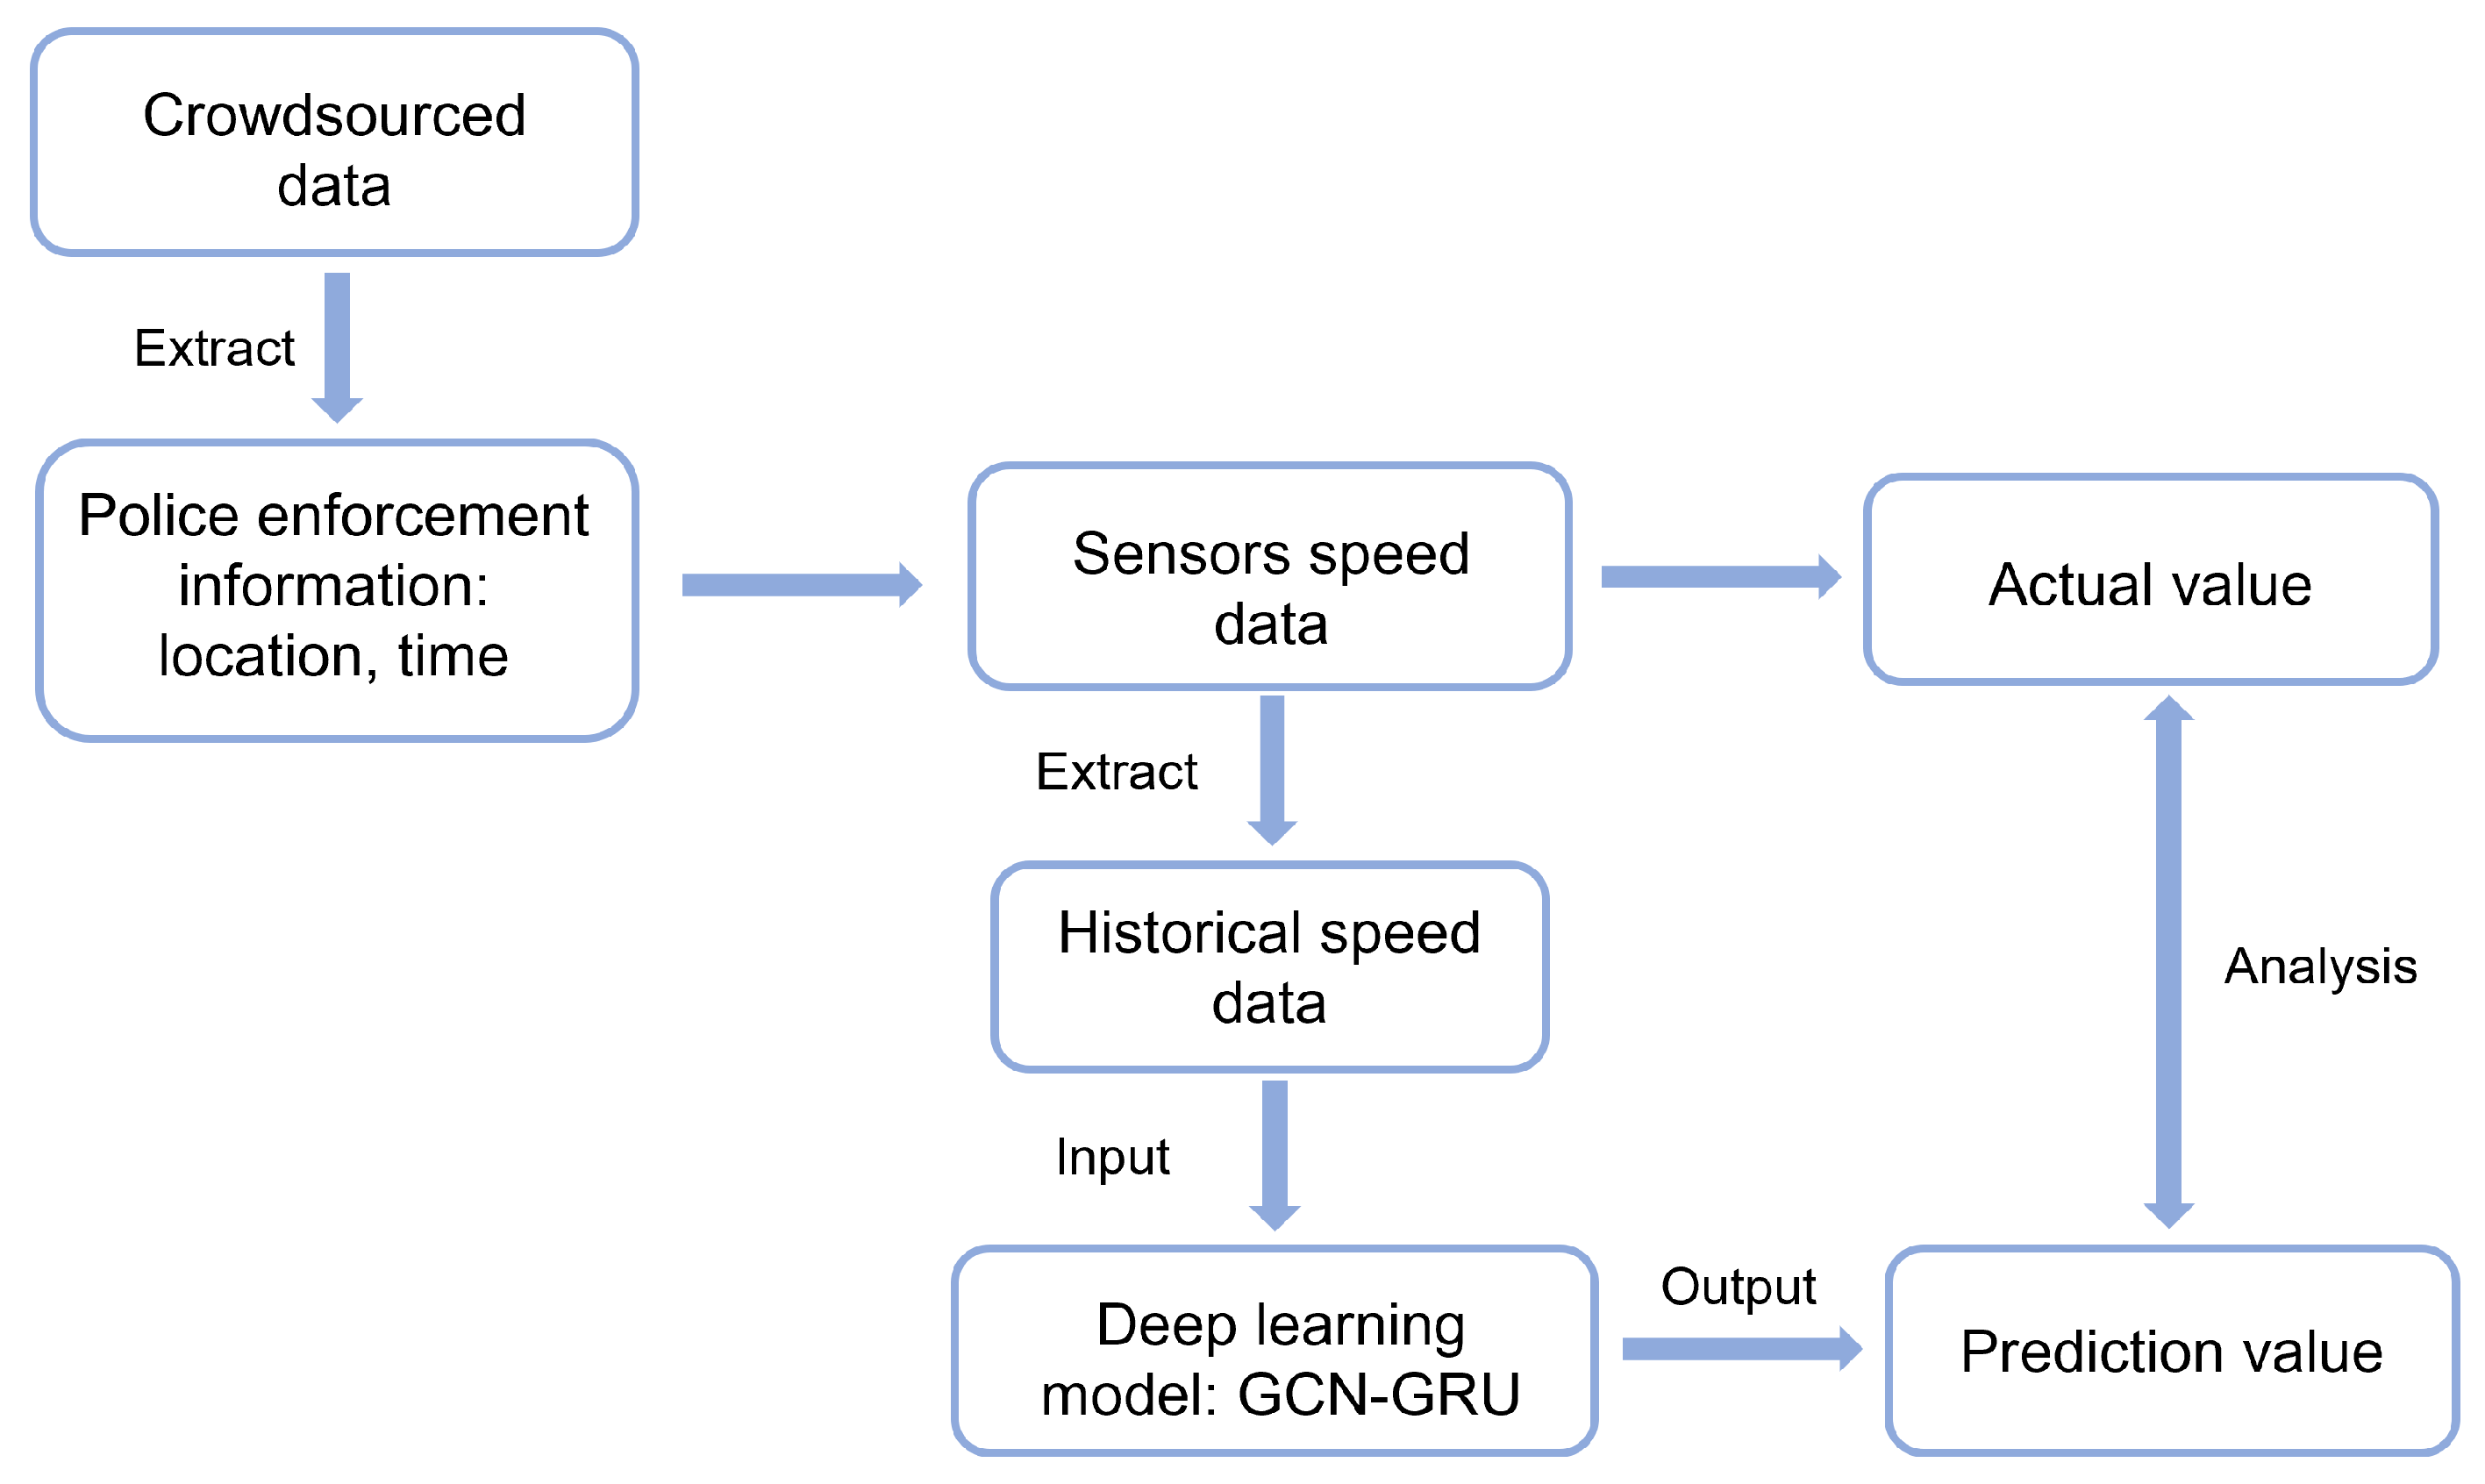
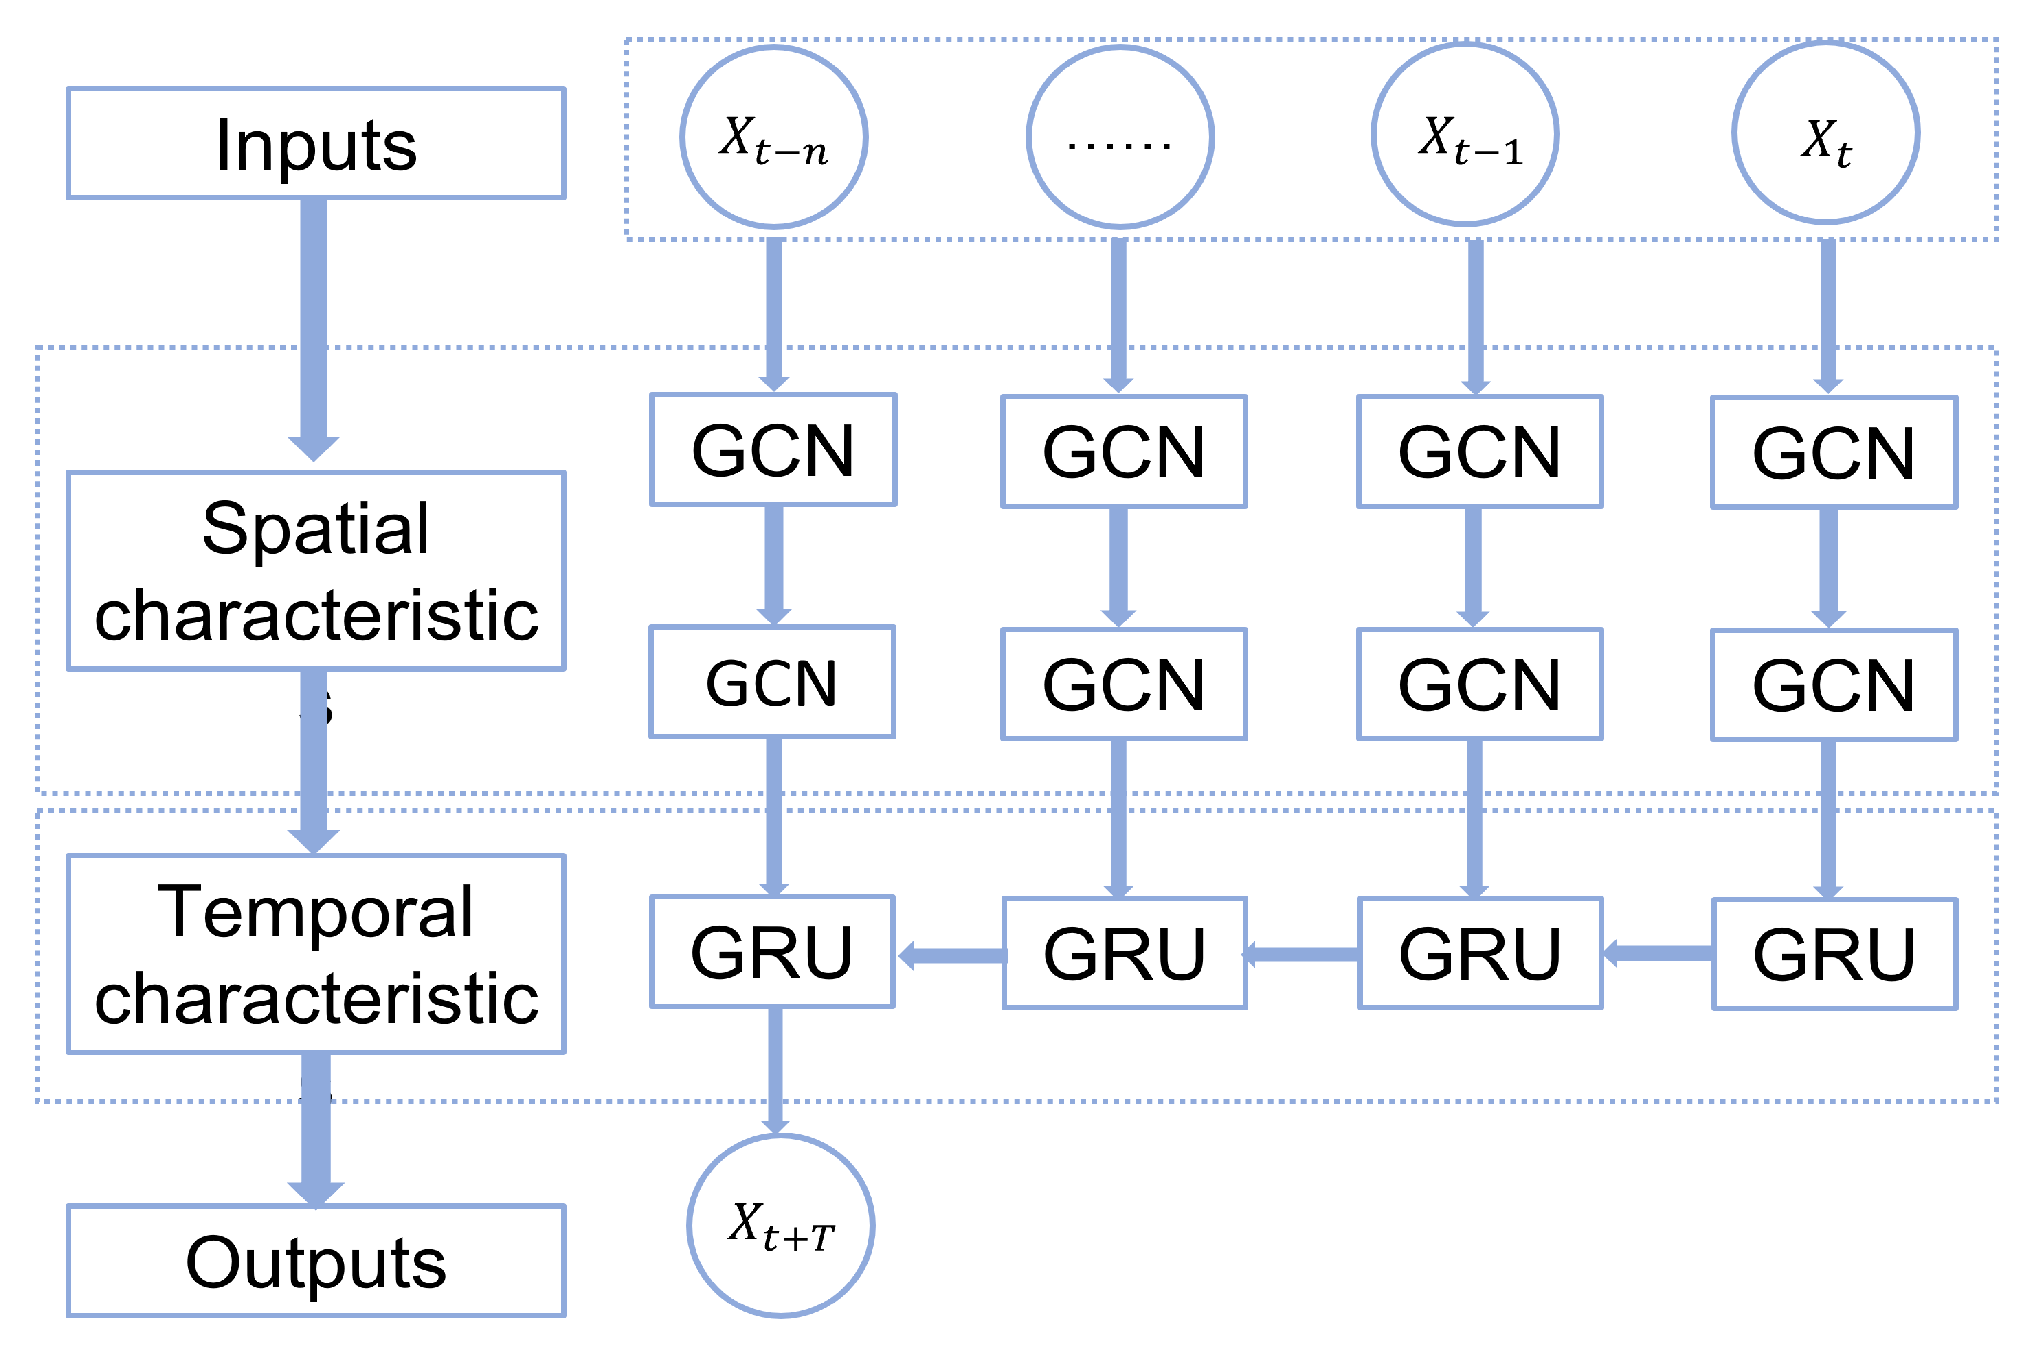
3. Methodology
3.1. Speed Prediction
3.1.1. GCN
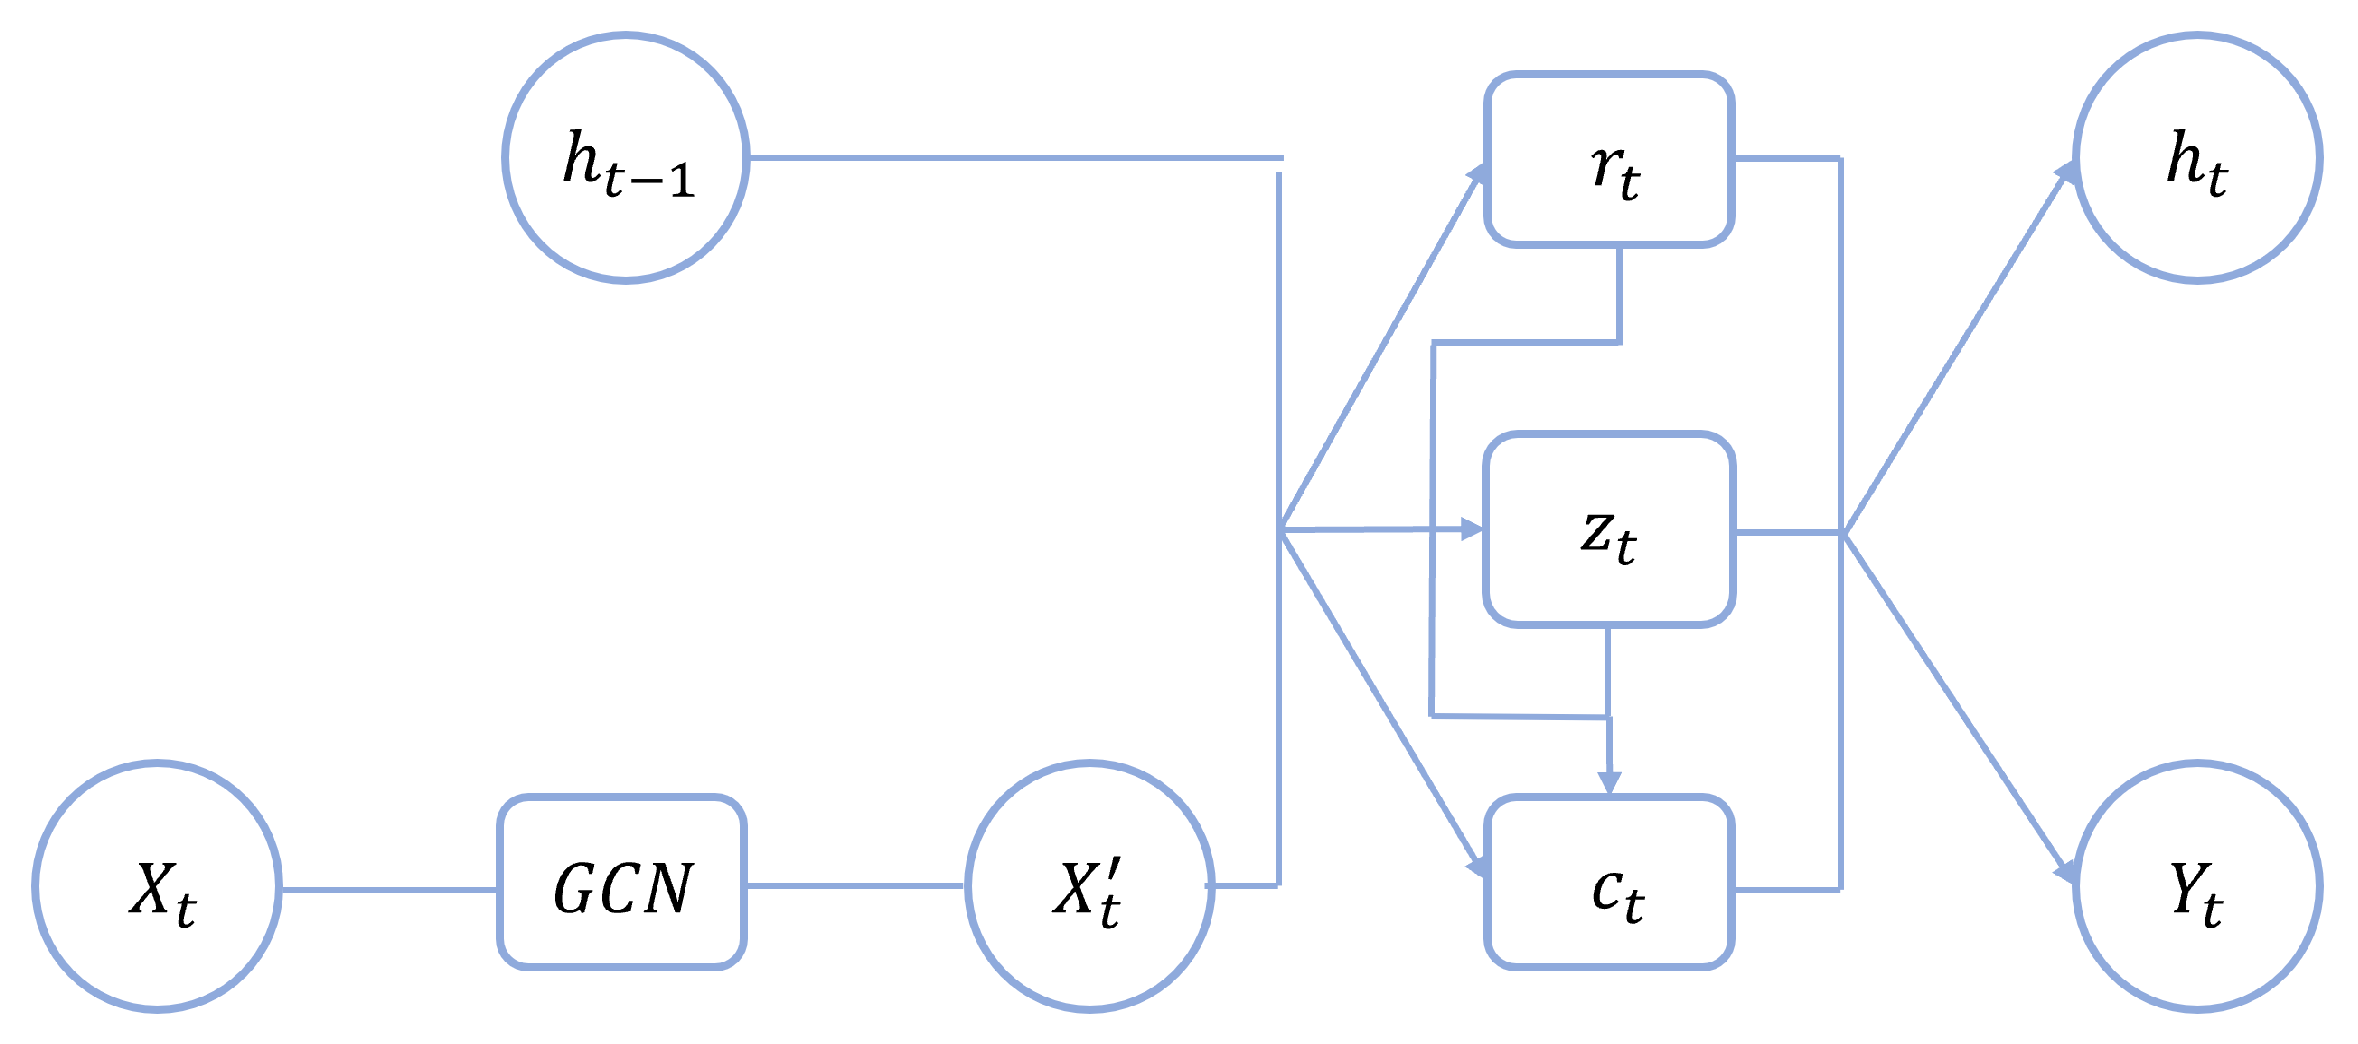
3.1.2. GRU
3.1.3. GCN-GRU
4. Numerical Experiment
- -
- The speed data are provided by the national data warehouse for traffic information (http://opendata.ndw.nu/, accessed on 26 October 2023). The raw speed data are collected from loop detectors on the highways every 5 min interval, and the samples are shown in Table 1.
- -
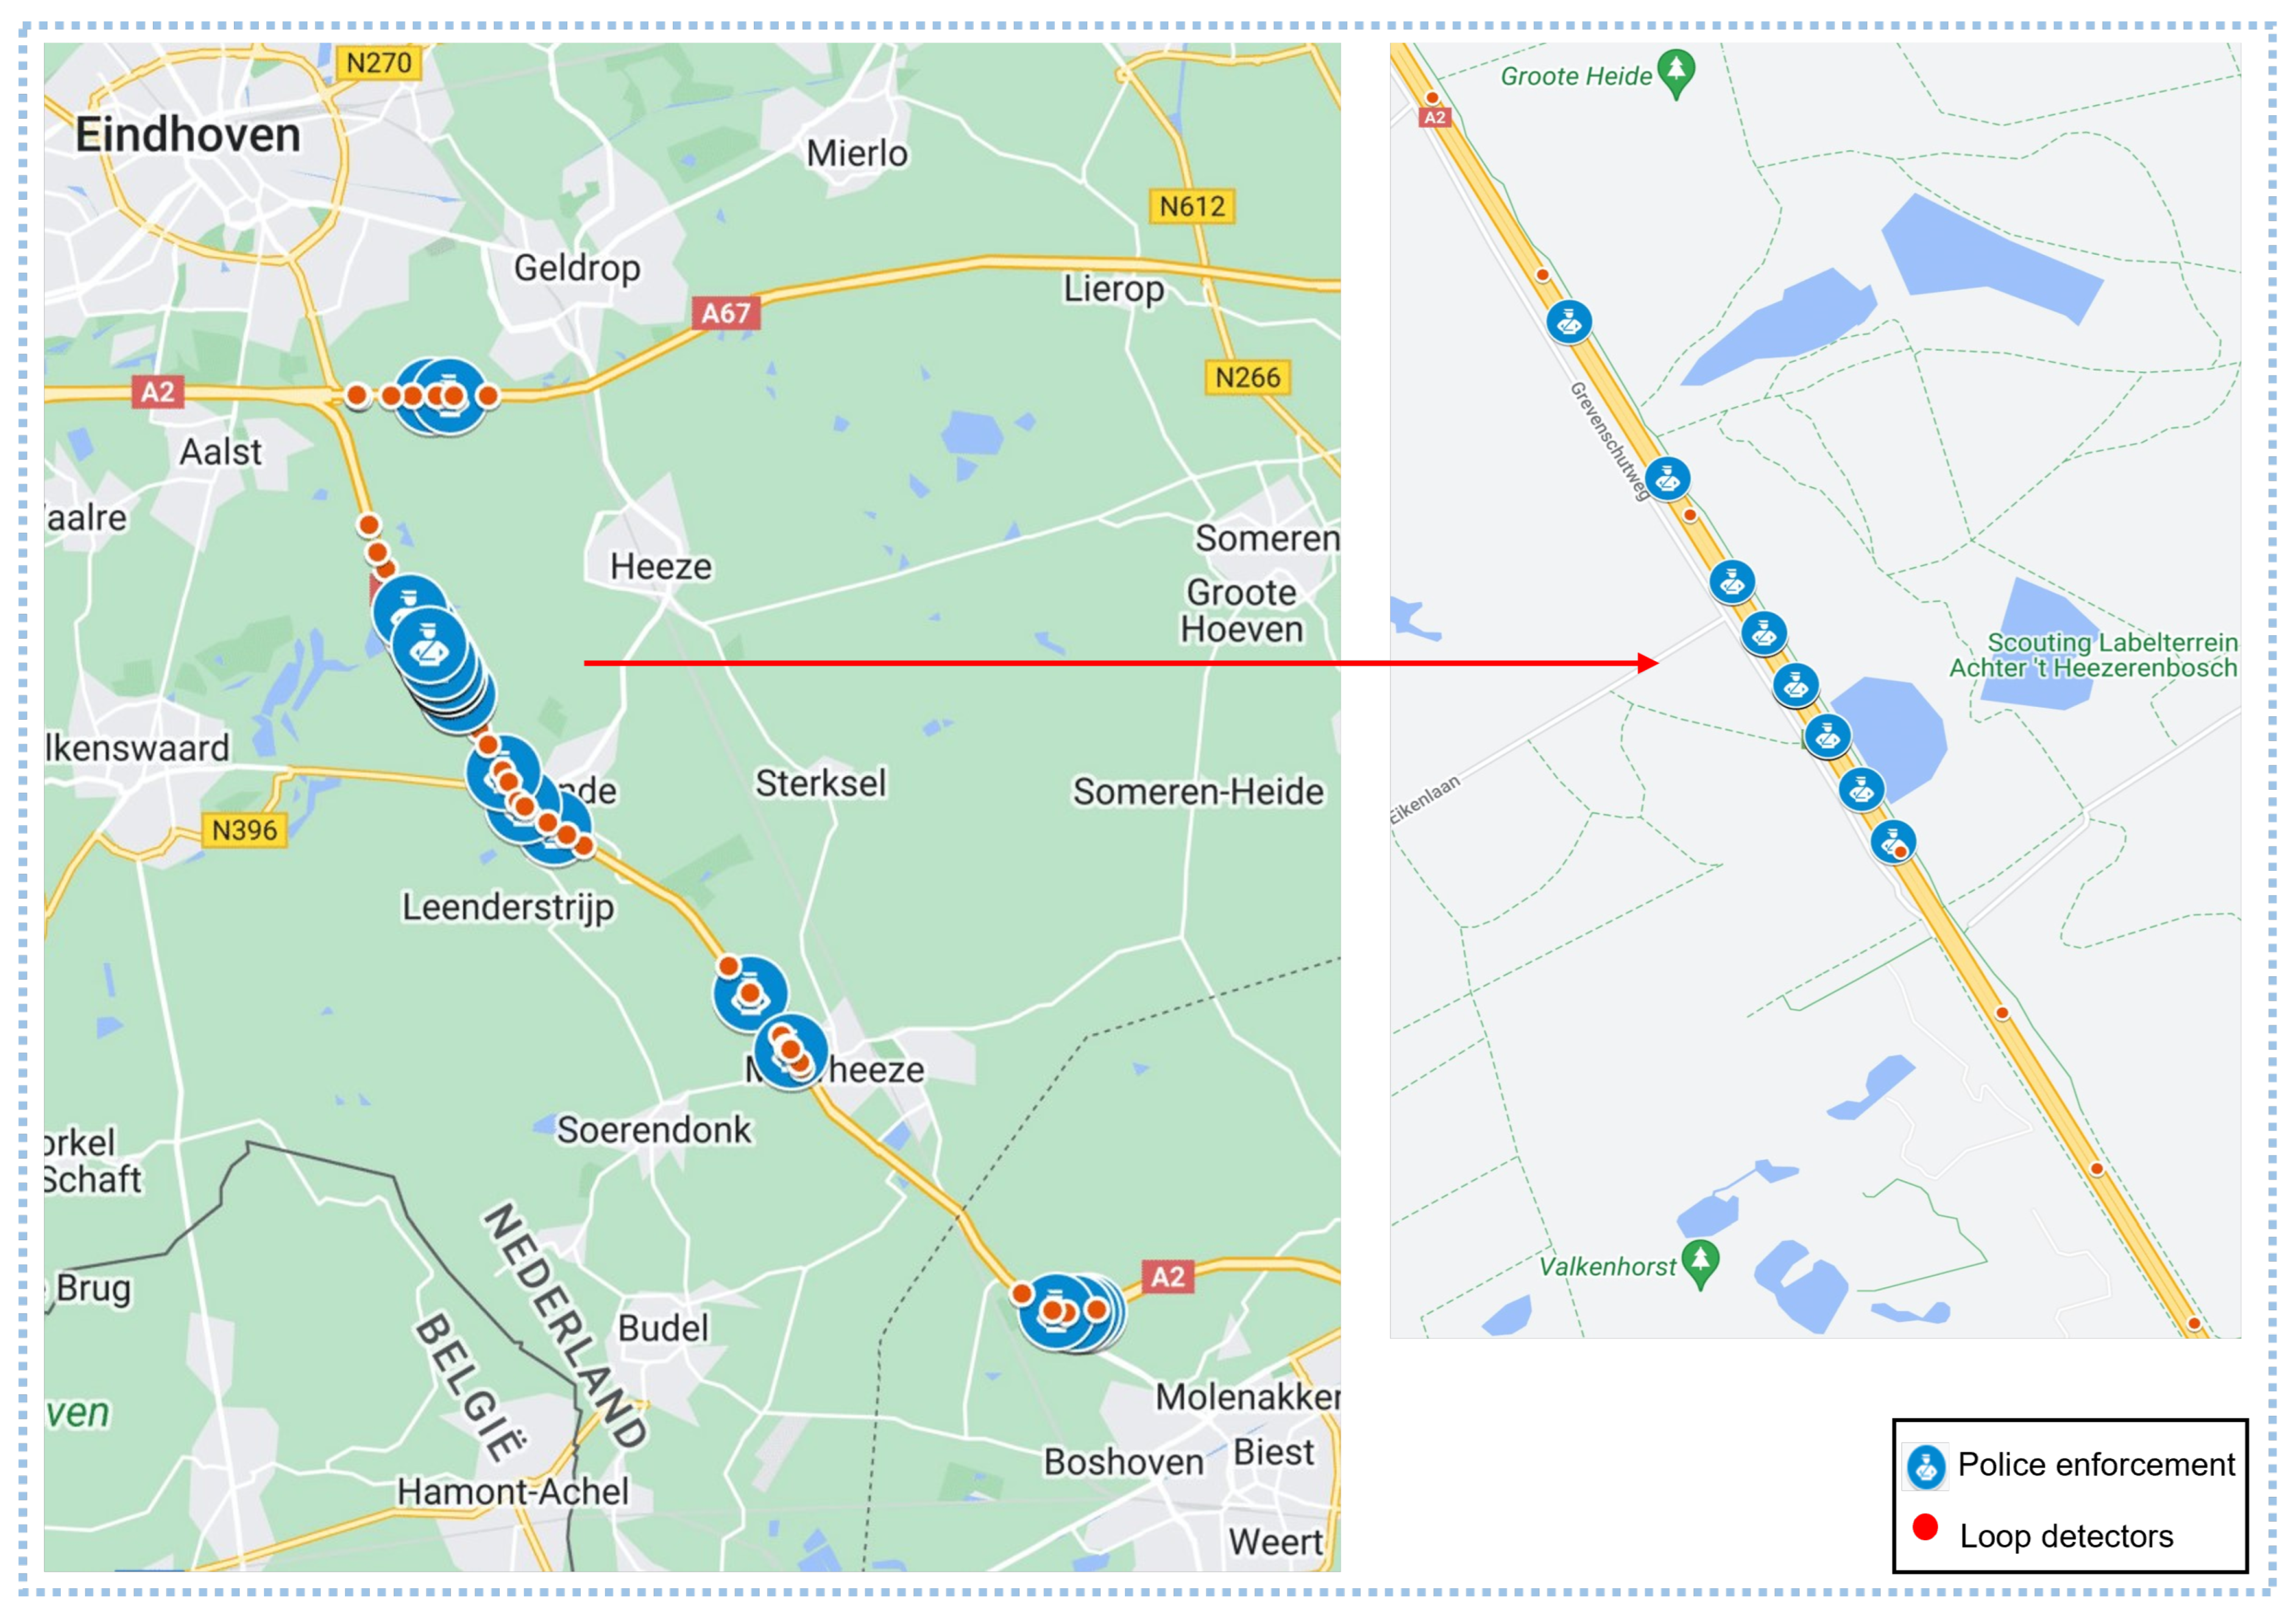
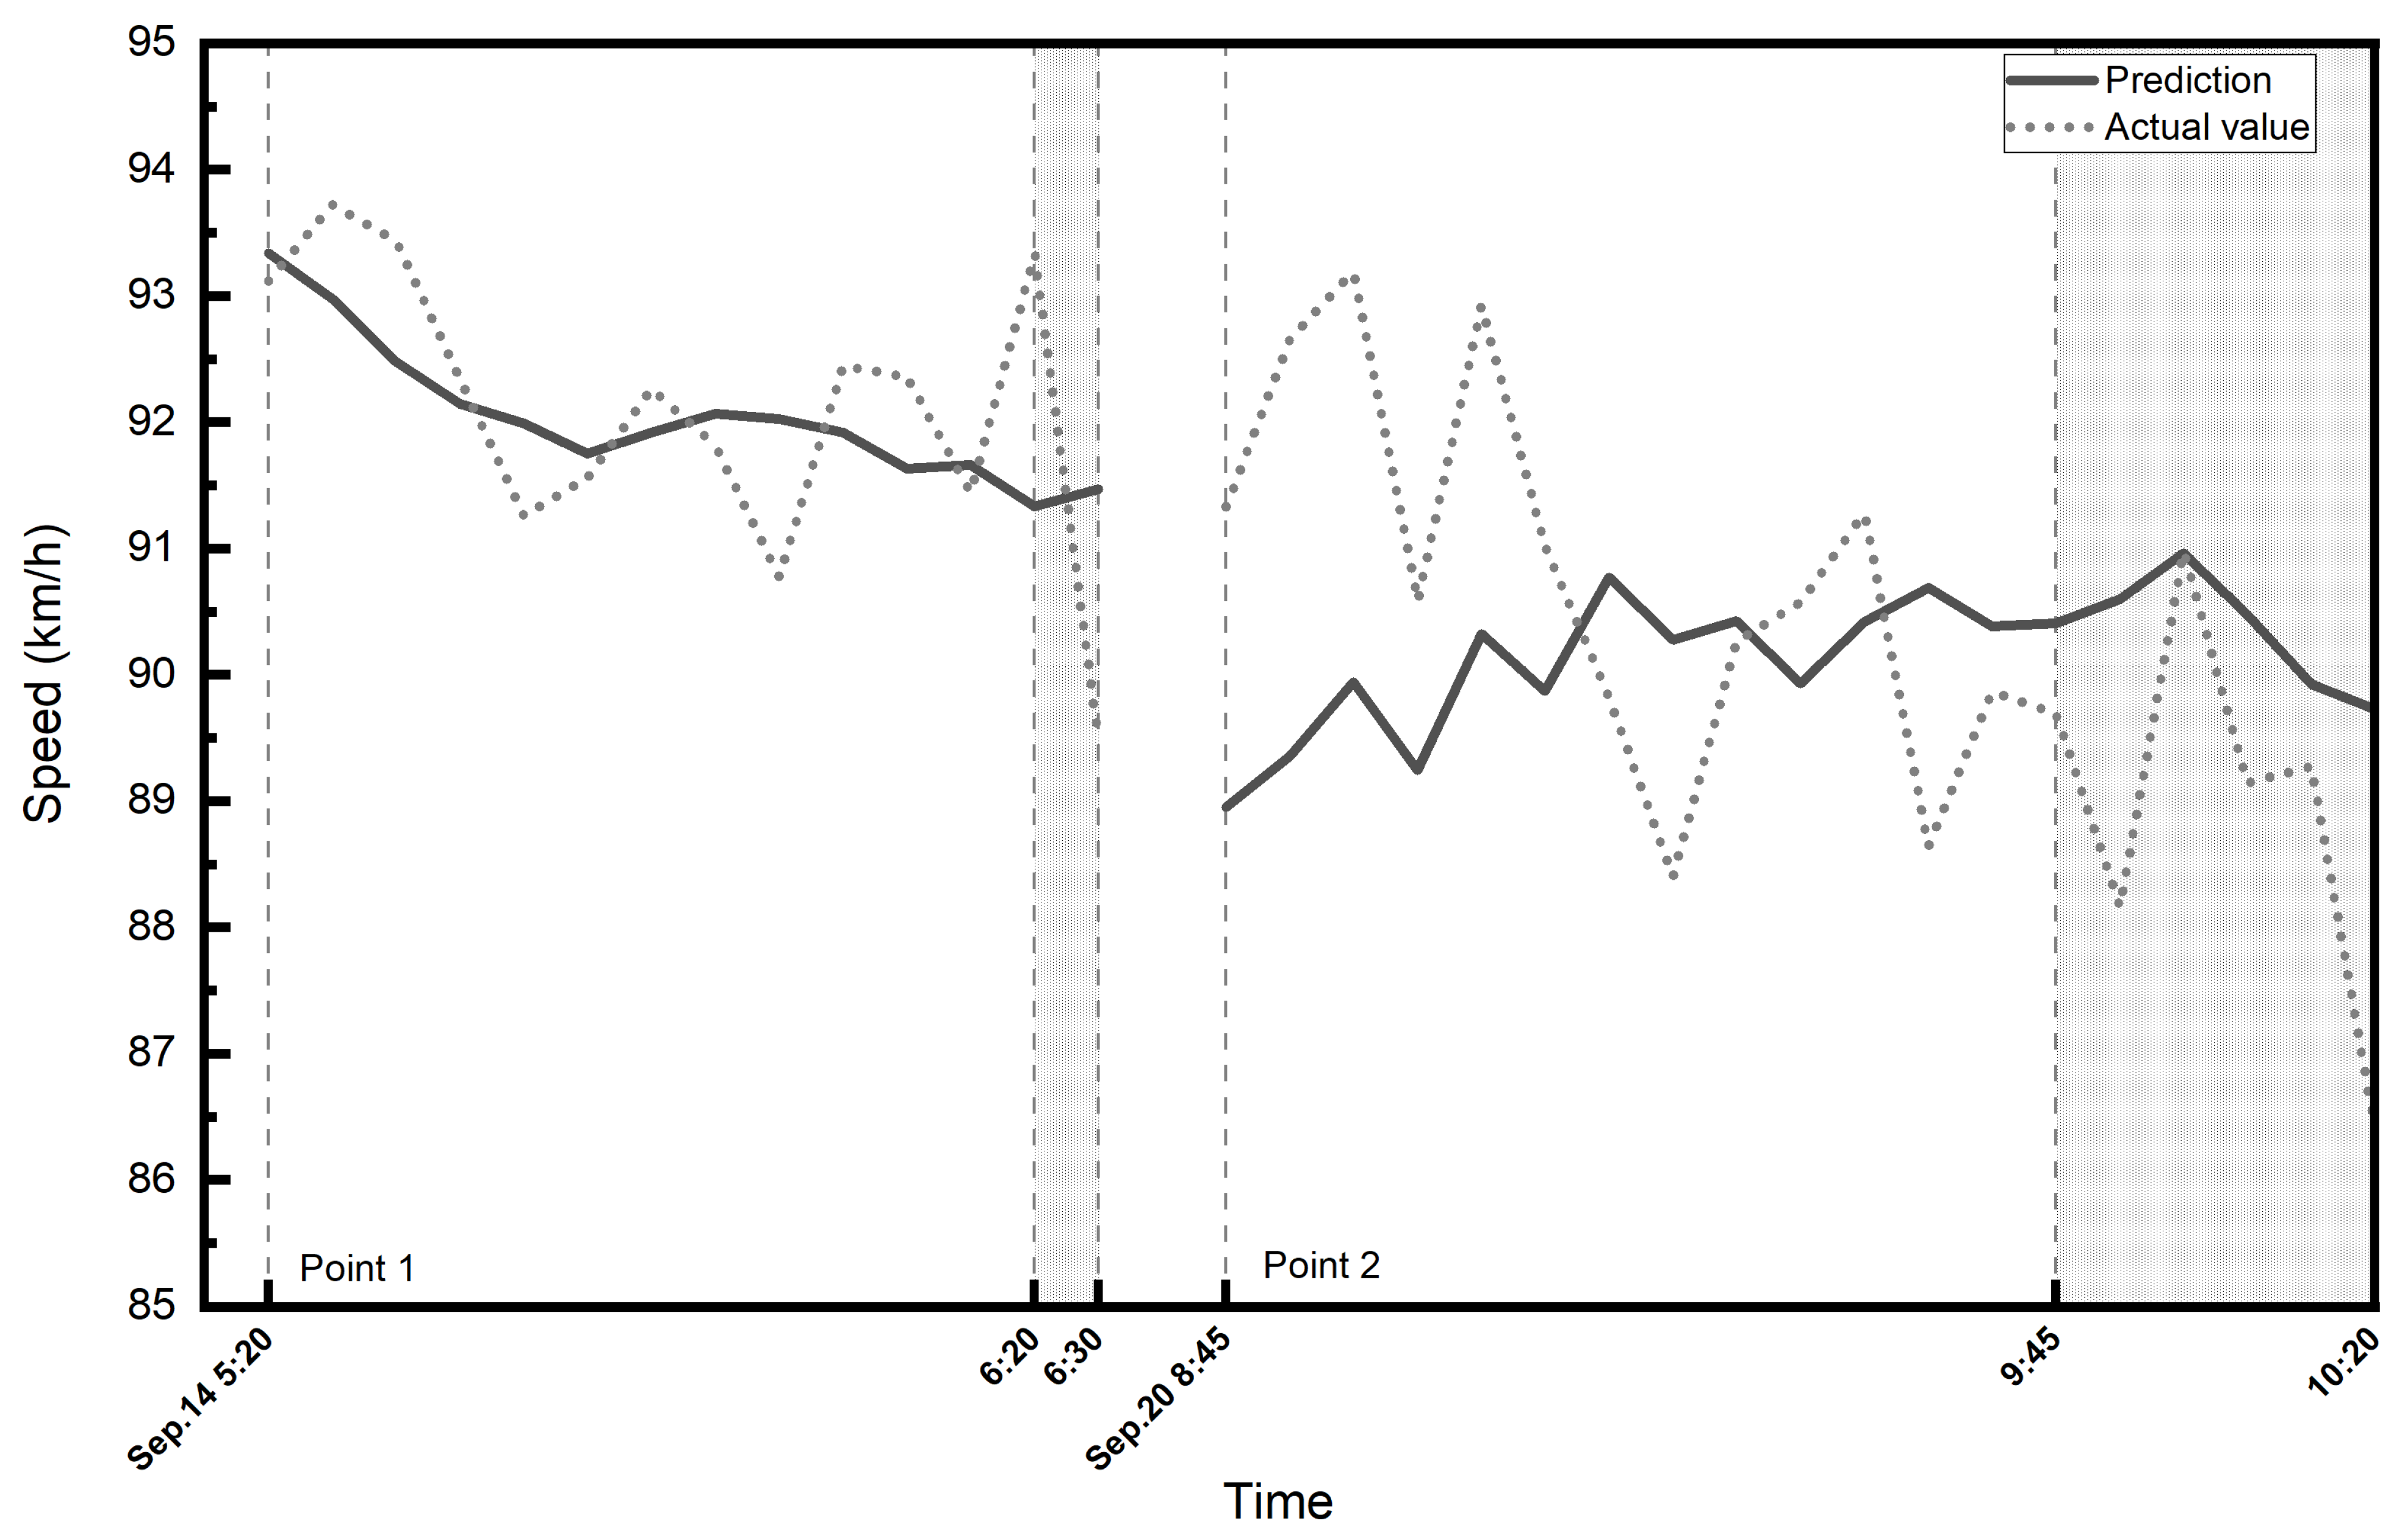
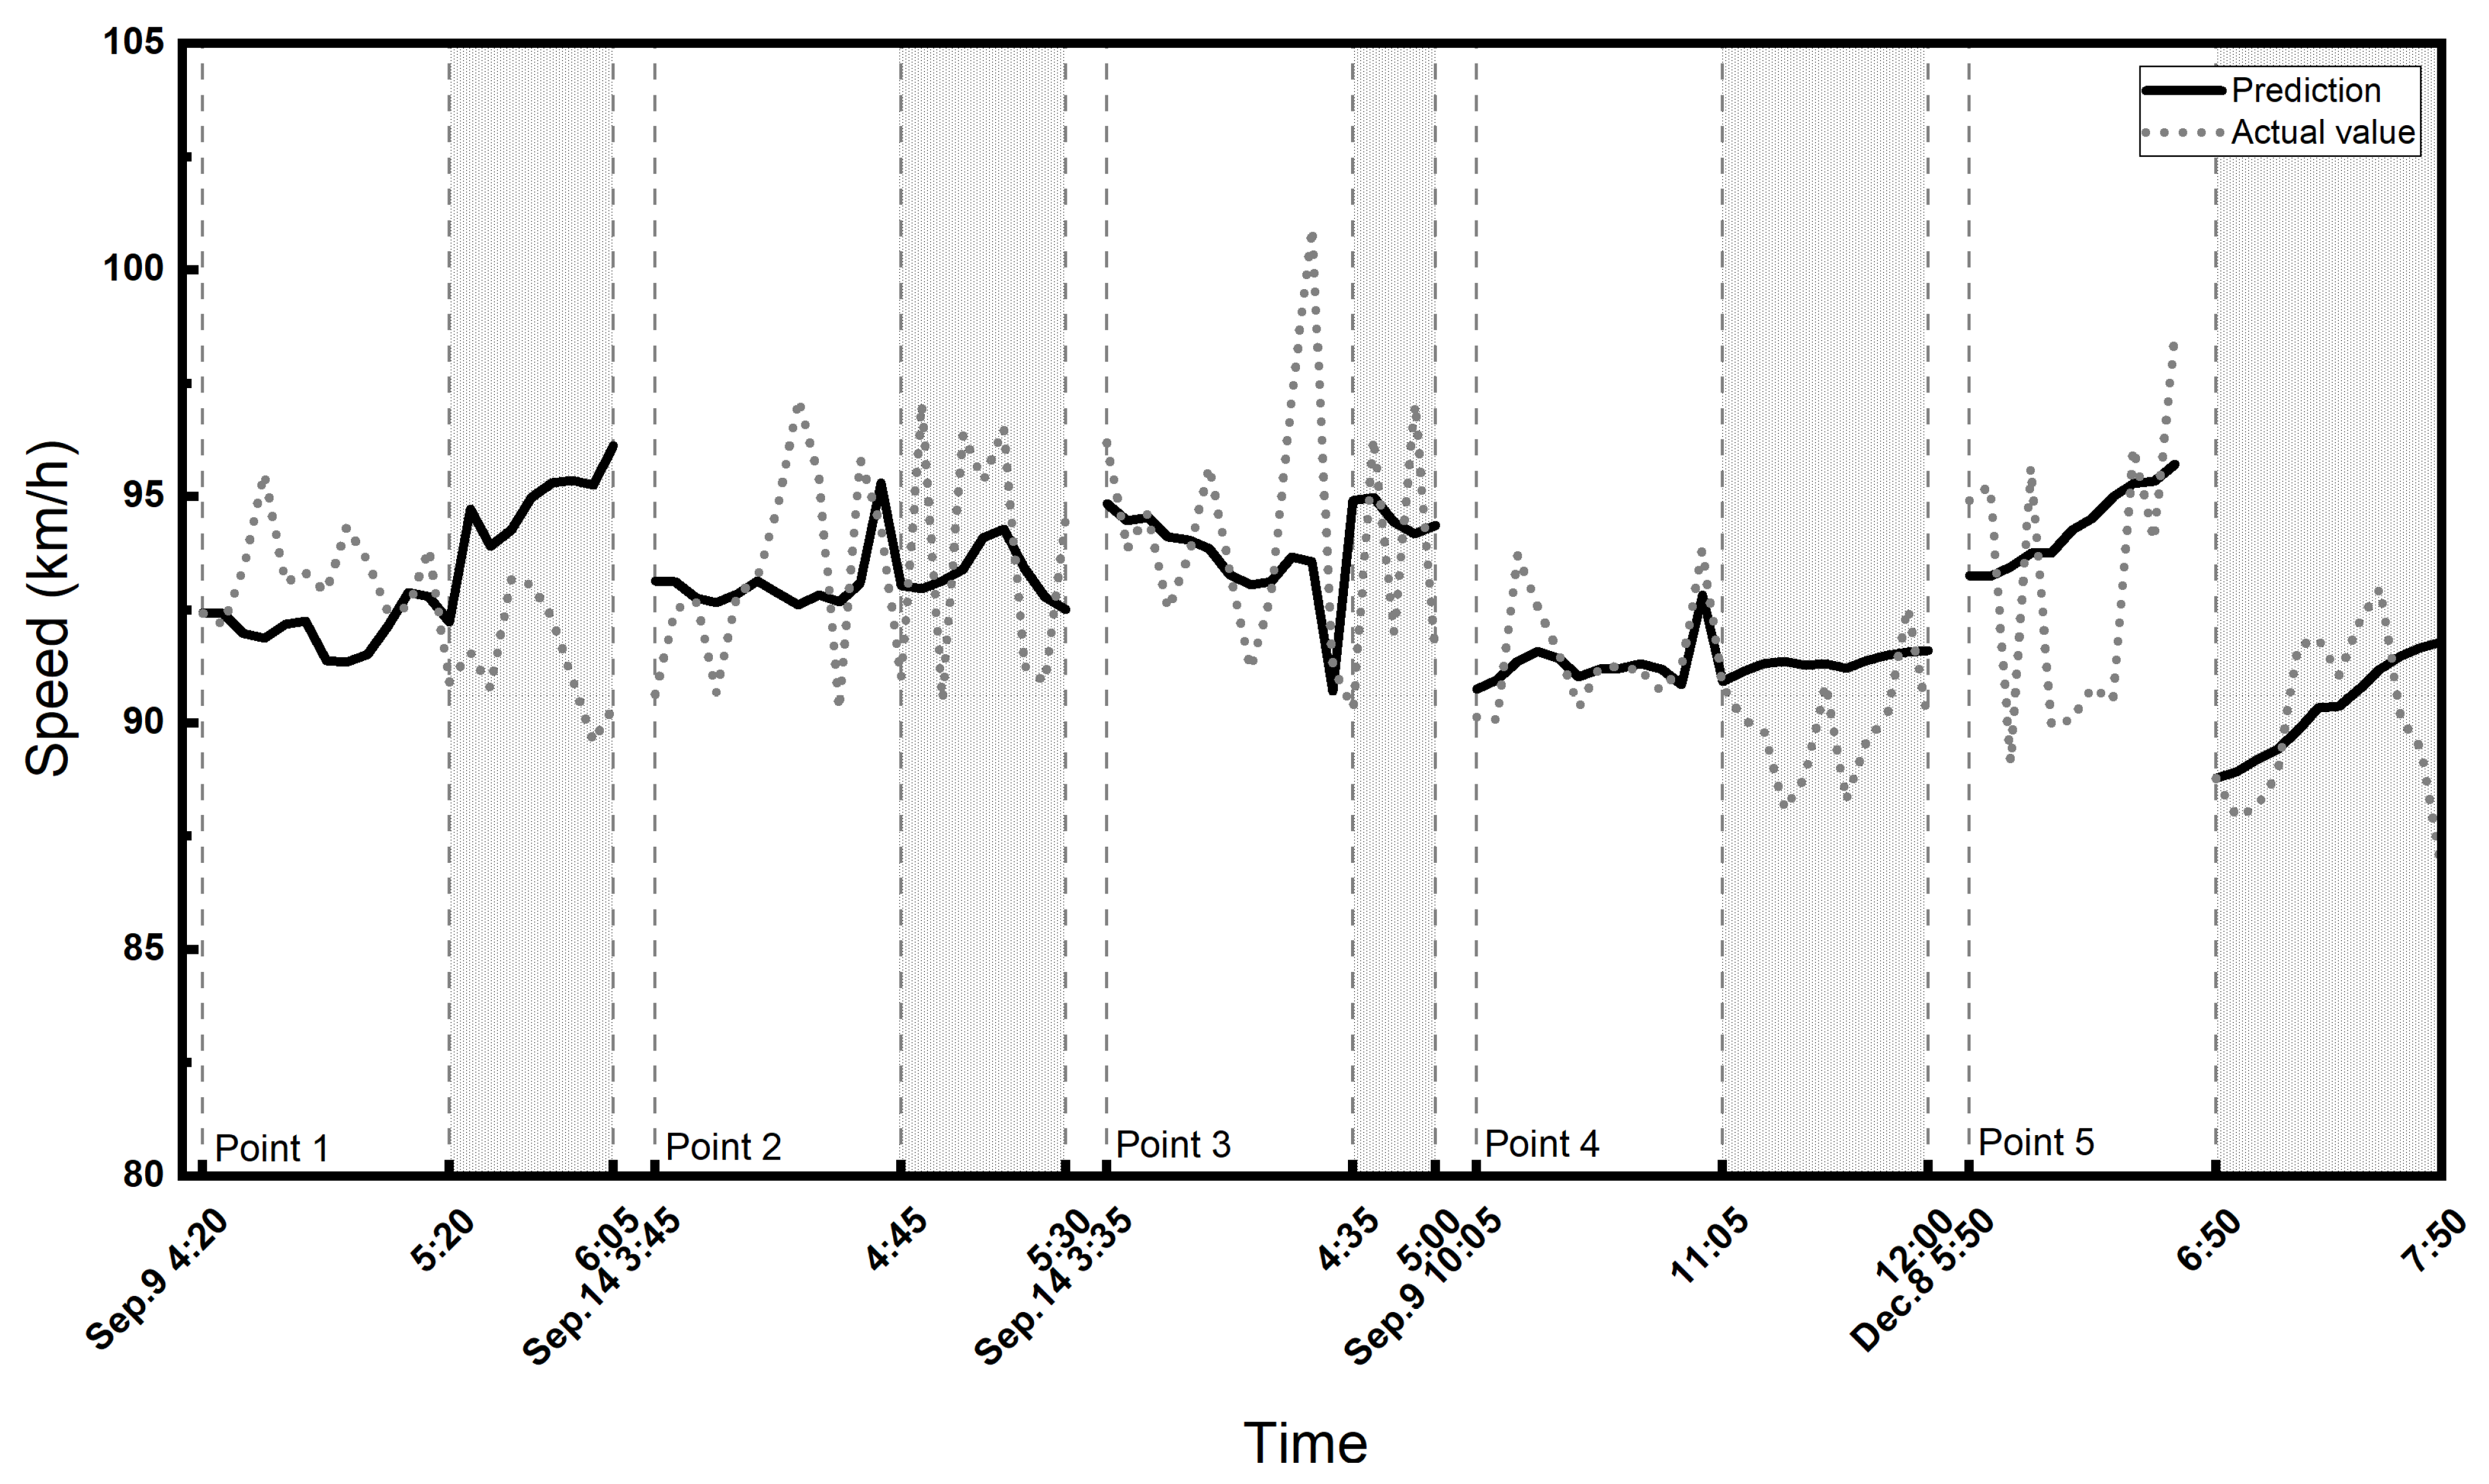
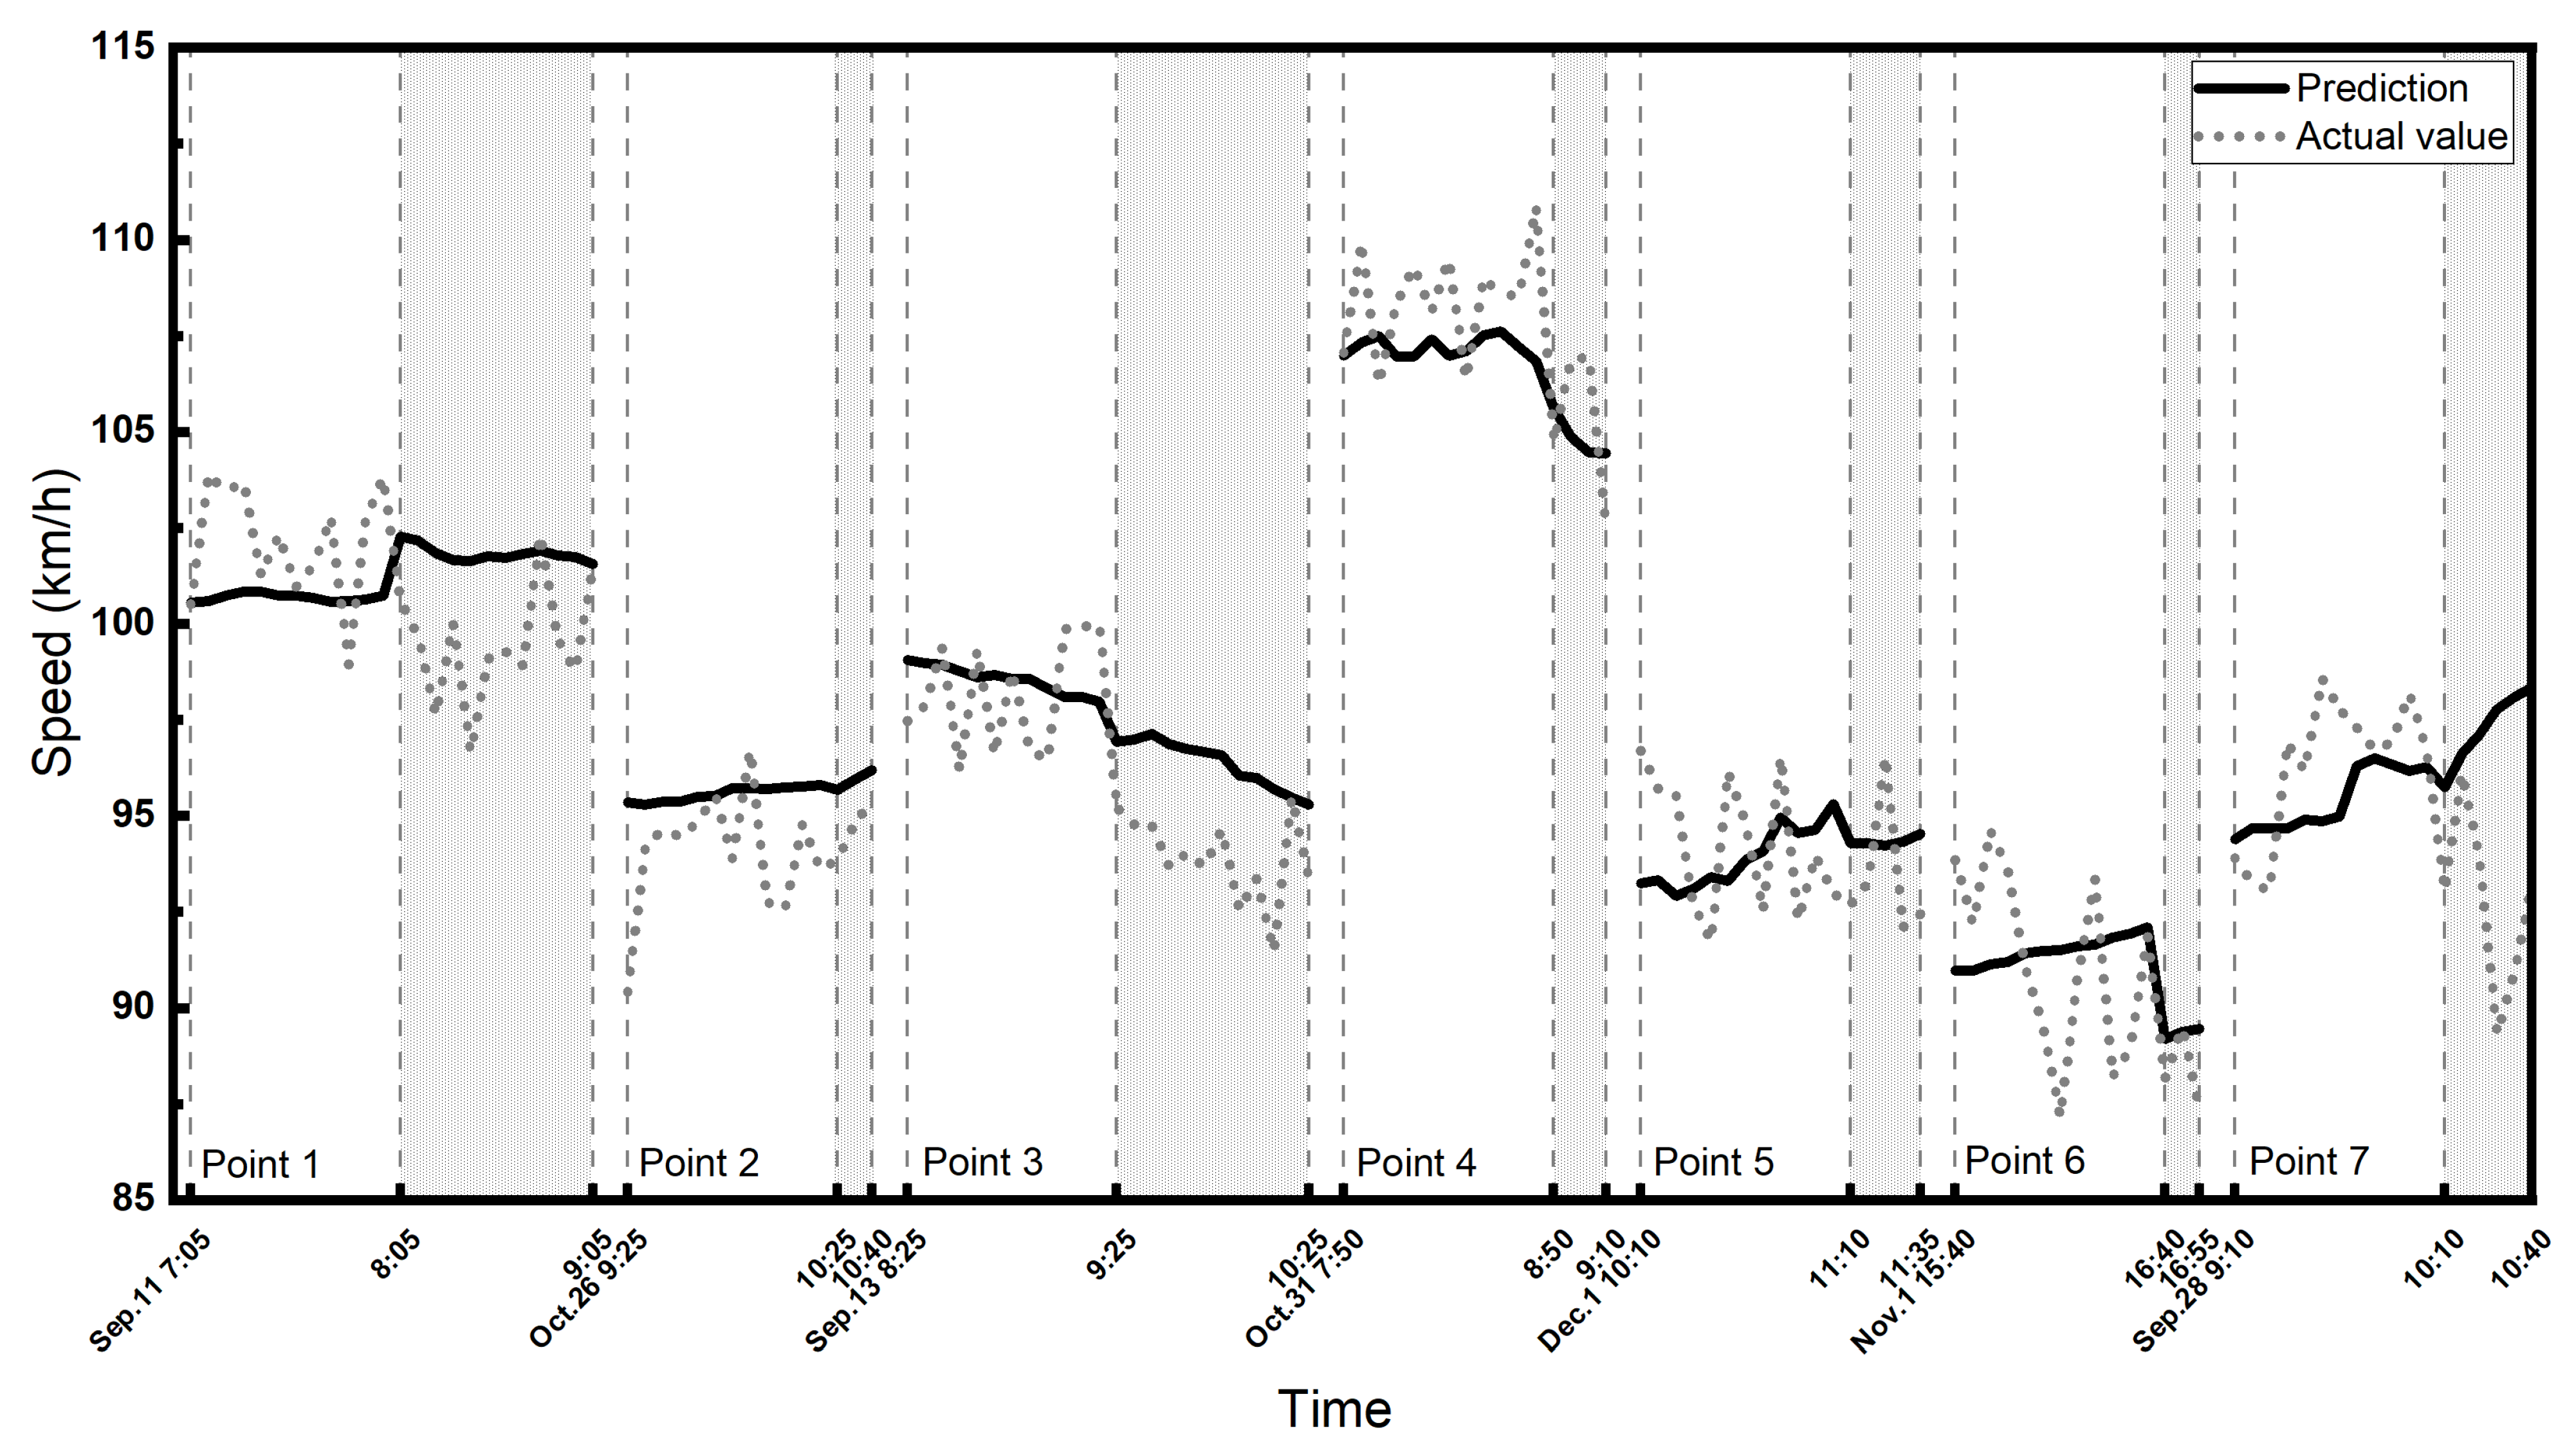
- The crowdsourced data of police speed enforcement reported between September and December 2021 in The Netherlands are provided by a navigation app. The dataset includes the latitude, longitude, and start and end time information reported by users on the navigation apps, and a sample of the data is provided in Table 2. Erroneous reports were removed, and reported police activities were accurately mapped to specific road segments using their location information. Figure 5 shows the study area and the location of speed loop detectors and reported police activities.
- (i)
- Mean absolute error (MAE):
- (ii)
- Root mean square error (RMSE):
- (iii)
- Accuracy (ACC):where represents the actual traffic speed at time t, represents the predicted speed, n is the total number of test samples, and represents the Frobenius norm. MAE and RMSE can well reflect the deviation between the predicted values and the actual values, and smaller values of them indicate better prediction. ACC is used to detect the prediction precision, and larger values represent better prediction.
5. Conclusions and Future Research
Author Contributions
Funding
Data Availability Statement
Conflicts of Interest
References
- Cabannes, T.; Shyu, F.; Porter, E.; Yao, S.; Wang, Y.; Vincentelli, M.A.S.; Hinardi, S.; Zhao, M.; Bayen, A.M. Measuring regret in routing: Assessing the impact of increased app usage. In Proceedings of the 2018 21st International Conference on Intelligent Transportation Systems (ITSC), Maui, HI, USA, 4–7 November 2018; IEEE: New York, NY, USA, 2018; pp. 2589–2594. [Google Scholar]
- Liu, Y.; Bahrami, S.; Feng, T.; Rasouli, S. Impact of Crowdsourced Speed Check Data on Traffic Speed: A Case Study of The Netherlands. Available online: https://rstrail.nl/wp-content/uploads/2022/09/Liu-Yutian.pdf (accessed on 21 September 2023).
- Times, P. These Are the Most Dangerous Speed Cameras in The Netherlands (For Your Wallet). 2021. Available online: https://pledgetimes.com/these-are-the-most-dangerous-speed-cameras-in-the-netherlands-for-your-wallet/ (accessed on 26 October 2023).
- Min, W.; Wynter, L. Real-time road traffic prediction with spatio-temporal correlations. Transp. Res. Part C Emerg. Technol. 2011, 19, 606–616. [Google Scholar] [CrossRef]
- Yu, H.; Wu, Z.; Wang, S.; Wang, Y.; Ma, X. Spatiotemporal recurrent convolutional networks for traffic prediction in transportation networks. Sensors 2017, 17, 1501. [Google Scholar] [CrossRef] [PubMed]
- Yao, H.; Tang, X.; Wei, H.; Zheng, G.; Li, Z. Revisiting spatial-temporal similarity: A deep learning framework for traffic prediction. In Proceedings of the AAAI Conference on Artificial Intelligence, Honolulu, HI, USA, 29–31 January 2019; Volume 33, pp. 5668–5675. [Google Scholar]
- Liao, B.; Zhang, J.; Wu, C.; McIlwraith, D.; Chen, T.; Yang, S.; Guo, Y.; Wu, F. Deep sequence learning with auxiliary information for traffic prediction. In Proceedings of the 24th ACM SIGKDD International Conference on Knowledge Discovery & Data Mining, London, UK, 19–23 August 2018; pp. 537–546. [Google Scholar]
- Xie, Q.; Guo, T.; Chen, Y.; Xiao, Y.; Wang, X.; Zhao, B.Y. Deep graph convolutional networks for incident-driven traffic speed prediction. In Proceedings of the 29th ACM International Conference on Information & Knowledge Management, Virtual Event, 19–23 October 2020; pp. 1665–1674. [Google Scholar]
- Bao, X.; Jiang, D.; Yang, X.; Wang, H. An improved deep belief network for traffic prediction considering weather factors. Alex. Eng. J. 2021, 60, 413–420. [Google Scholar] [CrossRef]
- Lv, M.; Hong, Z.; Chen, L.; Chen, T.; Zhu, T.; Ji, S. Temporal multi-graph convolutional network for traffic flow prediction. IEEE Trans. Intell. Transp. Syst. 2020, 22, 3337–3348. [Google Scholar] [CrossRef]
- Ryeng, E.O. The effect of sanctions and police enforcement on drivers’ choice of speed. Accid. Anal. Prev. 2012, 45, 446–454. [Google Scholar] [CrossRef] [PubMed]
- Simpson, R.; McCutcheon, M.; Lal, D. Reducing speeding via inanimate police presence: An evaluation of a police-directed field study regarding motorist behavior. Criminol. Public Policy 2020, 19, 997–1018. [Google Scholar] [CrossRef]
- Simpson, R.; Frewing, Q.; Bayer, J. The Effects of Saturation Enforcement on Speed(ing) along a Highway Corridor: Results from a Police-Directed Field Study. Justice Eval. J. 2023, 6, 20–31. [Google Scholar] [CrossRef]
- Semanjski, I.; Gautama, S. Smart city mobility application—Gradient boosting trees for mobility prediction and analysis based on crowdsourced data. Sensors 2015, 15, 15974–15987. [Google Scholar] [CrossRef]
- Zhou, X.; Zhang, L. Crowdsourcing functions of the living city from Twitter and Foursquare data. Cartogr. Geogr. Inf. Sci. 2016, 43, 393–404. [Google Scholar] [CrossRef]
- Alhumoud, S. Twitter analysis for intelligent transportation. Comput. J. 2019, 62, 1547–1556. [Google Scholar] [CrossRef]
- Lin, Y.; Li, R. Real-time traffic accidents post-impact prediction: Based on crowdsourcing data. Accid. Anal. Prev. 2020, 145, 105696. [Google Scholar] [CrossRef]
- Hoseinzadeh, N.; Liu, Y.; Han, L.D.; Brakewood, C.; Mohammadnazar, A. Quality of location-based crowdsourced speed data on surface streets: A case study of Waze and Bluetooth speed data in Sevierville, TN. Comput. Environ. Urban Syst. 2020, 83, 101518. [Google Scholar] [CrossRef]
- Ali, F.; Ali, A.; Imran, M.; Naqvi, R.A.; Siddiqi, M.H.; Kwak, K.S. Traffic accident detection and condition analysis based on social networking data. Accid. Anal. Prev. 2021, 151, 105973. [Google Scholar] [CrossRef] [PubMed]
- Hosseini, M.; El-Diraby, T.; Shalaby, A. Supporting sustainable system adoption: Socio-semantic analysis of transit rider debates on social media. Sustain. Cities Soc. 2018, 38, 123–136. [Google Scholar] [CrossRef]
- Osorio-Arjona, J.; Horak, J.; Svoboda, R.; García-Ruíz, Y. Social media semantic perceptions on Madrid Metro system: Using Twitter data to link complaints to space. Sustain. Cities Soc. 2021, 64, 102530. [Google Scholar] [CrossRef]
- Kabbani, O. Leveraging Twitter Data to Support Transit Planning and Operations. Ph.D. Thesis, University of Toronto (Canada), Toronto, ON, Canada, 2020. [Google Scholar]
- Liebig, T.; Piatkowski, N.; Bockermann, C.; Morik, K. Dynamic route planning with real-time traffic predictions. Inf. Syst. 2017, 64, 258–265. [Google Scholar] [CrossRef]
- Ahmed, M.S.; Cook, A.R. Analysis of Freeway Traffic Time-Series Data by Using Box-Jenkins Techniques; Number 722; Transportation Research Board: Washington, DC, USA, 1979. [Google Scholar]
- Wang, H.; Liu, L.; Dong, S.; Qian, Z.; Wei, H. A novel work zone short-term vehicle-type specific traffic speed prediction model through the hybrid EMD–ARIMA framework. Transp. B Transp. Dyn. 2016, 4, 159–186. [Google Scholar] [CrossRef]
- Van Hinsbergen, C.P.; Schreiter, T.; Zuurbier, F.S.; Van Lint, J.; Van Zuylen, H.J. Localized extended kalman filter for scalable real-time traffic state estimation. IEEE Trans. Intell. Transp. Syst. 2011, 13, 385–394. [Google Scholar] [CrossRef]
- Qi, Y.; Ishak, S. A Hidden Markov Model for short term prediction of traffic conditions on freeways. Transp. Res. Part C Emerg. Technol. 2014, 43, 95–111. [Google Scholar] [CrossRef]
- Sun, J.; Sun, J. A dynamic Bayesian network model for real-time crash prediction using traffic speed conditions data. Transp. Res. Part C Emerg. Technol. 2015, 54, 176–186. [Google Scholar] [CrossRef]
- Rzeszótko, J.; Nguyen, S.H. Machine learning for traffic prediction. Fundam. Inform. 2012, 119, 407–420. [Google Scholar] [CrossRef]
- Boukerche, A.; Wang, J. Machine Learning-based traffic prediction models for Intelligent Transportation Systems. Comput. Netw. 2020, 181, 107530. [Google Scholar] [CrossRef]
- Lv, Z.; Xu, J.; Zheng, K.; Yin, H.; Zhao, P.; Zhou, X. Lc-rnn: A deep learning model for traffic speed prediction. In Proceedings of the IJCAI, Stockholm, Sweden, 13–19 July 2018; Volume 2018, p. 27. [Google Scholar]
- Yin, X.; Wu, G.; Wei, J.; Shen, Y.; Qi, H.; Yin, B. Deep learning on traffic prediction: Methods, analysis and future directions. IEEE Trans. Intell. Transp. Syst. 2021, 23, 4927–4943. [Google Scholar] [CrossRef]
- Csikós, A.; Viharos, Z.J.; Kis, K.B.; Tettamanti, T.; Varga, I. Traffic speed prediction method for urban networks—An ANN approach. In Proceedings of the 2015 International Conference on Models and Technologies for Intelligent Transportation Systems (MT-ITS), Budapest, Hungary, 3–5 June 2015; pp. 102–108. [Google Scholar] [CrossRef]
- Ma, X.; Dai, Z.; He, Z.; Ma, J.; Wang, Y.; Wang, Y. Learning traffic as images: A deep convolutional neural network for large-scale transportation network speed prediction. Sensors 2017, 17, 818. [Google Scholar] [CrossRef]
- Rawat, W.; Wang, Z. Deep convolutional neural networks for image classification: A comprehensive review. Neural Comput. 2017, 29, 2352–2449. [Google Scholar] [CrossRef] [PubMed]
- Wu, Z.; Pan, S.; Chen, F.; Long, G.; Zhang, C.; Philip, S.Y. A comprehensive survey on graph neural networks. IEEE Trans. Neural Netw. Learn. Syst. 2020, 32, 4–24. [Google Scholar] [CrossRef] [PubMed]
- Yu, B.; Lee, Y.; Sohn, K. Forecasting road traffic speeds by considering area-wide spatio-temporal dependencies based on a graph convolutional neural network (GCN). Transp. Res. Part C Emerg. Technol. 2020, 114, 189–204. [Google Scholar] [CrossRef]
- Wu, Z.; Huang, M.; Zhao, A. Traffic prediction based on GCN-LSTM model. In Journal of Physics: Conference Series, Proceedings of the International Conference on Internet of Things and Smart City (IoTSC 2021), Kunming, China, 4–6 June 2021; IOP Publishing: Bristol, UK, 2021; Volume 1972, p. 012107. [Google Scholar]
- Zhao, L.; Song, Y.; Zhang, C.; Liu, Y.; Wang, P.; Lin, T.; Deng, M.; Li, H. T-gcn: A temporal graph convolutional network for traffic prediction. IEEE Trans. Intell. Transp. Syst. 2019, 21, 3848–3858. [Google Scholar] [CrossRef]
- Dai, G.; Ma, C.; Xu, X. Short-term traffic flow prediction method for urban road sections based on space–time analysis and GRU. IEEE Access 2019, 7, 143025–143035. [Google Scholar] [CrossRef]
- Shi, H.; Pan, C.; Yang, L.; Gu, X. AGG: A Novel Intelligent Network Traffic Prediction Method Based on Joint Attention and GCN-GRU. Secur. Commun. Netw. 2021, 2021, 7751484. [Google Scholar] [CrossRef]
- Ge, L.; Li, H.; Liu, J.; Zhou, A. Temporal graph convolutional networks for traffic speed prediction considering external factors. In Proceedings of the 2019 20th IEEE International Conference on Mobile Data Management (MDM), Hong Kong, China, 10–13 June 2019; IEEE: New York, NY, USA, 2019; pp. 234–242. [Google Scholar]
- Wang, J.; Zhu, W.; Sun, Y.; Tian, C. An effective dynamic spatiotemporal framework with external features information for traffic prediction. Appl. Intell. 2021, 51, 3159–3173. [Google Scholar] [CrossRef]
- Cui, Z.; Henrickson, K.; Ke, R.; Wang, Y. Traffic Graph Convolutional Recurrent Neural Network: A Deep Learning Framework for Network-Scale Traffic Learning and Forecasting. IEEE Trans. Intell. Transp. Syst. 2020, 21, 4883–4894. [Google Scholar] [CrossRef]
- Zhu, J.; Wang, Q.; Tao, C.; Deng, H.; Zhao, L.; Li, H. AST-GCN: Attribute-augmented spatiotemporal graph convolutional network for traffic forecasting. IEEE Access 2021, 9, 35973–35983. [Google Scholar] [CrossRef]
- Niepert, M.; Ahmed, M.; Kutzkov, K. Learning Convolutional Neural Networks for Graphs. In Proceedings of the 33rd International Conference on Machine Learning, New York, NY, USA, 20–22 June 2016; Balcan, M.F., Weinberger, K.Q., Eds.; Volume 48, pp. 2014–2023. [Google Scholar]
- Defferrard, M.; Bresson, X.; Vandergheynst, P. Convolutional neural networks on graphs with fast localized spectral filtering. Adv. Neural Inf. Process. Syst. 2016, 29. Available online: https://proceedings.neurips.cc/paper_files/paper/2016/hash/04df4d434d481c5bb723be1b6df1ee65-Abstract.html (accessed on 26 October 2023).


| ID | Start_Period | End_Period | Average_Speed (km/h) | Lane | Category |
|---|---|---|---|---|---|
| RWS01_MONIBAS_0021hrl1726ra | 9/3/2021 0:00 | 9/3/2021 0:05 | 113.49 | lane2 | anyVehicle |
| RWS01_MONIBAS_0021hrl1726ra | 9/3/2021 0:05 | 9/3/2021 0:10 | 113.54 | lane2 | anyVehicle |
| RWS01_MONIBAS_0021hrl1726ra | 9/3/2021 0:10 | 9/3/2021 0:15 | 112.31 | lane2 | anyVehicle |
| RWS01_MONIBAS_0021hrl1726ra | 9/3/2021 0:15 | 9/3/2021 0:20 | 106.09 | lane2 | anyVehicle |
| RWS01_MONIBAS_0021hrl1726ra | 9/3/2021 0:20 | 9/3/2021 0:25 | 115.54 | lane2 | anyVehicle |
| RWS01_MONIBAS_0021hrl1726ra | 9/3/2021 0:25 | 9/3/2021 0:30 | 112.32 | lane2 | anyVehicle |
| … |
| ID | Created_at | Updated_at | Latitude | Longitude | Highway | Location |
|---|---|---|---|---|---|---|
| 1 | 2021-11-08 15:06 | 2021-11-08 16:14 | 51.3699 | 5.52383 | A2 | Valkenswaard |
| 2 | 2021-09-10 06:04 | 2021-09-10 06:42 | 51.37228406 | 5.521841 | A2 | Valkenswaard |
| 3 | 2021-09-11 11:36 | 2021-09-11 14:38 | 51.37074803 | 5.523306 | A2 | Valkenswaard |
| 4 | 2021-09-10 05:15 | 2021-09-10 05:21 | 51.36998451 | 5.524018 | A2 | Valkenswaard |
| 5 | 2021-09-14 19:31 | 2021-09-15 03:55 | 51.36921362 | 5.524737 | A2 | Valkenswaard |
| 6 | 2021-09-09 05:53 | 2021-09-09 06:52 | 51.36845498 | 5.525459 | A2 | Valkenswaard |
| … |
| With Police | |||||||
|---|---|---|---|---|---|---|---|
| Groups | Count | Average | F | p-Value | MAE | RMSE | ACC |
| Prediction value | 9 | 90.59 | 2.2836 | 0.1502 | 1.6320 | 1.9177 | 0.9803 |
| Actual value | 9 | 89.59 | |||||
| Without Police | |||||||
| Groups | Count | Average | F | p-Value | MAE | RMSE | ACC |
| Prediction value | 36 | 91.09 | 1.4870 | 0.2289 | 1.9989 | 2.6089 | 0.9840 |
| Actual value | 36 | 91.55 | |||||
| With Police | |||||||
|---|---|---|---|---|---|---|---|
| Groups | Count | Average | F | p-Value | MAE | RMSE | ACC |
| Prediction value | 48 | 96.93 | 4.8102 | 0.0308 | 3.4016 | 4.6643 | 0.9553 |
| Actual value | 48 | 94.56 | |||||
| Without Police | |||||||
| Groups | Count | Average | F | p-Value | MAE | RMSE | ACC |
| Prediction value | 74 | 95.79 | 0.4140 | 0.5210 | 2.7499 | 3.7303 | 0.9683 |
| Actual value | 74 | 96.46 | |||||
| With Police | |||||||
|---|---|---|---|---|---|---|---|
| Groups | Count | Average | F | p-Value | MAE | RMSE | ACC |
| Prediction value | 46 | 92.46 | 5.5116 | 0.0211 | 2.1936 | 2.5764 | 0.9718 |
| Actual value | 46 | 91.36 | |||||
| Without Police | |||||||
| Groups | Count | Average | F | p-Value | MAE | RMSE | ACC |
| Prediction value | 59 | 92.86 | 0.6986 | 0.4050 | 1.6798 | 2.1959 | 0.9718 |
| Actual value | 59 | 93.15 | |||||
| With Police | |||||||
|---|---|---|---|---|---|---|---|
| Groups | Count | Average | F | p-Value | MAE | RMSE | ACC |
| Prediction value | 45 | 97.97 | 5.2935 | 0.0238 | 2.3813 | 2.9230 | 0.9695 |
| Actual value | 45 | 95.88 | |||||
| Without Police | |||||||
| Groups | Count | Average | F | p-Value | MAE | RMSE | ACC |
| Prediction value | 84 | 97.54 | 0.1173 | 0.7324 | 1.7312 | 2.0463 | 0.9791 |
| Actual value | 84 | 97.82 | |||||
Disclaimer/Publisher’s Note: The statements, opinions and data contained in all publications are solely those of the individual author(s) and contributor(s) and not of MDPI and/or the editor(s). MDPI and/or the editor(s) disclaim responsibility for any injury to people or property resulting from any ideas, methods, instructions or products referred to in the content. |
© 2023 by the authors. Licensee MDPI, Basel, Switzerland. This article is an open access article distributed under the terms and conditions of the Creative Commons Attribution (CC BY) license (https://creativecommons.org/licenses/by/4.0/).
Share and Cite
Liu, Y.; Feng, T. The Effect of Crowdsourced Police Enforcement Data on Traffic Speed: A Case Study of The Netherlands. Appl. Sci. 2023, 13, 11822. https://doi.org/10.3390/app132111822
Liu Y, Feng T. The Effect of Crowdsourced Police Enforcement Data on Traffic Speed: A Case Study of The Netherlands. Applied Sciences. 2023; 13(21):11822. https://doi.org/10.3390/app132111822
Chicago/Turabian StyleLiu, Yutian, and Tao Feng. 2023. "The Effect of Crowdsourced Police Enforcement Data on Traffic Speed: A Case Study of The Netherlands" Applied Sciences 13, no. 21: 11822. https://doi.org/10.3390/app132111822
APA StyleLiu, Y., & Feng, T. (2023). The Effect of Crowdsourced Police Enforcement Data on Traffic Speed: A Case Study of The Netherlands. Applied Sciences, 13(21), 11822. https://doi.org/10.3390/app132111822