Abstract
Visitors have a significant impact on the indoor climate of buildings housing works of art, and the relationship between the number of visitors, the indoor air quality and the protection of exposed works of art is an important factor in the overall study of the indoor climate of heritage buildings without mechanical ventilation and/or air-conditioning systems. In view of these concerns and the lack of studies on natural ventilation in heritage buildings, this study aims to analyse the performance of natural ventilation in the São Cristóvão Church in Lisbon, Portugal. For the preparation of this study, an analysis of the natural ventilation of this church was carried out by creating a model in the CONTAM software, and the indoor air quality was analysed based on different international standards and guidelines for carbon dioxide levels and air flow rates (ACH). Estimating the current ventilation strategy, an average ACH of 0.75 h−1 was estimated during the time the church is open, and an ACH of 0.15 h−1 was estimated during the time the doors were closed. In a yearly analysis, an average ACH of 0.30 h−1 was obtained. These air exchange values guarantee EN 16798-1 category I air quality for 72% of the year and category II air quality for 18% of the year. Different natural ventilation strategies were analysed: (a) three scenarios exploring different cross ventilation scenarios; (b) a scenario assuming that the church is closed all year round; and (c) a scenario estimating an increase in the number of visitors, giving an idea of the variations in human pollutants and possible consequences. Taking into account the air infiltration and the fact that masses, an occasional situation with a high number of visitors, are always held just before the church closes, it is guaranteed that carbon dioxide levels will never exceed the limit of 350 ppm above the outdoor values imposed by EN-13779, registering a maximum of 291 ppm.
1. Introduction
The indoor environment in heritage buildings must be adequate to prevent deterioration of the objects due to external factors, such as visitors [1,2]. Visitors, who are a source of heat, moisture, carbon dioxide (CO2) and odours, are also a vehicle for external pollutants that can affect the indoor environment of buildings [3,4]. It is therefore essential to find a sustainable balance between the preservation of works of art and the negative effects of cultural tourism. In recent years, there has been a significant increase in cultural tourism in Portugal, particularly in the metropolitan area of Lisbon [5]. However, in order to ensure a sustained increase in cultural tourism, it is necessary to ensure the preservation of the heritage buildings and collections on display, as well as the comfort and health of visitors [6,7]. Many heritage buildings, particularly churches, have a dual function. On the one hand, they are places of worship where people gather weekly to pray and celebrate special occasions. On the other hand, because of their cultural history, these buildings are used as exhibition spaces, displaying religious art in the form of frescoes, woodwork and relics, as well as modern art. This dual purpose leads to a variable influx of visitors, which can damage the art on display and create an uncomfortable environment for visitors, which can be responsible for symptoms such as eye irritation and, with long-term exposure, can cause serious health problems [8].
In some cases, the strategy of implementing mechanical climate control systems has been used to limit the nefarious effects of overcrowding by creating a stable indoor microclimate. However, the seamless integration of these powerful systems into historic buildings is in most cases impossible due to design and architectural characteristics. The invasive introduction of modern air conditioning has been strongly criticised by several authors, who highlight the dichotomy between maintaining the characteristics of the building and preserving the works of art it houses [9]. Moreover, the energy used to operate such systems is currently being debated in the context of sustainable construction and energy efficiency, where natural ventilation plays an important role. A balanced and sustainable relationship between ventilation and occupancy is of paramount importance for cultural heritage, as it plays a fundamental role in the stability of the indoor climate, energy consumption and the maximisation of visitor use. Although some standards and guidelines provide assumptions, values and criteria that are useful for the analysis of indoor air quality (IAQ) [10,11,12,13,14,15], no consensus has been reached due to differences in content and methodology. Recent studies have reflected the dispersion of results and have shown the impossibility of finding the same ventilation rates in the different studies analysed [15,16,17,18,19,20,21,22,23,24].
In an attempt to study the microclimatic behaviour of the São Cristóvão Church in Lisbon, different studies [25,26,27] have focused on this historic building; however, one aspect that has not yet been analysed is the natural ventilation performance of this church. Since tourism has a significant impact on buildings where works of art are exhibited, the relationship between the number of visitors, the IAQ and the protection of works of art exhibited without protection is an important factor in any study of the indoor climate of ancient historical buildings without mechanical ventilation.
The aim of this study is to determine the ventilation rates during the different periods of the day, when the building is open to visitors and when it is closed, in order to determine the likely concentration rates of pollutants and to deduce the level of occupant satisfaction with air quality. In addition, five ventilation strategies will be studied and compared with the current one.
2. Methodology
2.1. General Considerations
The church of São Cristóvão has been the focus of other studies [1,25,26,27,28,29,30,31,32,33,34,35,36]. In 2012, Silva [37] described the evolution of the interior climate of the São Cristóvão church, studying the stratification of temperatures and the thermal lag with respect to the external temperatures, in order to estimate the probability of surface condensation. They also reported a very stable interior microclimate, with a low temperature and relative humidity cycles. In 2014, Silva et al. [25], through the microclimatic study of the Church of São Cristóvão, were able to apply the EN 15757 [38] standard to a historic building in a temperate climate, highlighting the variation in the requirements for buildings in different locations and proposing a new methodology. In 2015, Silva et al. [35] analysed the influence of different microclimate targets, EN 15757 [38] and PAS 198 [39], in the Church of São Cristóvão and made a comparison between those targets and the natural climate by using a risk-based analysis.
In 2018, Coelho et al. [26] studied the simulation accuracy of several models using hygrothermal data-based collections from the Instituto Português do Mar e da Atmosfera (IPMA), WUFI®Plus and EnergyPlus and compared them with simulations performed on in situ indoor and outdoor measurements. Additionally, simulations were conducted in order to establish simplifications with a low impact on the model’s results. One conclusion of this paper with high relevance for the present document is the air change rate (ACH) variable utilised in the simulations. The development of a sensitivity analysis that included 48 simulations allowed them to create an accuracy optimisation equation based on the goodness of fit and obtain an ACH of 0.4 h−1. This value attained from the several iterations, although optimised based on the real measurements taken, does not reflect real conditions due to, first, the fact that other variables were also estimated and, second, the fact that a ventilation simulation was not conducted.
Concerning the lack of studies on natural ventilation in historic buildings, this paper analyses the natural ventilation of this church using the CONTAM software so that the indoor air quality is assessed by applying different international standards and guidelines for carbon dioxide levels and airflow rates. Different ventilation strategies were analysed: (i) three scenarios exploring different cross-ventilation tactics; (ii) a scenario that assumes the church is closed all year round; and (iii) a scenario which, estimating an increase in the number of users, gives a notion of human pollutants variations and possible consequences.
2.2. The Case-Study
The Church of São Cristovão (see Figure 1) is located on the western hill of São Jorge Castle in Lisbon, in the parish of Santa Maria Maior. On top of the Escadinhas de São Cristovão, a place of worship dating from the XIII century is mentioned in several documents [28,29,30,31] as a church in honour of Santa Maria de Alcamim, built during the Arab occupation of the Iberian Peninsula [28,30]. After a fire destroyed most of the building in the last quarter of the XVI century, restoration works were carried out during the reign of D. Manuel I, and throughout the XVII century, major renovations occurred, implementing deep changes relative to the original structure, which was designed by Padre João Duarte [31,32,33]. As is well known, most historical buildings in Portugal and around the world have different construction materials and techniques from those used today. One of the aspects that characterise old buildings is the thick masonry walls, which have a high thermal inertia. Despite this fact, this type of building has a peculiar hygrothermal response that can contribute to a good daily stability but also to an unstable seasonal microclimate, following the external climate and leading to a delicate balance between conservation, comfort and sustainability [34,35,36].
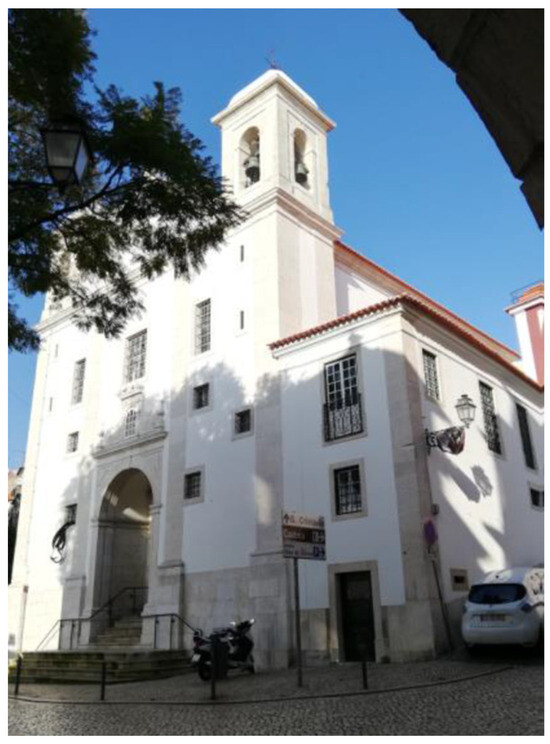
Figure 1.
Church of São Cristóvão.
The cultural importance of this church is enhanced by the fact that it is one of the few to have survived the Lisbon earthquake of 1755, in which minimal damage to the bell towers was reported [28]. The amount of restoration and repair work carried out on the gilded woodcarvings, painted canvas, panels and woodwork throughout the church’s history is well documented [33,34] and is indicative of the sub-optimal conditions of the interior atmospheric environment. In 2018, after winning a public budget initiative and being included in the World Monuments Fund’s Watch programme, major renovations were carried out to the roof and facade. The church consists of a nave and altar (approx. 286 m2) that is 13 m high in the centre of the room, a funerary building to the south (approx. 71 m2), a sacristy (approx. 93 m2) to the north, an annex behind the altar (approx. 11 m2) and two bell towers (approx. 5 m2). Its walls appear to be 0.7–1 m thick, with limestone at the corners and lime mortar on the outer walls over mortared limestone [33]. The main nave is directly connected to the outside by the south-facing main door, an auxiliary door on the north side and 14 windows of different sizes and typologies. It is also connected to the sacristy by two doorways and to the mortuary by two doorways. More detailed information on the geometry of the church can be found in Section 3.2.
2.3. Multizone Airflow Simulation Tool
CONTAM, from the National Institute of Standards and Technology (NIST), is a multi-zone IAQ and ventilation analysis software developed to estimate airflows, contaminant concentrations and personal exposure for risk assessment activities [36] in both naturally and mechanically ventilated buildings. The software treats a building as a system of interconnected, well-mixed zones through which air and contaminants flow. It can determine ACH, infiltration and exfiltration in building systems driven by wind pressure and thermal buoyancy. It also reproduces the effect of occupants and contaminant sources on IAQ and their dispersion, although this last analysis requires coupling with other software. Due to its user-friendly graphical interface and input flexibility, CONTAM has been used in several scientific papers [35,40,41,42,43]. To estimate an accurate representation of the IAQ and natural ventilation performance, several inputs must be considered.
2.3.1. Weather Input
The minimum requirements for ventilation modelling are side wind velocity (speed and direction) and external temperature. There are many sources of weather information available, but some may misrepresent the real situation due to errors in data collection. For this study, three different weather datasets (IPMA-2020 GCD, EnergyPlus weather data and SNIRH) were analysed in a preliminary stage of the study:
- IPMA-2020 GCD—Weather Station was obtained directly from IPMA and is a raw set of the wind intensities and directions for the year 2020. These data were collected at the weather station near Lisbon airport, 6.4 km from the São Cristovão church.
- EnergyPlus weather data. The Lisbon dataset is based on the spatial interpolation of public weather data published by Instituto de Meteorologia 1951–1980 and obtained from the EnergyPlus database. The data in this file are a representation of the average values collected across 30 years [44].
- SNIRH makes all the data collected available on its website. In the case of Lisbon, three weather stations are available for data retrieval, but unfortunately, there are significant gaps in the analysed data due to equipment malfunctions and lost information.
From the analysis of the weather files, it can be said that the SNIRH file showed several deficiencies in recording the wind direction, so the SNIRH weather file was discarded due to the lack of wind data. In a first stage of modelling, different simulations were carried out to assess the impact of using the IPMA and EnergyPlus weather datasets, in order to evaluate the consequence of using either dataset on the ACH values. From the preliminary tests, it was concluded that although the IPMA database provides a wider range of wind directions, the data it provides are for a single year (2020), and therefore, using these values as a reference in the simulation may not guarantee the best representation of climate trends over time. Weather data in building ventilation performance and IAQ is a complex issue that can lead to incorrect assumptions, as reported by [44,45,46]. Thus, the weather file used in the simulations is the one obtained from the EnergyPlus database [47].
2.3.2. Contaminant Sources and Schedules
CONTAM offers a variety of source models for the generation and dispersion rates of air pollutants. The only pollutant present in the simulations is CO2, and it was implemented with 44.01 g/mol and 400 ppm as the default ambient value. As only CO2 emissions are analysed and the emission rates are stable, the constant coefficient model was chosen. To take into account the non-instantaneous nature of the pollutant source, an incremental coefficient and therefore a trapezoidal schedule were applied to reflect the cumulative entry and exit of the mass participants.
Two sources were created to reflect both variables regarding CO2 releases:
- The first source is responsible for simulating the mass attendees entering the church, celebrating the mass and exiting the building. A source was set to release 0.0046 L/s.person of CO2, corresponding to a typical human in “mass-like” conditions. This value was an extrapolation of Table 4 from Persily et al. [48], where an MET value of 1.3 was adopted, the male/female ratio was set to 1 and the ages ranged from 50 to 80. A factor of 40 was applied to reflect the number of attendees.
- The second source was implemented to simulate visitors’ effect on CO2 emissions during the off-mass period. The church administration estimates 150 persons visiting during the Wintertime and 250 persons visiting during the Summertime, although no records were available.
Using these values as a basis for the subsequent analyses, the following aspects were considered: (i) the daily and yearly constant distribution of visitors in the off-mass period; (ii) the church is opened 36 h per week in an off-mass period; and (iii) an average of 5 people per hour was considered and a source was set to release 0.0068 L/s.person of CO2, reflecting visitors aged 20 to 60 years and an activity level equivalent to 2 MET. Although a variable number of visitors should be implemented to better reflect the true nature of CO2 emissions across seasons, nevertheless, the main factor in this analysis is the mass period, which is regular throughout the year and much more influential on IAQ.
The daily schedules implemented in the simulation are as shown in Table 1, and the weekly distribution of time for each of the church’s undertaken activities is presented in Figure 2.

Table 1.
São Cristóvão Church’s schedule used in CONTAM.
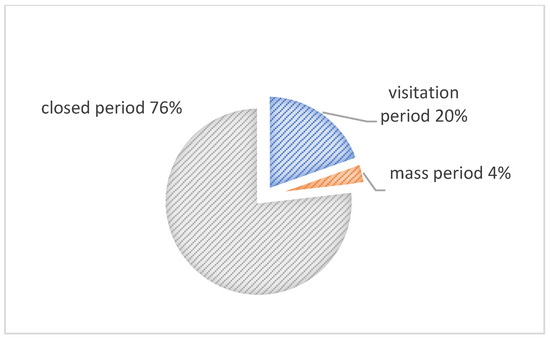
Figure 2.
Weekly percentage of time for each church activity period.
The church is closed most of the time, and only 4% of the week is expected to have a significant number of people.
2.3.3. Flow Paths
One of the most critical factors in the simulation setup is the definition of the existing flow paths in the church, such as the air infiltration coefficient, which describes the air tightness of the windows and doors. The flow path information was determined based on a combination of the authors’ own measurements and the sacristy’s renovation plans. A list of flow path types and Equivalent Leakage Area (ELA) values is given in Table 2. The flow path parameters were calibrated on the basis of field measurements and literature data, such as AIVC Guide 5 [49].
Table 2.
Flow path types identified at São Cristóvão’s Church.
2.4. Model Geometry
A model with five levels has been created. The first floor, level 0, is below the main entrance level of the church and has only one compartment on the south side of the church, in the mortuary house. This room, inaccessible to visitors, was connected to the upper floor. On the ground floor are the main and secondary entrances, as well as the spans that connect the nave to the sacristy and mortuary house.
There is also an external access to the sacristy. On the second floor, although there is no connection between the nave and the other rooms, most of the windows are located here. On the third floor, some windows connect the nave and the exterior. On this level are the support buildings, the sacristy and the roofs of the mortuary. The fourth floor contains only the belfries, with a presumably horizontal wooden hatch allowing access to the bells for maintenance.
Although every compartment of the church was implemented in CONTAM, because visitors only have access to the main nave, the support rooms and accesses were not included in the hole building volume. In Figure 3, the highlighted area represents the space that is considered for the ACH calculation. This choice was made because not ignoring the bell towers and other compartments leads to a significant increase in the ventilation rate. In addition, to account for the contribution of the chimney effect and the temperature stratification that occur in the church, as previously reported by Silva [37], the building airflow model was implemented to represent temperature variations and the associated buoyancy-driven airflow (Figure 3). This involved setting temperature differences in the zones and specifying airflow paths to allow for the vertical movement of air.
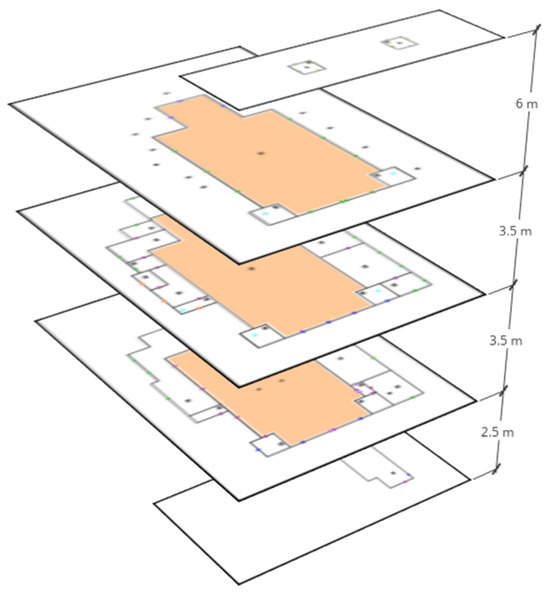
Figure 3.
Schematic illustration of São Cristóvão’s Church’s levels in CONTAM.
The simulations were carried out for the period of January to December. The initial temperatures for each zone at the start of the simulation are specified. These initial conditions serve as the baseline for the simulation (this information was collected in previous studies [25,27,35,37], which involved several in situ monitoring campaigns). The CONTAM uses a time step approach, and in this study, the simulations were carried out with a 1 h time step to update the temperature in each zone as the simulation progresses.
2.5. Ventilation Strategies
This section describes the conditions and assumptions chosen and implemented in the simulations. Three ventilation strategies were implemented in the CONTAM building model and investigated as follows.
2.5.1. Ventilation Strategy Sim_02
This simulation was set up as a baseline and represents the current natural ventilation conditions of the church. For this simulation, the main church door, as well as the doors connecting the nave to the mortuary, are open during visitation and mass attendance, as indicated by the shaded areas in Figure 4. The shaded area with dotted lines in Figure 4 marks the door connecting the nave to the sacristy, which is opened when mass begins and closed when it is over. All windows are closed in this ventilation strategy.
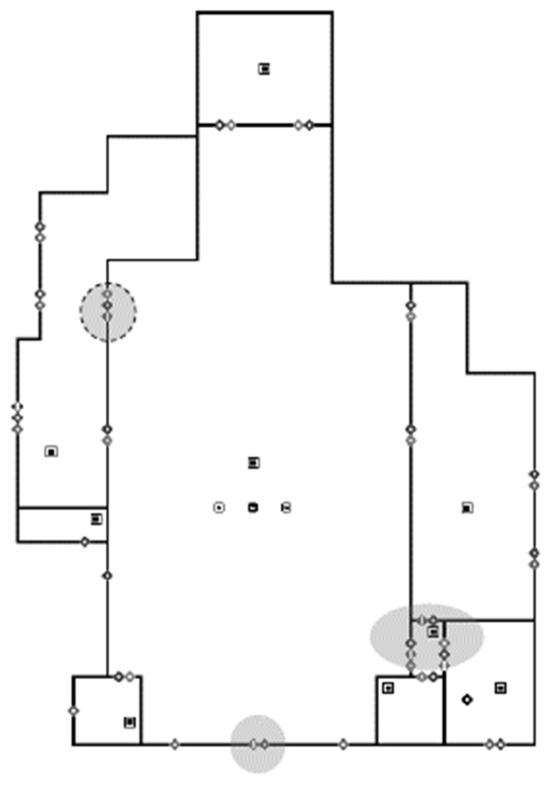
Figure 4.
Sim_02: first floor open/closed spans schematic.
In order to obtain the simulation condition of SIM_02, several attempts were made to create the most accurate model that reflected the real conditions of the building. For the model validation, the ACH obtained in situ by Coelho et al. [27] was used as a reference.
Table 3 shows the effectiveness of the model refinement up to the Sim_02 scenario by comparing the ACH measured in situ as part of another study carried out in the same church. The open-door period is acceptably close to that obtained by Coelho et al. [27], and the annual average ACH is also similar. The difference between Sim_02 and Coelho et al.’s open-door ACH can be explained by the different schedules used in the two studies, the weather database and other factors, such as the state of deterioration of some windows at the time of the in situ measurements by Coelho et al. [27] (which took place a few years before the present study), and therefore, windows with more damage contribute to higher air infiltration rates during the closed period, which may also justify the greater difference in average ACH values for the closed period. For the purpose of this study, the ACH values obtained were considered acceptable and in line with the literature consulted [50].
Table 3.
Sim_02 Average ACH values vs. other model refinement simulations.
2.5.2. Ventilation Strategy Sim_1
Sim_1 reproduces the scenario where the church is closed and no visitors are admitted. For this simulation, some standards and guidelines are not applicable as the fresh air supply is directly related to the number of compartments and users. Since the church was closed during the renovation works and again during the COVID-19 pandemic, some information about the ventilation status during these periods may be useful for a future analysis of extended periods of closure and their impact on the São Cristóvão Church’s art body.
2.5.3. Ventilation Strategy Sim_2
The Sim_2 reflects the opening of the top floor hatch of the bell tower (two 0.25 m2 holes) and the access doors to the main floor of the church during the Spring and Autumn seasons. This strategy aims to take advantage of the chimney effect created by the two towers. Such an approach is difficult to achieve without the implementation of a control system for the bell tower hatch. This is because it is unlikely that someone will be climbing up and down the staircase giving access to the bells every time the hatches need to be opened or closed. Nevertheless, this simulation can be used to assess the impact of the stacking effect on the overall ACH. The shaded and dotted areas in Figure 5 symbolise the spans that are open during the service and the shaded areas represent the doors that are open throughout the church’s opening hours. The same conditions from Sim_02 were applied to all other spans throughout the visitation attendance status.
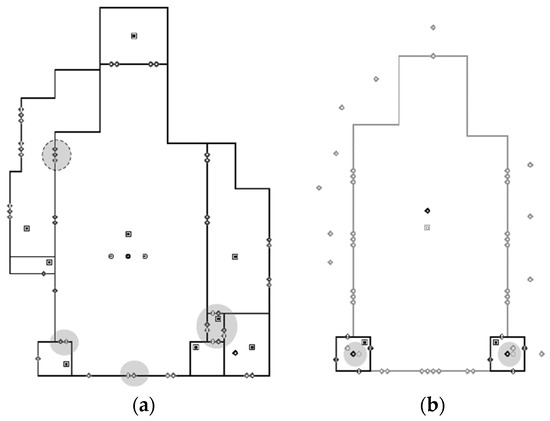
Figure 5.
Sim_2: first floor (a) and fourth floor (b) open span schematic (light grey walls and airflow paths represent the floor below).
2.5.4. Ventilation Strategies: Sim_3.1 and Sim_3.2
The next set of simulations aims to investigate the most effective way of renewing the indoor air using a cross-ventilation strategy. Figure 6 illustrates the cross-ventilation strategies (Sim_3.1 and Sim_3.2), where intake and exhaust can occur on opposite facades depending on the wind direction, according to the positive or negative wind pressures generated on the facades. For Sim_3.1, some windows on the north and south facades on the first floor are open during mass, as are the doors connecting the mortuary and sacristy areas to the nave. The same conditions of Sim_02 have been applied to all of the other spans throughout the visitation period. This strategy takes advantage of the prevailing north wind and increases the ACH values. In the case of Sim_3.2, most of the east windows on the first floor and the doors connecting the altar to the nave annex are set to open during the mass service. The same conditions as in Sim_02 were applied to all other spans throughout the visitation period.
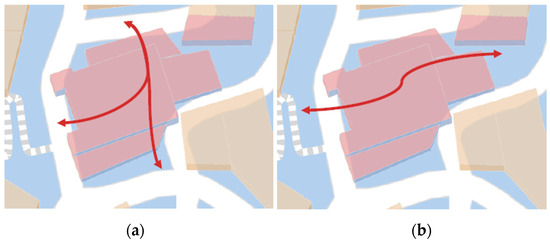
Figure 6.
Sim_3.1 (a) and Sim_3.2 (b) implemented cross ventilation strategies.
The shaded and dotted-line areas in Figure 7 (Sim_3.1) and Figure 8 (Sim_3.2) symbolise spans that are open during the mass service, and the shaded areas represent doors that are open throughout the church open-hours schedule.
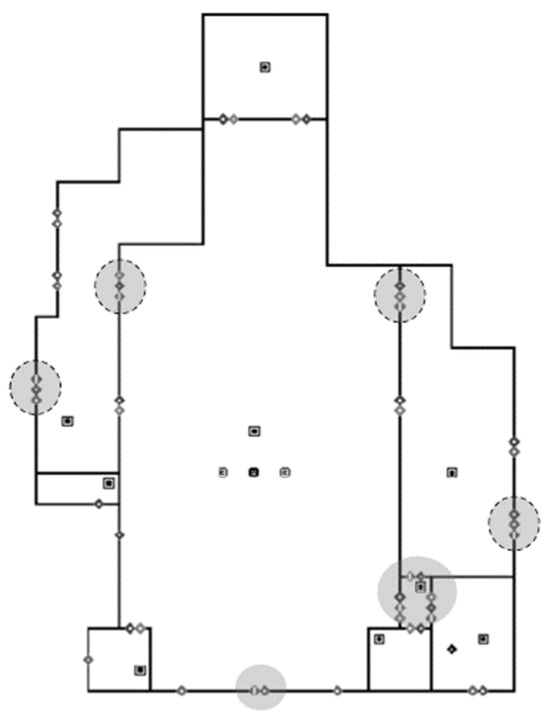
Figure 7.
Sim_3.1: first floor open spans schematic.
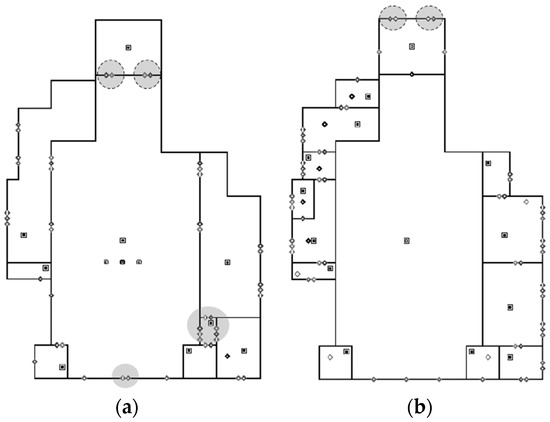
Figure 8.
Sim_3.2: first floor (a) and second floor (b) open span schematic.
2.5.5. Ventilation Strategy Sim_4
The Sim _4 will represent the increase in tourism estimated by the Portuguese government in the report “Tourism Strategy 2027” [51]. With a 6.1% annual increase in tourists in Lisbon, it is speculated that by 2027, the Church of São Cristóvão will be consistently occupied by 10 visitors per hour, and the mass attendance will reach 70 people. Although the increase in tourism is not directly related to the number of worshippers, it is considered for the purposes of this document, as a high number of occupants is a relevant analysis. The open doors and windows were set to the same conditions as for Sim_02, i.e., the main door and the set of doors that give access to the mortuary house are open throughout the visitation and mass attendance status. The side door that connects the sacristy to the nave is open during the mass period, as displayed in Figure 9.
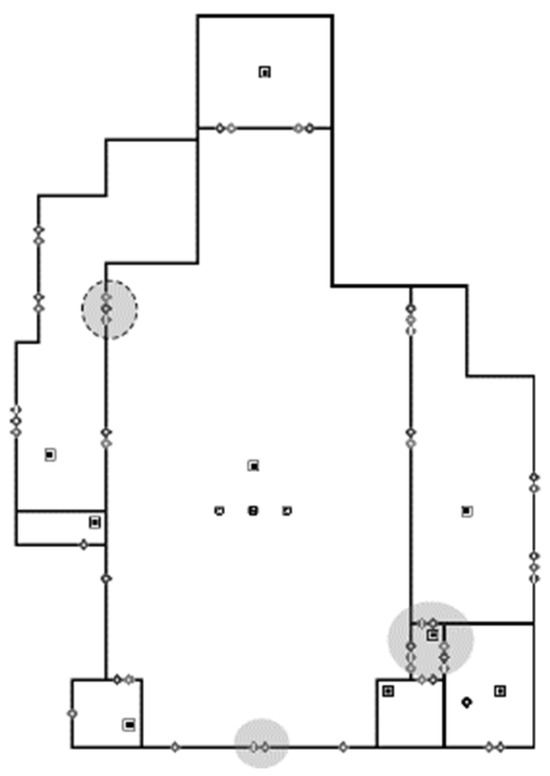
Figure 9.
Sim_4: first floor open/closed spans schematic.
Three different times of the day were examined as the number of people inside the church oscillated. The first church attendance status reflects the period when the church is open but no mass service is being conducted (called visitation). The second attendance status occurs when the mass service is happening (called mass). The third and final attendance status occurs when the church is closed (called closed).
3. Results and Discussion
In this section, the simulation results followed by an in-depth analysis based on the most used standards, EN 16798-1, EN 13779, ASHRAE 61.2 and CIBSE-Guide A, will be made. Moreover, a comparison between the different standards for each simulation will be produced, as well as an evaluation of the different ventilation strategies.
3.1. General Results of ACH and CO2
The first and last simulations, Sim_02 and Sim_4, have the same span opening/closing schedule, and the ACH values are also the same (Figure 10). What differs is the CO2 concentrations, as the number of occupants are different for the two simulations.
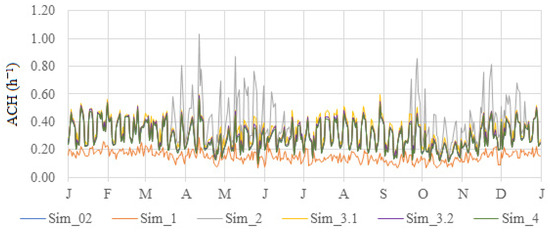
Figure 10.
Average daily ACH for each simulation.
Sim_1, which represents the closed status for the entire year, will not be referenced as much as the other simulation because it is a hypothetical scenario in which some standards do not apply, as there are no occupants. This simulation can provide an important basis for future work studying the effects of the COVID-19 pandemic and its impact on the artwork housed in the São Cristóvão church.
Sim_2, which represents the highest peaks in ventilation rates due to the opening of the bell towers in Spring and Autumn, is the strategy with the highest seasonal average ACH. The average ACH for Summer and Winter are the same as in Sim_02. In comparison with the current ventilation behaviour, an increase of 28% in ACH is achieved when strategy Sim_2 is in place.
Sim_3.1 and Sim_3.2, the two cross-ventilation strategies implemented in CONTAM, show good results. Sim_3.1, having the second-greatest ACH average of all the simulations, ensures an acceptable IAQ by all standards. On a monthly average, Sim_3.1 has a 5% increase in ventilation capacity compared to Sim_3.1. The seasonal average ACH is displayed in Figure 11.
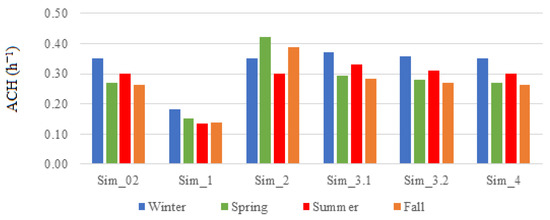
Figure 11.
Average seasonal ACH for each simulation.
During Winter and Summer, Sim_02, Sim_3.1 and Sim_4 have the same ventilation characteristics and, therefore, ACH values. Sim_2 has the largest amount of fresh air entering the church during the Spring and Autumn, compared to the other simulations.
Sim_3.2 shows the ventilation capabilities of the church if the correct pathways are available for the air to move through. If the two small windows are open in a small room, during the mass time, very similar results are achieved compared to those in Sim_3.1, where windows and doors on opposite sides of the church need to remain open for the duration of the mass service. A monthly analysis of the results, as shown in Figure 12, can display the far superior ventilation capability of the Sim_2 strategy and the small variations between Sim_02 and the remaining simulations, apart from Sim_1.
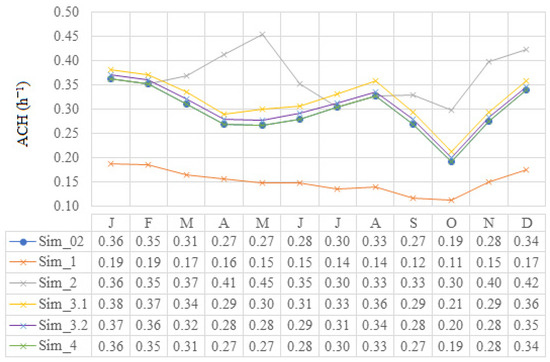
Figure 12.
Average monthly ACH for each simulation.
Table 4 summarises the average ACH for each of the simulations.
Table 4.
Average ACH value by church status, for each simulation.
An interesting and relevant comparison is the one where all simulations are studied against the current ventilation strategy of the church. For this purpose, Table 5 is presented.
Table 5.
Ventilation rate comparison to the current ventilation performance, by month.
Sim_1 shows circa −48% of the fresh air circulation in the church. Sim_2, although only applicable during a limited period of the year, shows a significant increase in ACH values. With this strategy implemented, new studies should be made regarding the air velocity and trajectory near the artworks displayed inside the church in a conservation effort, which is not the aim of this study. Although both Sim_3.1 and Sim_3.2 also increase the ventilation rates throughout the year, the first has a more significant effect, as the direction of the wind tends to follow a north-south trajectory, and the windows opened are also larger. Sim_4, which has the same ventilation performance as Sim_02, is compared hereafter in terms of the CO2 concentration analysis.
Seasonally, the CO2 indoor/outdoor deferential was examined. During Winter, all simulations showed the highest ACH values leading to low CO2 concentrations, apart from Sim_2, where the lowest concentration was found in the Spring, as shown in Figure 13.
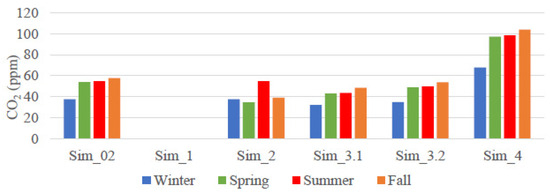
Figure 13.
Average seasonal ΔCO2 (ppm) by simulation.
Figure 14 shows the hourly evolution of CO2 for all simulated scenarios throughout the year.
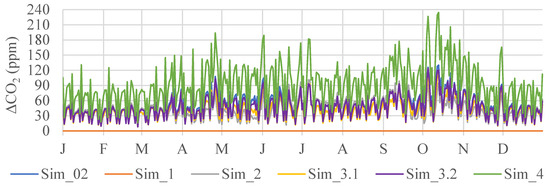
Figure 14.
Average daily ΔCO2 (ppm) by simulation.
An analysis was conducted regarding the average hourly CO2 concentrations in the church’s nave by day of the week. This examination of the pollutant behaviour can, first, eliminate extreme events such as the spikes observed in some days of October and, second, give a visual aid in the comprehension of CO2 extraction patterns. The values shown in Figure 15 are the hourly average for the entire year.
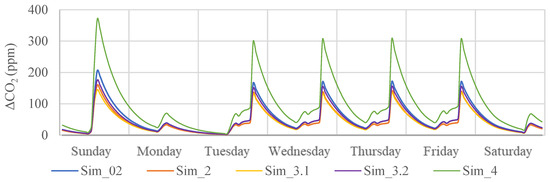
Figure 15.
Average ΔCO2 (ppm) for each simulation by day.
The only simulation that shows a relevant difference is Sim_4, as the number of occupants is significantly larger compared to those in the other scenarios. Sunday peak values average 370 ppm above outdoor concentrations, corresponding to the IDA 2 category. All other simulations do not show a significant variation considering the 350 ppm threshold that separates IDA 1 from IDA 2.
As shown in Figure 15, the highest values are seen in Sim_4 for the larger number of occupants during the open hours. This increase compared to Sim_02 is responsible for the passage of the IDA category from 1 to 2. It is relevant to mention the good IAQ attributed to IDA classes 1, 2 and even 3.
Although a more in-depth analysis will be made, the monthly average ΔCO2 concentration, displayed in Table 6, shows the higher values of Sim_4.
Table 6.
Monthly average ΔCO2 concentration (ppm), by month.
Considering a seasonal analysis of the average hourly CO2 by day type (see Figure 16), it is possible to evaluate the proximity of the results during the Wintertime for all simulations, excluding Sim_1 and Sim_4. Sim_1 has no occupants and, therefore, a constant ΔCO2 concentration. Therefore, no comparison or analysis is made.
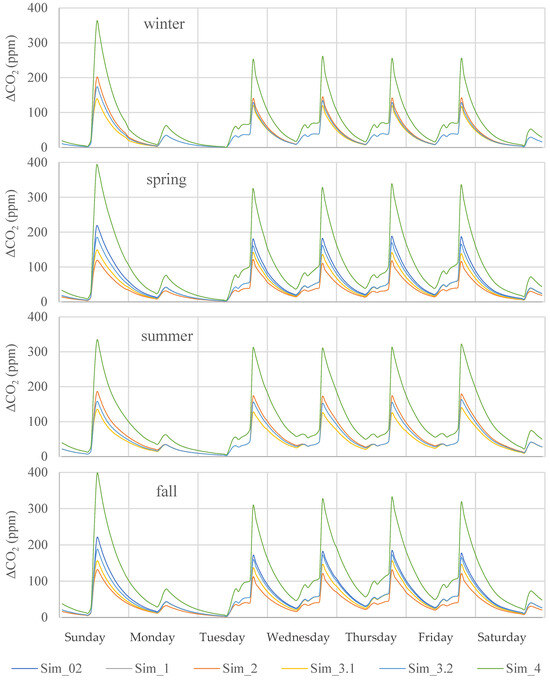
Figure 16.
Average ΔCO2 (ppm) for each simulation by day type for all seasons.
All other ventilation strategies show similar results in terms of this pollutant. The reason for this is the fact that mass service is the main source for CO2 emissions, and after this period, when the church is closed, the building is ventilated by air infiltration. As the infiltration parameters of the spans, walls and roof are the same in all simulations, the infiltration rates are also the same. This means that CO2 concentrations can only be controlled by ventilation rates attributed to the open-door period.
Sim_3.1 presents the lowest CO2 concentrations in the Winter and Summer seasons, with maximum average values of 139 for both seasons. These values occur during Sunday mass.
During the Spring and Autumn seasons, Sim_2 presents the lowest results, as the seasonal opening of the bell towers causes an increase in ventilation rates during the open-door period.
A comparison was made between Sim_02 and the other simulations in order to better understand the effects of increasing the ACH of the church on the CO2 concentration.
Sim_2 shows a reduction in the CO2 concentration of 28% and 23% for the Spring and Autumn seasons, respectively, and a reduction of 18% for the whole year. For the Winter and Summer seasons, since the ventilation strategies are the same for Sim_02 and Sim_2, no significant variations were obtained, as can be seen in Figure 17 with the weekly average values of the CO2 concentration.
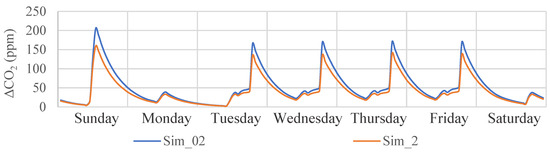
Figure 17.
Comparison of the average hourly CO2 concentration by day of the week between Sim_02 and Sim_2.
Sim_3.1 shows an annual average decrease in the CO2 concentration of 18% (Figure 18). The average Sunday peak of 144 ppm, immediately after the service, is relatively lower compared to the 205 ppm obtained for Sim_02. During the weekdays, when mass takes place, the difference in the CO2 concentration between Sim_3.1 and Sim_02 is about 33 ppm, and at the moment when the church opens each day, a difference of 2 to 5 ppm was found.
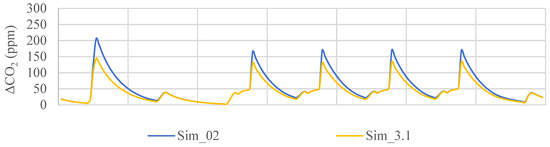
Figure 18.
Comparison of the average hourly CO2 concentration by day of the week between Sim_02 and Sim_3.1.
Sim_3.2 shows an annual average decrease in the CO2 concentration of 8%. The average Sunday peak of 160 ppm, immediately after the service, is relatively lower compared to the 205 ppm for the same period in Sim_02. During the weekdays, when mass takes place, the CO2 concentration difference between the two simulations is about 33 ppm, and no difference was found when the church doors were opened (Figure 19).
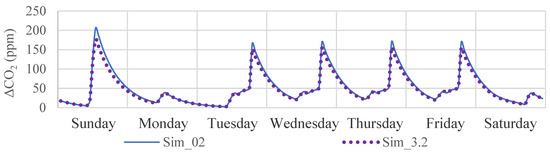
Figure 19.
Comparison of the average hourly CO2 concentration by day of the week between Sim_02 and Sim_3.2.
Sim_4 showed an annual average increase in the CO2 concentration of 80% (Figure 20). The Sunday average peak is 338 ppm, immediately after the mass service. During the weekdays, when mass takes place, the difference in the CO2 concentration between the two simulations is about 135 ppm, and unlike the simulations previously examined, a difference was found at the moment the doors of the church are opened each day, i.e., the ventilation by infiltration during the closed hours is no longer able to remove as much used air. A difference of about 25 ppm was recorded just before the church doors opened on Wednesday, Thursday and Friday. On the remaining days of the week, Sunday, Monday and Saturday, there is a longer period before the doors open when no occupants are releasing CO2.
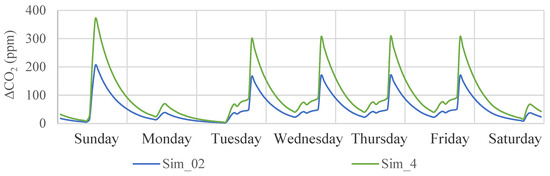
Figure 20.
Comparison of the average hourly CO2 concentration by day of the week between Sim_02 and Sim_4.
Table 7 shows the percentage difference of the monthly average CO2 concentration compared to the current ventilation strategy of the São Cristóvão church (Sim_02).
Table 7.
Comparison of the monthly average ΔCO2 concentration to the current ventilation performance, by month.
An important conclusion is that there is no need to change the ventilation strategy. Sim_02, the current ventilation strategy, was found to be highly capable of maintaining low levels of the analysed pollutant. The increase in ventilation rates is associated with an increase in air velocity both around the occupants, reducing the thermal sensation of people inside, and around the artwork on display, potentially increasing the deposition of other pollutants and promoting abrasion.
3.2. EN 16798-1
EN 16798-1 [10], which supersedes EN 15251 [11], has been prepared by Technical Committee CEN/TC 156 “Ventilation for buildings”. Regarding IAQ, EN 16798 is based on the results described previously for non-adapted people, considering both the emissions generated by humans and buildings and their components.
Looking at the different simulations through the requirements of EN 16798-1, some conclusions can be drawn. All simulations showed very satisfactory results, with at least 86% of the year in IAQ categories 1 and 2.
The simulation with the lowest IAQ was Sim_1, which is the simulation where the closed period is extended throughout the year, and for this reason, a true comparison cannot be made due to the lack of occupants to experience the space. However, since some standards divide the ventilation rates into the number of people and the area of the compartment, this ventilation strategy was included in the comparison, as can be seen in Figure 21.
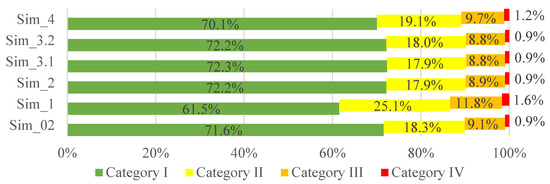
Figure 21.
Comparison of the percentage of time respecting EN 16798-1-recommended ventilation rates for the entire year.
The similarity in the results shown in Figure 22 can be explained by the fact that the church is closed for 77% of the week, which corresponds to 129 h. The remaining 29 h are divided asymmetrically into the visitation period and the mass period. This last period occurs for 6 h per week, resulting in a higher height factor for the attendance status, with the least amount of relevance in terms of IAQ. For this reason, a study of the presence status was carried out. Considering the visitation period, all simulations showed very high IAQ levels. Due to the higher number of visitors in Sim_4, 8 h of the year were identified outside the categories I and II.
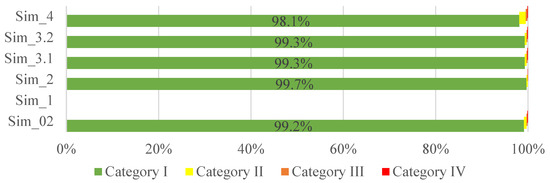
Figure 22.
Comparison of the percentage of time respecting EN 16798-1-recommended ventilation rates for the visitation attendance status.
The largest differences in CO2 concentrations (Figure 23) were found in the mass service status, as expected, due to the significantly larger number of occupants.
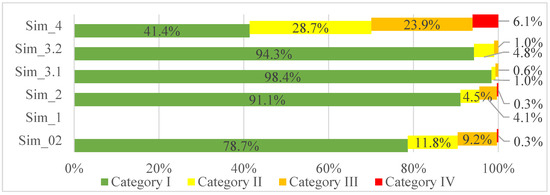
Figure 23.
Comparison of the percentage of time respecting EN 16798-1-recommended ventilation rates for the mass attendance status.
Sim_02 showed 29 days of the year where the mass service was in category III and only 1 day where the mass service was in category IV.
Sim_2, the first simulation with a ventilation strategy in mind, shows the 14 h where category I and II ventilation rates were not achieved.
Between Sim_3.1 and 3.2, there is only a difference of 1 h in category III, which is a negligible difference. Sim_4, trying to estimate the increase in future occupants with the same ventilation strategy as at present, presented 19 mass services where IAQ levels were inserted in category IV and 75 services where IAQ levels were inserted in category III.
Regarding the closed period (Figure 24), Sim_1 displays a difference from the other simulations due to the schedule change, that is, the church is closed the entire year.
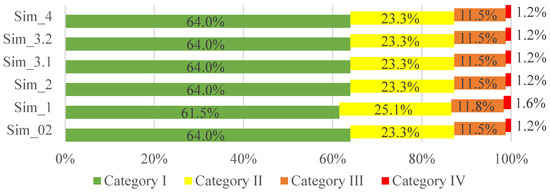
Figure 24.
Comparison of the percentage of time respecting EN 16798-1-recommended ventilation rates for the closed attendance status.
3.3. EN 13779
With regard to the EN 13779 standard, two analyses are necessary: first, to understand how long the CO2 reference values for each indoor air category (IDA) are exceeded, and second, whether the prescribed ventilation rates for each category are being experienced. As mentioned previously, the visitation period did not show an excessive presence of CO2 due to the low number of occupants, as the reference value for IDA 1 of 350 ppm above outdoor concentrations is very rarely surpassed. Therefore, the most critical period to examine is the mass attendance status. Figure 25 presents the two-step analysis mentioned in the previous paragraph.
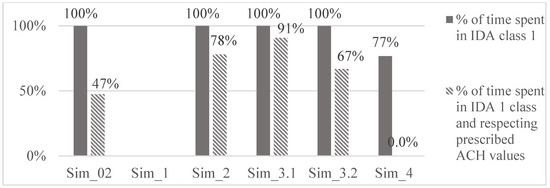
Figure 25.
Comparison of all simulations for the percentage of time spent on IDA 1 and respecting EN 13779-recommended ventilation rates for the mass attendance status.
Sim_02, during the mass period, spent all the time in IDA 1, with CO2 concentrations below the 350 ppm threshold, but the prescribed ventilation rate was ensured only 47% of the time.
The Sim_2, Sim_3.1 and Sim_3.2 ventilation strategies then presented themselves as a viable solution for improving the IAQ during the mass period, although the current ventilation (Sim_02) showed acceptable results. Finally, Sim_4 was able to maintain the CO2 concentration below 350 ppm for 76.8% of the time. As this simulation is the only one that showed values outside of IDA 1, further analysis is shown.
Figure 26 shows the time spent in each IDA category. This ventilation strategy is the same as that in Sim_02 and therefore represents the predicted increase in occupancy for 2027, according to the Portuguese government, with no changes to the ventilation behaviour of the São Cristóvão church. In this scenario, the EN 13779 ventilation rates are not met in any percentage of time, in any IDA class, for the mass attendance status.
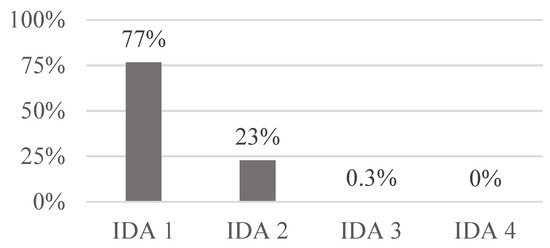
Figure 26.
Sim_4: Percentage of time spent in each IDA category for the mass period.
3.4. ASHRAE 62.1
Given the binary system based on an acceptable/unacceptable IAQ of ASHRAE 62.1, some results of the simulations performed are similar. Moreover, the unacceptable threshold is lower than the one prescribed by EN 16798-1 for an IAQ category IV of a low-pollution building.
For the visitation period (Figure 27), all ventilation strategies show good results, with values respecting the prescribed rates over 99% of the time. Sim_1 is not mentioned in some analyses, as no occupants are considered.
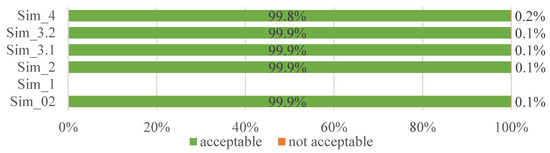
Figure 27.
Comparison of the percentage of time respecting ASHRAE 62.1’s recommended ventilation rates for the visitation attendance status.
With the implementation of simulations 3.1 and 3.2, the ASHRAE-prescribed ventilation rates were met throughout the year for the mass attendance status (Figure 28). For Sim_4, the Church’s natural ventilation failed to provide the recommended ACH for 6.7% of the time.
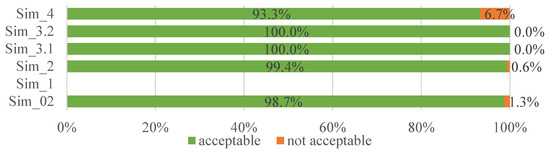
Figure 28.
Comparison of the percentage of time respecting ASHRAE 62.1’s recommended ventilation rates for the mass attendance status.
Considering that, in Sim_1, the building is closed all year round and, in all of the other simulations, the period of closure is the same under identical conditions, it can be seen in Figure 29 that similar results were obtained between the simulations.
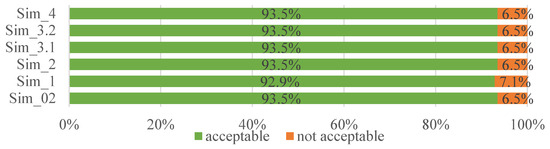
Figure 29.
Comparison of the percentage of time respecting ASHRAE 62.1’s recommended ventilation rates for the closed attendance status.
3.5. CIBSE Guide A
CIBSE Guide A-recommended ventilation rates depend solely on the number of occupants, so the closed period is not examined. The visitation status, as previously shown, reported an extremely high percentage of time meeting the prescribed ventilation rates, as shown in Figure 30. The lower number of people in the church during this period is low (five to nine), and the building is able to renew the indoor air.
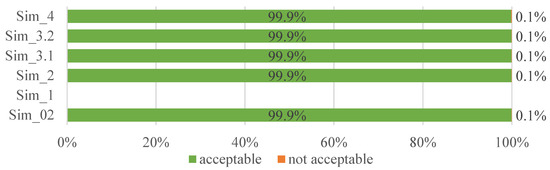
Figure 30.
Comparison of the percentage of time respecting CIBSE Guide A-recommended ventilation rates for the visitation attendance status.
During the mass period (Figure 31), the implemented ventilation strategies, different from the current one, showed an improvement. From 10% of the time not complying with the recommended ventilation rates in Sim_02, Sim_2, Sim_3.1 and Sim_3.2 showed a decrease of 5.4%, 9.2% and 8.6%, respectively.
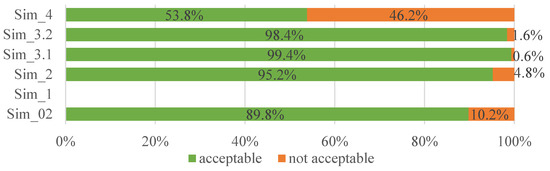
Figure 31.
Comparison of the percentage of time respecting CIBSE Guide A-recommended ventilation rates for the mass attendance status.
For Sim_4, with almost double the number of occupants, only 54% of the time was in compliance with the recommended ventilation rates of approximately 2600 m3/h (ACH of 0.70 h−1).
4. Conclusions
Natural ventilation in heritage buildings like churches and museums is inextricably intertwined with various aspects of IAQ. Adequate ventilation will ensure the removal of excess humidity and the reduction in indoor air pollutants. This paper aimed to determine the current natural ventilation behaviour of the São Cristóvão Church in Lisbon and presented five additional ventilation strategies (Sim_1 to Sim_4). For Sim_02, the current ventilation state, an average ACH of 0.75 h−1 during the open-doors period can be expected, and for the closed period, an ACH of 0.15 h−1 was obtained. On a yearlong analysis, an average ACH of 0.30 h−1 was found. Based on the overall analysis of the results, a conclusion can be drawn regarding the IAQ of the church.
Regardless of the ventilation strategy chosen, all ACH and CO2 levels are within the acceptable range according to relevant standards, raising the question of the need to implement new ventilation strategies. Nevertheless, the Spring and Autumn seasons have the lowest ACH values for all simulations except for Sim_2, and consequently, the highest CO2 concentrations occur during these seasons.
The idea that the number of churchgoers would increase at the same rate as the number of tourists in Lisbon is not realistic, but simulation Sim_4 did clarify the ventilation behaviour of the church in a crowded condition. Sim_4 was the simulation with the highest CO2 concentration, due to the near doubling of the number of people in the church, with average peaks during the Sunday mass of 370 ppm, and therefore entered the IDA 2 category. The peaks reached at the end of Sunday mass in each simulation were sufficiently low, below 350 ppm, so the ventilation by air infiltration during the closed period, at an ACH of 0.15 h−1, was able to reduce this pollutant. In the cases where the ventilation rates during the visit and mass were lower, such as in Sim_02 and Sim_4, the fact that there is no mass on Monday helps to reduce the CO2 concentrations in the following days. The results obtained for the different ventilation strategies will be taken into account for future interventions in the building.
Author Contributions
Conceptualisation, L.G.B., J.A. and H.E.S.; Methodology, L.G.B., J.A. and H.E.S.; Software, J.A.; Validation, L.G.B., J.A. and H.E.S.; Formal analysis, L.G.B. and J.A.; Investigation, L.G.B. and J.A.; Writing—original draft preparation, J.A.; Writing—review and editing, L.G.B. and H.E.S.; Visualisation, L.G.B. All authors have read and agreed to the published version of the manuscript.
Funding
This research was funded by FCT—Portuguese Foundation for Science and Technology under the project LA/P/0037/2020, UIDP/50025/2020 and UIDB/50025/2020.
Institutional Review Board Statement
Not applicable.
Informed Consent Statement
Not applicable.
Data Availability Statement
Data is available on request from the corresponding author.
Acknowledgments
The authors acknowledge the support of FCT—Fundação para a Ciência e a Tecnologia, I.P., in the scope of the projects LA/P/0037/2020, UIDP/50025/2020 and UIDB/50025/2020 of the Associate Laboratory Institute of Nanostructures, Nanomodelling and Nanofabrication-i3N.
Conflicts of Interest
The authors declare no conflict of interest. The funders had no role in the design of the study; in the collection, analyses or interpretation of the data; in the writing of the manuscript; or in the decision to publish the results.
Authors’ Note
The authors declare that the manuscript is based on the M.Sc. dissertation of João Eduardo Menezes Garrett Alcobia, entitled: “Characterization of natural ventilation in the São Cristóvão church in Lisbon—numerical modeling”. Available online: http://hdl.handle.net/10362/139251 (accessed on 4 September 2023). The authors declare that the manuscript has not been published or submitted to any other journal.
References
- Silva, H.E.; Henriques, F.M.A. Hygrothermal analysis of historic buildings: Statistical methodologies and their applicability in temperate climates. Struct. Surv. 2016, 34, 12–23. [Google Scholar] [CrossRef]
- Coelho, G.B.A.; Silva, H.E.; Henriques, F.M.A. Impact of climate change on cultural heritage: A simulation study to assess the risks for conservation and thermal comfort. Int. J. Glob. Warm. 2019, 19, 382. [Google Scholar] [CrossRef]
- Pereira, P.-F.; Ramos, N.M.M.; Ferreira, A. Room-scale analysis of spatial and human factors affecting indoor environmental quality in Porto residential flats. Build. Environ. 2020, 186, 107376. [Google Scholar] [CrossRef]
- Zorpas, A.A.; Skouroupatis, A. Indoor air quality evaluation of two museums in a subtropical climate conditions. Sustain. Cities Soc. 2016, 20, 52–60. [Google Scholar] [CrossRef]
- Instituto Nacional de Estatística I.P. (Ed.) Estatísticas do Turismo 2022; Instituto Nacional de Estatística I.P.: Lisbon, Portugal, 2022; ISBN 978-989-25-0644-9.
- Weintraub, S. Review of the Museum Environment by Garry Thomson. J. Am. Inst. Conserv. 1988, 27, 47–50. [Google Scholar] [CrossRef]
- Pereira, P.-F.; Ramos, N.M.M. The impact of mechanical ventilation operation strategies on indoor CO2 concentration and air exchange rates in residential buildings. Indoor Built Environ. 2021, 30, 1516–1530. [Google Scholar] [CrossRef]
- ISO 16813:2006; Building Environment Design—Indoor Environment—General Principles. International Organization for Standardization, Vernier: Geneva, Switzerland, 2006.
- Luciani, A. Historical Climates and Conservation Environments. Historical Perspectives on Climate Control Strategies within Museums and Heritage Buildings. Ph.D. Thesis, Polytechnic University of Milan, Milan, Italy, 2013. [Google Scholar]
- EN Standard 16798-1; Energy Performance of Buildings—Ventilation for Buildings—Part 1: Indoor Environmental Input Parameters for Design and Assessment of Energy Performance of Buildings Addressing Indoor Air Quality, Thermal Environment, Lighting and Acoustics—Module M1-6. European Committee for Standardization: Brussels, Belgium, 2019.
- EN Standard 15251; Indoor Environmental Input Parameters for Design and Assessment of Energy Performance of Buildings Addressing Indoor Air Quality, Thermal Environment, Lighting and Acoustics. European Committee for Standardization: Brussels, Belgium, 2007.
- PD CR 1752; Ventilation for Buildings. Design Criteria for the Indoor Environment. European Committee for Standardization: Brussels, Belgium, 1998.
- EN Standard 13779; Ventilation for Non-Residential Buildings—Performance Requirements for Ventilation and Room-Conditioning Systems. European Committee for Standardization: Brussels, Belgium, 2007.
- ANSI/ASHRAE Standard 62.1-2013; Ventilation for Acceptable Indoor Air Quality. American Society of Heating, Refrigerating, and Air-Conditioning Engineers: Atlanta, GA, USA, 2013.
- CIBSE. CIBSE Guide A: Environmental Design UK; Chartered Institution of Building Services Engineers: London, UK, 2005; Available online: https://www.cibse.org/knowledge-research/knowledge-portal/guide-a-environmental-design-2015 (accessed on 4 September 2023).
- Bonacina, C.; Baggio, P.; Cappelletti, F.; Romagnoni, P.; Stevan, A.G. The Scrovegni Chapel: The results of over 20 years of Indoor Climate Monitoring. Energy Build. 2015, 95, 144–152. [Google Scholar] [CrossRef]
- Baggio, P.; Bonacina, C.; Romagnoni, P.; Stevan, A.G. Microclimate Analysis of the Scrovegni Chapel in Padua-Measurements and Simulations. Stud. Conserv. 2004, 49, 161–176. [Google Scholar] [CrossRef]
- Lucchi, E. Multidisciplinary risk-based analysis for supporting the decision-making process on conservation, energy efficiency, and human comfort in museum buildings. J. Cult. Herit. 2016, 22, 1079–1089. [Google Scholar] [CrossRef]
- Kramer, R.P.; Maas, M.P.E.; Martens, M.H.J.; van Schijndel, A.W.M.; Schellen, H.L. Energy conservation in museums using different setpoint strategies: A case study for a state-of-the-art museum using building simulations. Appl. Energy 2015, 158, 446–458. [Google Scholar] [CrossRef]
- Sciurpi, F.; Carletti, C.; Cellai, G.; Pierangioli, L. Environmental monitoring and microclimatic control strategies in “La Specola” museum of Florence. Еnеrgy Build. 2015, 95, 190–201. [Google Scholar] [CrossRef]
- Janssen, H.; Christensen, J.E. Hygrothermal optimisation of museum storage spaces. Energy Build. 2013, 56, 169–178. [Google Scholar] [CrossRef]
- Bellia, L.; Capozzoli, A.; Mazzei, P.; Minichiello, F. A comparison of HVAC systems for artwork conservation. Int. J. Refrig. 2007, 30, 1439–1451. [Google Scholar] [CrossRef]
- Ascione, F.; Bellia, L.; Capozzoli, A.; Minichiello, F. Energy saving strategies in air-conditioning for museums. Appl. Therm. Eng. 2009, 29, 676–686. [Google Scholar] [CrossRef]
- Aste, N.; Della Torre, S.; Adhikari, R.S.; Buzzetti, M.; Del Pero, C.; Leonforte, F.; Manfren, M. Sustainable church heating: The Basilica di Collemaggio case-study. Energy Build. 2016, 116, 218–231. [Google Scholar] [CrossRef]
- Silva, H.E.; Henriques, F.M.A. Microclimatic analysis of historic buildings: A new methodology for temperate climates. Build. Environ. 2014, 82, 381–387. [Google Scholar] [CrossRef]
- Coelho, G.; Silva, H.E.; Henriques, F.M.A. Calibrated hygrothermal simulation models for historical buildings. Build. Environ. 2018, 142, 439–450. [Google Scholar] [CrossRef]
- Coelho, G.; Silva, H.E.; Henriques, F.M.A. Impact of climate change in cultural heritage: From energy consumption to artefacts’ conservation and building rehabilitation. Energy Build. 2020, 224, 110250. [Google Scholar] [CrossRef]
- Monsalve, M. Parish Church of S. Cristovão-Inventory Report and Diagnosis; Junta Distrital de Lisboa: Lisbon, Portugal, 2011. (In Portuguese) [Google Scholar]
- Almeida, F. Notable Monuments and Buildings in the District of Lisbon. Lisboa: Livros Horizontes; Junta Distrital de Lisboa: Lisbon, Portugal, 2007. (In Portuguese) [Google Scholar]
- Andrade, F. The Parish of S. Cristovão; Câmara Municipal: Lisbon, Portugal, 1944; Volume I. (In Portuguese) [Google Scholar]
- Matos, J.L. Islamic Lisbon; Camões, I., Ed.; IAG-Artes Gráficas: Lisbon, Portugal, 1999. (In Portuguese) [Google Scholar]
- Silva, J. Igreja Matriz de São Cristóvão/Igreja de São Cristóvão e São Lourenço. 1992. Available online: http://www.monumentos.gov.pt/Site/APP_PagesUser/SIPA.aspx?id=6462 (accessed on 15 August 2020). (In Portuguese)
- Coutinho, M.J.F.P. The Portuguese Production of Polychrome Stone Inlaid Works (1670–1720); Faculdade e Letras, Universidade de Lisboa: Lisbon, Portugal, 2010. (In Portuguese) [Google Scholar]
- Serrão, V. The Artistic Program of the Church of Sao Cristovao. The 16th Century Altarpiece and the Proto-Baroque Works Campaign (1666–1685). Boletim Cult. Junta Dist. Lisb. 1998, 92, 1–7. (In Portuguese) [Google Scholar]
- Silva, H.E.; Henriques, F.M.A. Preventive conservation of historic buildings in temperate climates. The importance of a risk-based analysis on the decision-making process. Energy Build. 2015, 107, 26–36. [Google Scholar] [CrossRef]
- Ferdyn-Grygierek, J. Indoor environment quality in the museum building and its effect on heating and cooling demand. Energy Build. 2014, 85, 32–44. [Google Scholar] [CrossRef]
- Silva, H.F.E. Evaluation of the Indoor Climate of a Church in Lisbon. Master’s Thesis, NOVA School of Science and Technology, NOVA University Lisbon, Lisbon, Portugal, 2012. (In Portuguese). [Google Scholar]
- EN Standard 15757; Conservation of Cultural Property. Specifications for Temperature and Relative Humidity to Limit Climate-Induced Mechanical Damage in Organic Hygroscopic Materials. European Committee for Standardization: Brussels, Belgium, 2013.
- PAS-PAS 198; Specification for Environmental Conditions for Cultural Collections. British Standards Institution: London, UK, 2012.
- CONTAM|NIST. 2012. Available online: https://www.nist.gov/services-resources/software/contam (accessed on 30 July 2020).
- Ferdyn-Grygierek, J.; Baranowski, A. Assessment of the Airtightness and Air Exchange in Polish Dwellings—Measurement Experiences and Problems Met. In Proceedings of the AIVC-TightVent Conference, Copenhagen, Denmark, 10–11 October 2012. [Google Scholar]
- Gonçalves, M. Numerical Study of Ventilation Performance in a Nursing Home. Master’s Thesis, Faculty of Sciences of the University of Lisbon, NOVA University Lisbon, Lisbon, Portugal, 2016. (In Portuguese). [Google Scholar]
- Tan, G. Study of Natural Ventilation Design by Integrating the Multi-Zone Model with CFD Simulation. Ph.D. Thesis, Massachusetts Institute of Technology, Cambridge, MA, USA, 2005. [Google Scholar]
- Musser, A. Multizone Modeling as an Indoor Air Quality Design Tool. In Proceedings of the Vol. 2: Design and Operation of HVAC Systems Healthy Buildings, Conference | 6th | | SIT Indoor Air Information, Espoo, Finland, 6–10 August 2000; Volume 2. [Google Scholar]
- Siu, C.Y.; Liao, Z. Building energy simulation based on TMY representative: A comparative simulation study on doe reference buildings in Toronto with typical year and historical year type weather files. Energy Build. 2020, 211, 109760. [Google Scholar] [CrossRef]
- Crawley, D.B.; Barnaby, C.S. Weather and climate in building performance simulation. In Building Performance Simulation for Design and Operation, 2nd ed.; Routledge: Abingdon, UK; New York, NY, USA, 2019; pp. 191–220. [Google Scholar] [CrossRef]
- Energyplus. Lisbon Weather Data. 2020. Available online: https://energyplus.net/weather-location/europe_wmo_region_6/PRT/PRT_Lisboa.085360_INETI (accessed on 2 September 2020).
- Persily, A.; De Jonge, L.; Persily, A. Carbon dioxide generation rates for building occupants. Indoor Air 2017, 27, 868–879. [Google Scholar] [CrossRef] [PubMed]
- Orme, M.; Leksmono, N. AIVC Guide 5—Ventilation Modelling Data Guide; AIVC: Brussels, Belgium, 2022. [Google Scholar]
- Schellen, H.L. Heating Monumental Churches: Indoor Climate and Preservation of Cultural Heritage. Ph.D. Thesis, Eindhoven University of Technology, Eindhoven, The Netherlands, 2002. [Google Scholar] [CrossRef]
- Turismo de Portugal I.P. Tourism Strategy 2027: Leading the Tourism of the Future; Turismo de Portugal I.P.: Lisbon, Portugal, 2017.
Disclaimer/Publisher’s Note: The statements, opinions and data contained in all publications are solely those of the individual author(s) and contributor(s) and not of MDPI and/or the editor(s). MDPI and/or the editor(s) disclaim responsibility for any injury to people or property resulting from any ideas, methods, instructions or products referred to in the content. |
© 2023 by the authors. Licensee MDPI, Basel, Switzerland. This article is an open access article distributed under the terms and conditions of the Creative Commons Attribution (CC BY) license (https://creativecommons.org/licenses/by/4.0/).