
Improving the Understanding of Landslide Development in Alpine Forest Regions Using the InSAR Technique: A Case Study in Xiaojin County China


Abstract
:1. Introduction
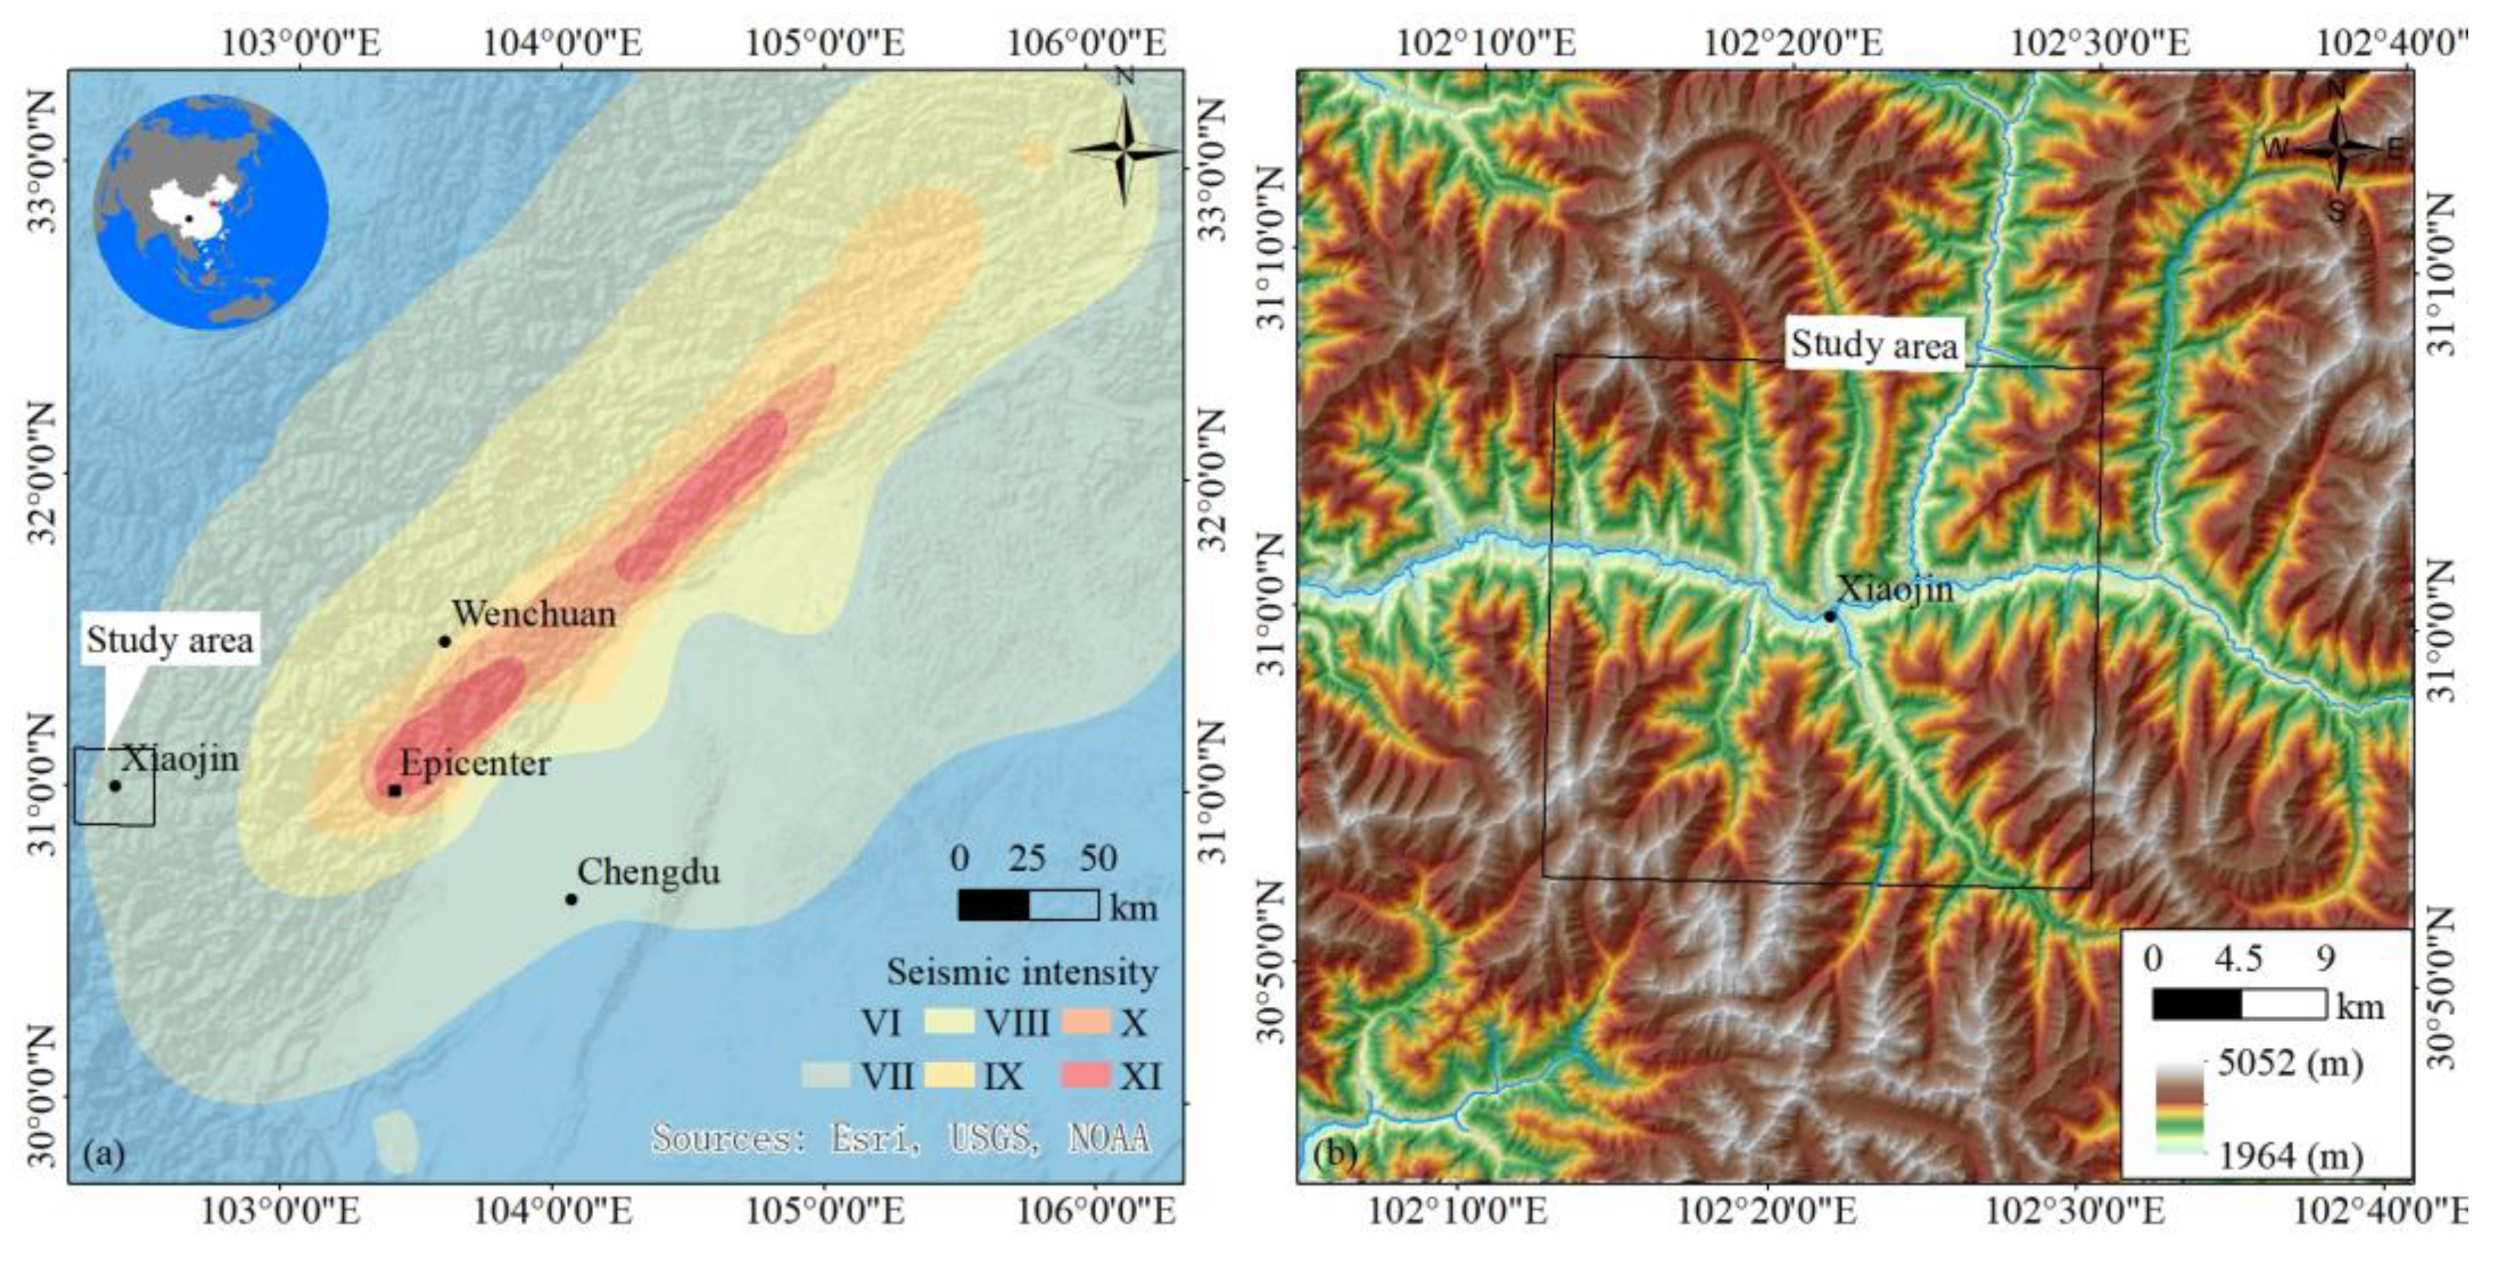
2. Study Area
- The Quaternary deposits mainly consist of moraine debris, alluvium, proluvium, and eluvium. They are widely distributed in river valleys and high mountainous areas, reaching tens of meters in thickness and forming nearly vertical slopes on roads and residential areas.
- T3zh consists mainly of fine-grained metamorphic sandstone, metamorphic silt, carbonaceous sericite slate, and silty slate. Its thickness ranges from 834 m to 1949 m regionally.
- T3z is foliated metamorphic calcareous sandstone and feldspar quartz sandstone interbedded with dark grey slate.
3. Data and Methods
3.1. Data Sets
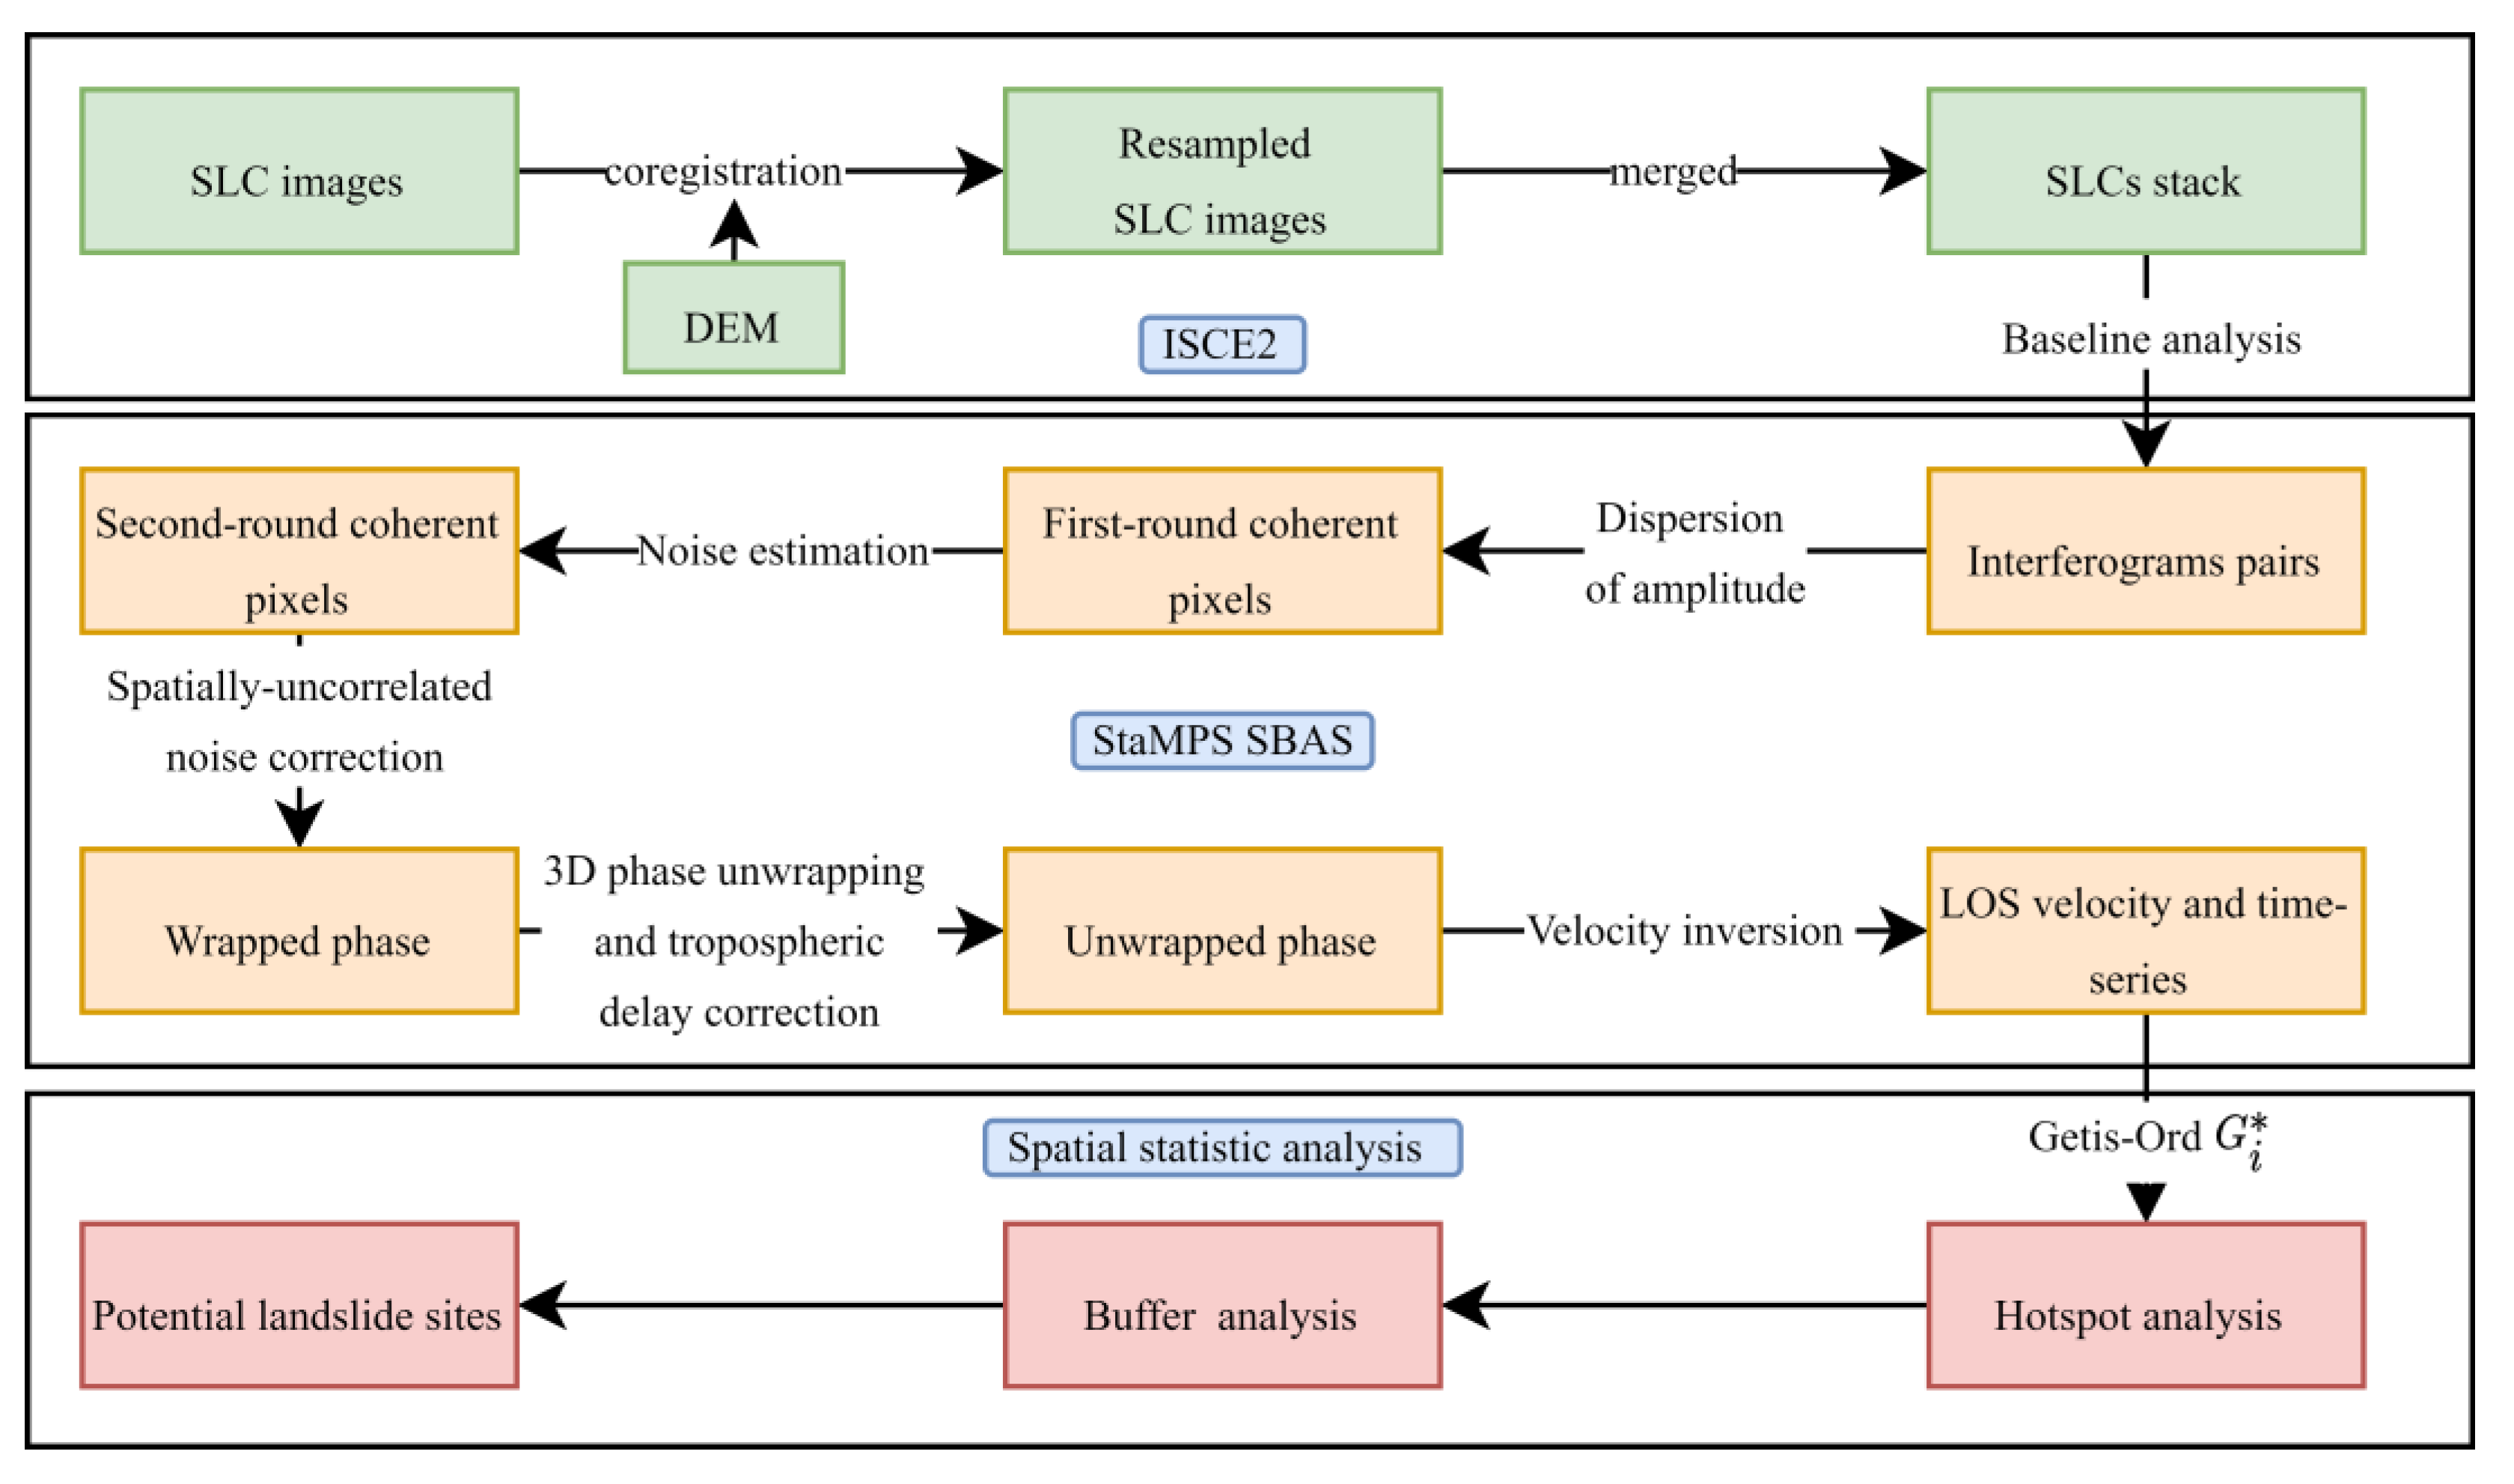
3.2. Methods
3.2.1. Theory of SBAS-InSAR Analysis
3.2.2. Cluster Extraction with Spatial Statistical Analysis
4. Results
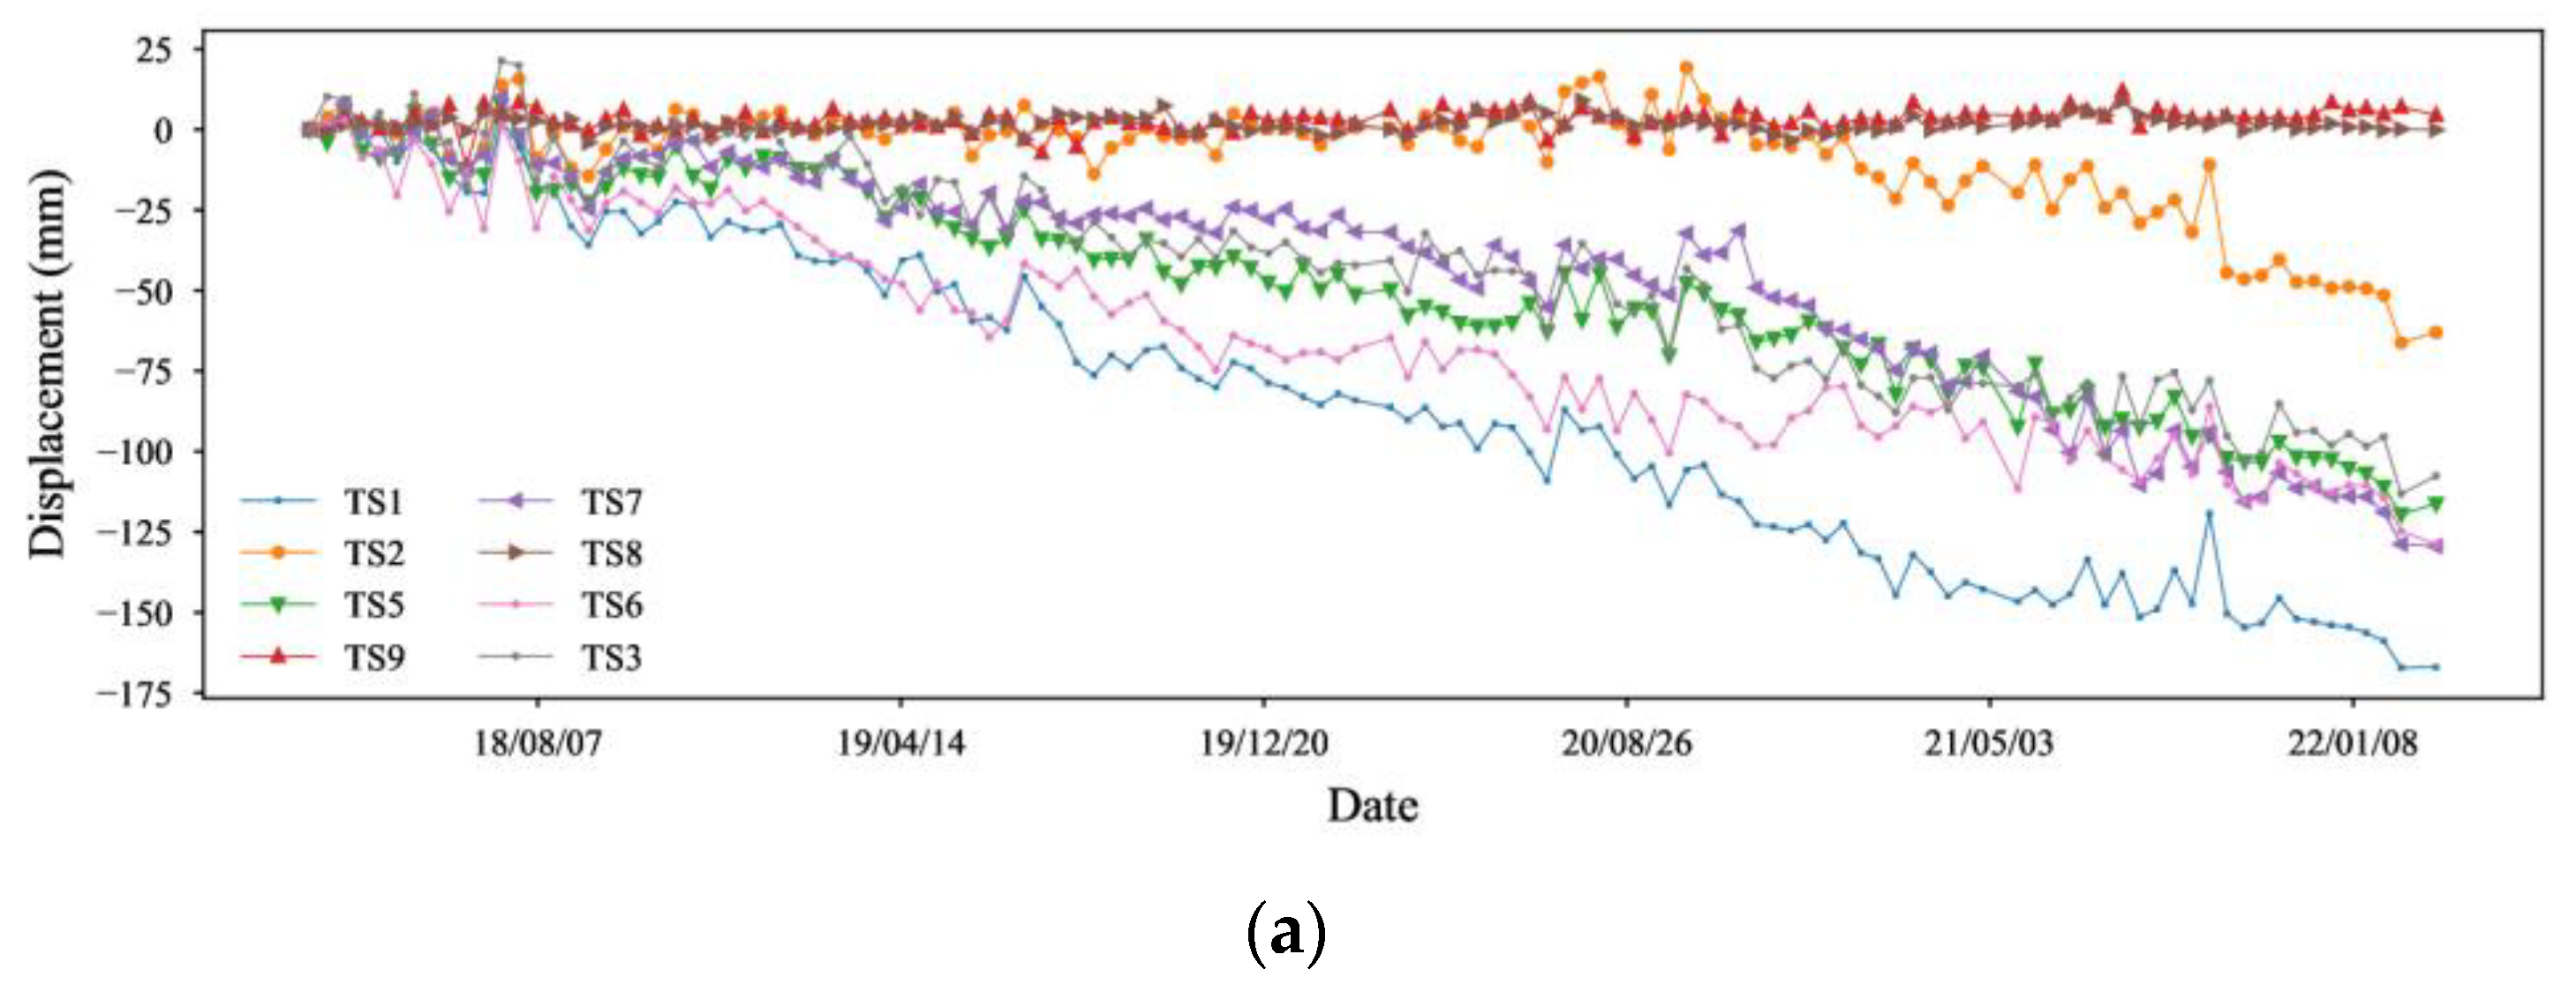
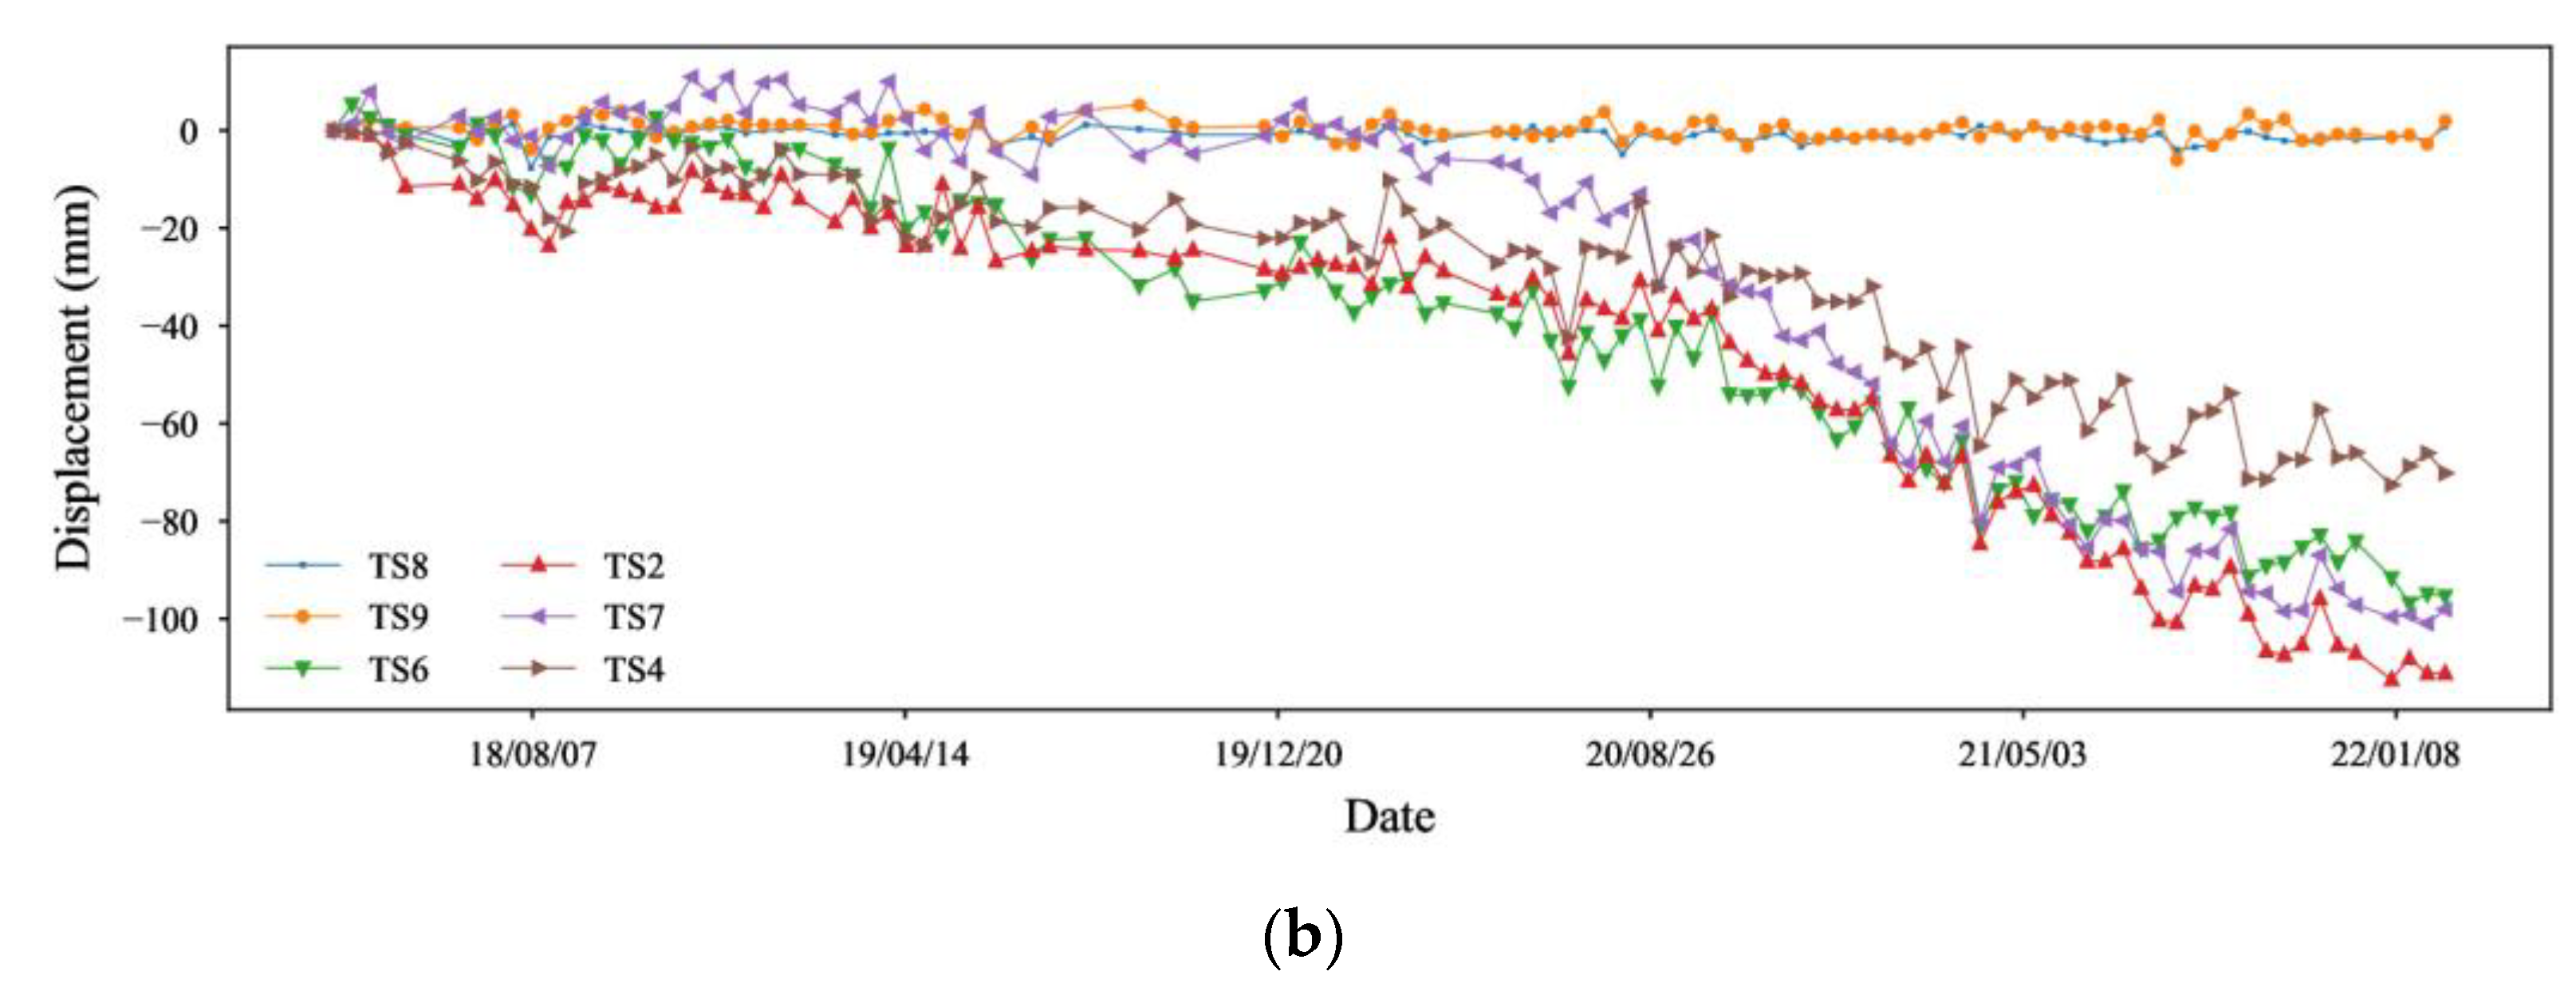
4.1. Ground Deformation
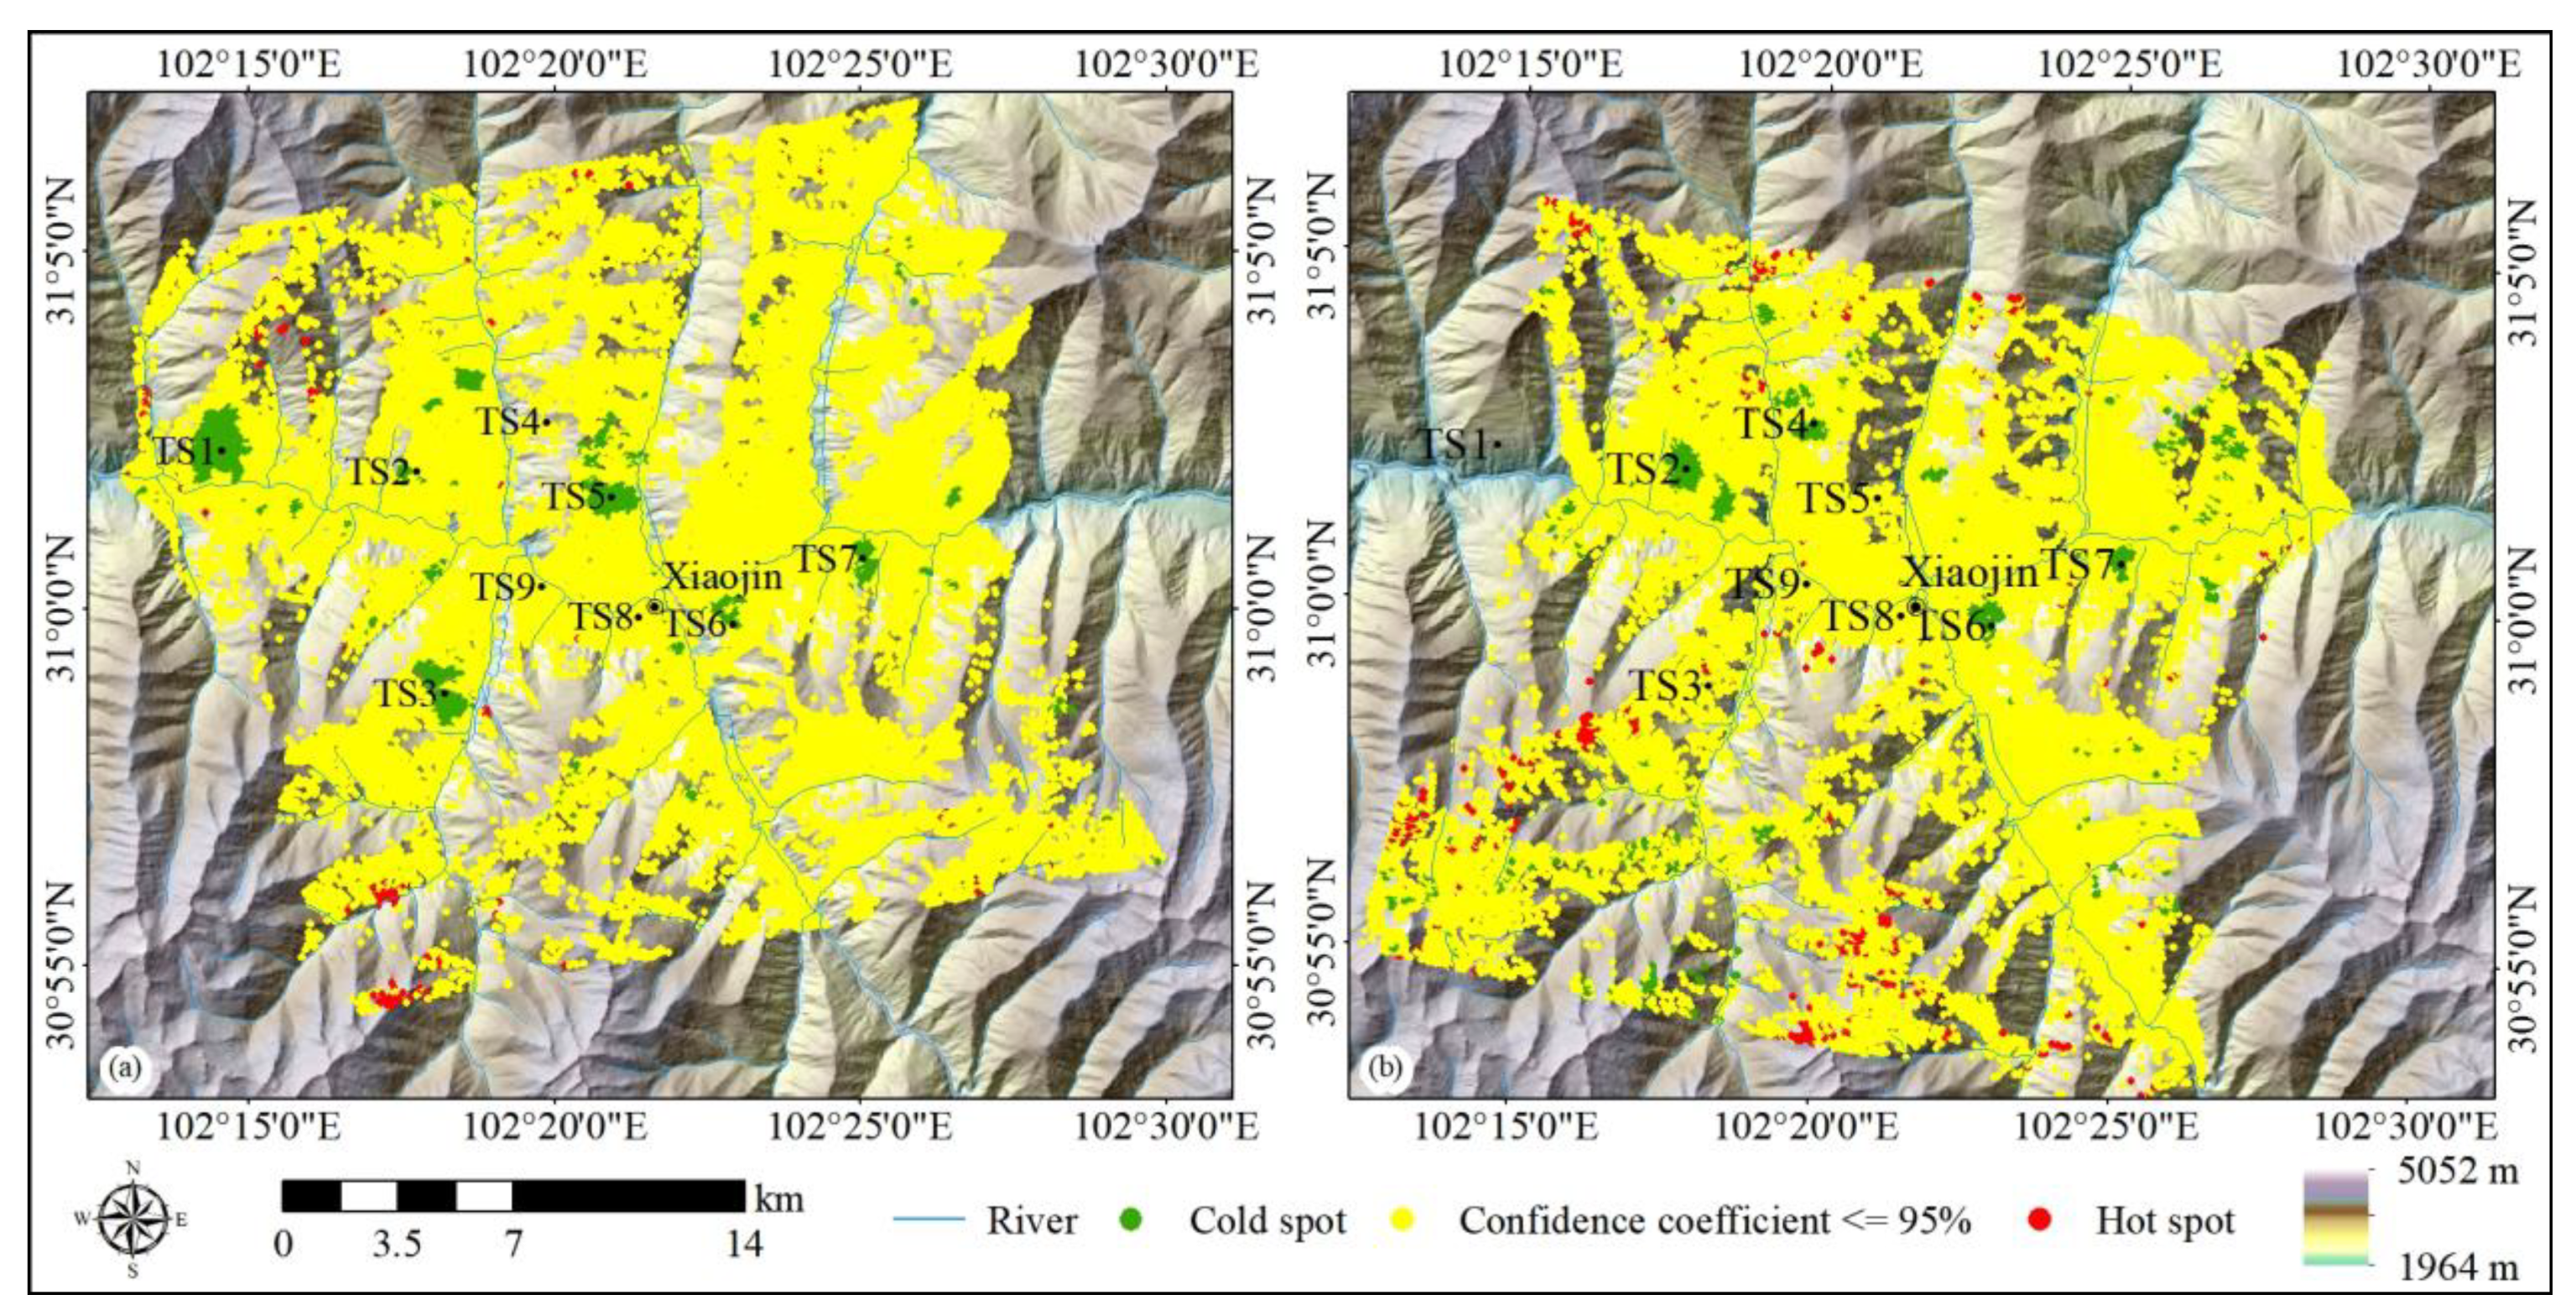
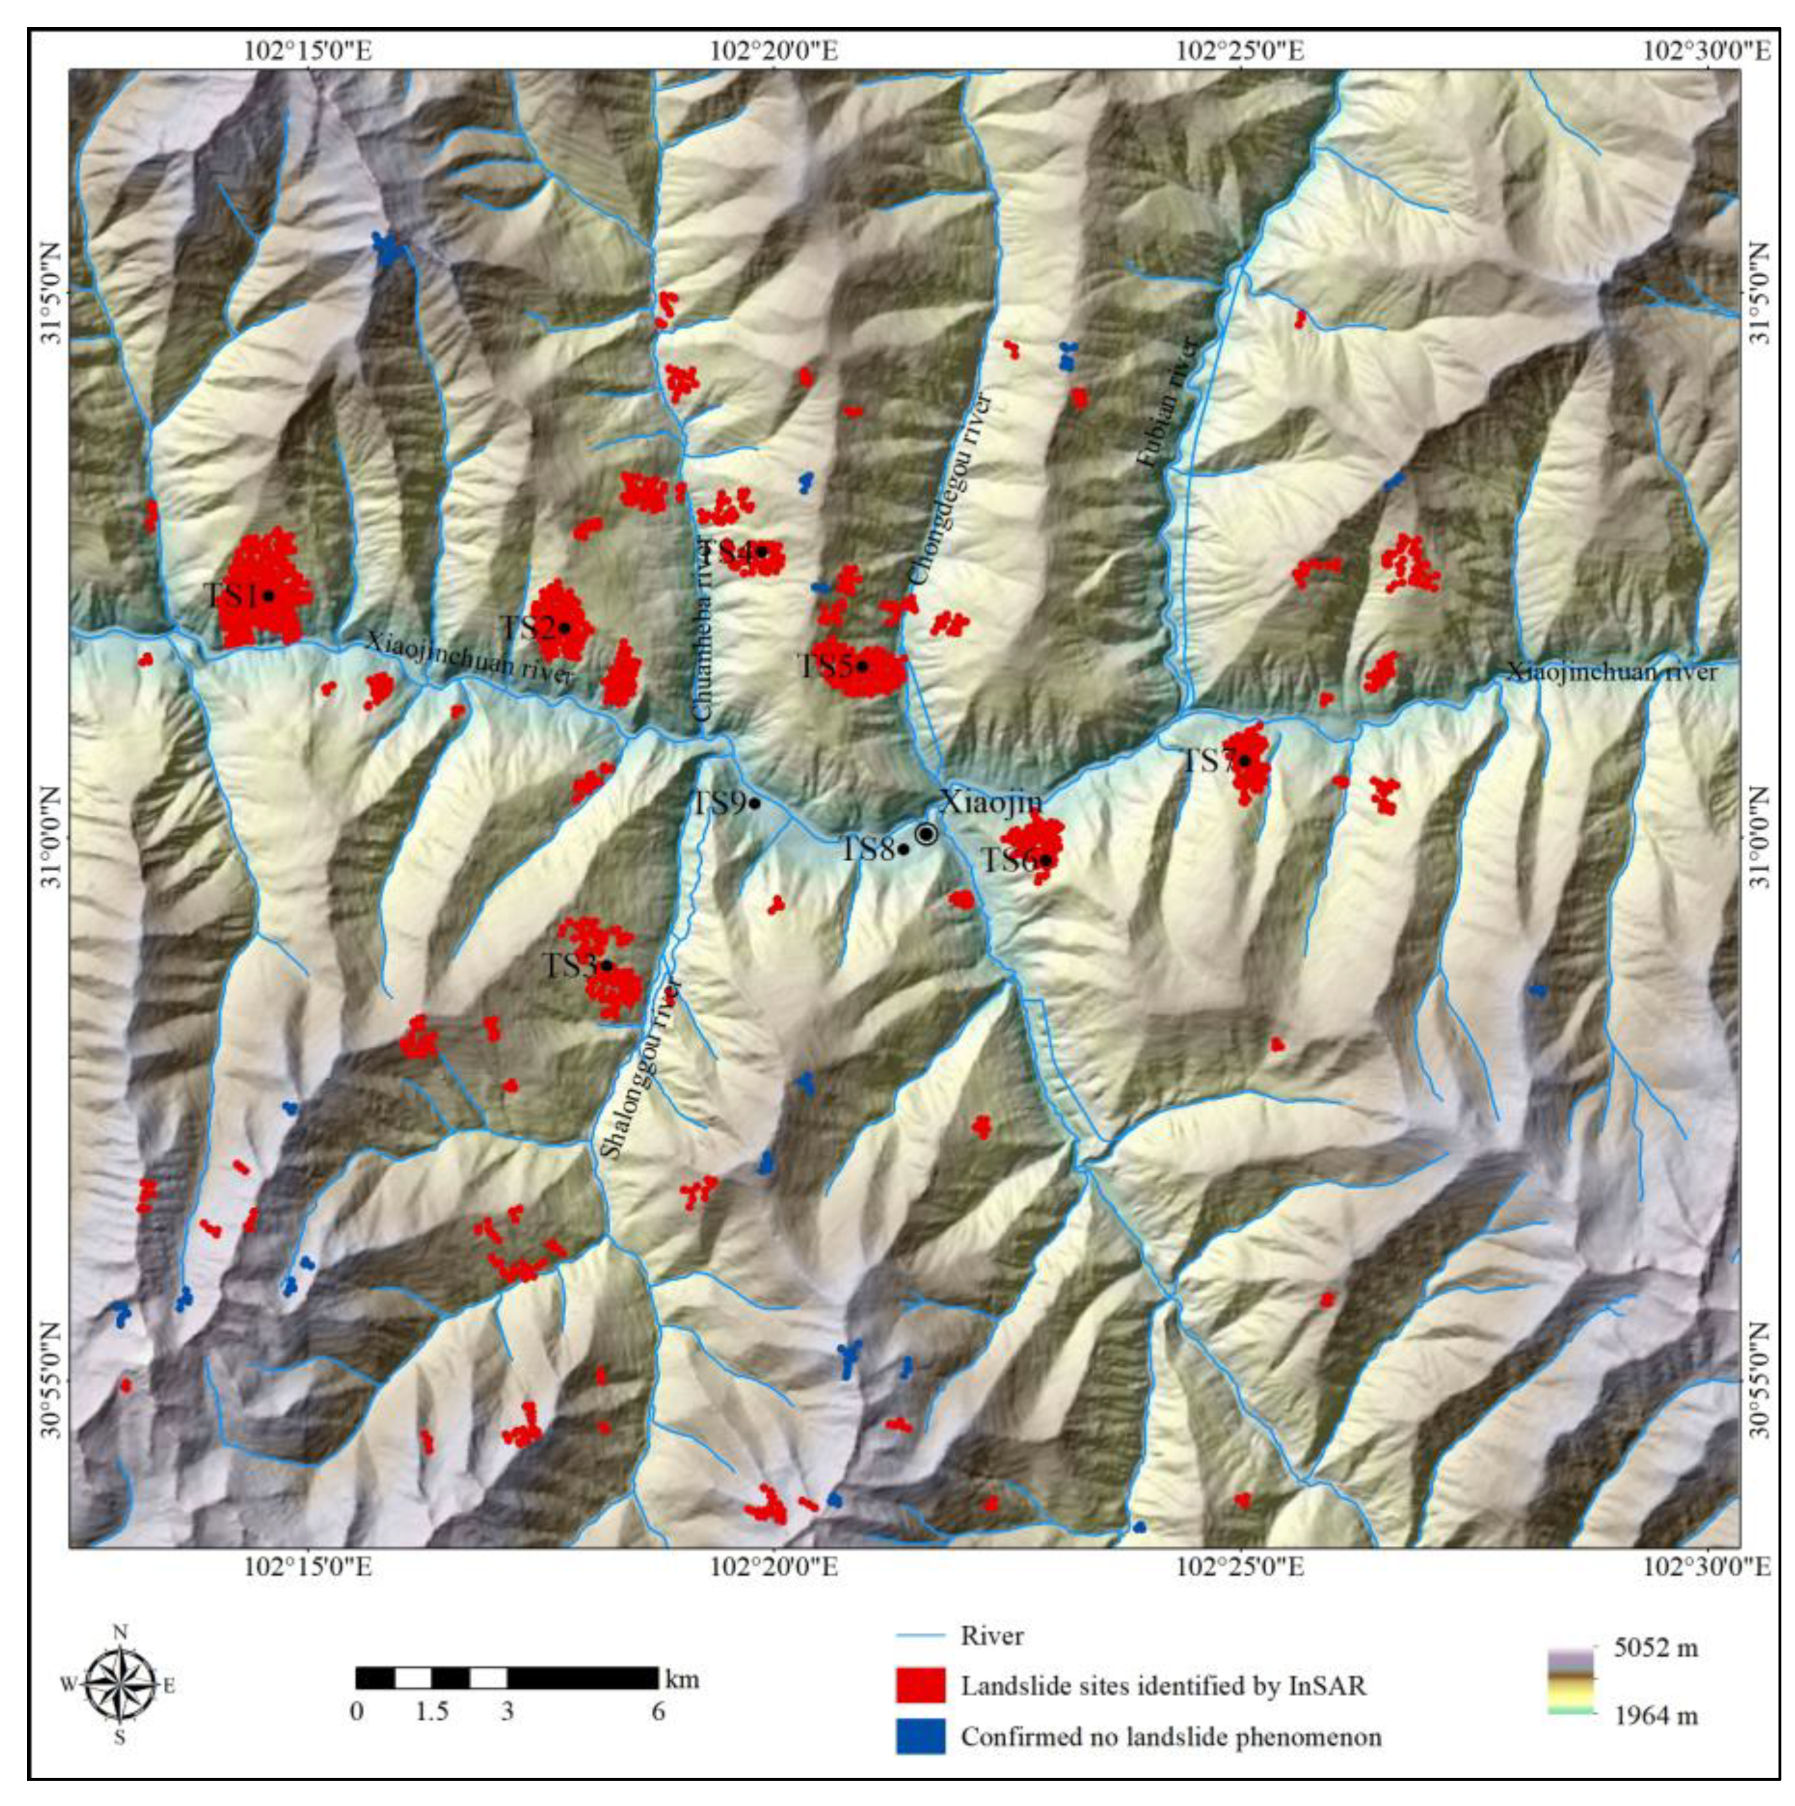
4.2. Potential Landslides
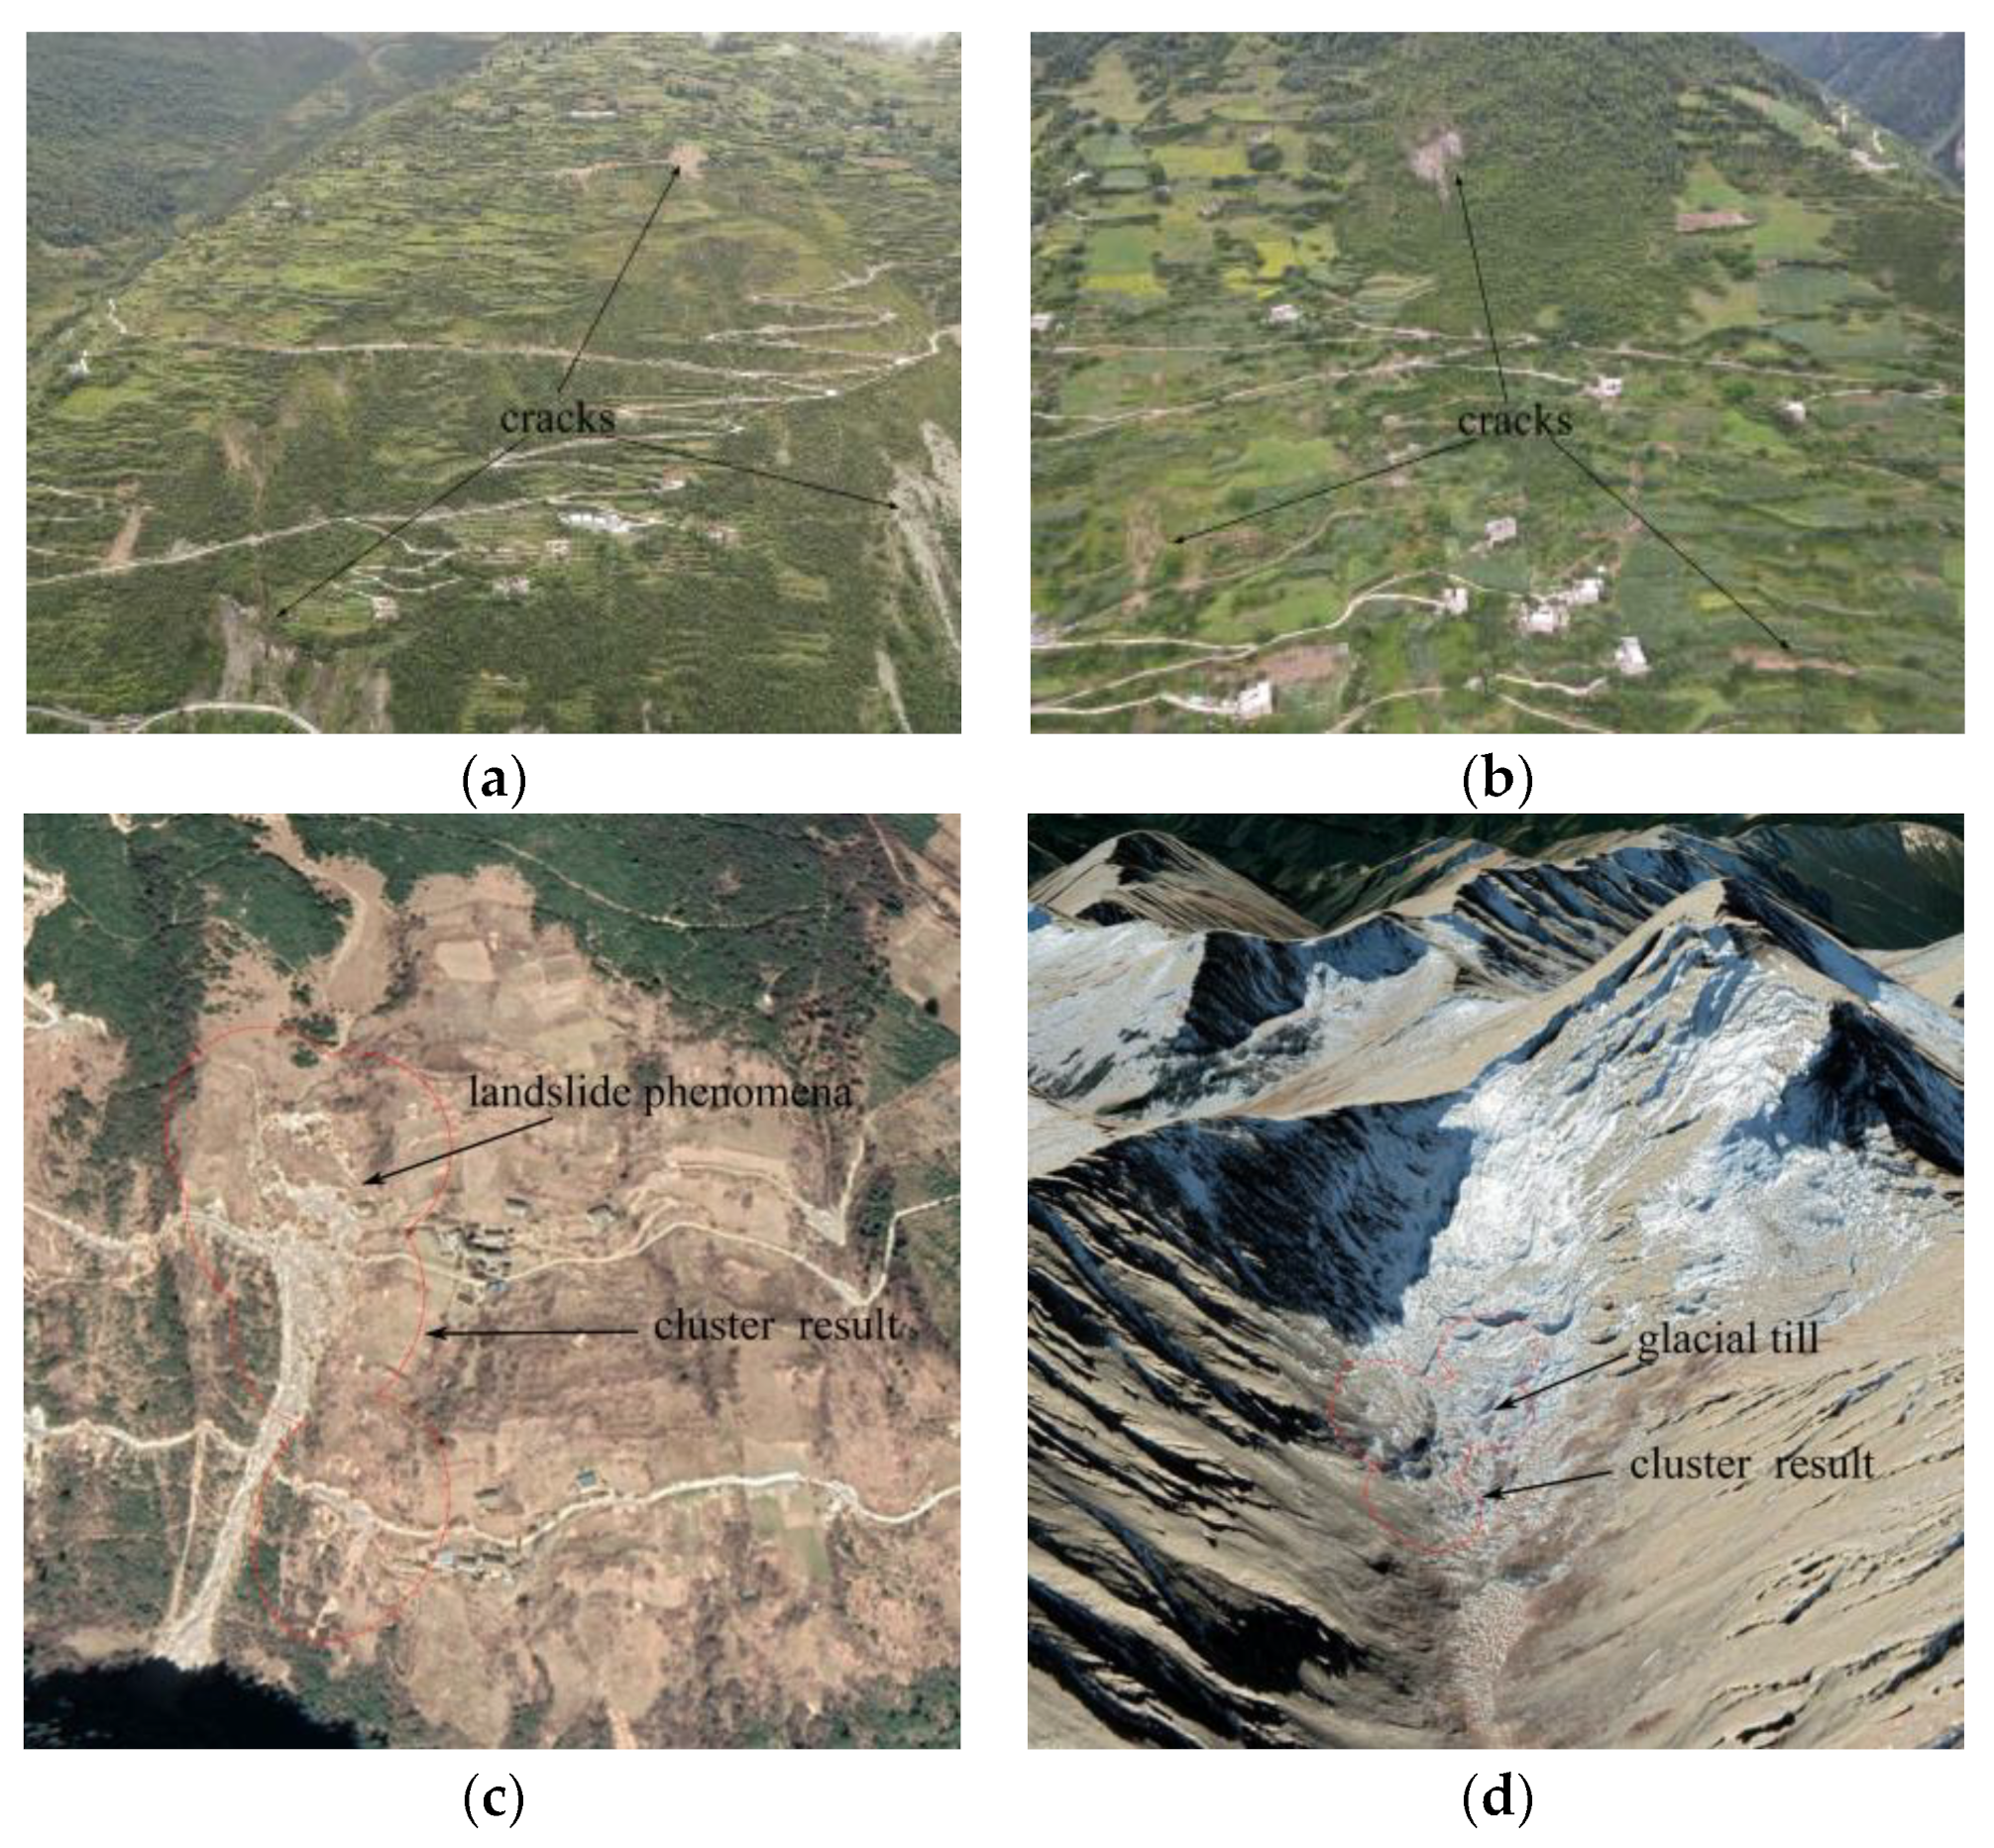
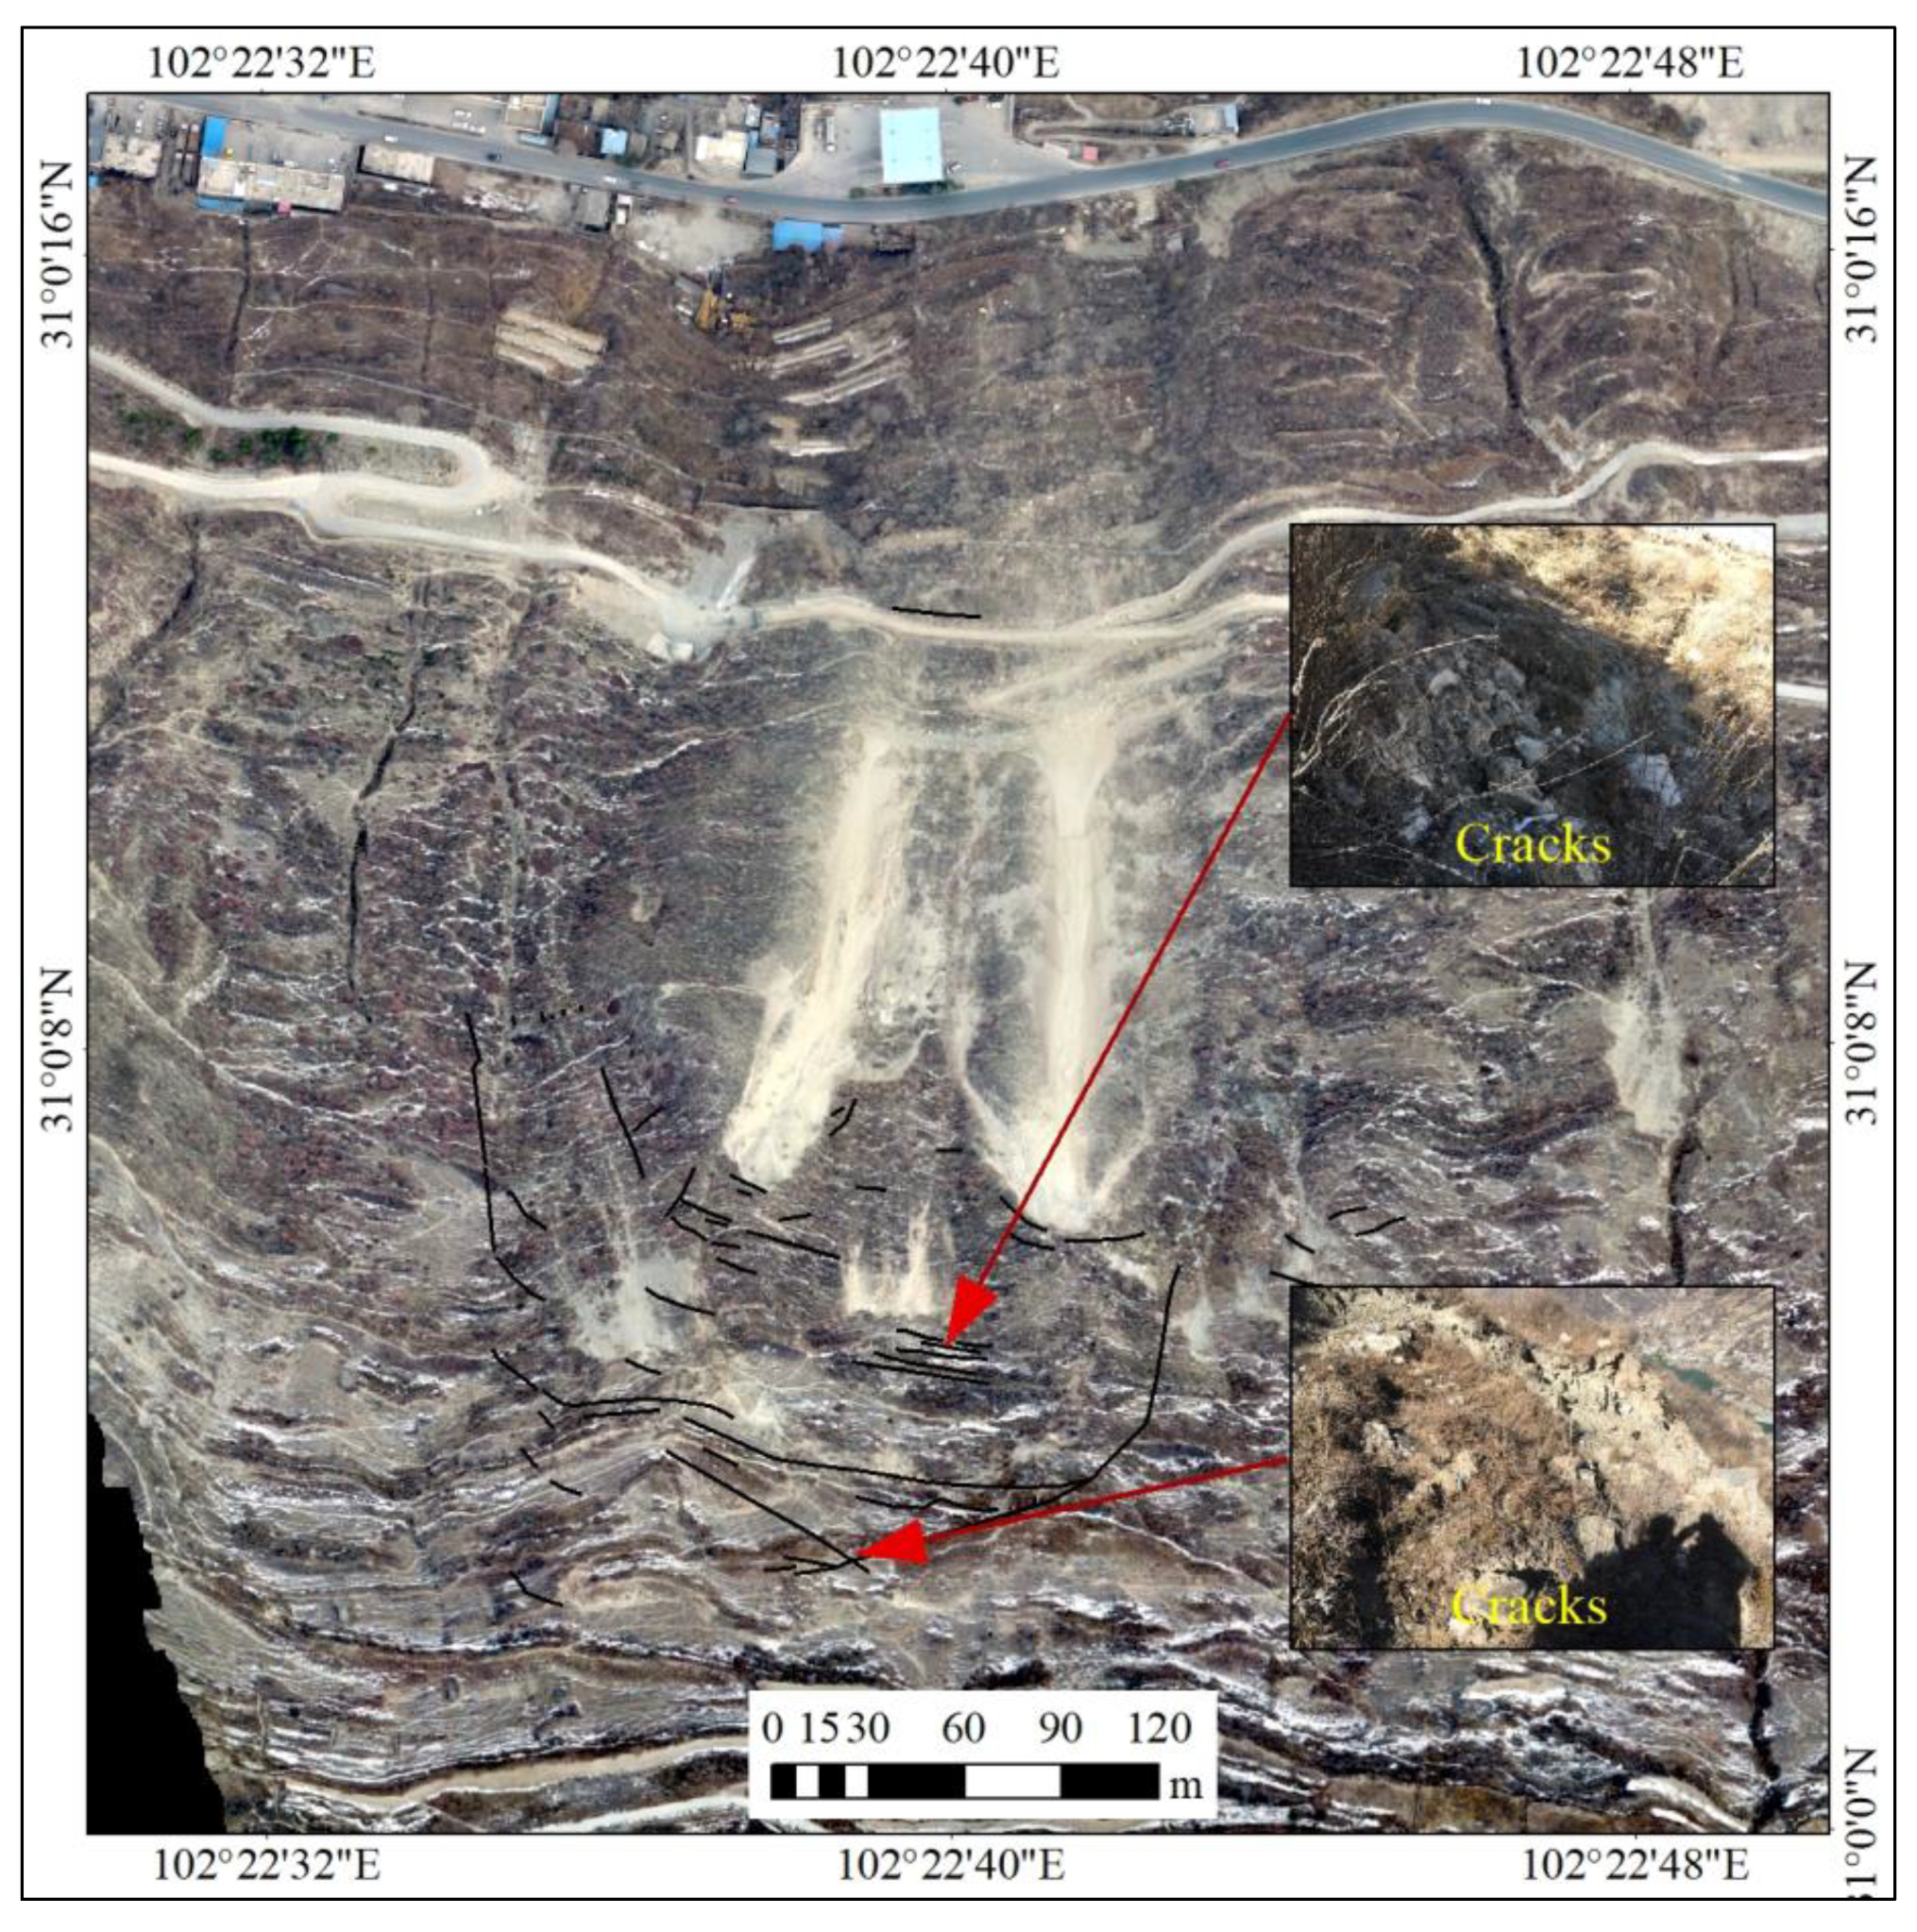
4.3. Potential Landslides Validation
5. Discussion
5.1. New Understanding of Landslide Development
5.2. Future Landslide Identification Using InSAR Techniques
6. Conclusions
Supplementary Materials
Author Contributions
Funding
Data Availability Statement
Acknowledgments
Conflicts of Interest
References
- Turner, A.K. Social and environmental impacts of landslides. Innov. Infrastruct. Solut. 2018, 3, 70. [Google Scholar] [CrossRef]
- van Westen, C.J.; van Asch, T.W.J.; Soeters, R. Landslide hazard and risk zonation—Why is it still so difficult? Bull. Eng. Geol. Environ. 2006, 65, 167–184. [Google Scholar] [CrossRef]
- Guo, Z.; Zhou, M.; Huang, Y.; Pu, J.; Zhou, S.; Fu, B.; Aydin, A. Monitoring performance of slopes via ambient seismic noise recordings: Case study in a colluvium deposit. Eng. Geol. 2023, 324, 107268. [Google Scholar] [CrossRef]
- Xu, C.; Xu, X.; Pourghasemi, H.R.; Pradhan, B.; Iqbal, J. Volume, gravitational potential energy reduction, and regional centroid position change in the wake of landslides triggered by the 14 April 2010 Yushu earthquake of China. Arab. J. Geosci. 2014, 7, 2129–2138. [Google Scholar] [CrossRef]
- Yu, H.; Li, C.; Zhou, J.-Q.; Chen, W.; Long, J.; Wang, X.; Peng, T. Recent rainfall- and excavation-induced bedding rockslide occurring on 22 October 2018 along the Jian-En expressway, Hubei, China. Landslides 2020, 17, 2619–2629. [Google Scholar] [CrossRef]
- Hearn, G.J. Slope Engineering for Mountain Roads; Geological Society of London: London, UK, 2011; ISBN 978-1-86239-331-8. [Google Scholar]
- Hu, W.; Huang, R.; McSaveney, M.; Zhang, X.; Yao, L.; Shimamoto, T. Mineral changes quantify frictional heating during a large low-friction landslide. Geology 2018, 46, 223–226. [Google Scholar] [CrossRef]
- Jerolmack, D.J.; Daniels, K.E. Viewing Earth’s surface as a soft-matter landscape. Nat. Rev. Phys. 2019, 1, 716–730. [Google Scholar] [CrossRef]
- Bontemps, N.; Lacroix, P.; Larose, E.; Jara, J.; Taipe, E. Rain and small earthquakes maintain a slow-moving landslide in a persistent critical state. Nat. Commun. 2020, 11, 780. [Google Scholar] [CrossRef] [PubMed]
- Zhou, S.; Ouyang, C.; An, H.; Jiang, T.; Xu, Q. Comprehensive study of the Beijing Daanshan rockslide based on real-time videos, field investigations, and numerical modeling. Landslides 2020, 17, 1217–1231. [Google Scholar] [CrossRef]
- Li, Q.; Wang, Y.M.; Zhang, K.B.; Yu, H.; Tao, Z.Y. Field investigation and numerical study of a siltstone slope instability induced by excavation and rainfall. Landslides 2020, 17, 1485–1499. [Google Scholar] [CrossRef]
- Pradhan, S.; Toll, D.G.; Rosser, N.J.; Brain, M.J. An investigation of the combined effect of rainfall and road cut on landsliding. Eng. Geol. 2022, 307, 106787. [Google Scholar] [CrossRef]
- Zhu, L.; Cui, S.; Pei, X.; Wang, S.; He, S.; Shi, X. Experimental investigation on the seismically induced cumulative damage and progressive deformation of the 2017 Xinmo landslide in China. Landslides 2021, 18, 1485–1498. [Google Scholar] [CrossRef]
- Ma, K.; Zhang, Y.; Wu, H.; Ji, Z.; Ren, J.; Liang, Y.; Zhou, X. Shaking table test study of accumulation layer landslide under earthquake action. Arab. J. Geosci. 2022, 15, 161. [Google Scholar] [CrossRef]
- Okura, Y.; Kitahara, H.; Ochiai, H.; Sammori, T.; Kawanami, A. Landslide fluidization process by flume experiments. Eng. Geol. 2002, 66, 65–78. [Google Scholar] [CrossRef]
- Lee, K.; Suk, J.; Kim, H.; Jeong, S. Modeling of rainfall-induced landslides using a full-scale flume test. Landslides 2021, 18, 1153–1162. [Google Scholar] [CrossRef]
- Zhang, Y.; Zhu, S.; Tan, J.; Li, L.; Yin, X. The influence of water level fluctuation on the stability of landslide in the Three Gorges Reservoir. Arab. J. Geosci. 2020, 13, 845. [Google Scholar] [CrossRef]
- Das, P.; Patwa, D.; Bharat, T.V. Influencing factors on the simulation of rainfall-induced landslide prediction based on case study. Bull. Eng. Geol. Environ. 2022, 81, 194. [Google Scholar] [CrossRef]
- Xie, W.; Guo, Q.; Wu, J.Y.; Li, P.; Yang, H.; Zhang, M. Analysis of loess landslide mechanism and numerical simulation stabilization on the Loess Plateau in Central China. Nat. Hazards 2021, 106, 805–827. [Google Scholar] [CrossRef]
- Wu, J.; Zhang, Y.; Yang, L.; Zhang, Y.; Lei, J.; Zhi, M.; Ma, G. Identifying the essential influencing factors of landslide susceptibility models based on hybrid-optimized machine learning with different grid resolutions: A case of Sino-Pakistani Karakorum Highway. Environ. Sci. Pollut. Res. 2023, 30, 100675–100700. [Google Scholar] [CrossRef]
- Domakinis, C.; Oikonomidis, D.; Astaras, T. Landslide mapping in the coastal area between the Strymonic Gulf and Kavala (Macedonia, Greece) with the aid of remote sensing and geographical information systems. Int. J. Remote Sens. 2008, 29, 6893–6915. [Google Scholar] [CrossRef]
- Li, Y.; Xiao, J.; Cong, N.; Yu, X.; Lin, Y.; Liu, T.; Qi, G.; Ren, P. Modeling Ecological Resilience of Alpine Forest under Climate Change in Western Sichuan. Forests 2023, 14, 1769. [Google Scholar] [CrossRef]
- Wang, Y.; Liu, D.; Dong, J.; Zhang, L.; Guo, J.; Liao, M.; Gong, J. On the applicability of satellite SAR interferometry to landslide hazards detection in hilly areas: A case study of Shuicheng, Guizhou in Southwest China. Landslides 2021, 18, 2609–2619. [Google Scholar] [CrossRef]
- Song, C.; Yu, C.; Li, Z.; Pazzi, V.; Del Soldato, M.; Cruz, A.; Utili, S. Landslide geometry and activity in Villa de la Independencia (Bolivia) revealed by InSAR and seismic noise measurements. Landslides 2021, 18, 2721–2737. [Google Scholar] [CrossRef]
- Zhang, Y.; Li, D.; Yin, K.; Chen, L.; Xu, Y.; Woldai, T.; Lian, Z. The July 1, 2017 Wangjiawan landslide in Ningxiang County, China. Landslides 2018, 15, 1657–1662. [Google Scholar] [CrossRef]
- Bayer, B.; Simoni, A.; Mulas, M.; Corsini, A.; Schmidt, D. Deformation responses of slow moving landslides to seasonal rainfall in the Northern Apennines, measured by InSAR. Geomorphology 2018, 308, 293–306. [Google Scholar] [CrossRef]
- Moretto, S.; Bozzano, F.; Mazzanti, P. The Role of Satellite InSAR for Landslide Forecasting: Limitations and Openings. Remote Sens. 2021, 13, 3735. [Google Scholar] [CrossRef]
- Zhang, L.; Dai, K.; Deng, J.; Ge, D.; Liang, R.; Li, W.; Xu, Q. Identifying Potential Landslides by Stacking-InSAR in Southwestern China and Its Performance Comparison with SBAS-InSAR. Remote Sens. 2021, 13, 3662. [Google Scholar] [CrossRef]
- Ouyang, C.; Zhao, W.; He, S.; Wang, D.; Zhou, S.; An, H.; Wang, Z.; Cheng, D. Numerical modeling and dynamic analysis of the 2017 Xinmo landslide in Maoxian County, China. J. Mt. Sci. 2017, 14, 1701–1711. [Google Scholar] [CrossRef]
- Zhao, S.; Chigira, M.; Wu, X. Buckling deformations at the 2017 Xinmo landslide site and nearby slopes, Maoxian, Sichuan, China. Eng. Geol. 2018, 246, 187–197. [Google Scholar] [CrossRef]
- Intrieri, E.; Raspini, F.; Fumagalli, A.; Lu, P.; Del Conte, S.; Farina, P.; Allievi, J.; Ferretti, A.; Casagli, N. The Maoxian landslide as seen from space: Detecting precursors of failure with Sentinel-1 data. Landslides 2018, 15, 123–133. [Google Scholar] [CrossRef]
- Xie, M.; Zhao, W.; Ju, N.; He, C.; Huang, H.; Cui, Q. Landslide evolution assessment based on InSAR and real-time monitoring of a large reactivated landslide, Wenchuan, China. Eng. Geol. 2020, 277, 105781. [Google Scholar] [CrossRef]
- Liu, X.; Zhao, C.; Zhang, Q.; Lu, Z.; Li, Z.; Yang, C.; Zhu, W.; Liu-Zeng, J.; Chen, L.; Liu, C. Integration of Sentinel-1 and ALOS/PALSAR-2 SAR datasets for mapping active landslides along the Jinsha River corridor, China. Eng. Geol. 2021, 284, 106033. [Google Scholar] [CrossRef]
- Hu, C.; Chen, Z.; Li, Y.; Dong, X.; Hobbs, S. Research progress on geosynchronous synthetic aperture radar. Fundam. Res. 2021, 1, 346–363. [Google Scholar] [CrossRef]
- Xie, M.; Huang, J.; Wang, L.; Huang, J.; Wang, Z. Early landslide detection based on D-InSAR technique at the Wudongde hydropower reservoir. Environ. Earth Sci. 2016, 75, 717. [Google Scholar] [CrossRef]
- Wang, G.; Xie, M.; Chai, X.; Wang, L.; Dong, C. D-InSAR-based landslide location and monitoring at Wudongde hydropower reservoir in China. Environ. Earth Sci. 2013, 69, 2763–2777. [Google Scholar] [CrossRef]
- Kiseleva, E.; Mikhailov, V.; Smolyaninova, E.; Dmitriev, P.; Golubev, V.; Timoshkina, E.; Hooper, A.; Samiei-Esfahany, S.; Hanssen, R. PS-InSAR Monitoring of Landslide Activity in the Black Sea Coast of the Caucasus. Procedia Technol. 2014, 16, 404–413. [Google Scholar] [CrossRef]
- Rosi, A.; Tofani, V.; Tanteri, L.; Tacconi Stefanelli, C.; Agostini, A.; Catani, F.; Casagli, N. The new landslide inventory of Tuscany (Italy) updated with PS-InSAR: Geomorphological features and landslide distribution. Landslides 2018, 15, 5–19. [Google Scholar] [CrossRef]
- Yalvac, S. Validating InSAR-SBAS results by means of different GNSS analysis techniques in medium- and high-grade deformation areas. Environ. Monit. Assess. 2020, 192, 120. [Google Scholar] [CrossRef]
- Zhang, J.; Gao, B.; Huang, H.; Chen, L.; Li, Y.; Yang, D. SBAS-InSAR-Based Landslide Susceptibility Mapping Along the North Lancang River, Tibetan Plateau. Front. Earth Sci. 2022, 10, 901889. [Google Scholar] [CrossRef]
- Hilley, G.E.; Bürgmann, R.; Ferretti, A.; Novali, F.; Rocca, F. Dynamics of Slow-Moving Landslides from Permanent Scatterer Analysis. Science 2004, 304, 1952–1955. [Google Scholar] [CrossRef]
- Murray, K.D.; Lohman, R.B.; Kim, J.; Holt, W.E. An Alternative Approach for Constraining 3D-Displacements With InSAR, Applied to a Fault-Bounded Groundwater Entrainment Field in California. J. Geophys. Res. Solid Earth 2021, 126, e2020JB021137. [Google Scholar] [CrossRef]
- Bianchini, S.; Cigna, F.; Righini, G.; Proietti, C.; Casagli, N. Landslide HotSpot Mapping by means of Persistent Scatterer Interferometry. Environ. Earth Sci. 2012, 67, 1155–1172. [Google Scholar] [CrossRef]
- Zhou, C.; Cao, Y.; Yin, K.; Wang, Y.; Shi, X.; Catani, F.; Ahmed, B. Landslide Characterization Applying Sentinel-1 Images and InSAR Technique: The Muyubao Landslide in the Three Gorges Reservoir Area, China. Remote Sens. 2020, 12, 3385. [Google Scholar] [CrossRef]
- Bouchra, A.; Mustapha, H.; Mohammed, R. D-InSAR Analysis of Sentinel-1 Data for Landslide Detection in Northern Morocco, Case Study: Chefchaouen. J. Geosci. Environ. Prot. 2020, 8, 84–103. [Google Scholar] [CrossRef]
- Liu, Y.; Qiu, H.; Yang, D.; Liu, Z.; Ma, S.; Pei, Y.; Zhang, J.; Tang, B. Deformation responses of landslides to seasonal rainfall based on InSAR and wavelet analysis. Landslides 2022, 19, 199–210. [Google Scholar] [CrossRef]
- Ouyang, C.; Zhao, W.; An, H.; Zhou, S.; Wang, D.; Xu, Q.; Li, W.; Peng, D. Early identification and dynamic processes of ridge-top rockslides: Implications from the Su Village landslide in Suichang County, Zhejiang Province, China. Landslides 2019, 16, 799–813. [Google Scholar] [CrossRef]
- Chang, M.; Sun, W.; Xu, H.; Tang, L. Identification and deformation analysis of potential landslides after the Jiuzhaigou earthquake by SBAS-InSAR. Environ. Sci. Pollut. Res. 2023, 30, 39093–39106. [Google Scholar] [CrossRef]
- Xu, Q.; Guo, C.; Dong, X.; Li, W.; Lu, H.; Fu, H.; Liu, X. Mapping and Characterizing Displacements of Landslides with InSAR and Airborne LiDAR Technologies: A Case Study of Danba County, Southwest China. Remote Sens. 2021, 13, 4234. [Google Scholar] [CrossRef]
- Li, S.; Xu, W.; Li, Z. Review of the SBAS InSAR Time-series algorithms, applications, and challenges. Geod. Geodyn. 2022, 13, 114–126. [Google Scholar] [CrossRef]
- Peng, T.; Chen, Y.; Chen, W. Landslide Susceptibility Modeling Using Remote Sensing Data and Random SubSpace-Based Functional Tree Classifier. Remote Sens. 2022, 14, 4803. [Google Scholar] [CrossRef]
- Wang, N.; Cheng, W.; Wang, B.; Liu, Q.; Zhou, C. Geomorphological regionalization theory system and division methodology of China. J. Geogr. Sci. 2020, 30, 212–232. [Google Scholar] [CrossRef]
- Xie, W.; Li, X.; Jian, W.; Yang, Y.; Liu, H.; Robledo, L.F.; Nie, W. A Novel Hybrid Method for Landslide Susceptibility Mapping-Based GeoDetector and Machine Learning Cluster: A Case of Xiaojin County, China. ISPRS Int. J. Geo-Inf. 2021, 10, 93. [Google Scholar] [CrossRef]
- Hooper, A.; Zebker, H.; Segall, P.; Kampes, B. A new method for measuring deformation on volcanoes and other natural terrains using InSAR persistent scatterers. Geophys. Res. Lett. 2004, 31. [Google Scholar] [CrossRef]
- Hooper, A.; Segall, P.; Zebker, H. Persistent scatterer interferometric synthetic aperture radar for crustal deformation analysis, with application to Volcán Alcedo, Galápagos. J. Geophys. Res. Solid Earth 2007, 112. [Google Scholar] [CrossRef]
- Hooper, A. A multi-temporal InSAR method incorporating both persistent scatterer and small baseline approaches. Geophys. Res. Lett. 2008, 35. [Google Scholar] [CrossRef]
- Luo, X.; Wang, C.; Long, Y.; Yi, Z. Analysis of the Decadal Kinematic Characteristics of the Daguangbao Landslide Using Multiplatform Time Series InSAR Observations After the Wenchuan Earthquake. J. Geophys. Res. Solid Earth 2020, 125, e2019JB019325. [Google Scholar] [CrossRef]
- Berardino, P.; Fornaro, G.; Lanari, R.; Sansosti, E. A new algorithm for surface deformation monitoring based on small baseline differential SAR interferograms. IEEE Trans. Geosci. Remote Sens. 2002, 40, 2375–2383. [Google Scholar] [CrossRef]
- Cigna, F.; Esquivel Ramírez, R.; Tapete, D. Accuracy of Sentinel-1 PSI and SBAS InSAR Displacement Velocities against GNSS and Geodetic Leveling Monitoring Data. Remote Sens. 2021, 13, 4800. [Google Scholar] [CrossRef]
- Hooper, A.; Bekaert, D.; Spaans, K.; Arıkan, M. Recent advances in SAR interferometry time series analysis for measuring crustal deformation. Tectonophysics 2012, 514, 1–13. [Google Scholar] [CrossRef]
- Hooper, A. A Statistical-Cost Approach to Unwrapping the Phase of InSAR Time Series. In Proceedings of the International Workshop on ERS SAR Interferometry, Frascati, Italy, 30 November 2010. [Google Scholar]
- Zhou, S.; Ouyang, C.; Huang, Y. An InSAR and depth-integrated coupled model for potential landslide hazard assessment. Acta Geotech. 2022, 17, 3613–3632. [Google Scholar] [CrossRef]
- Herrera, G.; Gutiérrez, F.; García-Davalillo, J.C.; Guerrero, J.; Notti, D.; Galve, J.P.; Fernández-Merodo, J.A.; Cooksley, G. Multi-sensor advanced DInSAR monitoring of very slow landslides: The Tena Valley case study (Central Spanish Pyrenees). Remote Sens. Environ. 2013, 128, 31–43. [Google Scholar] [CrossRef]
- Lu, P.; Casagli, N.; Catani, F.; Tofani, V. Persistent Scatterers Interferometry Hotspot and Cluster Analysis (PSI-HCA) for detection of extremely slow-moving landslides. Int. J. Remote Sens. 2012, 33, 466–489. [Google Scholar] [CrossRef]
- Getis, A.; Ord, J.K. The Analysis of Spatial Association by Use of Distance Statistics. Geogr. Anal. 1992, 24, 189–206. [Google Scholar] [CrossRef]
- Ord, J.K.; Getis, A. Local Spatial Autocorrelation Statistics: Distributional Issues and an Application. Geogr. Anal. 1995, 27, 286–306. [Google Scholar] [CrossRef]
- Ren, T.; Gong, W.; Gao, L.; Zhao, F.; Cheng, Z. An Interpretation Approach of Ascending–Descending SAR Data for Landslide Identification. Remote Sens. 2022, 14, 1299. [Google Scholar] [CrossRef]
- Meisina, C.; Zucca, F.; Notti, D.; Colombo, A.; Cucchi, A.; Savio, G.; Giannico, C.; Bianchi, M. Geological Interpretation of PSInSAR Data at Regional Scale. Sensors 2008, 8, 7469–7492. [Google Scholar] [CrossRef]
- Rose, N.D.; Hungr, O. Forecasting potential rock slope failure in open pit mines using the inverse-velocity method. Int. J. Rock Mech. Min. Sci. 2007, 44, 308–320. [Google Scholar] [CrossRef]
- van Westen, C.J.; Castellanos, E.; Kuriakose, S.L. Spatial data for landslide susceptibility, hazard, and vulnerability assessment: An overview. Eng. Geol. 2008, 102, 112–131. [Google Scholar] [CrossRef]
- Ouyang, C.; An, H.; Zhou, S.; Wang, Z.; Su, P.; Wang, D.; Cheng, D.; She, J. Insights from the failure and dynamic characteristics of two sequential landslides at Baige village along the Jinsha River, China. Landslides 2019, 16, 1397–1414. [Google Scholar] [CrossRef]
- Dai, K.; Xu, Q.; Li, Z.; Tomás, R.; Fan, X.; Dong, X.; Li, W.; Zhou, Z.; Gou, J.; Ran, P. Post-disaster assessment of 2017 catastrophic Xinmo landslide (China) by spaceborne SAR interferometry. Landslides 2019, 16, 1189–1199. [Google Scholar] [CrossRef]
- Liu, X.; Zhao, C.; Zhang, Q.; Lu, Z.; Li, Z. Deformation of the Baige Landslide, Tibet, China, Revealed Through the Integration of Cross-Platform ALOS/PALSAR-1 and ALOS/PALSAR-2 SAR Observations. Geophys. Res. Lett. 2020, 47, e2019GL086142. [Google Scholar] [CrossRef]
- Yi, Y.; Zhang, Z.; Zhang, W.; Jia, H.; Zhang, J. Landslide susceptibility mapping using multiscale sampling strategy and convolutional neural network: A case study in Jiuzhaigou region. CATENA 2020, 195, 104851. [Google Scholar] [CrossRef]
- Lin, F.; Wu, L.Z.; Huang, R.Q.; Zhang, H. Formation and characteristics of the Xiaoba landslide in Fuquan, Guizhou, China. Landslides 2018, 15, 669–681. [Google Scholar] [CrossRef]
- Goodman, R.E. Introduction to Rock Mechanics, 2nd ed.; Wiley: New York, NY, USA, 1991; ISBN 978-0-471-81200-5. [Google Scholar]
- Bovenga, F.; Wasowski, J.; Nitti, D.O.; Nutricato, R.; Chiaradia, M.T. Using COSMO/SkyMed X-band and ENVISAT C-band SAR interferometry for landslides analysis. Remote Sens. Environ. 2012, 119, 272–285. [Google Scholar] [CrossRef]
- Du, Y.; Xu, Q.; Zhang, L.; Feng, G.; Li, Z.; Chen, R.-F.; Lin, C.-W. Recent Landslide Movement in Tsaoling, Taiwan Tracked by TerraSAR-X/TanDEM-X DEM Time Series. Remote Sens. 2017, 9, 353. [Google Scholar] [CrossRef]
- Tantianuparp, P.; Shi, X.; Zhang, L.; Balz, T.; Liao, M. Characterization of Landslide Deformations in Three Gorges Area Using Multiple InSAR Data Stacks. Remote Sens. 2013, 5, 2704–2719. [Google Scholar] [CrossRef]
- Fan, X.; Xu, Q.; Alonso-Rodriguez, A.; Subramanian, S.S.; Li, W.; Zheng, G.; Dong, X.; Huang, R. Successive landsliding and damming of the Jinsha River in eastern Tibet, China: Prime investigation, early warning, and emergency response. Landslides 2019, 16, 1003–1020. [Google Scholar] [CrossRef]
- Xiong, Z.; Feng, G.; Feng, Z.; Miao, L.; Wang, Y.; Yang, D.; Luo, S. Pre- and post-failure spatial-temporal deformation pattern of the Baige landslide retrieved from multiple radar and optical satellite images. Eng. Geol. 2020, 279, 105880. [Google Scholar] [CrossRef]
- Zhang, S.; Yin, Y.; Hu, X.; Wang, W.; Zhang, N.; Zhu, S.; Wang, L. Dynamics and emplacement mechanisms of the successive Baige landslides on the Upper Reaches of the Jinsha River, China. Eng. Geol. 2020, 278, 105819. [Google Scholar] [CrossRef]
- Intrieri, E.; Frodella, W.; Raspini, F.; Bardi, F.; Tofani, V. Using Satellite Interferometry to Infer Landslide Sliding Surface Depth and Geometry. Remote Sens. 2020, 12, 1462. [Google Scholar] [CrossRef]
- Dai, K.; Li, Z.; Tomás, R.; Liu, G.; Yu, B.; Wang, X.; Cheng, H.; Chen, J.; Stockamp, J. Monitoring activity at the Daguangbao mega-landslide (China) using Sentinel-1 TOPS time series interferometry. Remote Sens. Environ. 2016, 186, 501–513. [Google Scholar] [CrossRef]


| Date | Epicenter Location | Magnitude | Distance to Study Area (km) |
|---|---|---|---|
| 18 February 1991 | Xiaojin county | 5.0 | 60 |
| 12 May 2008 | Wenchuan county | 8.0 | 108 |
| 20 April 2013 | Lushan county | 7.0 | 109 |
| 22 November 2014 | Kangding county | 6.3 | 95 |
| Parameters | Landslide Inventory by Field Survey | Landslide Inventory by Field Survey and InSAR |
|---|---|---|
| Number of landslides | 93 | 129 |
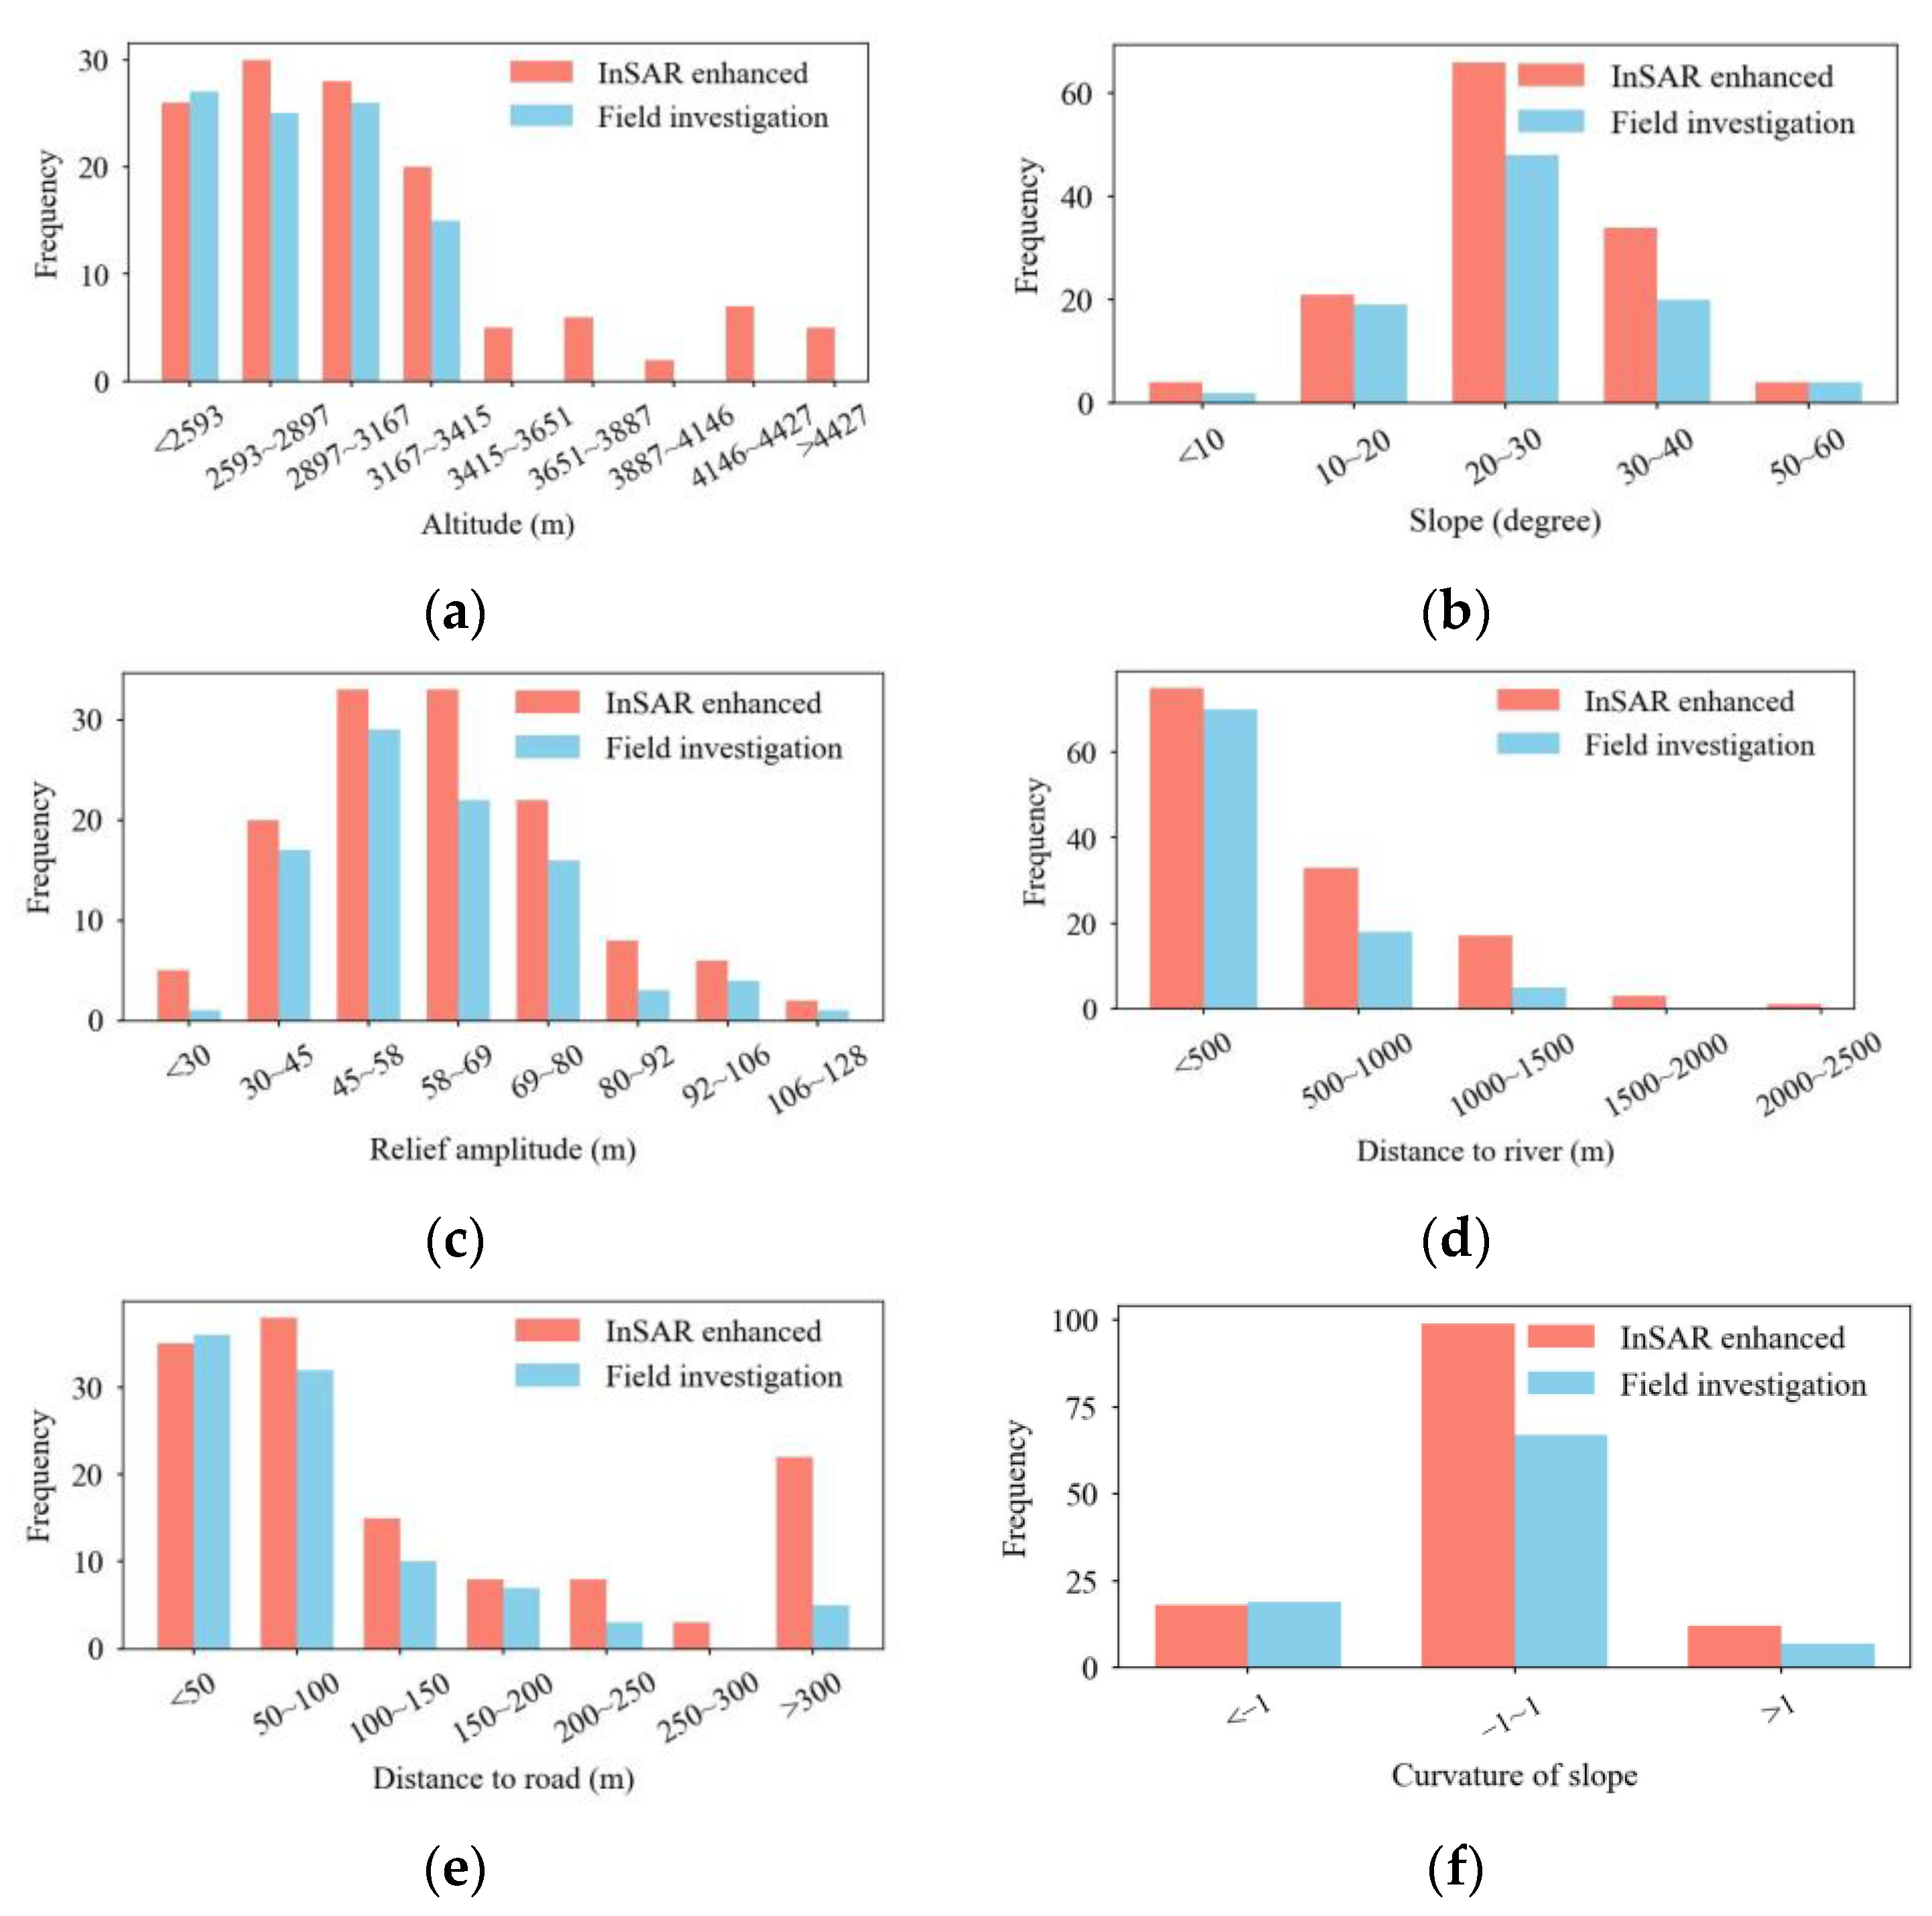
| Altitude range | <3415 m | 25 potential landslides at high altitudes >3415 m |
| Slope distribution | Mainly concentrated in 20°–30° | Mainly concentrated in 20°–30° but 37.5% and 70% increases in the ranges of 20°–30° and 30°–40° |
| Relief amplitude | Mainly concentrated in 45–58 m | Dominant relief amplitude expands to 45–69 m |
| Distance to rivers | Mainly distributed within 500 m | Some landslides at a distance of greater than 1500 m from rivers are observed |
| Distance to road | Mainly distributed within 100 m | 25 landslide sites in an area located more than 250 m away from the roads |
| Slope curvature | Mainly located in [−1, 1] | Mainly located in [−1, 1] |
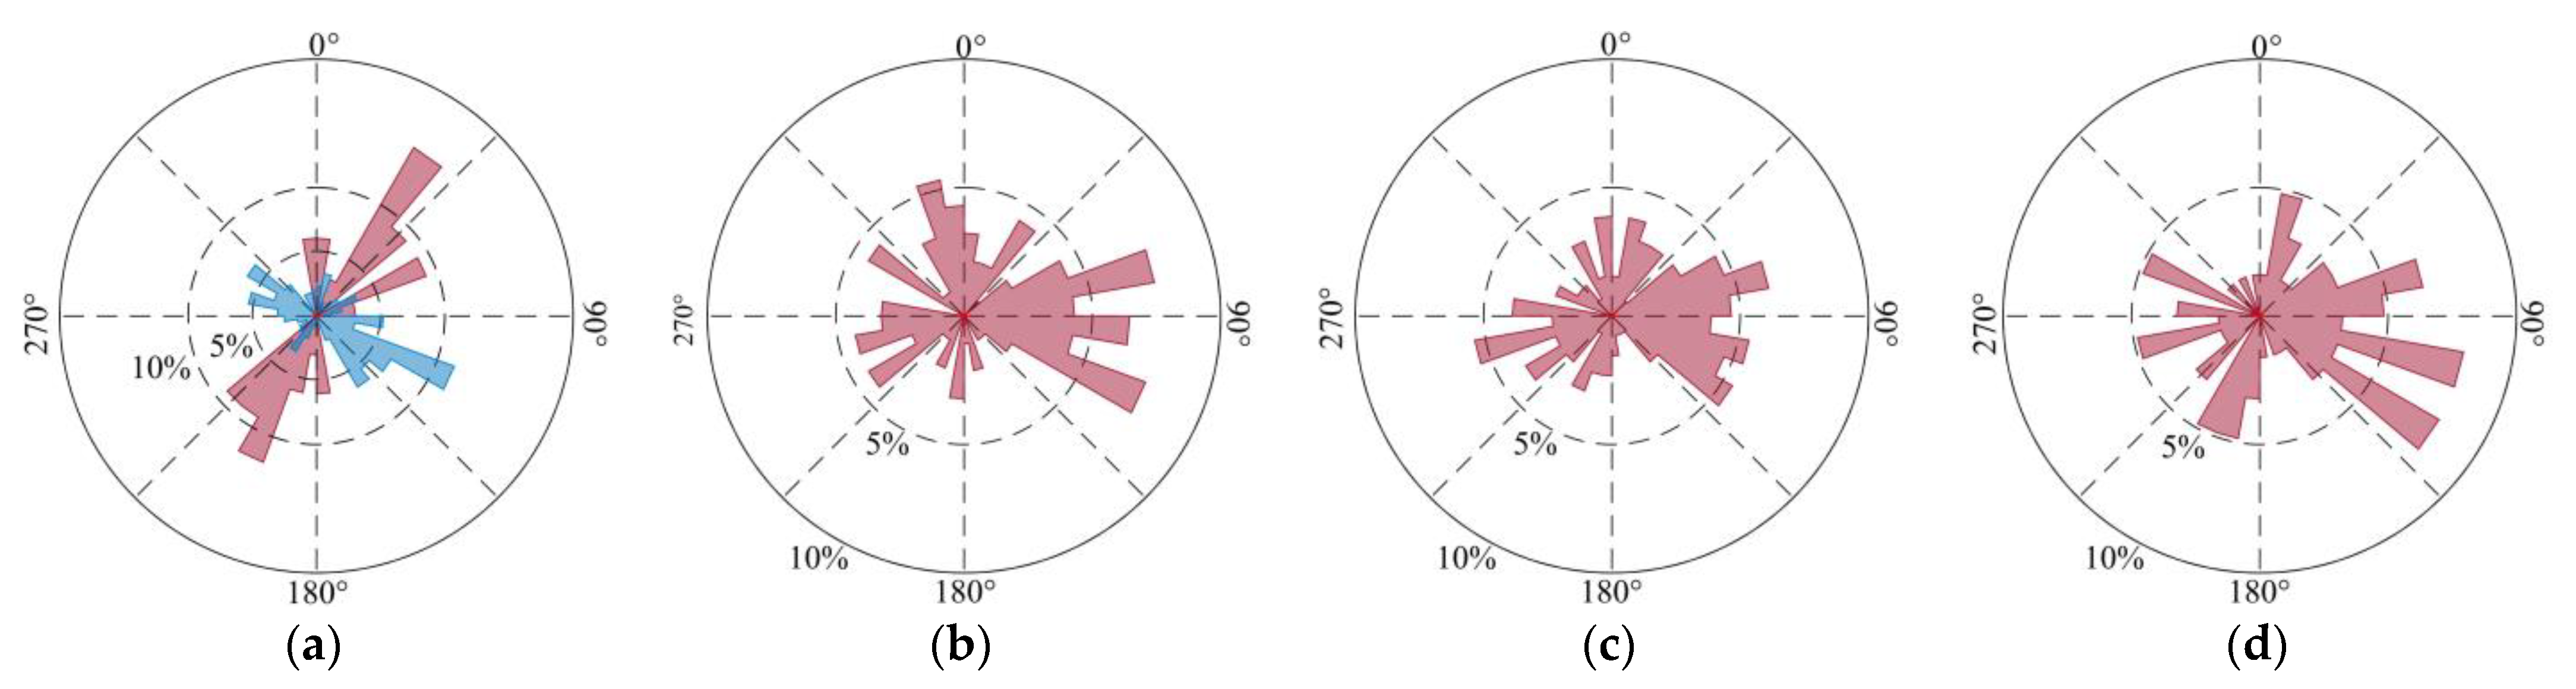
| Development pattern | Controlled by the strata and wedges | Not only controlled by the strata and wedges but also the combinations of strata bedding planes and wedges |
Disclaimer/Publisher’s Note: The statements, opinions and data contained in all publications are solely those of the individual author(s) and contributor(s) and not of MDPI and/or the editor(s). MDPI and/or the editor(s) disclaim responsibility for any injury to people or property resulting from any ideas, methods, instructions or products referred to in the content. |
© 2023 by the authors. Licensee MDPI, Basel, Switzerland. This article is an open access article distributed under the terms and conditions of the Creative Commons Attribution (CC BY) license (https://creativecommons.org/licenses/by/4.0/).
Share and Cite
Zhou, S.; Guo, Z.; Huang, G.; Liu, K. Improving the Understanding of Landslide Development in Alpine Forest Regions Using the InSAR Technique: A Case Study in Xiaojin County China. Appl. Sci. 2023, 13, 11851. https://doi.org/10.3390/app132111851
Zhou S, Guo Z, Huang G, Liu K. Improving the Understanding of Landslide Development in Alpine Forest Regions Using the InSAR Technique: A Case Study in Xiaojin County China. Applied Sciences. 2023; 13(21):11851. https://doi.org/10.3390/app132111851
Chicago/Turabian StyleZhou, Shu, Zhen Guo, Gang Huang, and Kanglin Liu. 2023. "Improving the Understanding of Landslide Development in Alpine Forest Regions Using the InSAR Technique: A Case Study in Xiaojin County China" Applied Sciences 13, no. 21: 11851. https://doi.org/10.3390/app132111851