1. Introduction
Remote sensing offers a variety of data sources for surface feature recognition and classification, enhancing our understanding of the Earth’s surface [
1,
2]. Due to the advancement of remote sensing satellites and various social media, traditional remote sensing scene classification tasks are typically based on images, using passive or active sensors [
3,
4,
5,
6] and various street view images. In recent years, urban planning [
7], environmental monitoring [
8,
9], and various other fields have greatly benefited from the extensive acquisition of remote sensing data and the rapid advancements in remote sensing technology. On the other hand, as a result of the ongoing development of sound recording software and the rising demand for various acoustic tasks, scene classification tasks based on audio have advanced significantly [
10,
11,
12], such as speech command recognition [
13], emotion recognition [
14], and audio event classification [
15,
16]. When classifying an acoustic scene, the input is often a brief audio recording; however, when classifying a visual scene, the input can be either an image or a brief video clip.
Advanced audio scene-classification algorithms currently in use are typically based on spectral features, most frequently log-Mel spectrograms, and convolutional neural network structures, as CNN structures aid in providing general classification information for longer segments of acoustic scenes [
17]. The conventional CNN architecture may execute downsampling operations on the time dimension and feature dimension while continually learning acoustic information using several convolutional layers and pooling layers. Based on this, Ren et al. [
18] proposed a dilated convolutional kernel that allows achieving a comparable receptive field without intermediate pooling to improve the performance of the acoustic scene classification system in the context of local feature acquisition. In the following study, Koutine et al. [
19] confirmed that restricting the size of the receptive field can effectively improve the performance of acoustic scene classification. Researchers have extended the commonly used CNN structure in anticipation of improving the learning ability of acoustic features. Basbug and Sert [
20] drew inspiration from the field of computer vision, adopted a spatial pyramid pooling strategy, pooled and combined features at different spatial resolutions, and further improved the performance of acoustic feature extraction. The attention mechanism was also used to build an audio scene classification system in addition to the CNN structure and its variations for acoustic scene classification. An attention mechanism allows the neural network to concentrate on a particular subset of input data because different time segments of ambient audio recordings have varying impacts on the categorization of acoustic scenes. Li et al. [
21] introduced a multi-level attention model in the network’s feature-learning section to improve feature-learning performance. At the same time, the attention mechanism can also be applied to the pooling operation of the feature map. Wang et al. [
22] used Self-Determination CNNs (SD-CNNs) to identify the acoustic events due to overlapping higher uncertainty frame information.
In contrast, remote sensing image classification methods have a longer history and a greater variety of methodologies, which are either based on the traditional handcrafted features or the deep learning ones. Early scene classification mainly depended on manually created features. There are numerous traditional techniques for extracting hand-crafted features, including the Histogram of Oriented Gradients (HOG) [
23], texture descriptors [
24], GIST [
25], color histograms [
26], and Scale-Invariant Feature Transform (SIFT) [
27]. Deep learning methods have also been introduced into the field of remote sensing. Cheng et al. [
28] first used Convolutional Neural Networks (CNN) for scene classification of high-resolution remote sensing images. Zhou et al. [
29] introduced deep learning to process high-resolution remote sensing images, proposed a method for automatically learning feature representation, and experimentally demonstrated its effectiveness in scene classification tasks. Inspired by the mechanism of attention, Wang et al. [
5] introduced a recurrent attention mechanism combined with deep learning methods to solve the scene classification problem of high-resolution remote sensing images, providing a new method for image processing and classification in the field of remote sensing. Vision Transformer (ViT) has recently been used for scene classification and has shown good results. For image classification tasks, the Vision Transformer (ViT) model uses attention-based deep learning. The ViT model uses a self-attention mechanism to capture the global information in the image, in contrast to the conventional Convolutional Neural Network (CNN), which views the image as a collection of segmented blocks. At the moment, researchers are attempting to use Transformers for remote sensing tasks. For example, Guo et al. [
30] proposed a Transformer method based on channel–spatial attention for remote sensing image scene classification; Xu et al. [
31] proposed an efficient multi-scale Transformer named EMTCAL and a cross-level attentional learning method for remote sensing scene classification; Li et al. [
32] proposed a method called Reformer for remote sensing scene classification. This method aims to improve the accuracy and effectiveness of remote sensing image scene classification by combining a residual network and Transformer.
However, whether applied to audio scene classification or remote sensing image classification, prevailing methodologies predominantly rely on data from a singular modality. In practical, real-world scenarios, human perception and comprehension of natural environments inherently involve the integration of multiple sensory modalities, particularly sight and hearing. Human perceptual research underscores the inherent complementarity of sound and visual information in the comprehensive understanding of environmental scenes [
33]. For example, within an airport setting, aerial images captured from the air by aircraft provide an expansive, bird’s-eye view of the airport’s layout. At the same time, people can hear some ground environment sounds including human conversations, airport announcements, and unique engine sounds on the ground. In light of the foregoing analysis grounded in common sense, it is reasonable to explore the amalgamation of sound and visual information for the purpose of scene classification. Researchers are increasingly interested in multimodal data fusion due to the continuous evolution of remote sensing and sensor instrumentation. Emerging as a valuable sensory data source, ground environment audio data can contribute significantly to the classification of surface scenes by furnishing information on environmental acoustics, such as wildlife vocalizations and traffic sounds. This auditory information can help classify various scenes. Hence, researchers have initiated the exploration of sound–image fusion for multimodal remote sensing scene classification, striving to enhance classification precision and robustness [
34]. Saurabh et al. [
35] proposed a method of integrating local context information into a self-attention model to improve scene classification, using local and global temporal relationships between video frames to obtain a more-comprehensive contextual representation of a single frame. In addition to relying on the attention mechanism to improve the accuracy of multi-modal scene classification, technical improvement on the feature extraction level is another research hotspot. Kurcius et al. [
36] combined the latest method of audiovisual feature extraction with the multi-resolution feature bag model to improve the feature extraction technology and proposed a unique audiovisual environment perception model based on compressed sensing theory [
37] to improve the environment scene classification performance. As research endeavors in image and audio scene classification tasks advance, this interdisciplinary approach holds substantial promise.
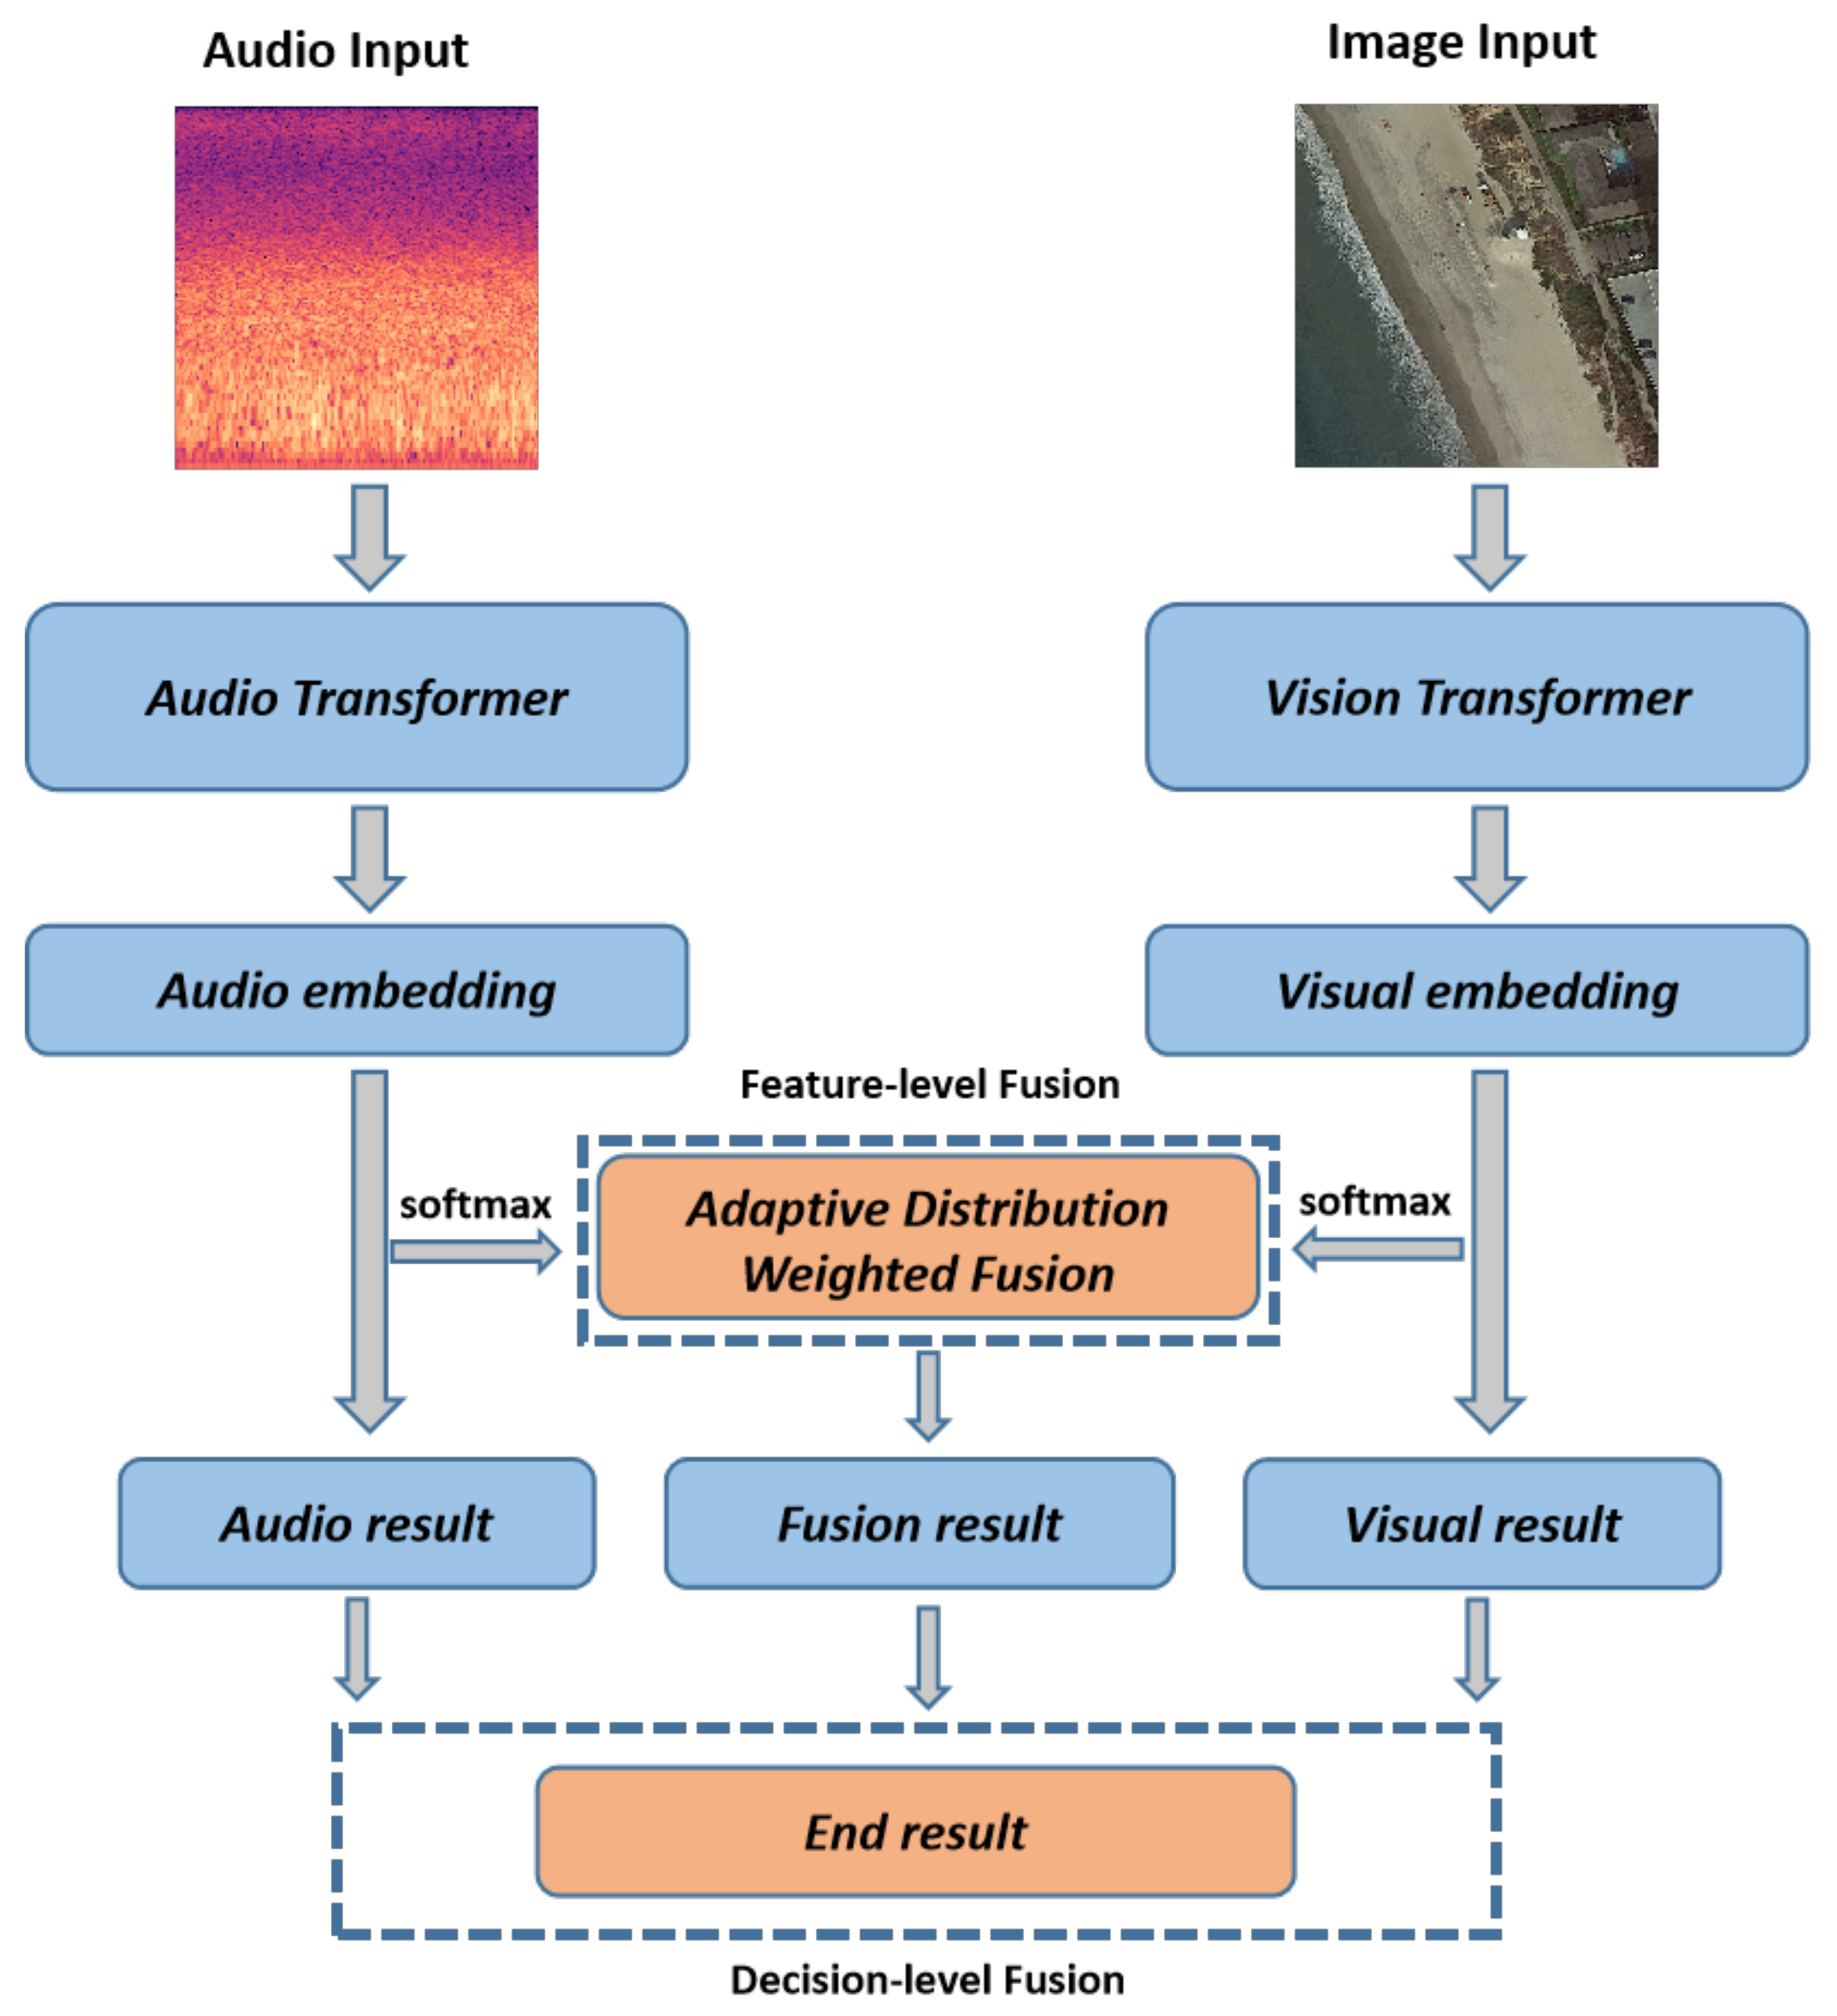
In this paper, we propose a novel two-stage fusion-based multimodal audiovisual classification network, aiming to explore the potential of using remote sensing images and ground environment audio for multimodal remote sensing scene classification. The audio, vision, and fusion modules make up the network. By combining ground environment audio and remote sensing aerial images, we can obtain more-accurate audiovisual scene classification results. The resilience of the classification method may also be improved via multimodal fusion, allowing it to perform well in challenging and noisy conditions. The following are the primary contributions of this study:
A Two-stage Fusion-based Audiovisual Classification Network (TFAVCNet) was designed in this paper. We simultaneously used ground environment audio and remote sensing images to solve the task of remote sensing audiovisual scene classification in order to enhance the performance of single-mode remote sensing scene classification.
The proposed approach makes use of two separate networks, which were, respectively, trained on audio and visual data, so that each network specialized in a given modality. We constructed the Audio Transformer (AiT) model to extract the time-domain and frequency-domain features of the audio signals.
In the fusion module, we propose a two-stage hybrid fusion strategy. During the feature-level fusion stage, we propose the adaptive distribution weighted fusion to obtain the fusion embedding. In the decision-level fusion stage, we retained the single-mode decision results for both images and audio and weighted them with the feature fusion results.
This paper is organized as follows:
Section 2 presents the related work.
Section 3 presents the overall framework of the proposed audiovisual remote sensing scene classification network, as well as the audio module, visual module, and two-stage hybrid fusion strategy.
Section 4 describes the details and results of each part of the performed experiments.
Section 5 summarizes the paper and details the outlook for future research work.
2. Related Works
In recent years, researchers have paid close attention to the fusion of multimodal data for remote sensing scene classification. This section, divided into three parts, provides a brief overview of related work in the fields of audiovisual learning, remote sensing scene classification, and multimodal fusion in remote sensing.
2.1. Audiovisual Learning
Using both visual and audible information, audiovisual learning is a multimodal teaching and learning approach. As computer vision and voice processing have developed quickly over the past several years, more and more academics have focused on audiovisual learning and made impressive strides in a variety of tasks and applications. In order to give more thorough and precise scene understanding and event identification skills, audiovisual learning may combine the auditory aspects of speech signals with visual data from movies, such as face expressions and lip movements. Prominent results include the following: the introduction of visual modalities allows audiovisual separation and localization, i.e., the separation of specific sounds emanating from corresponding objects or the task of localizing sounds in visual modalities based on audio input [
38,
39]; the global semantic relationship among them, using the semantics provided by visual information, to improve the recognition performance of audiovisual speech recognition tasks [
40,
41,
42,
43]; based on one of the modalities to synthesize another modal cross-modal audiovisual generation task [
44,
45,
46,
47]; and audiovisual retrieval tasks that use audio or images to search for counterparts in another modality [
48,
49].
A wide range of applications for audiovisual learning exist outside of the domains of computer vision and voice processing. It may be used, for instance, in fields like robotic learning, intelligent monitoring, computer–human interaction, and virtual reality. In order to learn and comprehend remotely sensed audiovisual situations more effectively, we used the complementary nature of visual and aural information in this research.
2.2. Remote Sensing Multi-Modal Fusion Strategy
Given that sight and hearing are two of the five senses through which humans perceive the world, methods in both domains have advanced, giving rise to the emerging field of multimodal analysis. With the increasing availability of geotagged data from various sources, modes, and perspectives, facilitated by public audio libraries (e.g., Freesound, radio aporee) and mapping software (e.g., Google Maps 11.102.0101, Google Street View 2.0.0.484371618), the collection of such data has become more straightforward.
In general, multi-modal fusion methods can be roughly divided into three categories: data-level, feature-level, and decision-level fusion [
50]. In the domain of remote sensing, data-level multimodal fusion has primarily been a focal point in early research endeavors. Data-level fusion methods typically involve the integration of raw or preprocessed data. Jakub Nalepa [
51] used machine learning and advanced data analytics for multispectral and hyperspectral image processing. Mangalraj et al. [
52] studied in detail the effectiveness of image fusion based on Multi-Resolution Analysis (MRA) and Multi-Geometric Analysis (MGA) and the impact of the corresponding fusion modes in retaining the required information. Another frequently employed approach is feature-level fusion, which involves the combination of intermediate features extracted from various modalities [
53,
54]. Lin et al. [
55], inspired by the success of deep learning in face verification, proposed the Where-CNN method, demonstrating the effectiveness of Where-CNN in finding matches between street views and bird’s-eye view images. Workman et al. [
56] combined overhead and ground images in an end-to-end trainable neural network that uses kernel regression and density estimation to convert features extracted from ground images into dense feature maps for estimating geospatial functions such as population density, land cover, or land use. Feature-level fusion methods tend to yield positive outcomes when the information supplied by different modalities in multimodal data demonstrates a substantial degree of correlation and consistency.
Decision-level fusion employs various fusion rules to aggregate predictions from multiple classifiers, each derived from a separate model. By using methods like weighted summation, voting, or probability-based approaches [
57,
58], decision fusion aims to enhance the reliability and consistency of classification results. Hu et al. [
59] developed a method that combines the physical characteristics of remote sensing data (i.e., spectral information) and the social attributes of open social data (e.g., socioeconomic functions), to quickly identify land use types in large areas and tested its effectiveness in Beijing. Liu et al. [
60] proposed a novel scene classification framework to identify major urban land use types at the traffic analysis area level by integrating probabilistic topic models and support vector machines. It plays a crucial role in improving and balancing different modalities, especially when the decision outcomes of these modalities differ significantly from one another or when there is little correlation between them [
61].
For the purpose of fully utilizing the benefits of multimodal data and enhancing the performance of remote sensing audiovisual scene classification, we used feature fusion and decision fusion to process the features and decision results of audiovisual data.
4. Experiments
In this section, we evaluate our audio module, visual module, and two-stage hybrid fusion strategy on a publicly available dataset for remote sensing audiovisual scene classification. We first introduce the dataset that will be used, as well as the experimental setup and evaluation metrics. Second, we compared these three modules to current methods and experimentally show their efficacy.
4.1. Dataset
The audiovisual dataset we used is the AuDio Visual Aerial sceNe reCognition datasEt (ADVANCE) [
66], a multimodal learning dataset, which aims to explore the contribution of both audio and conventional visual messages to scene recognition. This dataset in summary contains 5075 pairs of geotagged aerial images and sounds, classified into 13 scene classes, i.e., airport, sports land, beach, bridge, farmland, forest, grassland, harbor, lake, orchard, residential area, shrubland, and train station. Some examples in the dataset are shown in
Figure 6. The number of image–audio pairs in each scene is shown in
Table 1.
4.2. Experimental Setup and Evaluation Metrics
All experiments were implemented using Pytoch 1.12. The models were trained on an NVIDIA RTX 3080 (12 GB) GPU in a single machine. The details during training were as follows. In the audio module, we used the pretrained weights of a DeiT-base 384 [
67], which is trained with CNN knowledge distillation, with 384 × 384 images, and has 87M parameters. In the visual module, we used a ViT-B/16 [
64] (with 70 M parameters) as the backbone. We removed the original fully connected layers of the two Transformers. In addition, the pretrained parameters of ImageNet-21K were loaded on the DeiT-base 384 and ViT-B/16 (except the fully connected layer). When training TFAVCNet, we chose the Adam optimizer with a relatively small learning rate of
and a weight decay of
to optimize the parameters of TFAVCNet, as both backbones have been pre-trained from external knowledge. In the optimizer, we improved the stability of the model by taking a 10-epoch warm-up strategy. Considering the limited GPU memory resource, we set the batch size to 64 for the audio experiment and to 32 for the image.
Splitting strategy: The ADVANCE dataset was employed for the evaluation, where 70% image–sound pairs were for training, 10% for validation, and 20% for testing. All the test results are the mean results of 10 splits in order to reduce random influence.
Evaluation metrics: To quantitatively evaluate the performance of each module, we adopted the weighted average precision, recall, and F-score metrics with the standard deviation (±STD) for the evaluation. The distribution of the data can have an impact on accuracy in tasks with imbalanced classes, as the model may be biased towards prediction if the number of samples from one class is significantly higher than the number of samples from another class. Most categories receive high accuracy ratings, while minority categories receive an insufficient performance evaluation. Metrics like the precision, recall, and F-score may be more useful in this situation because they give more in-depth information to analyze the model’s performance across various categories:
The accuracy of model predictions is determined by the precision. It shows how many of the samples that the model predicted to be positive are actually positive.
Another crucial evaluation metric is the recall, which is used to determine how well the model is able to identify all real positive examples. A high recall means that the model can capture positive examples more accurately.
The F-score combines the precision and recall to provide an indicator for comprehensively evaluating model performance. The F-score is the weighted average of the precision and recall, where the weight factor can be adjusted according to the task requirements. The most-common F-score is the F1-score, which gives equal weight to the precision and recall.
4.3. Audio Experiments
Here, we compare the results of four schemes, ADVANCE [
66], SoundingEarth [
68], attention + CNN, and AiT, to demonstrate the effectiveness of the schemes based only on Transformer. Among them, the acoustic characteristics of the four schemes are common (use the log-Mel spectrogram). The audio path of the ADVANCE solution uses the AudioSet pre-trained ResNet-50 to model the sound content. The second solution uses batch triplet loss, which has the advantage of combining classical triplet loss training with recent contrastive learning methods. The third scheme consists of a single layer of self-attention and four layers of convolution. The fourth option is the audio Transformer introduced in
Section 3.2.
In order to prevent purely memorizing the input data and introducing more diversity into the training samples, we used frequency mask and time mask data augmentation [
69] for the audio spectrogram, so that the AiT model can learn more-robust feature representations, thereby improving the generalization performance on the validation dataset. Specifically, before extracting the spectrogram features, we applied the FrequencyMasking (freqm) and TimeMasking (timem) transformations. The parameters, freqm and timem, represent the respective widths of the continuous frequency interval and time window to be masked. In addition, we also normalized the feature dimension of the spectrogram, so that the dataset was normalized to 0 mean and standard deviation.
Table 2 shows the results of different audio system approaches. We can observe that the method using the attention + CNN architecture is superior to the baseline (ADVANCE) scheme based on the CNN architecture on all three indicators. Specifically, the results of the attention + CNN architecture (33.56% ± 0.24 on the F1-score) are 4.57% higher than the ADVANCE method (28.99% ± 0.51 on the F1-score) using only CNN, but it has no advantage or is even worse than the SoundingEarth scheme. According to the preliminary analysis, the attention + CNN structure does not receive any additional dataset pre-training, whereas the SoundingEarth model is pre-trained on a large audiovisual dataset. From the AiT scheme, we can observe that, in the case of using a pre-trained model, only the Transformer-based method (41.9% ± 0.11 on the F1-score) is 2.89% higher than the ADVANCE and SoundingEarth methods (39.01% ± 0.17 on the F1-score), which also use the transfer learning method.
The confusion matrix for our the audio classification model AiT is shown in
Figure 7. When only audio samples were used in the training, the ability to classify audio scenes was poor. Although forest and residential scenes with a large number of samples had better classification results, this also led to natural scenes (such as shrubland, orchard, and grassland) and scenes of human life (such as farmland and sports land) having poor classification results. As a consequence, there were some limitations when classifying scenes solely based on land ambient audio.
4.4. Image Experiments
This experiment did not establish a new image scene classification model. We chose to use the ViT-B/16 classification model, which is effective in the field of image classification, with an appropriate number of model parameters. Here, we compare the results of the ADVANCE scheme, the SoundingEarth scheme, and the Vision Transformer architecture. In addition, the pretrained parameters of ImageNet-21K were loaded onto the ViT-B/16 (except the fully connected layer). During fine-tuning, we normalized all images and used random repositioning cropping, random horizontal flipping, random adjustment of image brightness and contrast, and other data-enhancement techniques.
The visual pathway in the ADVANCE solution employs a pre-trained ResNet-101 from AID. Likewise, the second solution utilizes a ResNet architecture, but with a distinction: it employs pre-trained ResNet-18 and ResNet-50 models using the SoundingEarth dataset. In the third approach, we opted for the ViT-B/16 for comparative purposes.
Table 3, shows the results of different image system methods. We can observe that the method of the SoundingEarth scheme architecture (86.92% ± 0.16 on the F1-score) performed 14.07% higher than the baseline (ADVANCE) scheme (72.85% ± 0.57 on the F1-score). One of the most-straightforward explanations is that, despite their models being pre-trained on large-scale aerial image datasets, the dataset scale varies. The SoundingEarth scheme employs a dataset that is five-times larger than that of ADVANCE (AID comprises over 10,000 aerial scene images, while SoundingEarth boasts more than 50,000 overhead imagery samples). The Vision Transformer introduces a self-attention mechanism, which can effectively capture different positions in the image dependencies between and model global information. Although it was not pre-trained on a large-scale aerial scene images dataset, it still showed its efficient scene classification performance (87.61% ± 0.41 on the F1-score).
The confusion matrix for our image classification model is shown in
Figure 8. Scene classification using images is better than scene classification using audio. The figure shows that, first, there were much fewer test samples that were incorrectly classified, and in some scenes (like beach, forest, harbor, residential, and train station), there were very few misclassified samples. Second, the scenes farmland, orchard, and shrubland were where the misclassified test samples were most-frequently found. In the scene, eight samples of farmland were incorrectly classified as grassland, nine samples of orchard were incorrectly classified as forest, and eight samples of shrubland were incorrectly classified as forest. Eight samples from sports land were incorrectly classified as residential for the same issue, and six samples from lake were incorrectly classified as harbor.
4.5. Audiovisual Experiments
Here, we compare the results of ADVANCE [
66], SoundingEarth [
68], and our two-stage hybrid fusion strategy and show the quantitative results of different fusion strategies on three metrics (precision, recall, F1-score). The ADVANCE scheme transfers sound event knowledge to aerial scene recognition tasks to improve scene recognition performance. The SoundingEarth solution learns semantic representation between the audio and image modalities through self-supervised learning. Next, in our two-stage hybrid fusion schemes, we selected the
and
functions to determine
and
for feature fusion and decision fusion.
From
Table 4, the following observations can be made. First, audiovisual experiments can achieve better results than those based only on audio or visual information, suggesting that fusing information from the audio and visual modalities can improve single-mode classification. Secondly, for the comparison of the fusion methods, our two-stage fusion strategy further improved the effect compared with the ADVANCE method and SoundingEarth method, which only use feature fusion.
The confusion matrix of our two-stage hybrid fusion strategy’s classification results is shown in
Figure 9. For the majority of categories, we can see that the result of classification tended to be good. In certain scenes (forest, harbor, residential), it worked flawlessly. Grassland and orchard were the scenes with the worst classification. In the test set for grassland, six samples were classified as forest, six as shrubland, and three as farmland; in the test set for orchard, eight samples were classified as forests and three were classified as farmland. The dataset’s obvious long tail distribution and the insufficient sample size for the grassland and orchard scenes prevented the model from learning more-useful distinguishing features, according to preliminary analysis. The fact that the scene’s audio events were too similar could also be a factor. In the grassland, forest, and shrubland scenes, we discovered that there were numerous similar sound events, such as birdsong, water, etc., through manual inspection. The vast amounts of green vegetation in both scenes, which are indistinguishable to humans, further resembled one another, creating a visual similarity between the two.
4.6. Log-Mel Spectrogram
Different acoustic features will have different effects on the accuracy of scene classification. Here, we chose the log-Mel spectrogram, which is widely used in the field of speech and sound processing.
The log-Mel spectrogram provides more-detailed spectrum information than the traditional spectrogram. It is divided into frames on the time axis, and each frame represents the energy distribution of different frequencies over a period of time. The purpose of logarithmic transformations, usually applied to Mel spectrograms, is to enhance details in low-energy regions such that the features are more evenly distributed on a logarithmic scale. The calculation process of the log-Mel spectrogram is shown in Formula (
5).
where
f is the frequency expressed in Hertz and
is the corresponding Mel frequency.
In addition, we performed some experimental analysis on two important parameters in the calculation of the spectrogram: hop length and number of Mel filters, to determine the optimal hyperparameters. The results are shown in
Table 5.
Hop length is measured on samples here, and 441 samples corresponded to 10 ms at a sampling rate of 44,100. In this experiment, we can see that a hop length of 400 samples (about 10 ms) had a higher average accuracy overall. Hop length is important, because it directly affects how “wide” the image is, so while a hop length of 5 ms might have a slightly higher accuracy than 10 ms, the images will be twice as large and, therefore, take up twice as much GPU memory.
If hop length determines the width of the spectrogram, then the height is determined by the number of Mel filters. After first producing a regular STFT using an FFT size of, say, 2048, the result is a spectrum with 1025 FFT bins, varying over time. When we convert to a Mel spectrogram, those bins are logarithmically compressed down to n_mels bands. This experiment showed that 32 is definitely too few, but other than that, it did not affect the accuracy too much. A value of 128, which is the default with the baseline, gave the highest mean accuracy.
Figure 10 shows the log-Mel spectrogram for the two audio scene classes we created using the librosa library, with hop_length set to 400 and the number of Mel filters set to 128. The plotted log-Mel spectrogram shows the characteristics of the audio signal in time and frequency. Some information can be observed from the spectrogram:
Time information: Each time step on the x-axis corresponds to an audio frame, which is the time axis of the audio signal. The audio’s temporal development is visible.
Frequency information: The frequency band of the Mel filter is shown on the y-axis, which is typically scaled in the Mel frequency. The Mel frequency is a frequency scale that is connected to human auditory perception and more closely resembles the features of the auditory system in humans.
Energy information: Each time frame’s logarithmic energy for each Mel frequency band is represented by a different color. The relative strength of various frequency components in the audio signal can be represented using this.
For example, contrast the spectrograms of the 07497_4.wav airport scene and the 00095.wav beach scene. Intermittent high-frequency, high-intensity sounds can be seen in the high-frequency portion of the airport scene spectrogram (the darkest part at the top); medium-to-high-intensity sounds can be seen in the middle portion (the dark, large area in the middle of the spectrogram); there is obviously medium–low intensity sound in the middle and rear portions of the low-frequency portion (the orange–white part at the bottom). By manually listening to the 07497_4.wav file, we can clearly hear the airport broadcast beginning at the third second in the scene (corresponding to the orange part starting at the third second in the spectrogram), as well as the noisy human conversation in the scene (corresponding to the darker, high-intensity portion of the spectrogram). An obvious low-intensity (large areas of orange–yellow) sound in the middle and low frequencies (low-intensity sounds are mainly shown in the middle and lower parts of the spectrogram) can be seen in the spectrogram of the beach scene. By manually listening to the 00095.wav file, we can identify the long-lasting, low-intensity ocean waves that are audible in this scene. Additionally, the spectrogram makes it easy to see the audio noise (possibly wind sound) and the brief burst of bird calls in the first few seconds.
Different areas in the spectrogram are represented by the frequency components, energy distribution, time-domain characteristics, background noise, and other information of the various sounds in the environment. It is crucial for subsequent models to achieve good classification performance to choose an appropriate audio feature extraction technique by choosing better hyperparameters.
4.7. Fusion Strategy Experiments
This section chooses various
and
functions to find the best function settings for feature fusion and decision fusion. On the three metrics (precision, recall, and F1-score), as shown in
Table 6, we used the average, max, and sum functions to show the quantitative results of various fusion strategies.
The following observations can be made. First of all, the baseline (ADVANCE scheme) uses feature splicing in the feature-level fusion method to combine audio features and image features. This straightforward fusion approach is not superior to the single-mode image method. When using a two-stage hybrid fusion strategy, the fusion’s performance will increase and its constituent features will become more abstract. Second, in feature-level fusion and decision-level fusion, the performance of the and functions for the selection of the and functions was nearly identical, and both were superior to the function. The most-ideal strategy is when the function setting was used. Last but not least, the proposed strategy was actually a result of feature enhancement performed in two steps. The weights of the audio and the image that determine the results of classification were not equal under the two stages’ weighting; instead, the more-significant party was given a greater weight.
5. Conclusions
Traditional remote sensing scene classification tasks have been broadened by ground environment audio and remote sensing aerial images. In this study, we presented TFAVCNet, a two-stage fused-based multimodal audiovisual classification network for tasks involving scene classification in audiovisual remote sensing. TFAVCNet is made up of an audio module, a vision module, and a fusion module, which effectively combine the acoustic and visual modalities, and achieves state-of-the-art performance. In addition, in order to extract valuable ground environment audio information, we designed a Transformer-based Audio Transformer (AiT) network, which is different from the previous CNN or a CNN combined with a self-attention network. Additionally, in the fusion module, we designed an adaptive distributed weighted fusion module to obtain fusion embedding. Especially in the decision fusion module, we retained the single-mode decision results for both images and audio and weighted them with the feature fusion results.
There is still much research to be performed in the area of remote sensing scene classification based on audiovisual fusion. Firstly, the availability of publicly accessible audiovisual multimodal datasets for remote sensing tasks is limited, and there is an urgent requirement for extensive remote sensing audiovisual multimodal datasets to support relevant research initiatives. Moreover, it is essential to explore methods for effectively modeling single-mode information when integrating visual and auditory data. There is a need to investigate how to extract more-valuable supervisory information from the coarse-level congruence of the visual and auditory modalities when they are combined. Finally, more-effective fusion methods should be designed to build the correlation between them. Because information is different, some have more information, some have less information, and the synchronicity between them is different.


