
Effect of Curing Time and Nitrogen Generator Usage on Direct 3D-Printed Aligners Thicknesses—An In Vitro Micro-CT Study

 , , , ,
Abstract
:1. Introduction
2. Materials and Methods
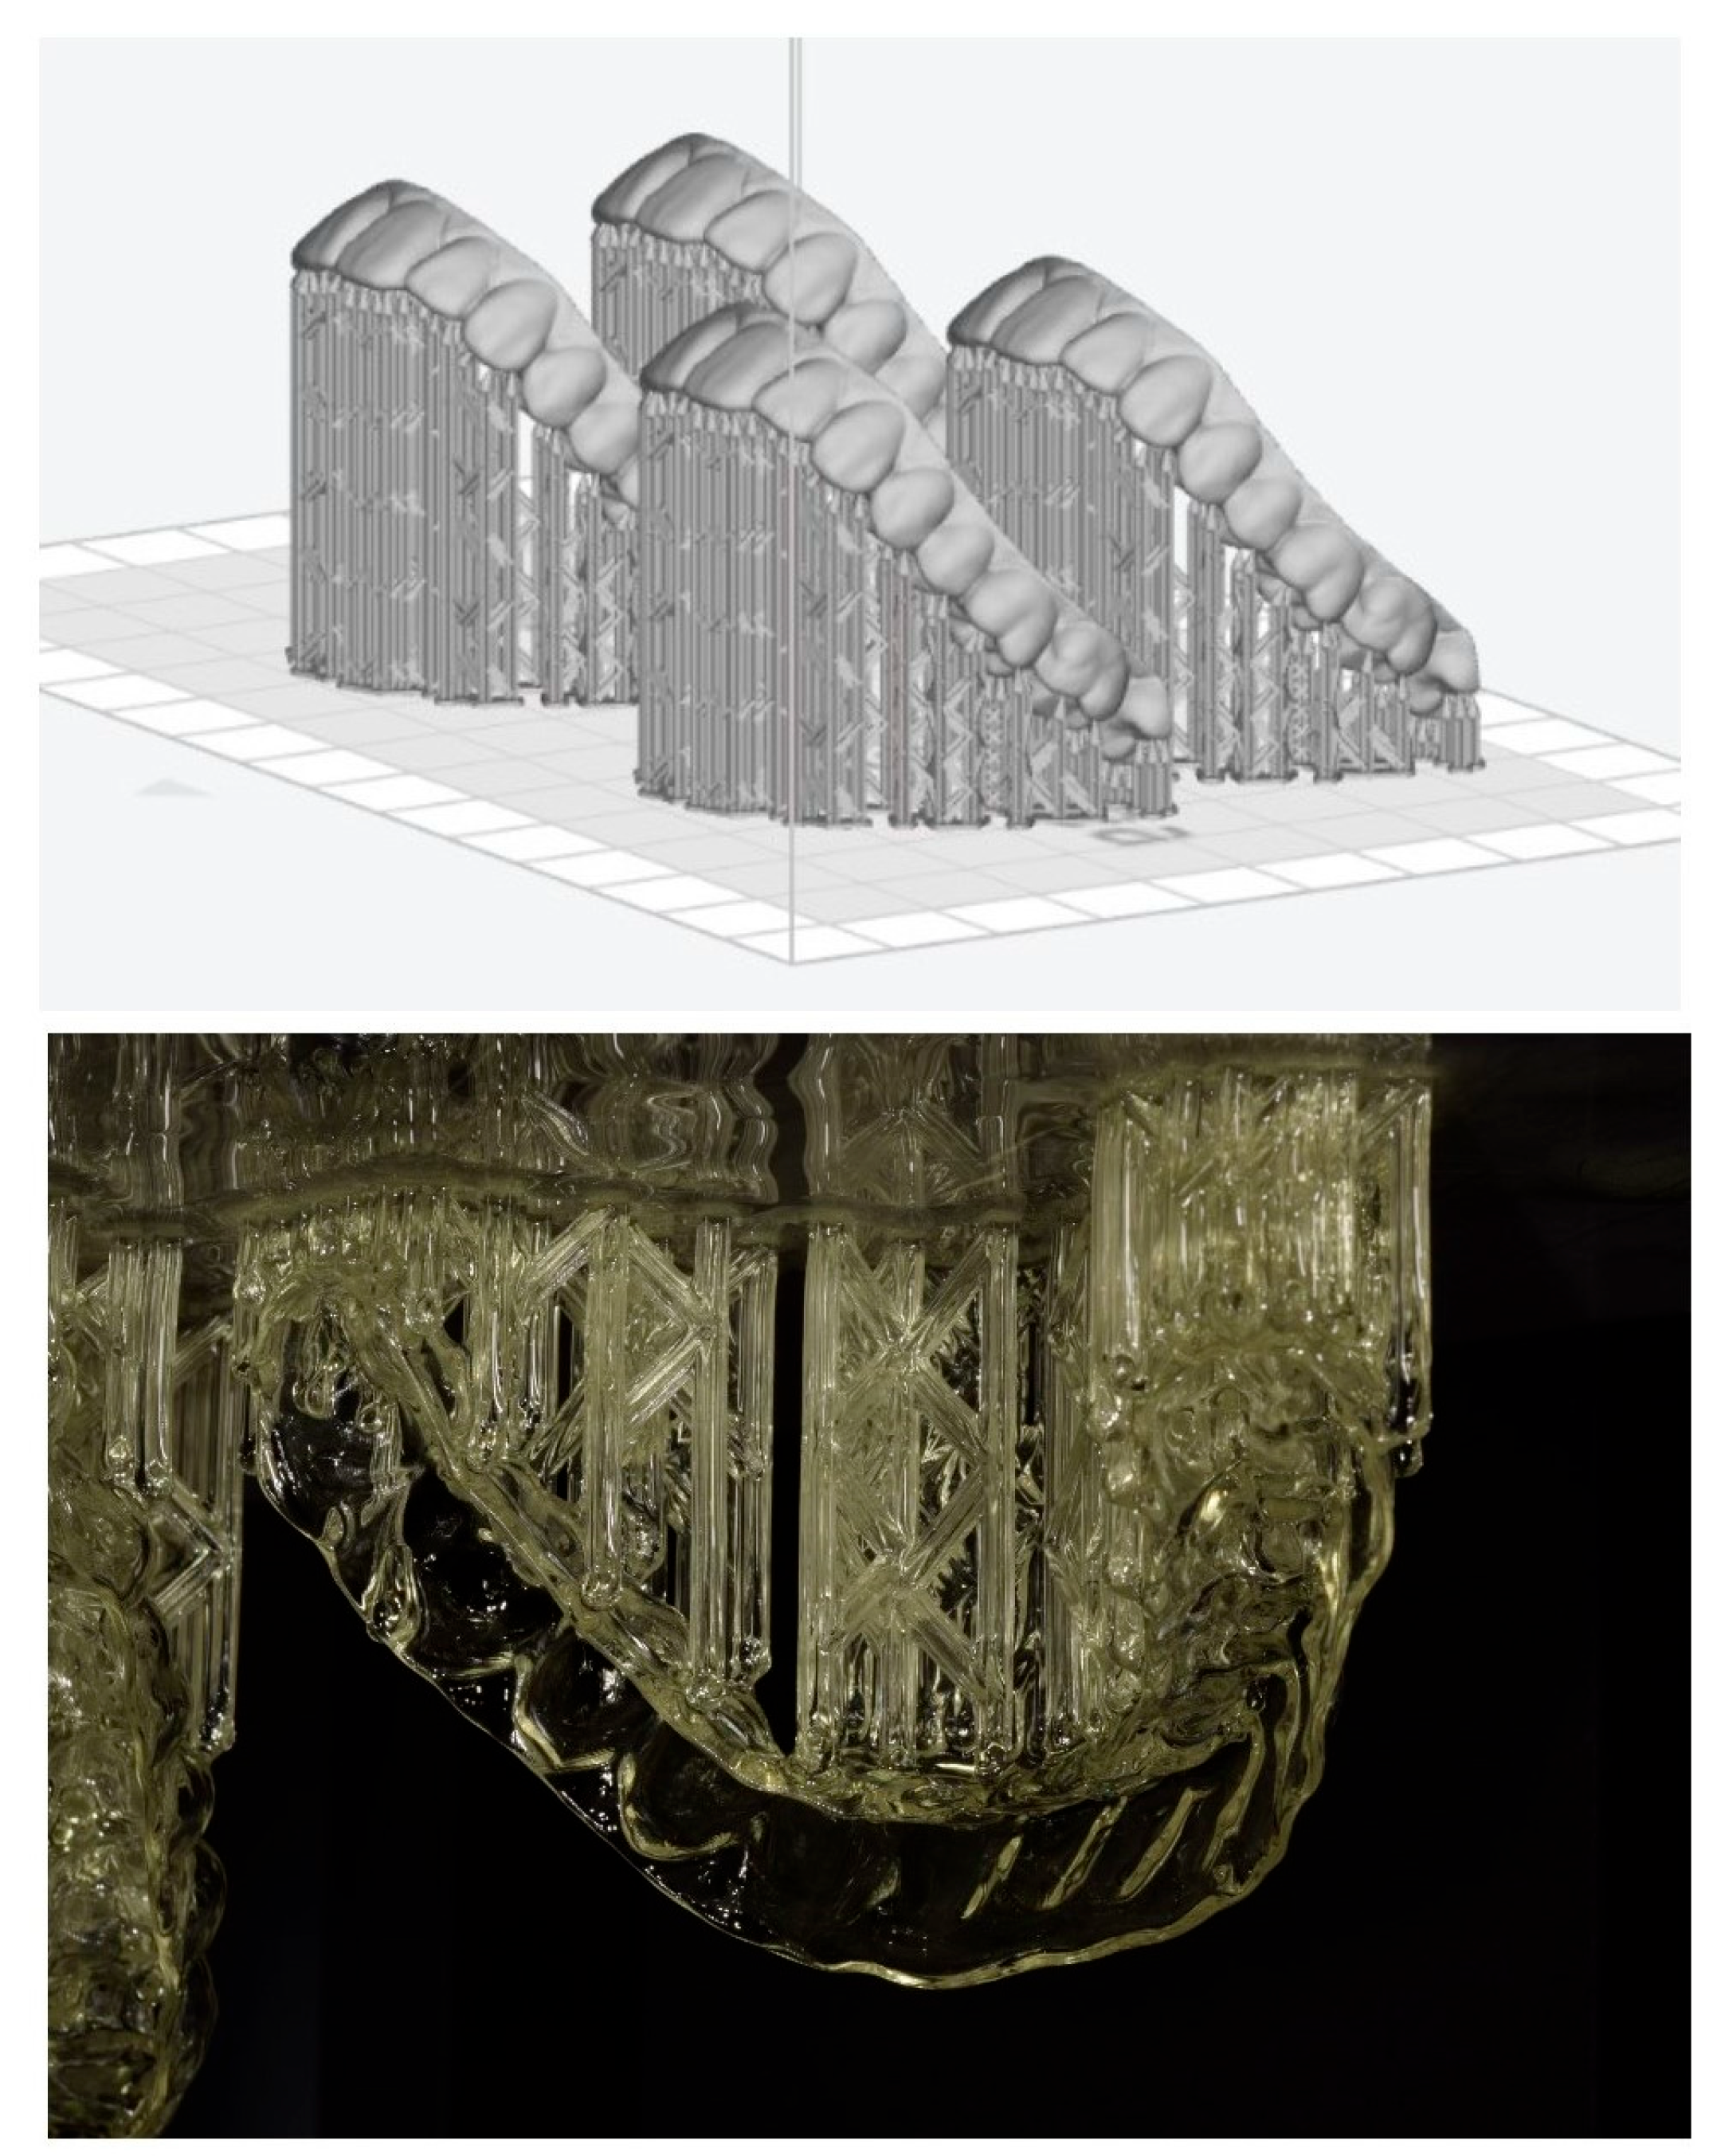
2.1. Virtual Setup
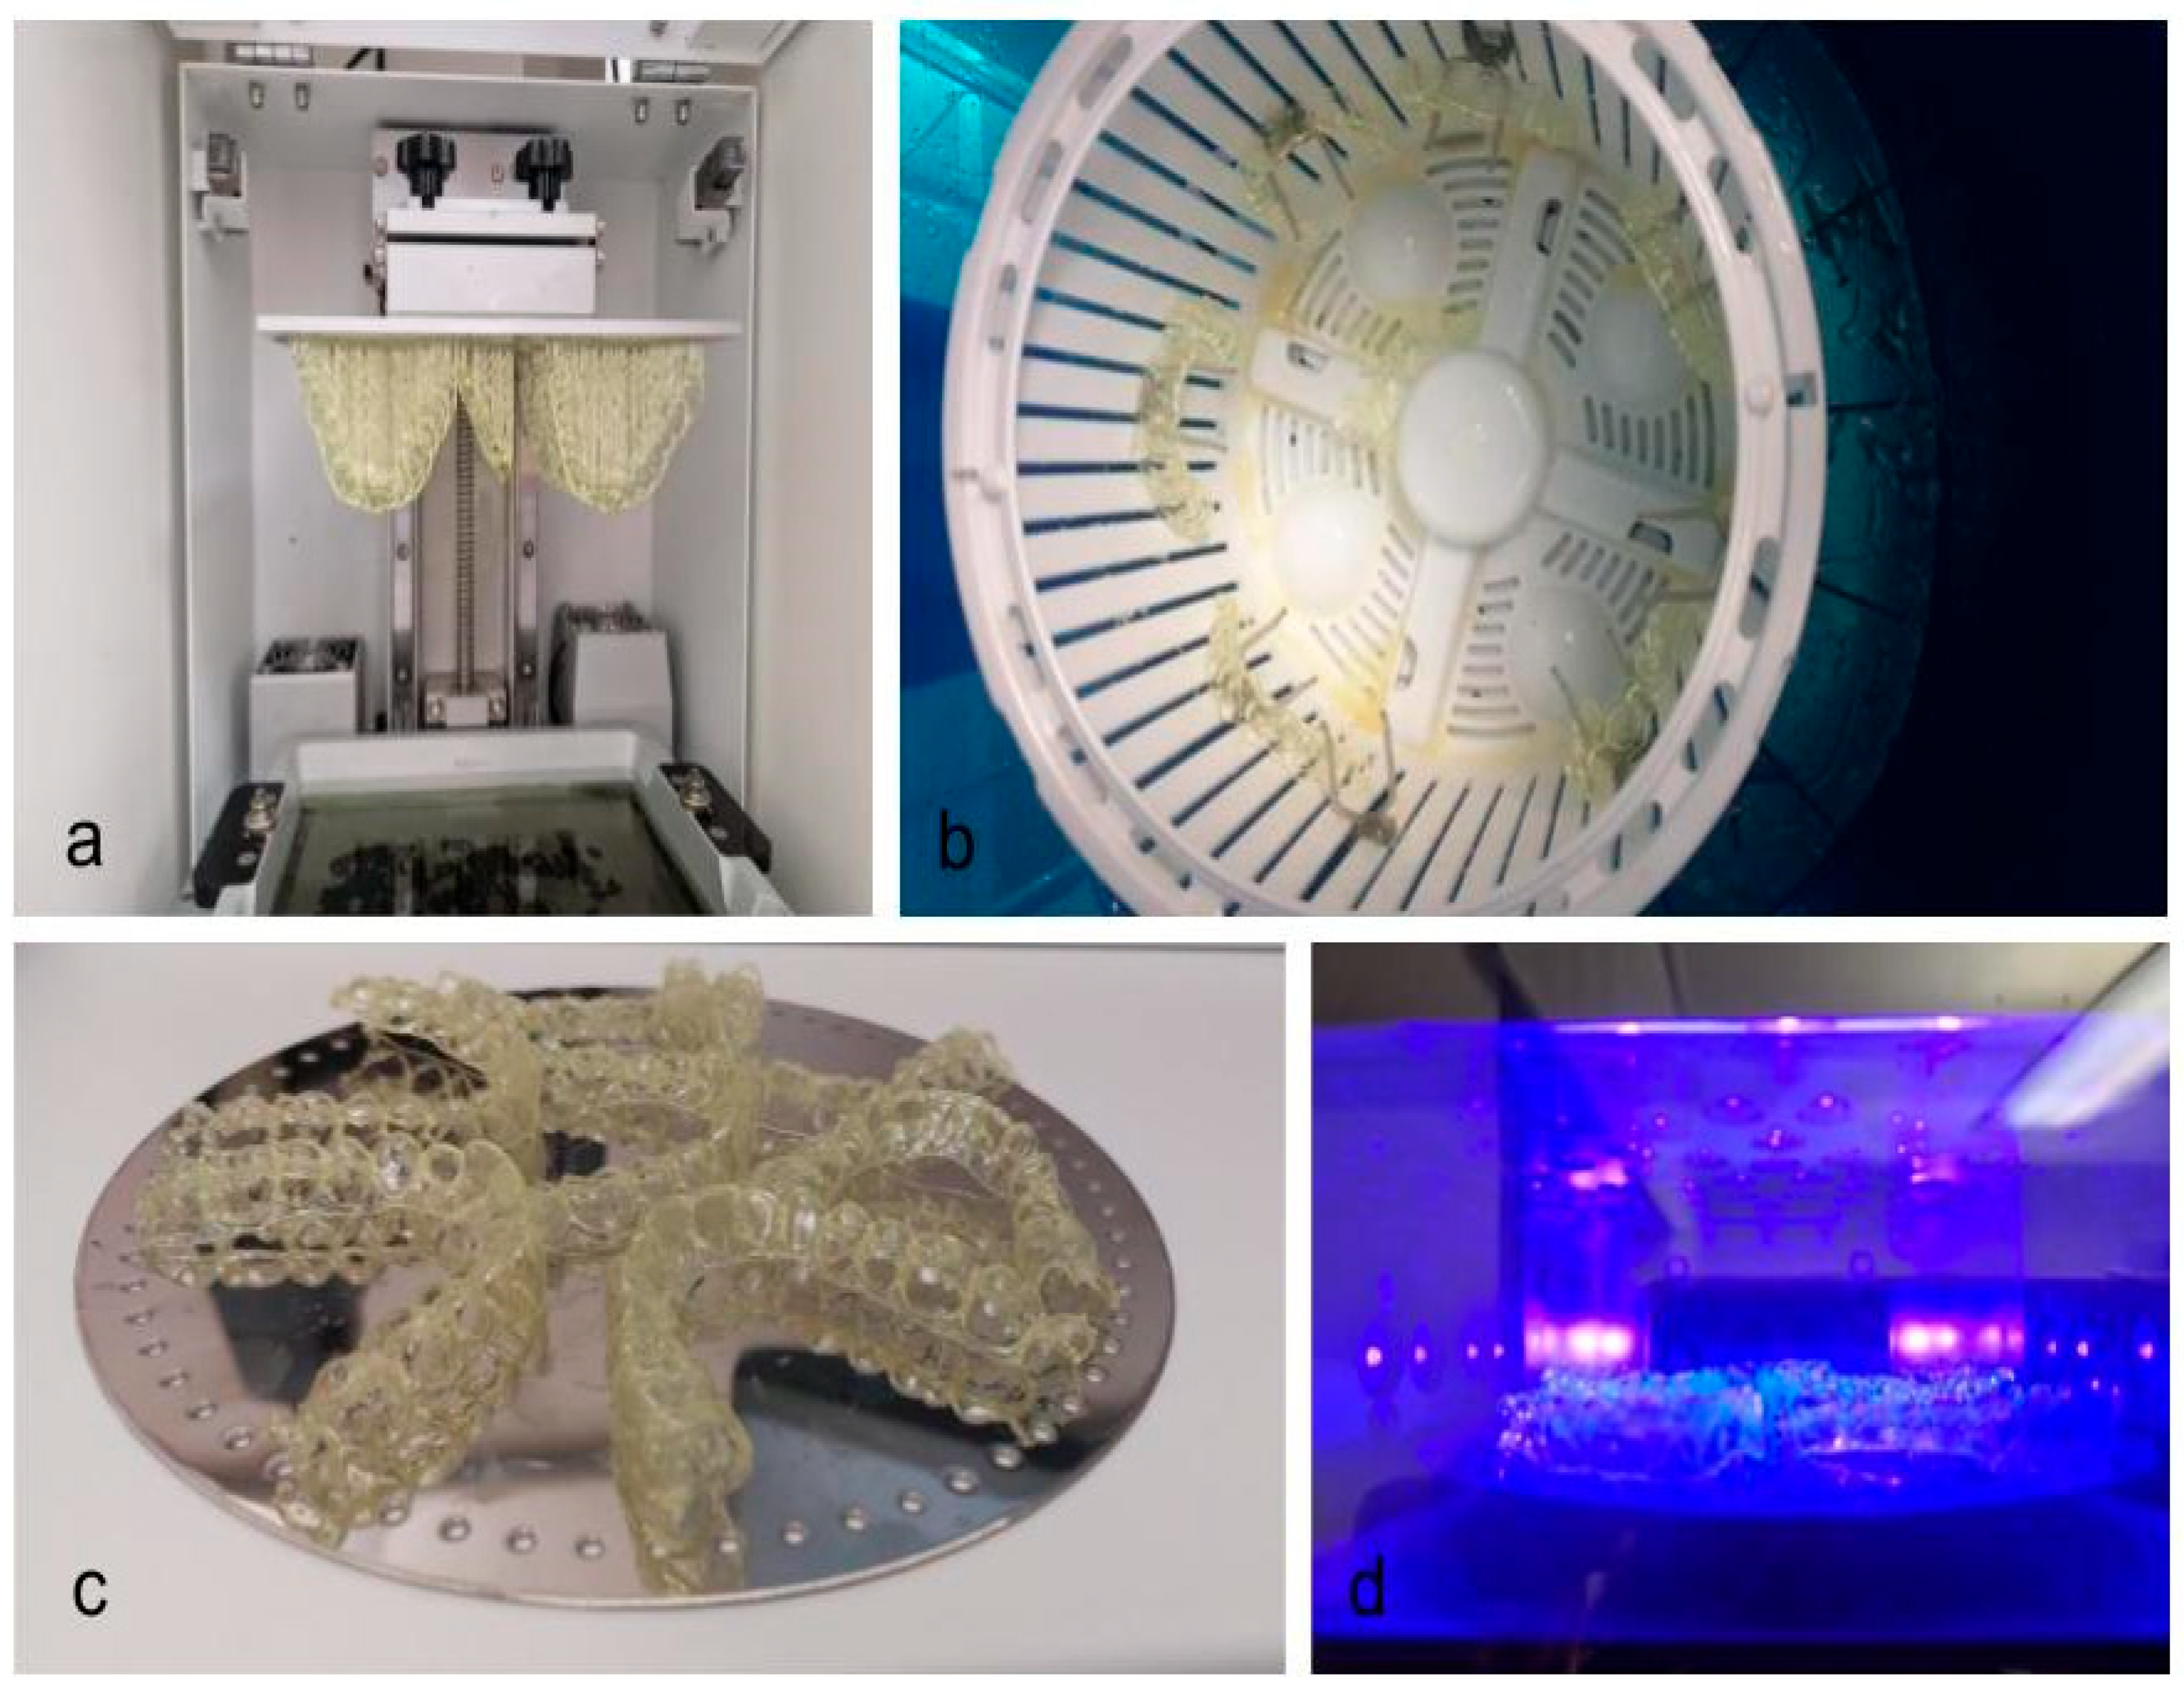
2.2. Aligner Production
2.3. Micro-Computed Tomography and Image Processing
2.4. Thickness Measurements
2.5. Statistical Analysis
3. Results
3.1. Impact of Curing Time
3.2. Impact of Nitrogen Generator
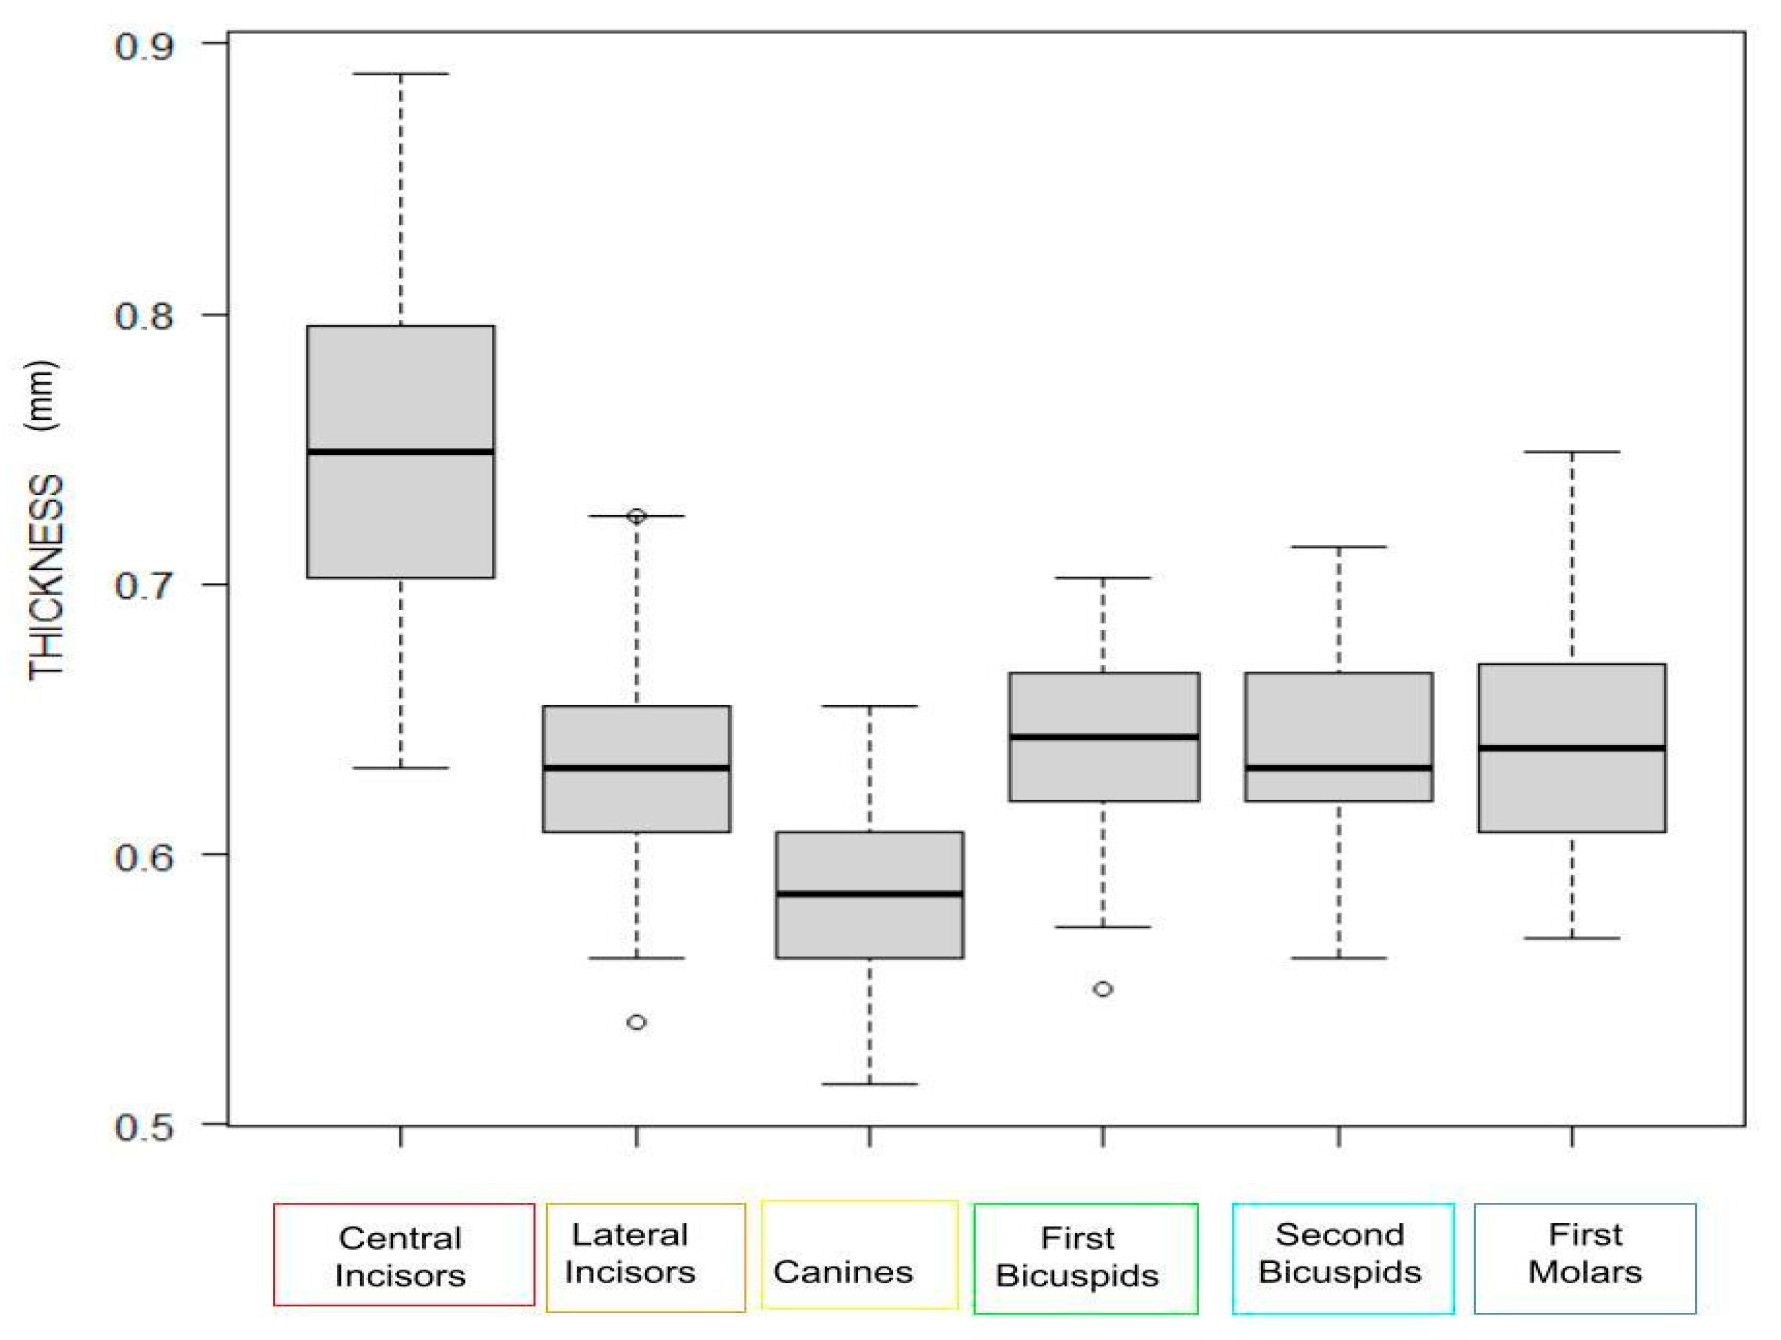
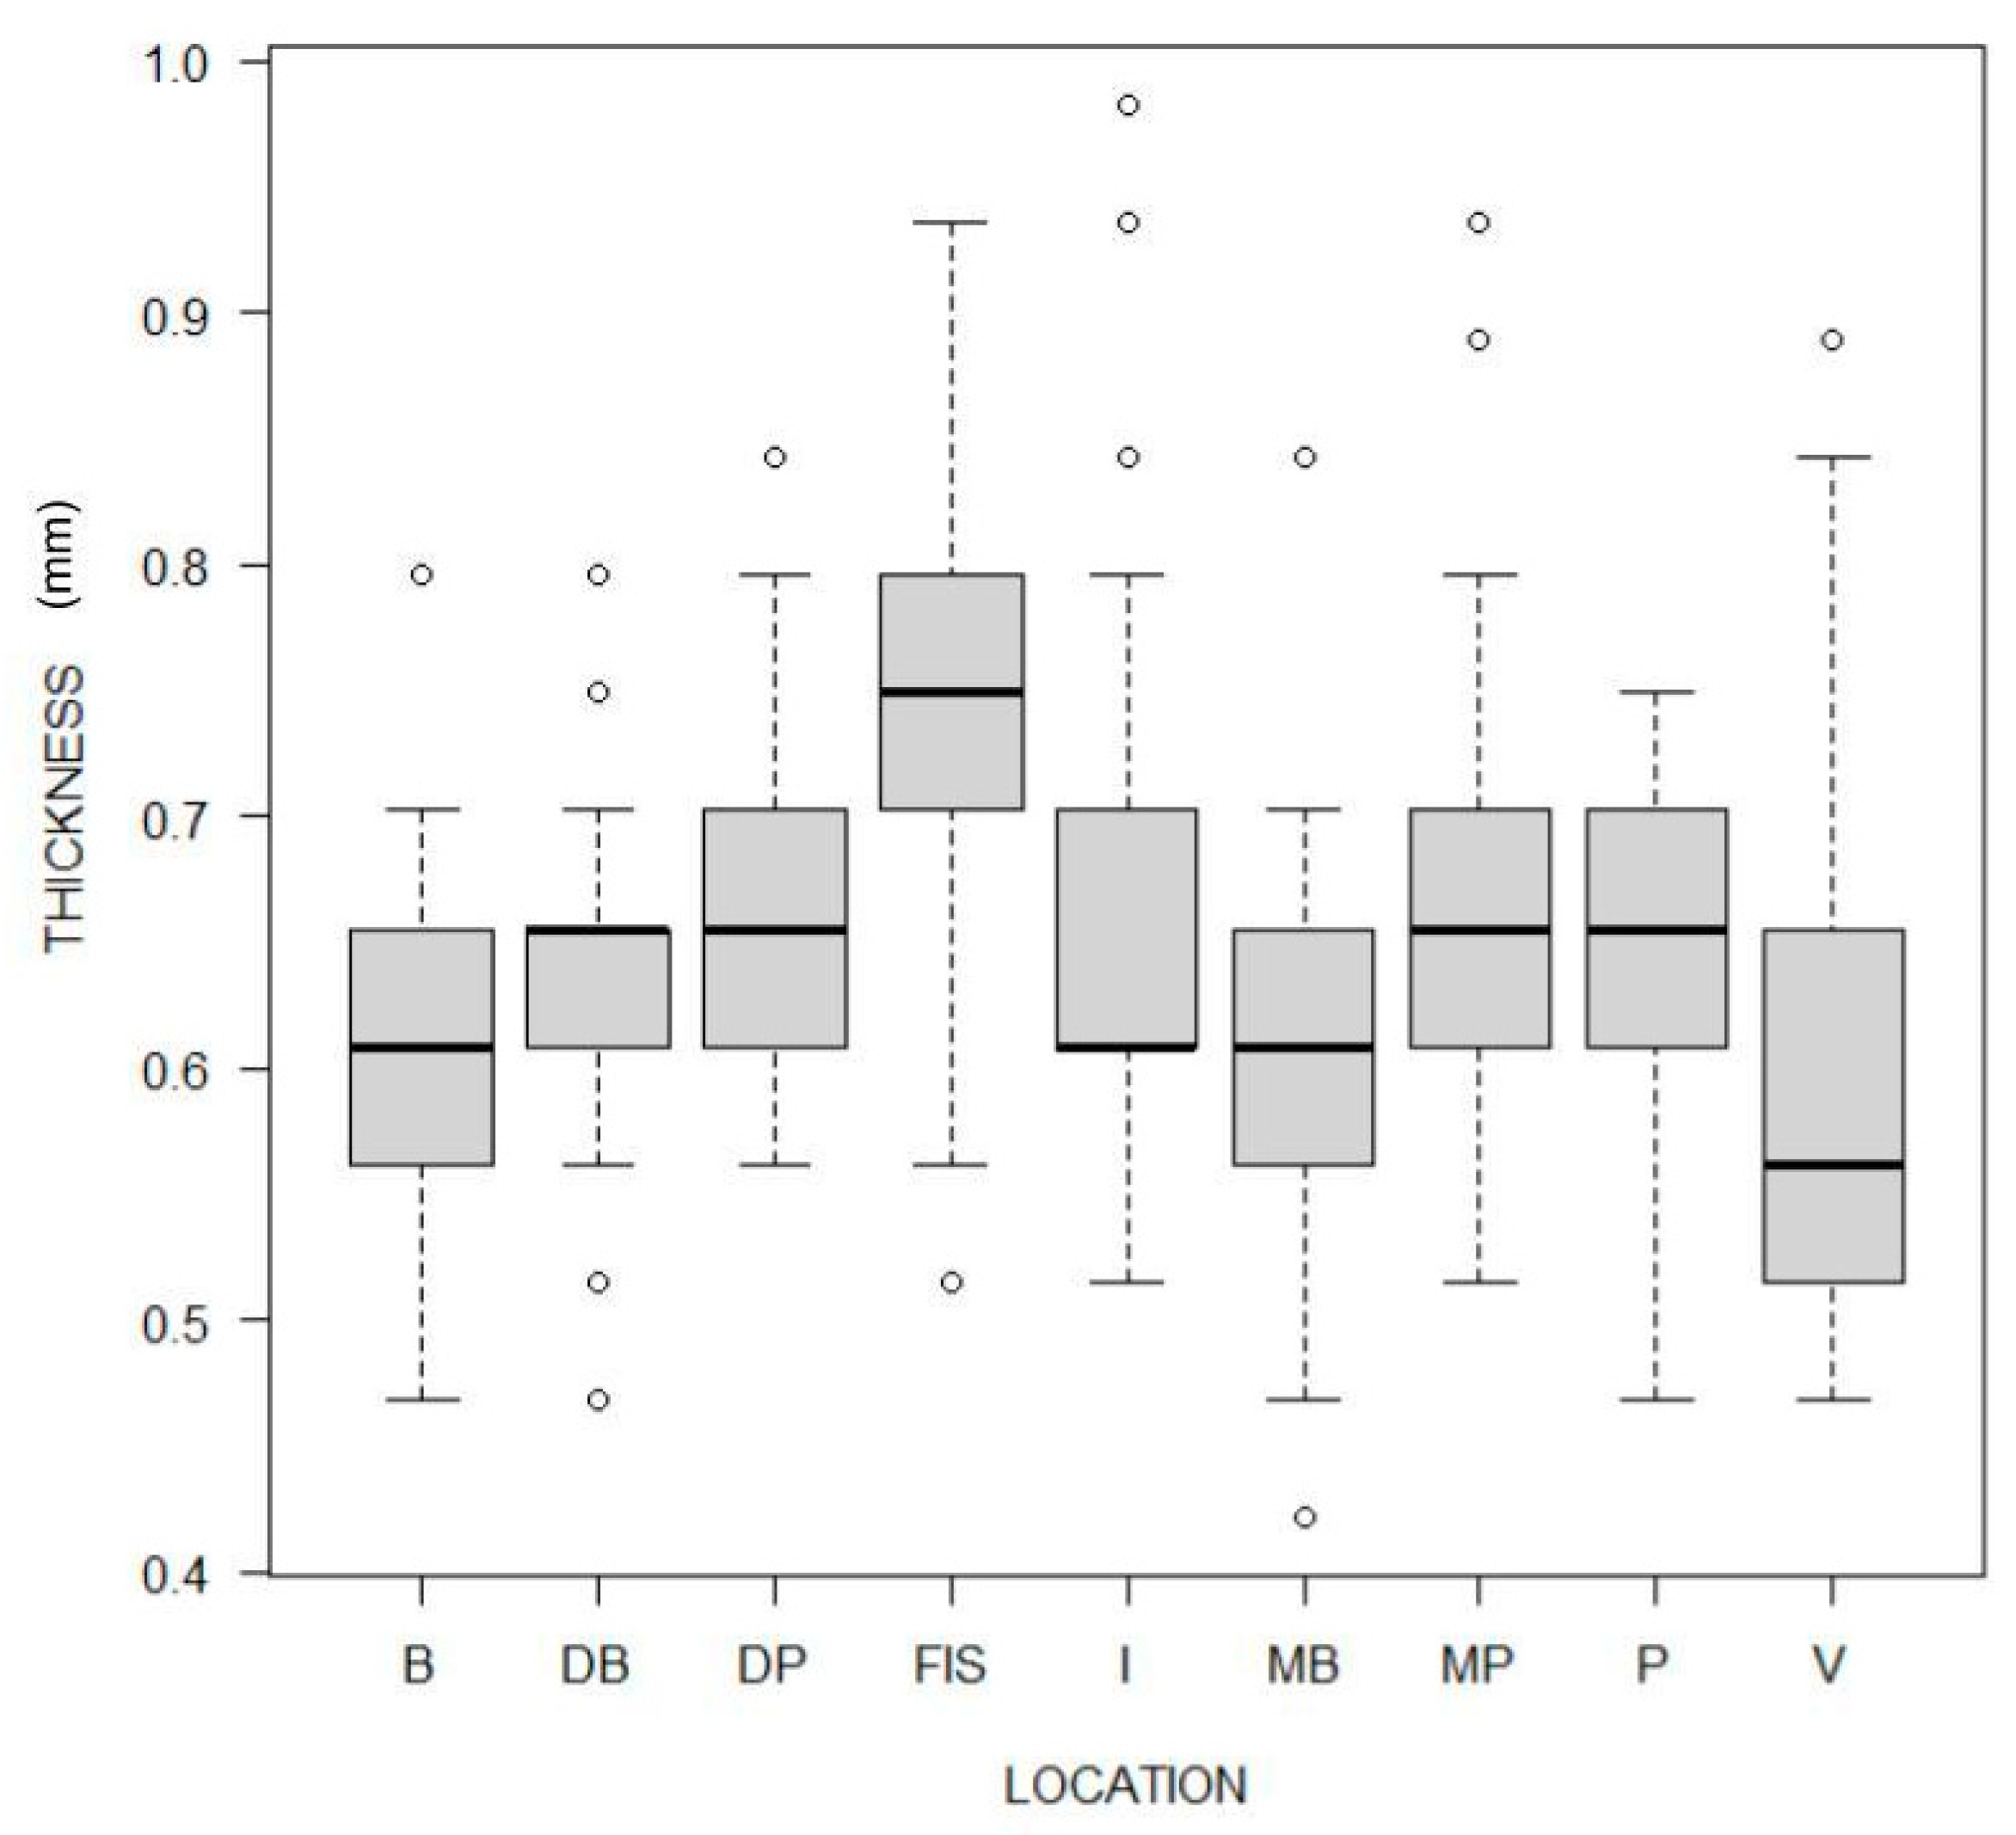
3.3. Impact of Tooth Type and Site
3.4. Heterogeneity
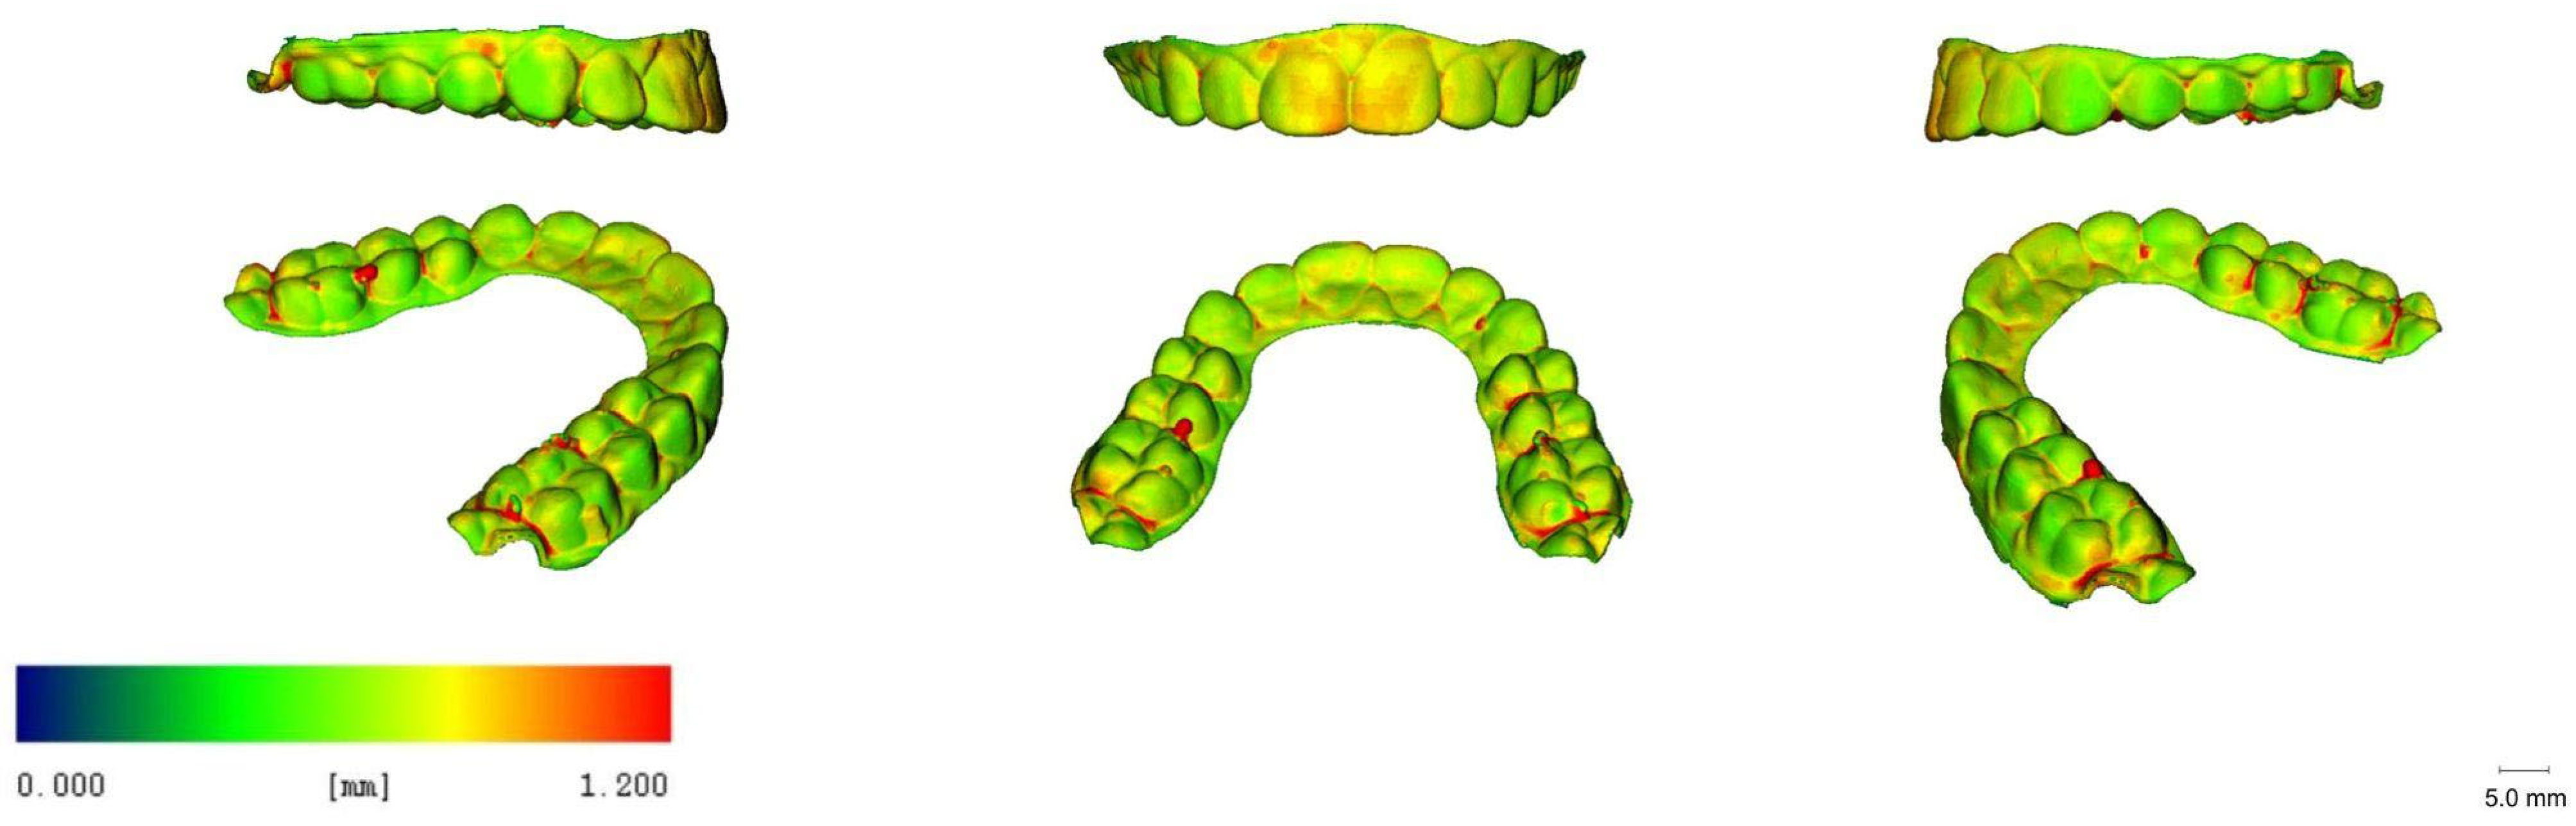
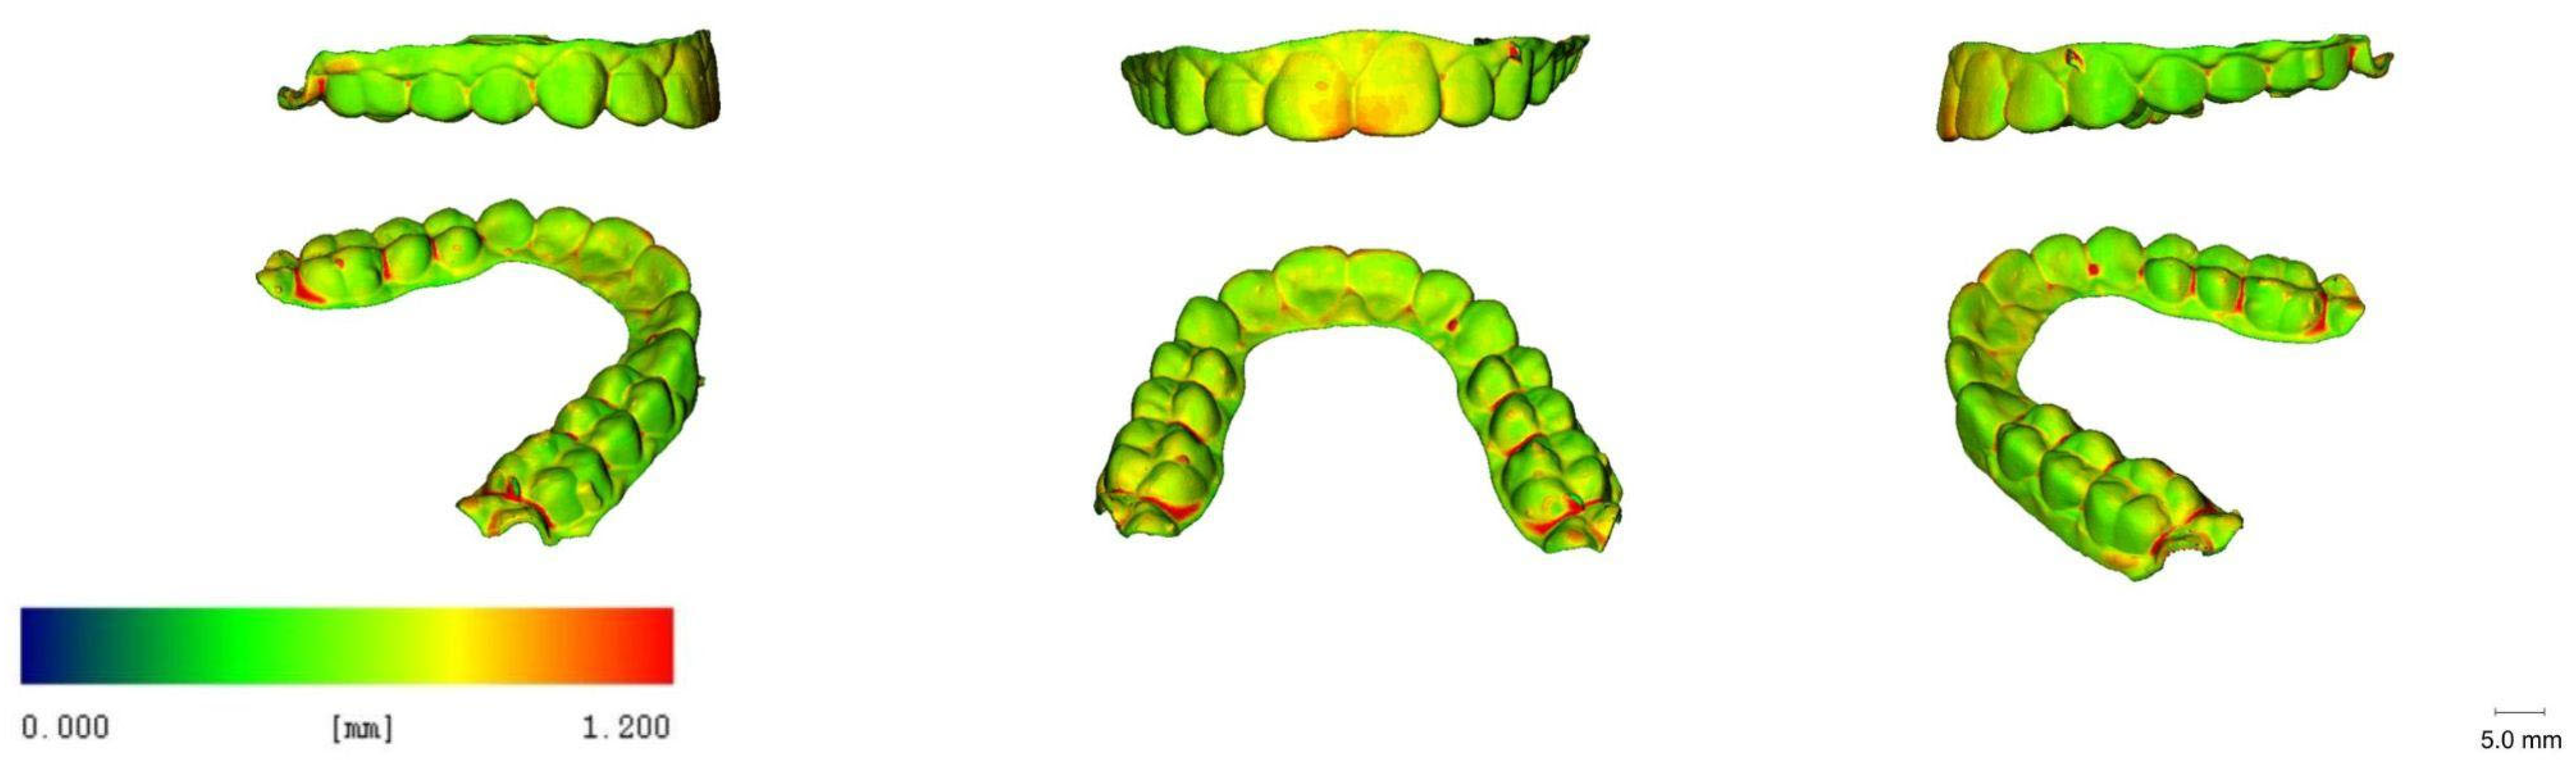
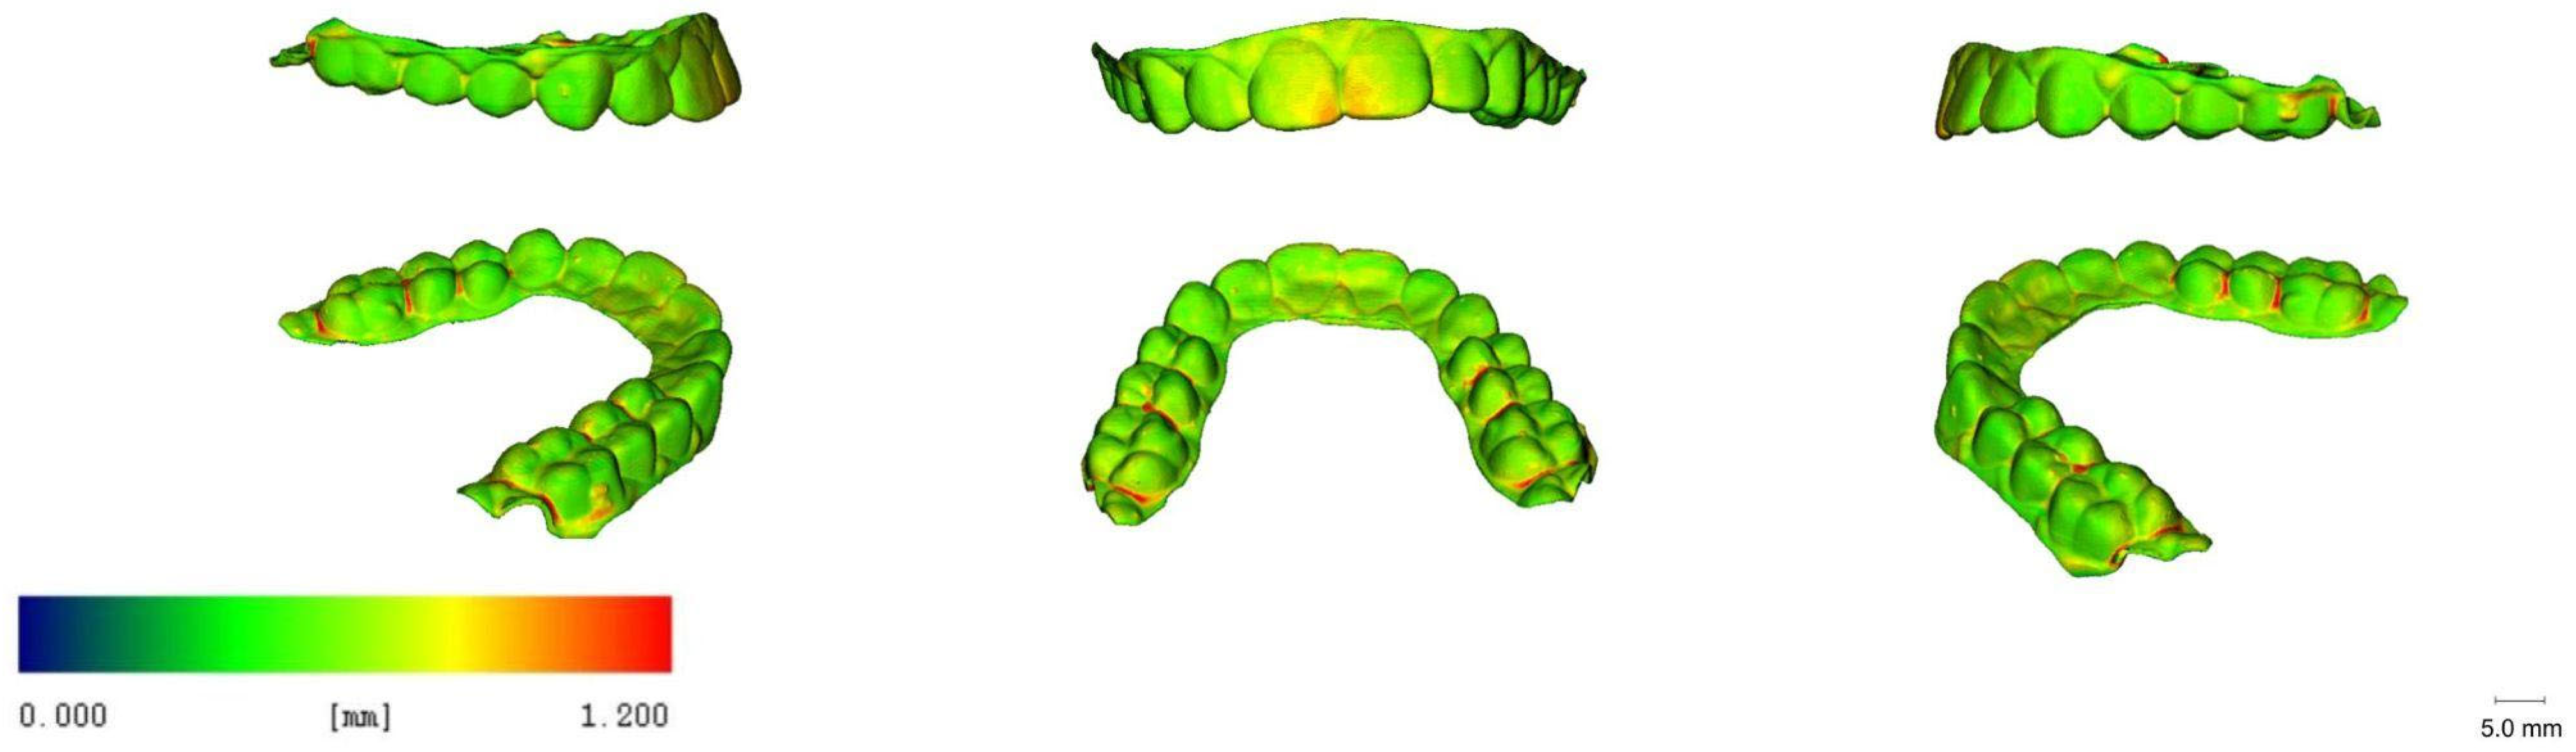
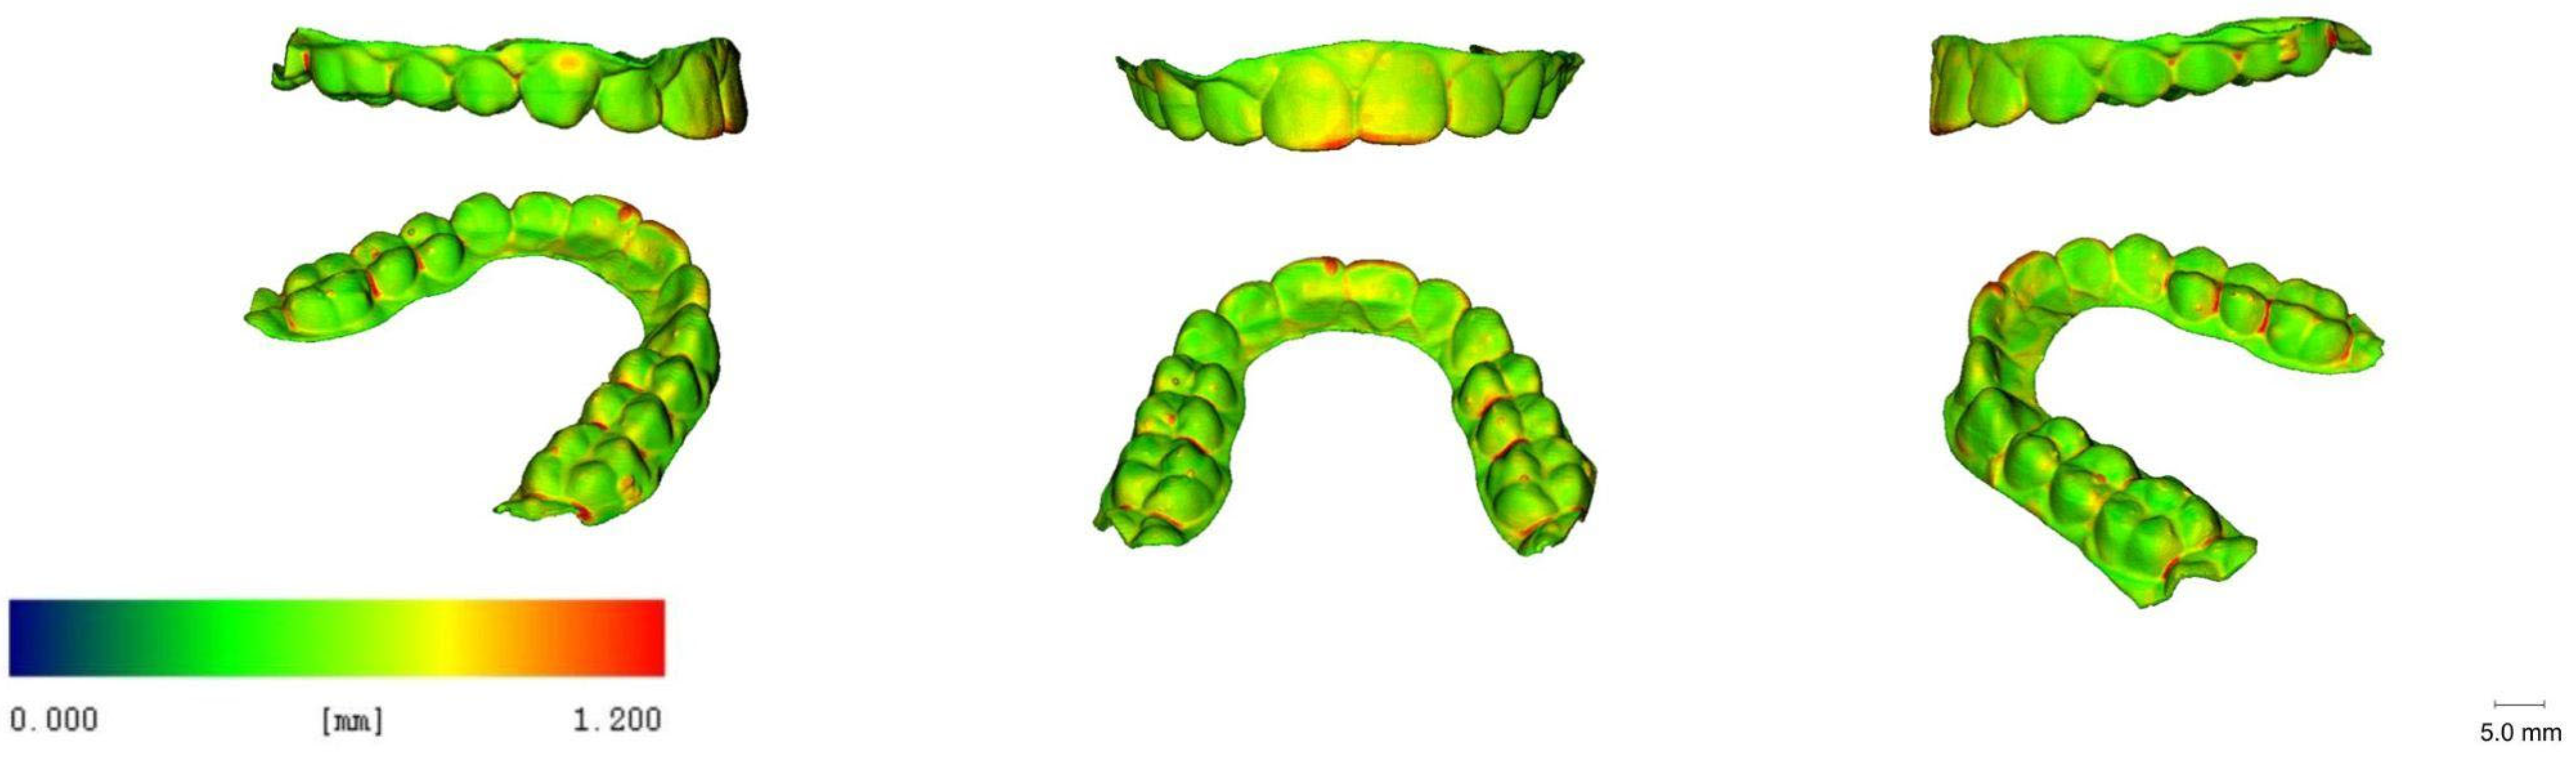
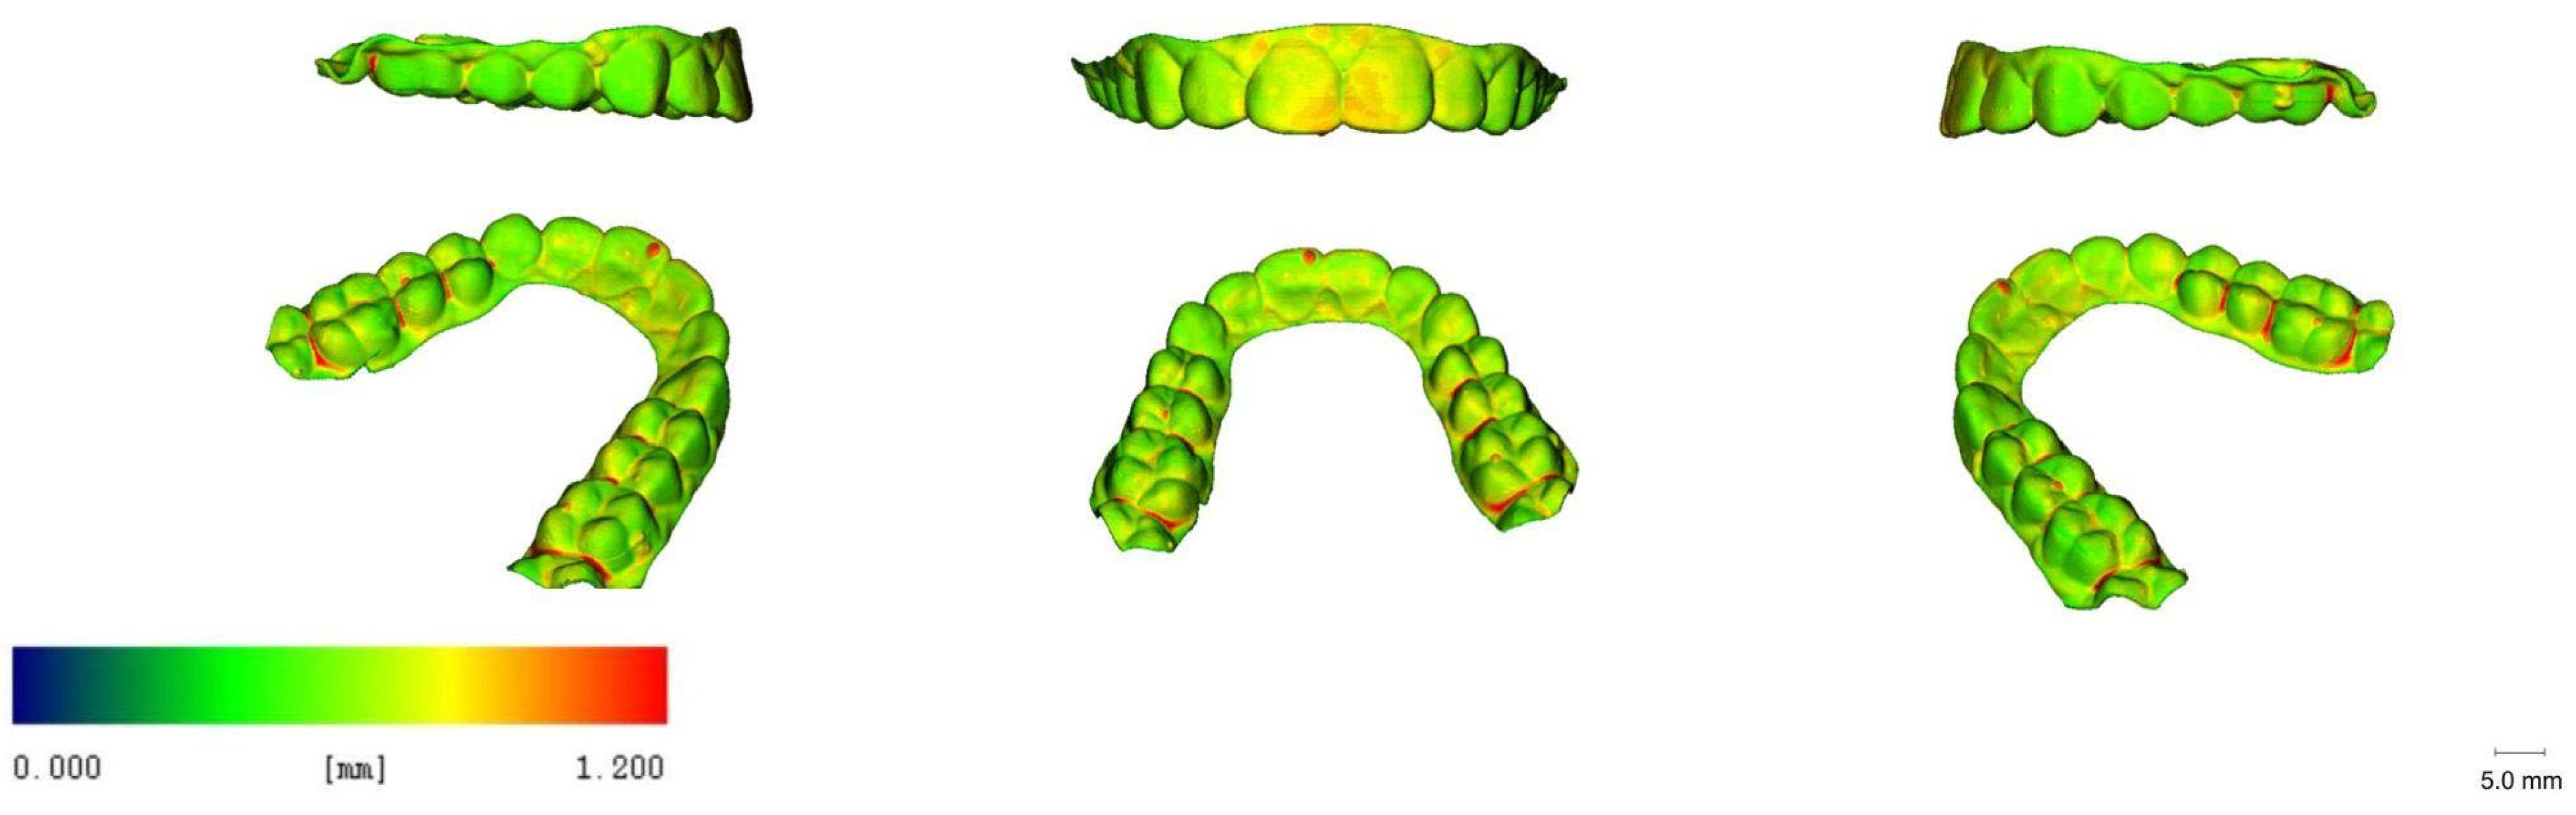
3.5. 3D Images
4. Discussion
5. Conclusions
Supplementary Materials
Author Contributions
Funding
Institutional Review Board Statement
Informed Consent Statement
Data Availability Statement
Acknowledgments
Conflicts of Interest
References
- Nakano, H.; Kato, R.; Kakami, C.; Okamoto, H.; Mamada, K.; Maki, K. Development of biocompatible resins for 3D printing of direct aligners. J. Photopolym. Sci. Technol. 2019, 32, 209–216. [Google Scholar] [CrossRef]
- Pratsinis, H.; Papageorgiou, S.N.; Panayi, N.; Iliadi, A.; Eliades, T.; Kletsas, D. Cytotoxicity and estrogenicity of a novel 3-dimensional printed orthodontic aligner. Am. J. Orthod. Dentofac. Orthop. 2022, 162, e116–e122. [Google Scholar] [CrossRef] [PubMed]
- Campobasso, A.; Ariano, A.; Battista, G.; Posa, F.; Migliorati, M.; Drago, S.; Lo Muzio, E.; Mori, G. Comparison of the cytotoxicity of 3D-printed aligners using different post-curing procedures: An in vitro study. Austral. Orthod. J. 2023, 39, 49–56. [Google Scholar]
- Rajasekaran, A.; Chaudhari, P.K. Integrated manufacturing of direct 3D-printed clear aligners. Front. Dental Med. 2023, 3, 1089627. [Google Scholar] [CrossRef]
- Lee, S.Y.; Kim, H.; Kim, H.J.; Chung, C.J.; Choi, Y.J.; Kim, S.J.; Cha, J.Y. Termo-mechanical properties of 3D printed photocurable shape memory resin for clear aligners. Sci. Rep. 2022, 12, 6246. [Google Scholar] [CrossRef] [PubMed]
- Zinelis, S.; Panayi, N.; Polychronis, G.; Papageorgiou, S.N.; Eliades, T. Comparative analysis of mechanical properties of orthodontic aligners produced by different contemporary 3D printers. Orthod. Craniofac. Res. 2022, 25, 336–341. [Google Scholar] [CrossRef] [PubMed]
- Boyer, R.A.; Kasper, F.K.; English, J.D.; Jacob, H.B. Effect of print orientation on the dimensional accuracy of orthodontic aligners printed 3-dimensionally. Am. J. Orthod. Dentofac. Orthop. 2021, 160, 732–742.e1. [Google Scholar] [CrossRef] [PubMed]
- Edelmann, A.; English, J.D.; Chen, S.J.; Kasper, F.K. Analysis of the thickness of 3-dimensional-printed orthodontic aligners. Am. J. Orthod. Dentofac. Orthop. 2020, 158, e91–e98. [Google Scholar] [CrossRef] [PubMed]
- Cole, D.; Bencharit, S.; Carrico, C.K.; Arias, A.; Tufekci, E. Evaluation of fit for 3D-printed retainers compared with thermoform retainers. Am. J. Orthod. Dentofac. Orthop. 2019, 155, 592–599. [Google Scholar] [CrossRef] [PubMed]
- McCarty, M.C.; Chen, S.J.; English, J.D.; Kasper, F. Effect of print orientation and duration of ultraviolet curing on the dimensional accuracy of a 3-dimensionally printed orthodontic clear aligner design. Am. J. Orthod. Dentofac. Orthop. 2020, 158, 889–897. [Google Scholar] [CrossRef] [PubMed]
- Mantovani, E.; Parrini, S.; Coda, E.; Cugliari, G.; Scotti, N.; Pasqualini, D.; Deregibus, A.; Castroflorio, T. Micro computed tomography evaluation of Invisalign aligner thickness homogeneity. Angle Orthod. 2021, 91, 343–348. [Google Scholar] [CrossRef] [PubMed]
- Lombardo, L.; Palone, M.; Longo, M.; Arveda, N.; Nacucchi, M.; De Pascalis, F.; Spedicato, G.A.; Siciliani, G. MicroCT X-ray comparison of aligner gap and thickness of six brands of aligners: An in-vitro study. Prog. Orthod. 2020, 21, 12. [Google Scholar] [CrossRef] [PubMed]
- Palone, M.; Longo, M.; Arveda, N.; Nacucchi, M.; De Pascalis, F.; Spedicato, G.A.; Siciliani, G.; Lombardo, L. Micro-computed tomography evaluation of general trends in aligner thickness and gap width after thermoforming procedures in-volving six commercial clear aligners: An in vitro study. Korean J. Orthod. 2021, 51, 135–141. [Google Scholar] [CrossRef] [PubMed]
- Park, S.Y.; Choi, S.H.; Yu, H.S.; Kim, S.J.; Kim, H.; Kim, K.B.; Cha, J.Y. Comparison of translucency, thickness, and gap width of thermoformed and 3D-printed clear aligners using micro-CT and spectrophotometer. Sci. Rep. 2023, 13, 10921. [Google Scholar] [CrossRef]
- Hildebrand, T.; Rüegsegger, P. A new method for the model-independent assessment of thickness in three-dimensional images. J. Microsc. 1997, 185, 67–75. [Google Scholar] [CrossRef]
- R Core Team. R: A Language and Environment for Statistical Computing. R Foundation for Statistical Computing, Vienna, Austria. 2013. Available online: http://www.R-project.org/ (accessed on 19 August 2023).
- Ammann, R.; Tanner, C.; Schulz, G.; Osmani, B.; Nalabothu, P.; Töpper, T.; Müller, B. Three-dimensional analysis of aligner gaps and thickness distributions, using hard x-ray tomography with micrometer resolution. J. Med. Imaging 2022, 9, 031509. [Google Scholar] [CrossRef] [PubMed]
- Grassia, V.; Ronsivalle, V.; Isola, G.; Nucci, L.; Leonardi, R.; Lo Giudice, A. Accuracy (trueness and precision) of 3D printed orthodontic models finalized to clear aligners production, testing crowded and spaced dentition. BMC Oral Health. 2023, 23, 352. [Google Scholar] [CrossRef] [PubMed]
- Ihssen, B.A.; Kerberger, R.; Rauch, N.; Drescher, D.; Becker, K. Impact of Dental Model Height on Thermoformed PET-G Aligner Thickness—An In Vitro Micro-CT Study. Appl. Sci. 2021, 11, 6674. [Google Scholar] [CrossRef]


| Printer Plate Angulation | Curing Time | Nitrogen Generator | N |
|---|---|---|---|
| 60° | 15 min | yes | 5 |
| 60° | 20 min | yes | 5 |
| 60° | 25 min | yes | 5 |
| 60° | 30 min | yes | 5 |
| 60° | 40 min | yes | 5 |
| 60° | 50 min | yes | 5 |
| 60° | 30 min | no | 5 |
| Reference Point | Definition | Assessed at Teeth |
|---|---|---|
| MB | mesiobuccal cusp tip | 16, 26 |
| MP | mesiopalatal cusp tip | 16, 26 |
| DB | distobuccal cusp tip | 16, 26 |
| DP | distopalatal cusp tip | 16, 26 |
| FIS | mesiodistal centre of the central fissure | 16, 15, 14, 24, 25, 26 |
| V | central point of the facial surface | All teeth |
| B | buccal cusp tip | 15, 14, 25, 24 |
| P | palatal cusp tip | 15, 14, 25, 24 |
| I | most coronal, central point of the incisal edge | 11, 21, 12, 22, 13, 23 |
| 1.6 | Overall | 15 Min | 20 Min | 25 Min | 30 Min | 40 Min | 50 Min | p-Value |
|---|---|---|---|---|---|---|---|---|
| MB | 0.56 [0.51, 0.56] | 0.58 [0.55, 0.62] | 0.56 [0.56, 0.61] | 0.56 [0.51, 0.61] | 0.51 [0.51, 0.56] | 0.56 [0.56, 0.56] | 0.51 [0.51, 0.56] | 0.359 |
| MP | 0.65 [0.61, 0.70] | 0.68 [0.64, 0.70] | 0.70 [0.70, 0.75] | 0.61 [0.61, 0.66] | 0.70 [0.66, 0.75] | 0.66 [0.61, 0.66] | 0.61 [0.61, 0.66] | 0.010 |
| DB | 0.61 [0.56, 0.61] | 0.63 [0.61, 0.66] | 0.61 [0.61, 0.66] | 0.56 [0.56, 0.61] | 0.51 [0.51, 0.56] | 0.56 [0.56, 0.61] | 0.66 [0.61, 0.66] | 0.010 |
| DP | 0.65 [0.65, 0.75] | 0.73 [0.69, 0.76] | 0.75 [0.70, 0.75] | 0.70 [0.61, 0.75] | 0.66 [0.66, 0.70] | 0.66 [0.61, 0.66] | 0.66 [0.66, 0.70] | 0.453 |
| FIS | 0.75 [0.71, 0.80] | 0.75 [0.73, 0.76] | 0.75 [0.75, 0.84] | 0.75 [0.66, 0.75] | 0.80 [0.70, 0.84] | 0.75 [0.75, 0.75] | 0.80 [0.75, 0.84] | 0.638 |
| V | 0.51 [0.51, 0.56] | 0.54 [0.51, 0.57] | 0.56 [0.51, 0.56] | 0.51 [0.51, 0.56] | 0.51 [0.51, 0.51] | 0.56 [0.56, 0.56] | 0.51 [0.51, 0.51] | 0.456 |
| 1.5 | Overall | 15 Min | 20 Min | 25 Min | 30 Min | 40 Min | 50 Min | p-Value |
| B | 0.61 [0.61, 0.66] | 0.66 [0.61, 0.70] | 0.66 [0.66, 0.66] | 0.61 [0.61, 0.61] | 0.61 [0.56, 0.61] | 0.61 [0.61, 0.61] | 0.61 [0.61, 0.61] | 0.032 |
| P | 0.61 [0.61, 0.66] | 0.66 [0.66, 0.66] | 0.70 [0.66, 0.70] | 0.61 [0.61, 0.61] | 0.61 [0.61, 0.61] | 0.61 [0.56, 0.66] | 0.61 [0.61, 0.66] | 0.008 |
| FIS | 0.78 ± 0.06 | 0.85 ± 0.02 | 0.81 ± 0.08 | 0.77 ± 0.03 | 0.73 ± 0.04 | 0.73 ± 0.08 | 0.80 ± 0.07 | 0.018 |
| V | 0.51 [0.51, 0.51] | 0.51 [0.51, 0.51] | 0.51 [0.47, 0.56] | 0.51 [0.51, 0.51] | 0.51 [0.51, 0.56] | 0.51 [0.51, 0.56] | 0.51 [0.51, 0.51] | 0.832 |
| 1.4 | Overall | 15 Min | 20 Min | 25 Min | 30 Min | 40 Min | 50 Min | p-Value |
| B | 0.56 [0.56, 0.61] | 0.56 [0.56, 0.56] | 0.61 [0.61, 0.61] | 0.56 [0.56, 0.56] | 0.61 [0.56, 0.61] | 0.61 [0.56, 0.61] | 0.56 [0.51, 0.56] | 0.201 |
| P | 0.65 [0.61, 0.70] | 0.70 [0.61, 0.70] | 0.70 [0.70, 0.75] | 0.66 [0.66, 0.70] | 0.66 [0.66, 0.66] | 0.70 [0.66, 0.70] | 0.61 [0.61, 0.66] | 0.084 |
| FIS | 0.84 [0.80, 0.89] | 0.89 [0.80, 0.89] | 0.89 [0.84, 0.89] | 0.80 [0.80, 0.84] | 0.80 [0.66, 0.80] | 0.84 [0.70, 0.89] | 0.84 [0.84, 0.89] | 0.037 |
| V | 0.51 [0.51, 0.56] | 0.56 [0.56, 0.56] | 0.51 [0.51, 0.56] | 0.51 [0.51, 0.51] | 0.51 [0.51, 0.56] | 0.56 [0.56, 0.56] | 0.51 [0.51, 0.56] | 0.337 |
| 1.3 | Overall | 15 Min | 20 Min | 25 Min | 30 Min | 40 Min | 50 Min | p-Value |
| I | 0.61 [0.56, 0.61] | 0.61 [0.56, 0.61] | 0.61 [0.56, 0.61] | 0.56 [0.56, 0.56] | 0.61 [0.61, 0.61] | 0.61 [0.61, 0.61] | 0.61 [0.61, 0.61] | 0.076 |
| V | 0.56 [0.56, 0.56] | 0.66 [0.61, 0.66] | 0.51 [0.51, 0.56] | 0.56 [0.56, 0.56] | 0.56 [0.56, 0.56] | 0.56 [0.56, 0.61] | 0.56 [0.56, 0.56] | 0.185 |
| 1.2 | Overall | 15 Min | 20 Min | 25 Min | 30 Min | 40 Min | 50 Min | p-Value |
| I | 0.61 [0.56, 0.66] | 0.61 [0.61, 0.66] | 0.66 [0.66, 0.70] | 0.56 [0.56, 0.56] | 0.66 [0.66, 0.66] | 0.61 [0.61, 0.66] | 0.61 [0.56, 0.61] | 0.001 |
| V | 0.65 [0.61, 0.65 | 0.70 [0.66, 0.70] | 0.66 [0.61, 0.66] | 0.61 [0.61, 0.66] | 0.56 [0.56, 0.61] | 0.61 [0.61, 0.61] | 0.66 [0.66, 0.66] | 0.020 |
| 1.1 | Overall | 15 Min | 20 Min | 25 Min | 30 Min | 40 Min | 50 Min | p-Value |
| I | 0.65 [0.65, 0.70] | 0.70 [0.66, 0.70] | 0.66 [0.61, 0.75] | 0.61 [0.61, 0.66] | 0.70 [0.66, 0.75] | 0.70 [0.66, 0.70] | 0.66 [0.66, 0.66] | 0.158 |
| V | 0.75 [0.75, 0.80] | 0.84 [0.84, 0.89] | 0.80 [0.80, 0.80] | 0.70 [0.70, 0.70] | 0.75 [0.70, 0.75] | 0.80 [0.80, 0.80] | 0.80 [0.75, 0.80] | 0.001 |
| 2.1 | Overall | 15 Min | 20 Min | 25 Min | 30 Min | 40 Min | 50 Min | p-Value |
| I | 0.75 [0.70, 0.80] | 0.75 [0.75, 0.80] | 0.75 [0.75, 0.80] | 0.70 [0.70, 0.70] | 0.94 [0.84, 0.94] | 0.84 [0.80, 0.98] | 0.75 [0.70, 0.75] | 0.009 |
| V | 0.80 [0.75, 0.80] | 0.84 [0.80, 0.84] | 0.80 [0.75, 0.80] | 0.70 [0.70, 0.70] | 0.75 [0.75, 0.80] | 0.80 [0.80, 0.80] | 0.80 [0.80, 0.80] | 0.004 |
| 2.2 | Overall | 15 Min | 20 Min | 25 Min | 30 Min | 40 Min | 50 Min | p-Value |
| I | 0.61 [0.58, 0.66] | 0.66 [0.66, 0.66] | 0.66 [0.61, 0.66] | 0.56 [0.56, 0.56] | 0.66 [0.61, 0.70] | 0.66 [0.61, 0.66] | 0.61 [0.61, 0.61] | 0.020 |
| V | 0.65 [0.61, 0.70] | 0.70 [0.66, 0.70] | 0.66 [0.61, 0.66] | 0.66 [0.61, 0.70] | 0.66 [0.61, 0.66] | 0.70 [0.66, 0.70] | 0.66 [0.66, 0.66] | 0.360 |
| 2.3 | Overall | 15 Min | 20 Min | 25 Min | 30 Min | 40 Min | 50 Min | p-Value |
| I | 0.61 [0.61, 0.66] | 0.61 [0.61, 0.61] | 0.61 [0.61, 0.66] | 0.56 [0.56, 0.61] | 0.61 [0.61, 0.66] | 0.66 [0.66, 0.66] | 0.61 [0.61, 0.61] | 0.009 |
| V | 0.56 [0.56, 0.56] | 0.56 [0.56, 0.56] | 0.56 [0.56, 0.61] | 0.56 [0.51, 0.56] | 0.56 [0.51, 0.56] | 0.56 [0.56, 0.61] | 0.56 [0.56, 0.56] | 0.263 |
| 2.4 | Overall | 15 Min | 20 Min | 25 Min | 30 Min | 40 Min | 50 Min | p-Value |
| B | 0.61 [0.61, 0.66] | 0.61 [0.61, 0.66] | 0.66 [0.66, 0.66] | 0.61 [0.56, 0.61] | 0.61 [0.61, 0.61] | 0.61 [0.61, 0.66] | 0.61 [0.61, 0.61] | 0.014 |
| P | 0.65 [0.63, 0.70] | 0.70 [0.66, 0.70] | 0.70 [0.70, 0.75] | 0.66 [0.61, 0.66] | 0.66 [0.66, 0.66] | 0.70 [0.66, 0.75] | 0.66 [0.66, 0.70] | 0.072 |
| FIS | 0.75 [0.70, 0.80] | 0.75 [0.75, 0.84] | 0.80 [0.75, 0.80] | 0.75 [0.70, 0.80] | 0.70 [0.66, 0.80] | 0.70 [0.51, 0.75] | 0.84 [0.80, 0.84] | 0.158 |
| V | 0.51 [0.51, 0.56] | 0.56 [0.56, 0.56] | 0.56 [0.51, 0.56] | 0.51 [0.51, 0.51] | 0.51 [0.51, 0.51] | 0.56 [0.56, 0.56] | 0.51 [0.51, 0.56] | 0.102 |
| 2.5 | Overall | 15 Min | 20 Min | 25 Min | 30 Min | 40 Min | 50 Min | p-Value |
| B | 0.61 [0.61, 0.66] | 0.66 [0.66, 0.70] | 0.66 [0.61, 0.66] | 0.61 [0.61, 0.61] | 0.61 [0.61, 0.66] | 0.66 [0.61, 0.66] | 0.66 [0.61, 0.66] | 0.206 |
| P | 0.66 [0.61, 0.70 | 0.70 [0.70, 0.70] | 0.70 [0.70, 0.75] | 0.66 [0.61, 0.66] | 0.66 [0.61, 0.66] | 0.61 [0.56, 0.66] | 0.66 [0.66, 0.70] | 0.015 |
| FIS | 0.75 ± 0.10 | 0.81 ± 0.10 | 0.80 ± 0.07 | 0.77 ± 0.06 | 0.74 ± 0.10 | 0.66 ± 0.12 | 0.80 ± 0.08 | 0.110 |
| V | 0.51 [0.51, 0.56] | 0.56 [0.51, 0.56] | 0.51 [0.51, 0.56] | 0.51 [0.51, 0.51] | 0.51 [0.51, 0.51] | 0.56 [0.56, 0.56] | 0.56 [0.51, 0.56] | 0.267 |
| 2.6 | Overall | 15 Min | 20 Min | 25 Min | 30 Min | 40 Min | 50 Min | p-Value |
| MB | 0.66 [0.61, 0.66] | 0.66 [0.66, 0.66] | 0.66 [0.66, 0.70] | 0.61 [0.61, 0.66] | 0.70 [0.70, 0.70] | 0.61 [0.61, 0.61] | 0.66 [0.61, 0.66] | 0.014 |
| MP | 0.66 [0.61, 0.72] | 0.66 [0.61, 0.75] | 0.70 [0.70, 0.75] | 0.61 [0.61, 0.66] | 0.70 [0.66, 0.80] | 0.80 [0.66, 0.94] | 0.66 [0.61, 0.66] | 0.157 |
| DB | 0.66 [0.66, 0.70] | 0.70 [0.70, 0.75] | 0.70 [0.66, 0.70] | 0.66 [0.66, 0.66] | 0.70 [0.66, 0.70] | 0.66 [0.61, 0.70] | 0.70 [0.66, 0.70] | 0.168 |
| DP | 0.66 [0.61, 0.68] | 0.66 [0.66, 0.70] | 0.70 [0.66, 0.70] | 0.61 [0.56, 0.61] | 0.66 [0.66, 0.70] | 0.61 [0.61, 0.66] | 0.66 [0.66, 0.66] | 0.038 |
| FIS | 0.71 ± 0.08 | 0.69 ± 0.02 | 0.76 ± 0.04 | 0.69 ± 0.06 | 0.78 ± 0.10 | 0.62 ± 0.13 | 0.69 ± 0.07 | 0.050 |
| V | 0.56 [0.51, 0.56] | 0.56 [0.56, 0.56] | 0.51 [0.51, 0.56] | 0.51 [0.51, 0.51] | 0.56 [0.56, 0.56] | 0.56 [0.56, 0.61] | 0.56 [0.51, 0.56] | 0.010 |
| 1.6 | Without N2 | With N2 | p-Value |
|---|---|---|---|
| MB | 0.51 [0.51, 0.56] | 0.51 [0.51, 0.56] | 0.910 |
| MP | 0.61 [0.61, 0.61] | 0.70 [0.66, 0.75] | 0.007 |
| DB | 0.56 [0.56, 0.61] | 0.51 [0.51, 0.56] | 0.125 |
| DP | 0.66 [0.61, 0.66] | 0.66 [0.66, 0.70] | 0.515 |
| FIS | 0.75 [0.75, 0.75] | 0.80 [0.70, 0.84] | 0.443 |
| V | 0.56 [0.51, 0.56] | 0.51 [0.51, 0.51] | 0.221 |
| 1.5 | Without N2 | With N2 | p-Value |
| B | 0.56 [0.56, 0.56] | 0.61 [0.56, 0.61] | 0.324 |
| P | 0.61 [0.61, 0.61] | 0.61 [0.61, 0.61] | 0.317 |
| FIS | 0.79 ± 0.02 | 0.73 ± 0.04 | 0.028 |
| V | 0.51 [0.51, 0.51] | 0.51 [0.51, 0.56] | 0.519 |
| 1.4 | Without N2 | With N2 | p-Value |
| B | 0.56 [0.51, 0.56] | 0.61 [0.56, 0.61] | 0.100 |
| P | 0.56 [0.56, 0.61] | 0.66 [0.66, 0.66] | 0.081 |
| FIS | 0.80 [0.75, 0.80] | 0.80 [0.66, 0.80] | 0.435 |
| V | 0.51 [0.51, 0.51] | 0.51 [0.51, 0.56] | 0.288 |
| 1.3 | Without N2 | With N2 | p-Value |
| I | 0.56 [0.51, 0.56] | 0.61 [0.61, 0.61] | 0.014 |
| V | 0.56 [0.56, 0.56] | 0.56 [0.56, 0.56] | 0.606 |
| 1.2 | Without N2 | With N2 | p-Value |
| I | 0.56 [0.56, 0.61] | 0.66 [0.66, 0.66] | 0.011 |
| V | 0.66 [0.66, 0.66] | 0.56 [0.56, 0.61] | 0.037 |
| 1.1 | Without N2 | With N2 | p-Value |
| I | 0.66 [0.66, 0.70] | 0.70 [0.66, 0.75] | 0.230 |
| V | 0.75 [0.75, 0.75] | 0.75 [0.70, 0.75] | 0.093 |
| 2.1 | Without N2 | With N2 | p-Value |
| I | 0.75 [0.70, 0.75] | 0.94 [0.84, 0.94] | 0.010 |
| V | 0.75 [0.70, 0.75] | 0.75 [0.75, 0.80] | 0.059 |
| 2.2 | Without N2 | With N2 | p-Value |
| I | 0.61 [0.56, 0.61] | 0.66 [0.61, 0.70] | 0.033 |
| V | 0.61 [0.61, 0.66] | 0.66 [0.61, 0.66] | 0.316 |
| 2.3 | Without N2 | With N2 | p-Value |
| I | 0.56 [0.56, 0.56] | 0.61 [0.61, 0.66] | 0.014 |
| V | 0.56 [0.56, 0.56] | 0.56 [0.51, 0.56] | 0.093 |
| 2.4 | Without N2 | With N2 | p-Value |
| B | 0.61 [0.56, 0.61] | 0.61 [0.61, 0.61] | 0.345 |
| P | 0.61 [0.61, 0.66] | 0.66 [0.66, 0.66] | 0.429 |
| FIS | 0.75 [0.70, 0.80] | 0.70 [0.66, 0.80] | 0.915 |
| V | 0.51 [0.51, 0.56] | 0.51 [0.51, 0.51] | 0.134 |
| 2.5 | Without N2 | With N2 | p-Value |
| B | 0.61 [0.56, 0.61] | 0.61 [0.61, 0.66] | 0.212 |
| P | 0.61 [0.61, 0.61] | 0.66 [0.61, 0.66] | 0.262 |
| FIS | 0.72 ± 0.09 | 0.74 ± 0.10 | 0.767 |
| V | 0.51 [0.51, 0.51] | 0.51 [0.51, 0.51] | 1.000 |
| 2.6 | Without N2 | With N2 | p-Value |
| MB | 0.61 [0.61, 0.61] | 0.70 [0.70, 0.70] | 0.005 |
| MP | 0.61 [0.61, 0.61] | 0.70 [0.66, 0.80] | 0.019 |
| DB | 0.61 [0.61, 0.61] | 0.70 [0.66, 0.70] | 0.037 |
| DP | 0.66 [0.66, 0.66] | 0.66 [0.66, 0.70] | 0.736 |
| FIS | 0.71 ± 0.06 | 0.78 ± 0.10 | 0.237 |
| V | 0.56 [0.51, 0.56] | 0.56 [0.56, 0.56] | 0.343 |
| Thickness | p-Value | Ce | L | Ca | 1P | 2P | M | |
|---|---|---|---|---|---|---|---|---|
| Ce | 0.75 [0.70, 0.80] | - | ||||||
| L | 0.63 [0.61, 0.66] | <0.001 | - | |||||
| Ca | 0.58 [0.56, 0.60] | <0.001 | <0.001 | <0.001 | - | |||
| 1P | 0.64 [0.62, 0.67] | <0.001 | 0.45 | <0.001 | - | |||
| 2P | 0.63 [0.62, 0.67] | <0.001 | 1.00 | <0.001 | 1.00 | - | ||
| M | 0.64 [0.61, 0.67] | <0.001 | 1.00 | <0.001 | 1.00 | 1.00 | - |
| Location | Thickness | p-Value | B | DB | DP | FIS | I | MB | MP | P | V |
|---|---|---|---|---|---|---|---|---|---|---|---|
| B | 0.61 [0.56, 0.66] | - | |||||||||
| DB | 0.66 [0.61, 0.66] | <0.001 | 0.051 | - | |||||||
| DP | 0.66 [0.61, 0.70] | <0.001 | 0.058 | - | |||||||
| FIS | 0.75 [0.70, 0.80] | <0.001 | <0.001 | <0.001 | - | ||||||
| I | 0.61 [0.61, 0.70] | <0.001 | 1.000 | 0.033 | <0.001 | - | |||||
| MB | 0.61 [0.56, 0.66] | 1.0000 | 0.142 | <0.001 | <0.001 | 0.006 | - | ||||
| MP | 0.66 [0.61, 0.70] | <0.001 | 0.590 | 1.000 | <0.001 | 0.378 | <0.001 | - | |||
| P | 0.66 [0.61, 0.70] | <0.001 | 1.000 | 1.000 | <0.001 | 1.000 | <0.001 | 1.000 | - | ||
| V | 0.56 [0.51, 0.66] | 0.002 | <0.001 | <0.001 | <0.001 | <0.001 | 1.000 | <0.001 | <0.001 | - |
Disclaimer/Publisher’s Note: The statements, opinions and data contained in all publications are solely those of the individual author(s) and contributor(s) and not of MDPI and/or the editor(s). MDPI and/or the editor(s) disclaim responsibility for any injury to people or property resulting from any ideas, methods, instructions or products referred to in the content. |
© 2023 by the authors. Licensee MDPI, Basel, Switzerland. This article is an open access article distributed under the terms and conditions of the Creative Commons Attribution (CC BY) license (https://creativecommons.org/licenses/by/4.0/).
Share and Cite
Migliorati, M.; Drago, S.; Lagazzo, A.; Campobasso, A.; Battista, G.; Kerberger, R.; Drescher, D.; Becker, K. Effect of Curing Time and Nitrogen Generator Usage on Direct 3D-Printed Aligners Thicknesses—An In Vitro Micro-CT Study. Appl. Sci. 2023, 13, 11952. https://doi.org/10.3390/app132111952
Migliorati M, Drago S, Lagazzo A, Campobasso A, Battista G, Kerberger R, Drescher D, Becker K. Effect of Curing Time and Nitrogen Generator Usage on Direct 3D-Printed Aligners Thicknesses—An In Vitro Micro-CT Study. Applied Sciences. 2023; 13(21):11952. https://doi.org/10.3390/app132111952
Chicago/Turabian StyleMigliorati, Marco, Sara Drago, Alberto Lagazzo, Alessandra Campobasso, Giovanni Battista, Robert Kerberger, Dieter Drescher, and Kathrin Becker. 2023. "Effect of Curing Time and Nitrogen Generator Usage on Direct 3D-Printed Aligners Thicknesses—An In Vitro Micro-CT Study" Applied Sciences 13, no. 21: 11952. https://doi.org/10.3390/app132111952
APA StyleMigliorati, M., Drago, S., Lagazzo, A., Campobasso, A., Battista, G., Kerberger, R., Drescher, D., & Becker, K. (2023). Effect of Curing Time and Nitrogen Generator Usage on Direct 3D-Printed Aligners Thicknesses—An In Vitro Micro-CT Study. Applied Sciences, 13(21), 11952. https://doi.org/10.3390/app132111952