Article

Contribution Factor Analysis of the Wuhan Yangtze River Bridge Deformation Using Sentinel-1A SAR Imagery and In Situ Data

1
College of Geomatics and Geoinformation, Guilin University of Technology, Guilin 541004, China
2
Hubei Luojia Laboratory, Wuhan 430070, China
3
Natural Resources and Real Estate Registration Center of Guangxi Zhuang Autonomous Region, Nanning 530022, China
4
China Railway Siyuan Survey and Design Group Co., Ltd., Wuhan 430063, China
*
Author to whom correspondence should be addressed.
Appl. Sci. 2023, 13(21), 11955; https://doi.org/10.3390/app132111955
Submission received: 5 July 2023 / Revised: 30 October 2023 / Accepted: 31 October 2023 / Published: 1 November 2023

Abstract

:
Bridges play a crucial role in the development of the national economy and transportation industry, and their deformation monitoring is vital for ensuring their health. Therefore, it is necessary to conduct long-term monitoring of bridges’ deformation. This study monitored the deformation of the Wuhan Yangtze River Bridge using the SBAS-InSAR technology and Sentinel-1A data. The deformation results were analyzed in combination with bridge structure, human activity, temperature and stratigraphy. The results were as follows: (1) The vertical deformation rate of the bridge was between −15.6 and 10.7 mm/year, and part of the deformation belonged to rebound deformation; (2) The middle span deformation is the largest and the uplift and lowering alternate; (3) The reduction in human activity is the reason for the lower deformation amplitude from January to October 2020 compared to after October 2020; (4) A positive correlation between deformation and temperature was observed only along a portion of the bridge; (5) There is no direct correlation between observed lowering and stratigraphy under the bridge piers, as the sinking is presumably absorbed by the bridge structure.

1. Introduction

In today’s rapidly developing national economy, the national transportation volume is increasing, and the transportation industry has gradually become the main indicator of a country’s economic development level. As an important infrastructure and key hub of a country’s transportation network, bridges play a crucial role in the development of the national economy and the national transportation industry [1]. With the changes in the number, load, and speed of passing trains, the dynamic response of the bridge increases, leading to increased vibration of the bridge. In addition, due to its long history of disrepair and chaotic bridge management, structural damage may develop with a decrease in bearing capacity and durability of the bridge [2,3]. After reaching a certain level of deterioration, damage to the bridge structure can result and potentially lead to accidents including the collapse of the bridge [4,5]. Therefore, the real-time monitoring of bridge health status is a necessary activity [6].
The structural health monitoring system (SHM) will be installed in the construction of large bridges, but the actual operation life of the general bridge health monitoring system is much shorter than that of the bridge itself. Traditional SHM largely relies on the on-site measurement of total station, accelerometer, strain gauge and other sensors, and even visual inspection [7,8]. However, due to limitations on human and financial costs, such measurements are usually only available at sparse discrete locations or at low time sampling frequencies [9,10,11]. Therefore, it is necessary to explore new methods for monitoring bridge deformation.
Interferometric synthetic aperture radar (InSAR) is a spaceborne geodetic measurement technology that can obtain spatially continuous surface deformation information within a study area in a short period of time [12,13,14]. It has the advantages of a large measurement range, no regional constraints and no impact on the normal operation of bridges. It can simultaneously monitor multiple bridges within the same image, therefore it has good application prospects in bridge deformation monitoring [15,16].
Many scholars have conducted relevant studies on bridge deformation monitoring using InSAR technology. In 2016, Huang et al. monitored the displacement of Nanjing Dashengguan Yangtze River high-speed railway bridge based on PSInSAR technology and computed the regression models of the longitudinal displacements versus the ambient temperatures. In addition, the thermal expansion of the bridge was analyzed [17]. In 2018, Zhang et al. derived the deformation of the Donghai Bridge from January 2009 to July 2009 based on TCPInSAR technology. During the co-registration procedure, only those TCP offsets identified in each of the two SAR acquisitions over the entire observation period were used for the joint alignment, and local Delaunay triangulation was employed to construct point pairs to mitigate atmospheric artifacts. It is concluded that the large deformation rate on the cable-stayed bridge is mainly caused by thermal expansion [18]. Zhao et al. present an approach suitable to overcome the high-phase-gradient problem in cases where no DSM is available, in order to enhance the accuracy of the estimated deformation rates. The long and short baseline iteration method was used to extract elevation in PSInSAR data processing, and the linear deformation rate and seasonal deformation of PS were extracted from the InSAR deformation time series, resulting in better accuracy results [19].
In this paper, the deformation of the Wuhan Yangtze River Bridge in the study period was analyzed and obtained data based on SBAS-InSAR (small baseline subset interferometric synthetic aperture radar) technology, and the results were compared with the bridge structure, human activity, temperature and stratigraphy. SBAS-InSAR technology is proposed to reduce the influence of temporal and spatial decorrelation and atmospheric delay [20]. For deformation monitoring of large span bridges, this method has a higher spatial resolution, the ability to accommodate large variations in the monitoring area, the ability to account for atmospheric effects, and the ability to perform reliable time series analysis. Large-span railway bridges provide stable and smooth passage for trains, which is the key to ensuring good economic and social benefits for railroads. The deformation analysis of the Wuhan Yangtze River Bridge contributes to the safety control of such large-span railway and road bridges [21].

2. Introduction to the Study Area and the Dataset
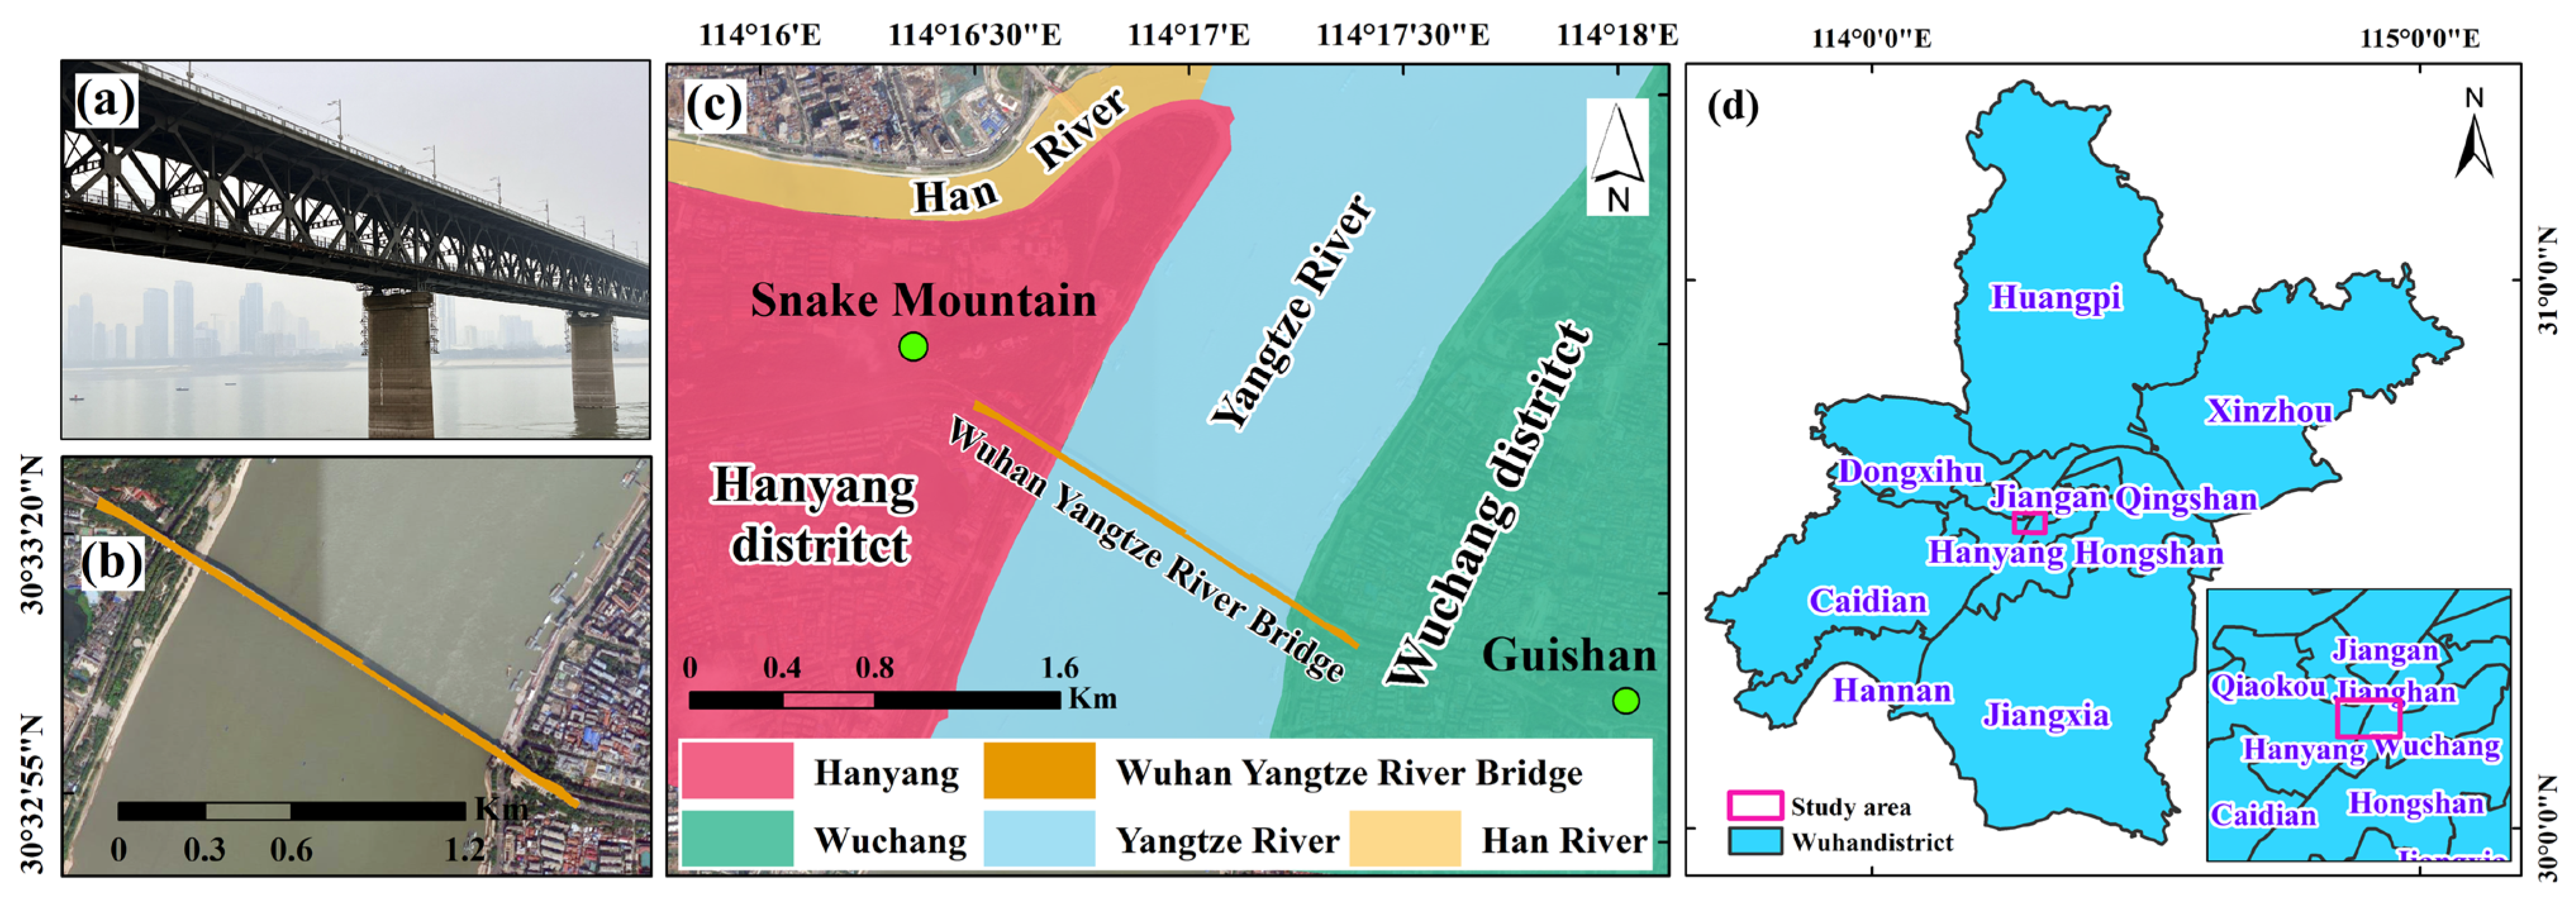
2.1. Study Area

The Wuhan Yangtze River Bridge, which spans between Wuchang Snake Mountain and Hanyang Guishan, is the first public railway bridge built on the Yangtze River in China and is known as the “First Bridge of the Yangtze River”. The bridge was completed and opened to traffic in October 1957. The location and images of the Wuhan Yangtze River Bridge are shown in Figure 1. The bridge mainly consists of the main bridge over water, piers, upper deck, lower railroad two-lane track, four bridgeheads and various interchange ramps, the main bridge section is arranged in the northwest to south-east direction. The main bridge is in the form of steel trusses, and the approach bridge body is in the form of an arch. The main bridge is supported by 8 bridge piers, while the west approach bridge is sustained by 18 bridge piers, including the bridge tower, and the east approach bridge is supported by 13 bridge piers, including the bridge tower. According to the bridge parameters information provided by China Railway Major Bridge Engineering Group Co., Ltd. Figure 2 shows the total length of the entire bridge of 1670.4 m, including the main bridge of 1155.5 m, the west approach bridge of 303.45 m, and the east approach bridge of 211.45 m. The distance between each pier of the main bridge is about 128 m. The road deck is 58.07 m above the ground, and the railway deck is 48.17 m above the ground. Up to now, the Wuhan Yangtze River Bridge has undergone five major renovations.

2.2. Dataset

The SAR dataset is composed of 75 Sentinel-1A ascending orbital images from January 2020 to June 2022, with a 12-day image sampling interval. The image specific parameter table is shown in Table 1. The SRTM 90 m digital elevation model provided by the National Aeronautics and Space Administration (NASA) was used in the study to eliminate topographic phases, and the orbital errors were eliminated by using the precise orbit ephemerides (POD) provided by the European Space Agency (ESA).
The temperature data were obtained from the Wuhan National Basic Meteorological Observatory (No. 57494) climate element statistics. The national meteorological station is located at Cihui Farm (30.36° N, 114.03° E), East–West Lake District, Wuhan, about 15.5 km away from the study area. The monthly average temperature for the 30 months during the study period is calculated based on the daily average temperature.

3. Method

3.1. SBAS-InSAR Technology

The SBAS-InSAR technology combines multiple master images to create interferograms with short temporal and spatial baselines. The problem of reducing independent images due to the inability to interfere between images caused by long baselines is solved by this technique improving the quantity and quality of interference image pairs in this way [22,23].
Assuming that N + 1 SAR images are arranged according to time series (t0, t1, …, tn), one of the images is selected to be the master image, to align the rest of the images with it, then the N + 1 images can generate M differential interferograms, and M satisfies the following conditions:
N + 1 2 M N ( N + 1 ) 2
The jth differential interferogram is generated by the interference between the image acquired at t A and the image acquired at t B ( t B > t A ); the interference phase of a pixel whose azimuth coordinate is x and distance coordinate is r can be expressed as:
δ φ j , d e f = φ B x , r φ A x , r 4 π λ [ d ( t B , x , r ) d ( t A , x , r ) ] + Δ φ t o p o j x , r + Δ φ A P S j ( t B , t A , x , r ) + Δ φ n o i s e j x , r
where φ is the interference phase; λ is the radar signal wavelength; φ A x , r and φ B x , r are the SAR image phase values at t A and t B ; d ( t A , x , r ) and d ( t B , x , r ) are cumulative deformation in the line of sight direction at t A and t B relative to moment d ( t 0 , x , r ) = 0 ; Δ φ t o p o j x , r denotes the residual terrain phase of the differential interferogram; when a higher precision DEM is incorporated into the differential interference process, it can effectively eliminate the majority of the terrain phase; Δ φ A P S j ( t B , t A , x , r ) denotes atmospheric delay; Δ φ n o i s e j x , r denotes noise phase. By removing the delay, residual terrain phase and noise phase, the interference phase can be simplified as:
δ φ j = φ B ( x , r ) φ A ( x , r ) 4 π λ [ d ( t B , x , r ) d ( t A , x , r ) ]
Expressing Equation (3) in matrix form as:
B v = δ φ
where B is the matrix of M × N . When the coefficient matrix B is full rank, the deformation rate can be solved using the least-squares method (LSM), while when the coefficient matrix B is a singular matrix, the generalized inverse matrix of the matrix B can be obtained using singular value decomposition (SVD), which leads to the minimum norm of velocity vector [24,25].

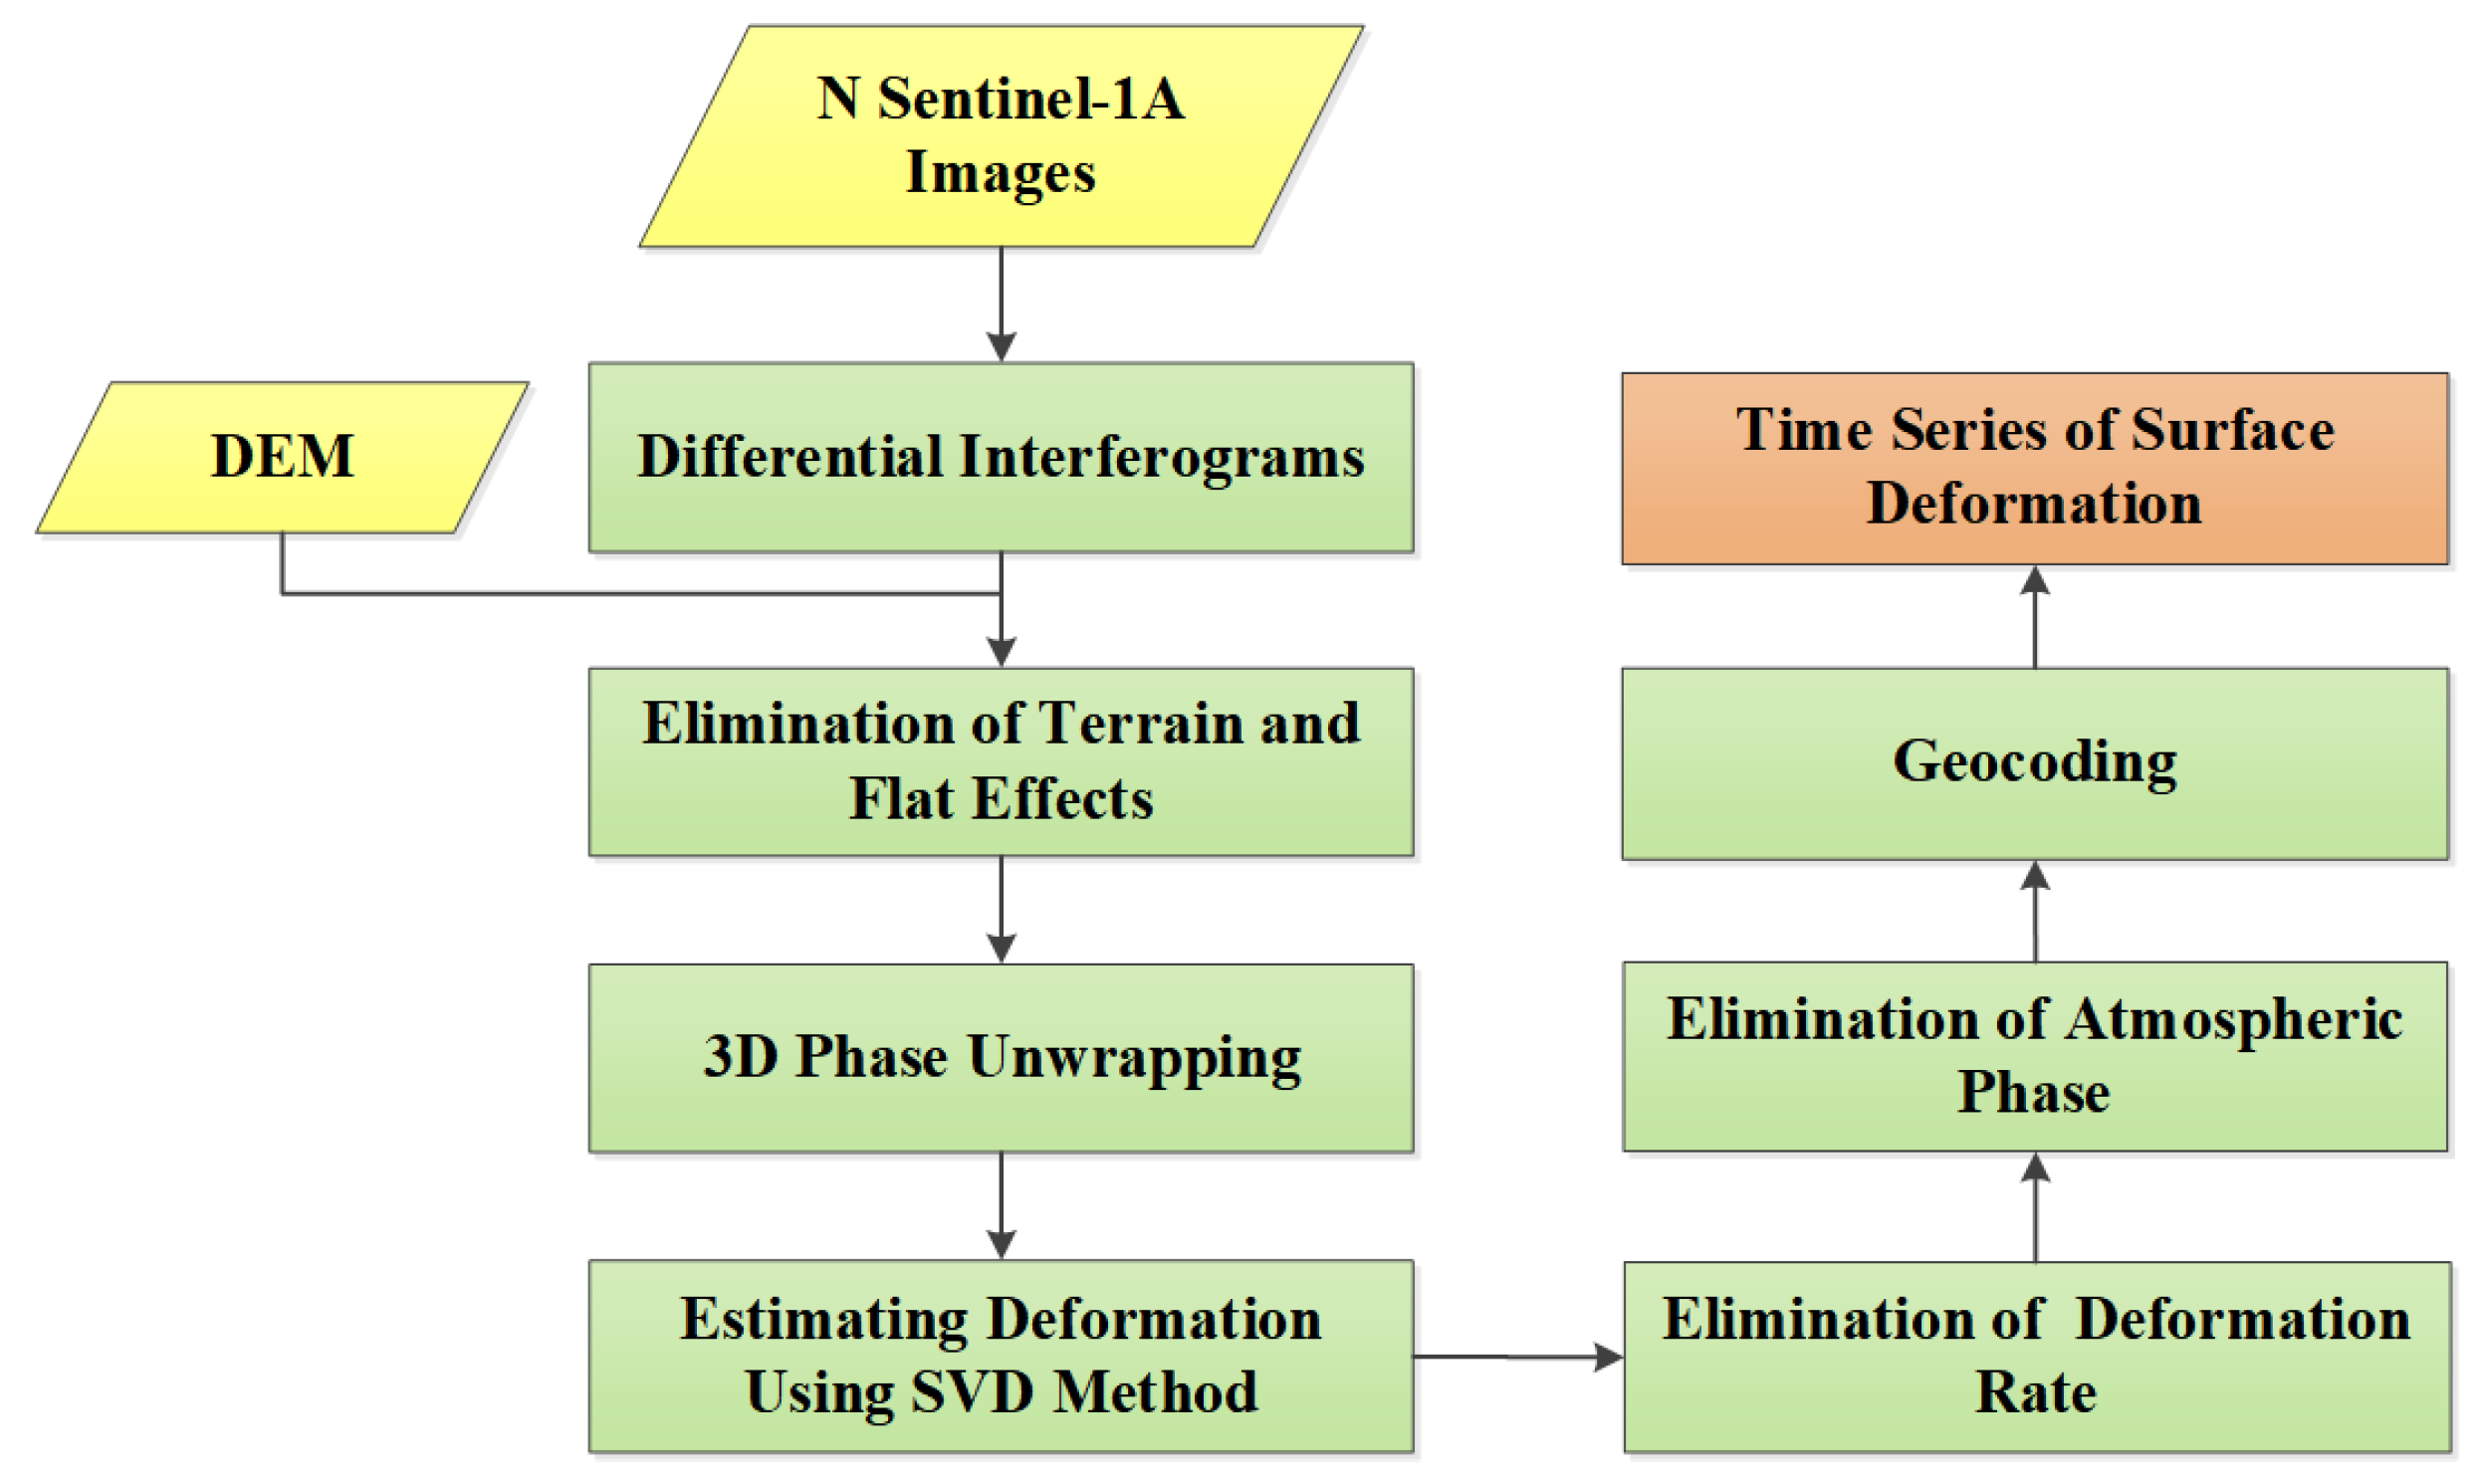
3.2. Data Processing Flow of SBAS InSAR

The SBAS technology data processing flow is shown in Figure 3, which is divided into the following 7 steps:
  • 75 Sentinel-1A images were converted into Single Looking Complex (SLC) images.
  • Interference pairs generation: The image of 3 April 2021 was selected as reference image, and the threshold of time baseline and spatial baseline were set to 90 days and 45%, then 290 interference pairs were derived.
  • Interference and unwrapping processing: After images were registered, interferometric processing is applied to the interferometric pairs to generate interferograms. Subsequently, flat earth effects are mitigated, Goldstein filtering is performed, coherence is computed, and phase unwrapping is executed using the minimum cost flow method. Following these steps, a phase map is generated.
  • Refinement and re-flatting: The area in the image that is far from the deformation area and has no residual terrain stripes was selected, and no fewer than 30 Ground Control Points (GCPs) were selected, then orbit refinement polynomials were used for refinement, and re-flatting was performed based on GCPs.
  • Linear deformation and elevation coefficient solution: An error correction model for the elevation coefficient and deformation rate of coherent points were established, then SVD was used to solve the model, and the deformation of interference pairs and elevation coefficient were obtained.
  • Elimination of atmospheric phase: To eliminate the atmospheric phase and obtain the deformation time series, high-pass filtering in the time domain and low-pass filtering in the spatial domain were employed.
  • Geocoding: The processing result in the radar coordinate system (Cartesian coordinate system) was converted to the geographic coordinate system to obtain the final results.
Figure 3. SBAS InSAR Workflow.
Applsci 13 11955 g003

4. SBAS InSAR Results and Precision Validation

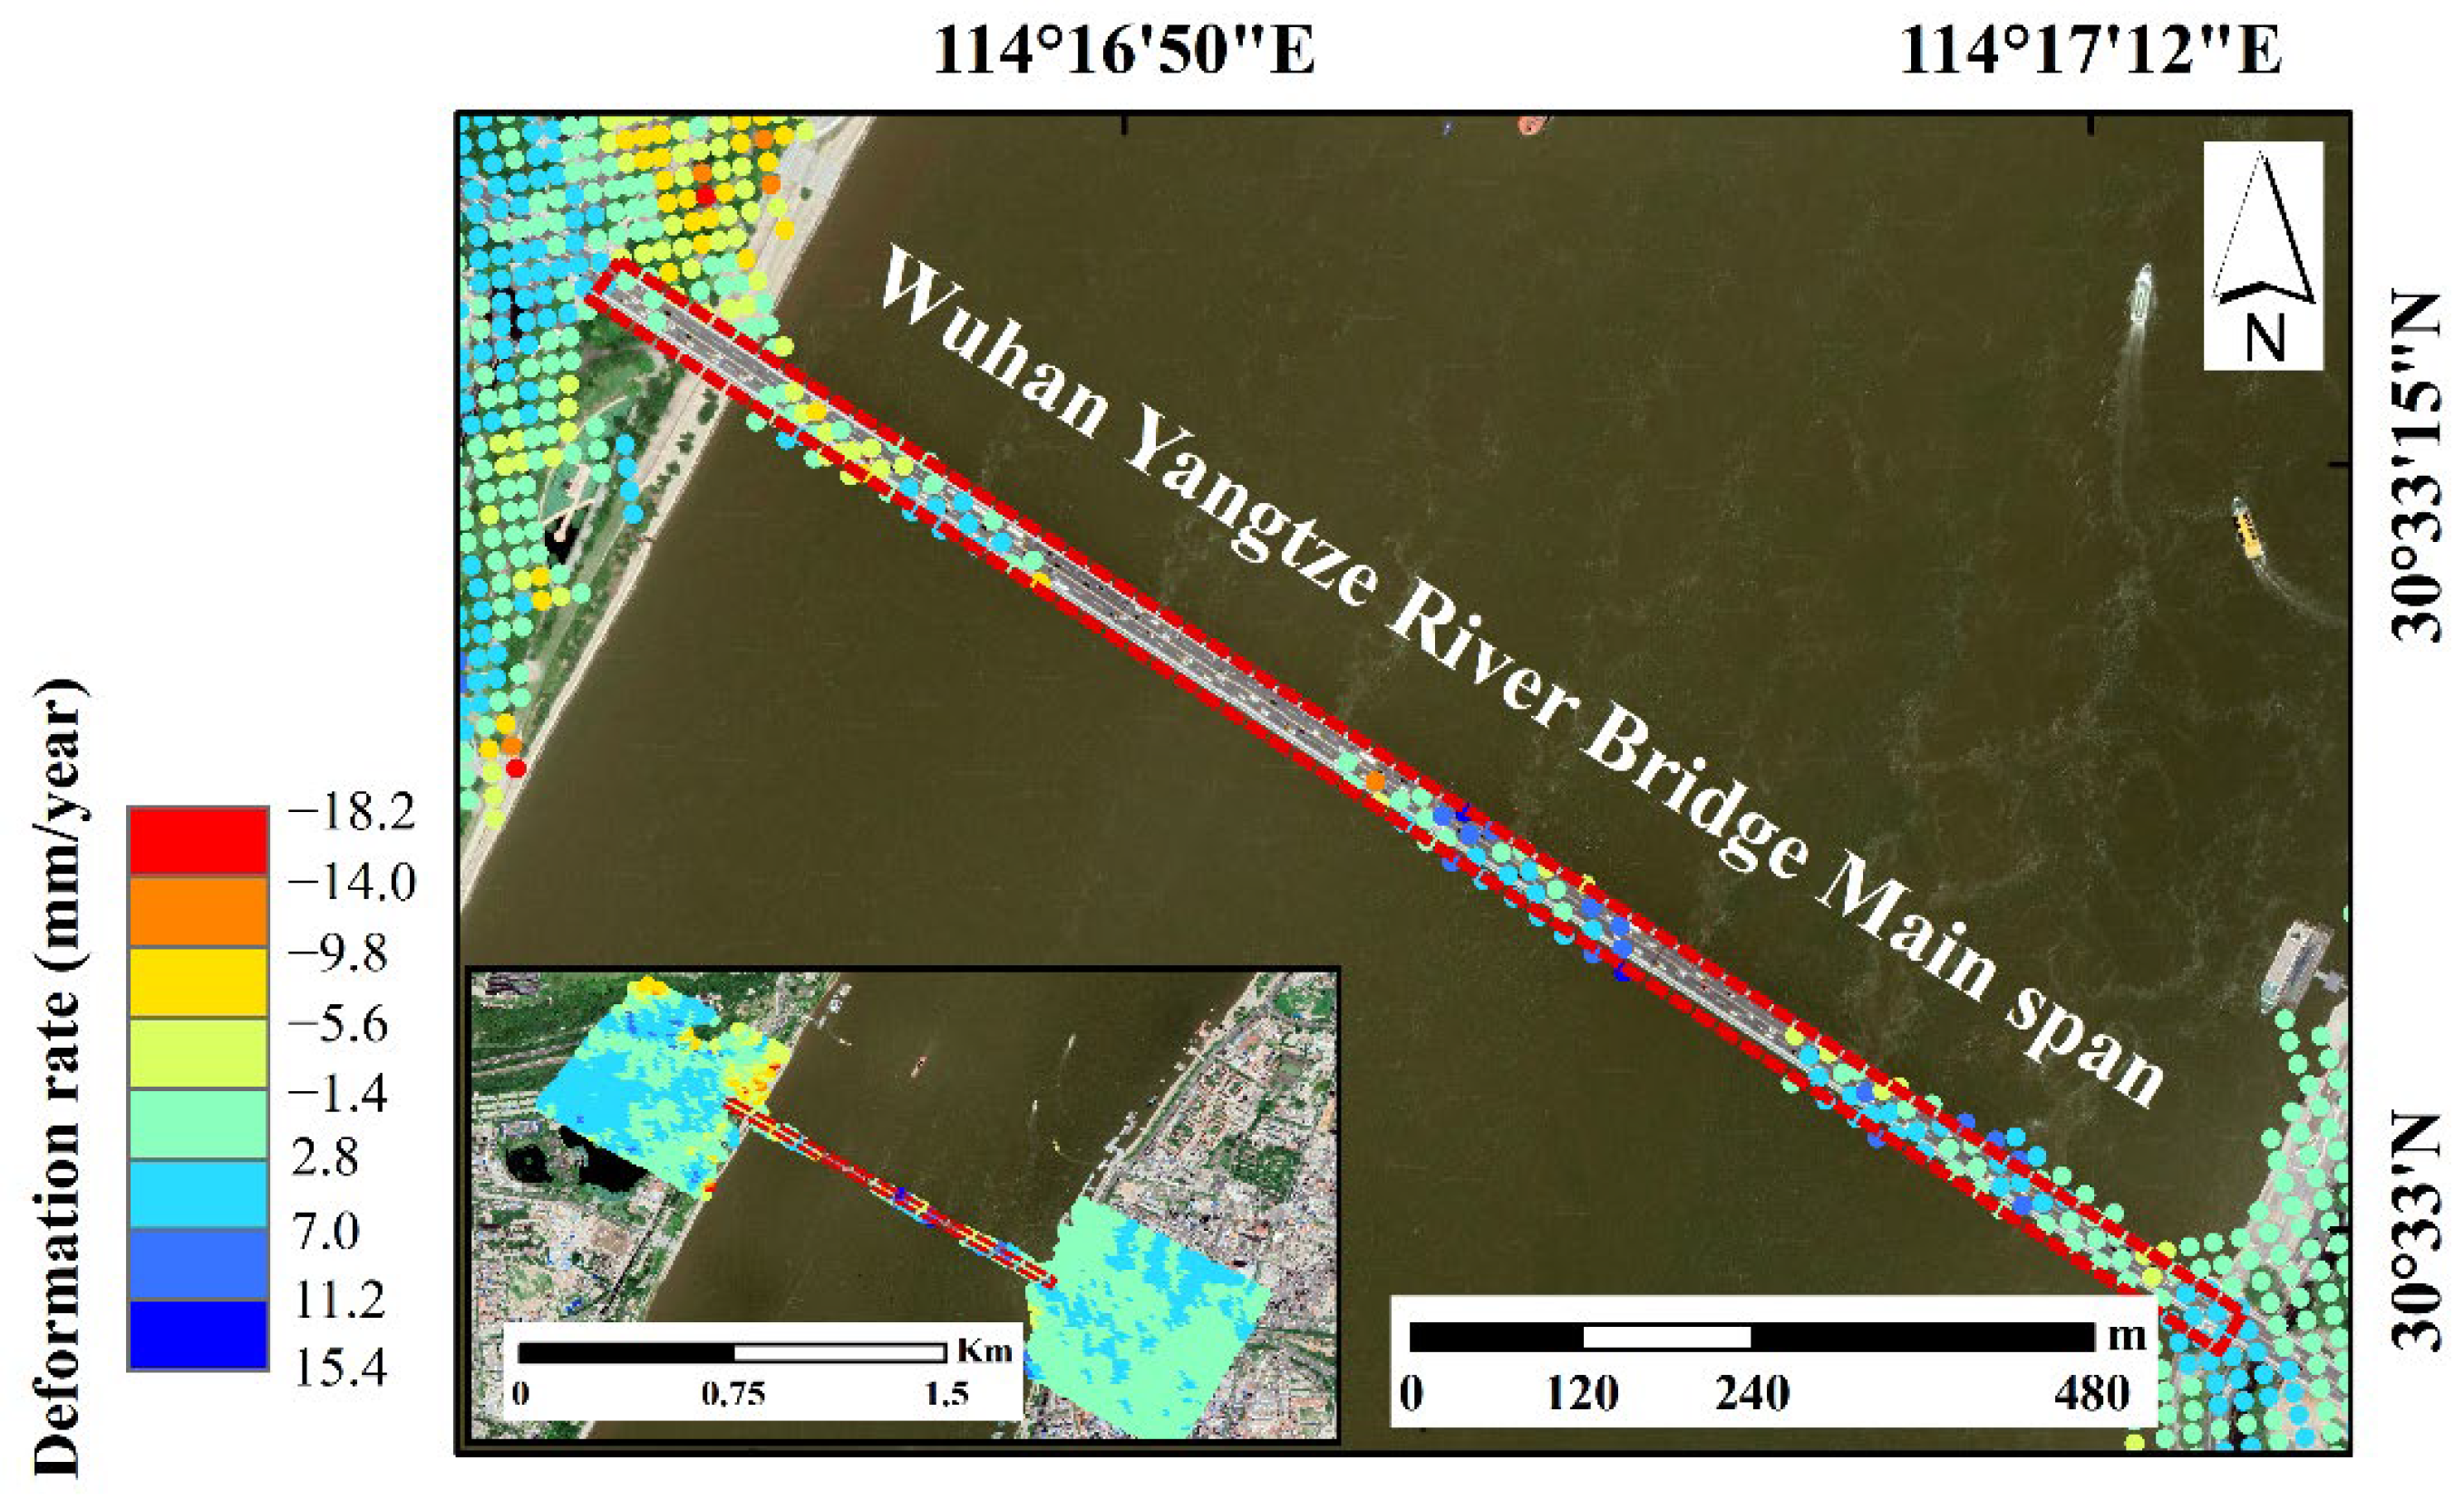
4.1. SBAS InSAR Results

Based on the SBAS deformation results in the line-of-sight direction we calculated the deformation rates in the vertical direction. All deformations mentioned below are vertical deformations. It should be noted that our monitoring approach utilizes Sentinel-1A data in the C-band, which, due to its radar imaging properties, may not fully penetrate the bridge structure. However, due to the transmission of deformations and displacements, changes in the bridge structure can manifest themselves on the bridge surface, and therefore, our study aims to comprehensively monitor the structural changes in the bridge and any resulting surface deformations. The SBAS-InSAR results showed the deformation rates ranging from −18.2 to 15.4 mm/year in the study area (bridge body and area around the bridge) as shown in Figure 4, and we divided the deformation rates into eight categories at equal intervals (shown in the legend of Figure 4). The deformation rate along the bridge ranged from −15.6 to 10.7 mm/year. We conducted a statistical analysis of the deformation rates of 163 points on the bridge, and the results are shown in Figure 5. According to Figure 5, the overall deformation approximated a normal distribution (red curve), and we calculate that μ , the mean rate of deformation points is 2.67 mm/year. In addition, the points with deformation rates ranging from −3.17 to 8.51 mm/year account for 95% of the total deformation points. Therefore, the bridge can be regarded as basically stable.

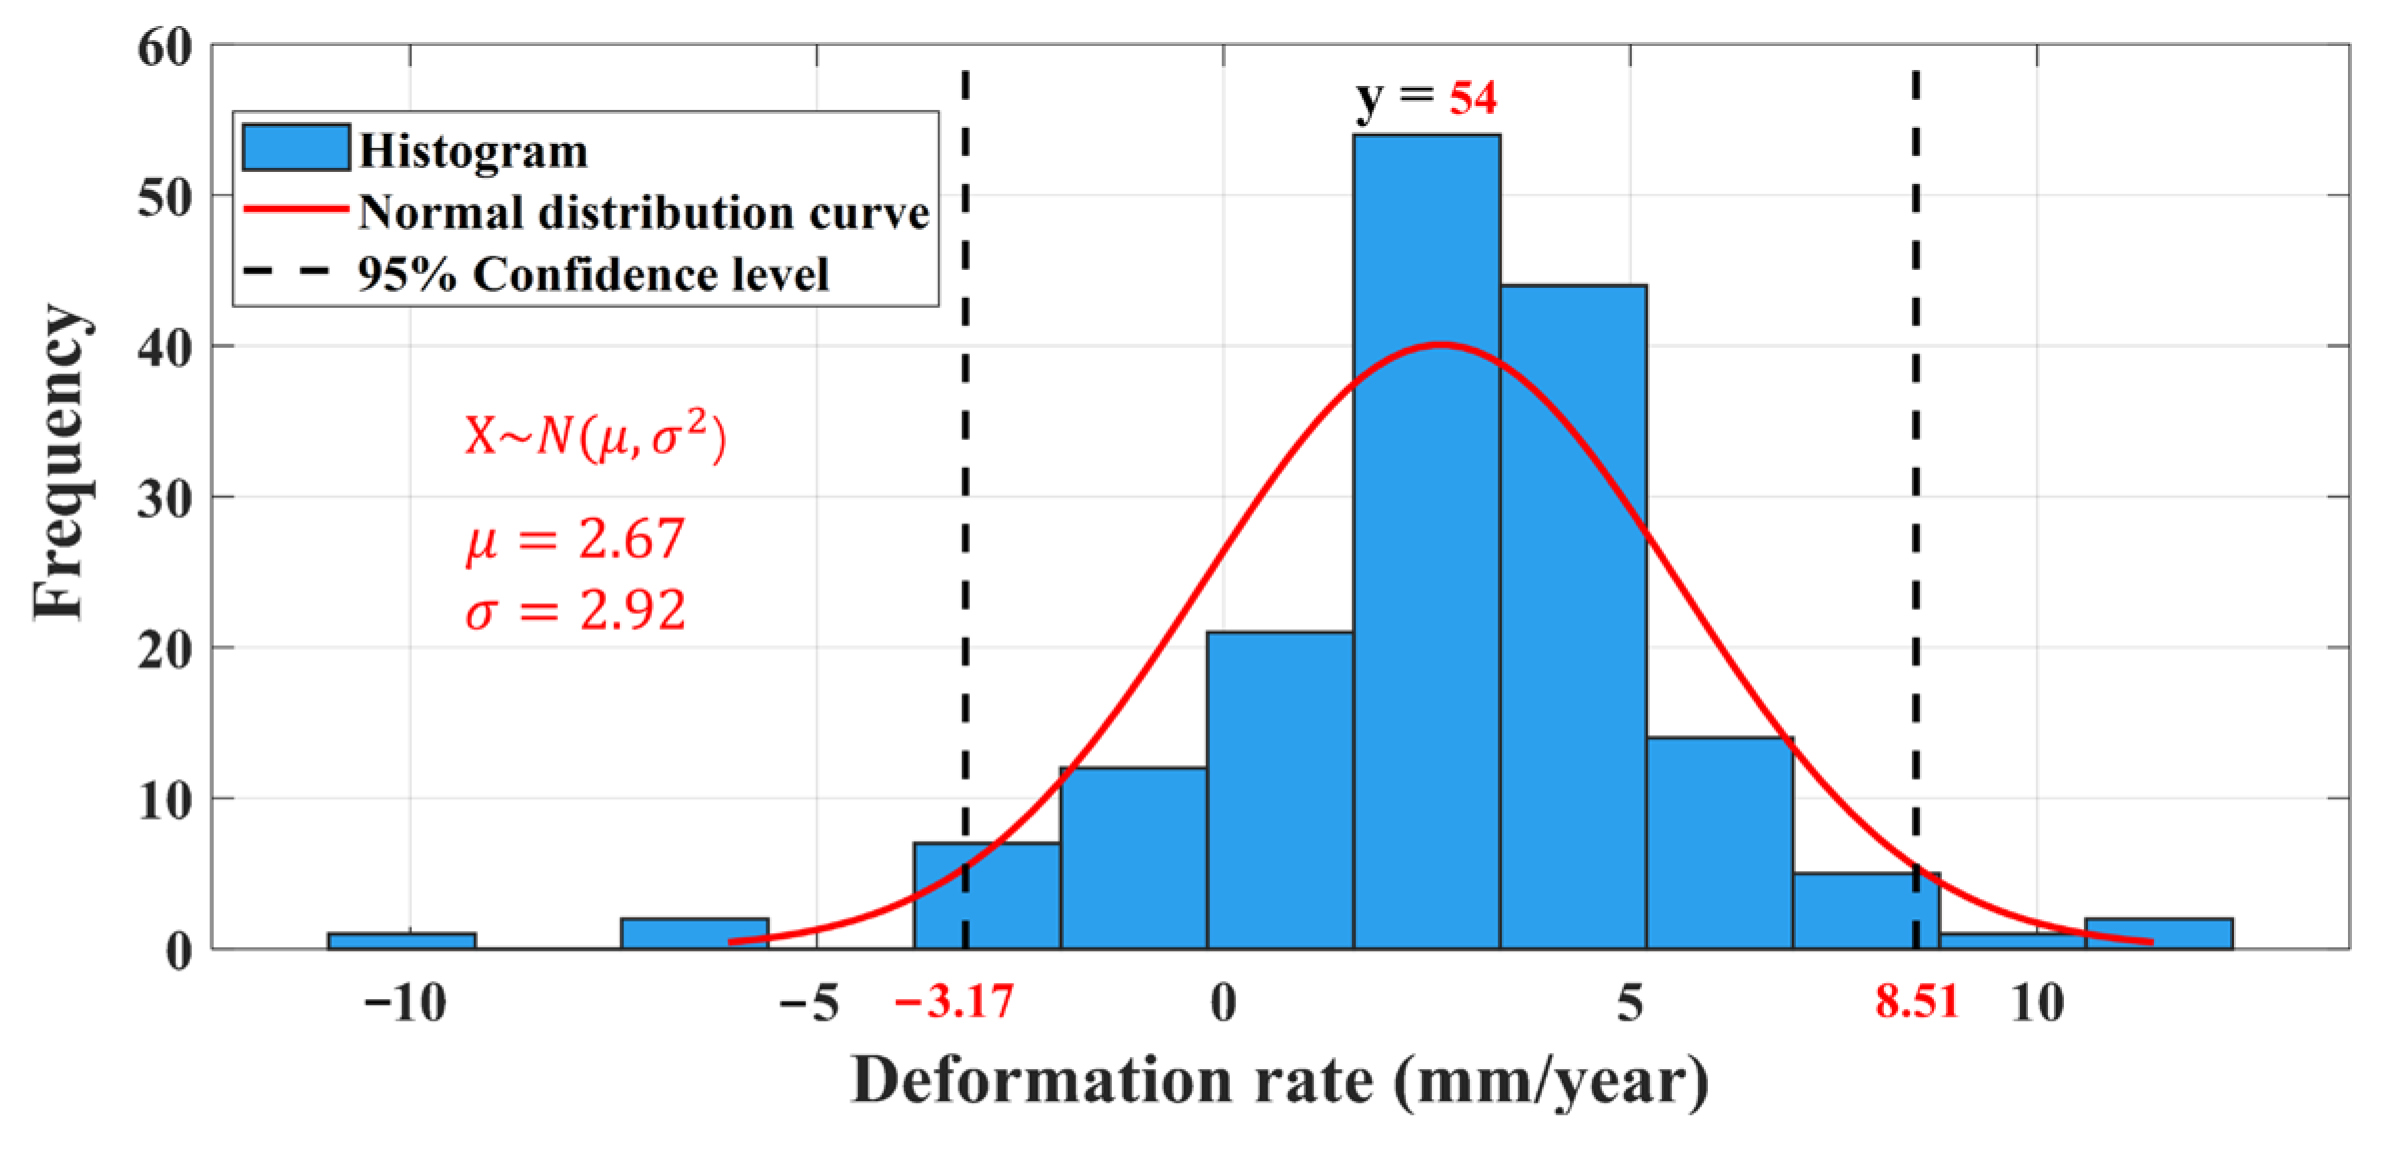
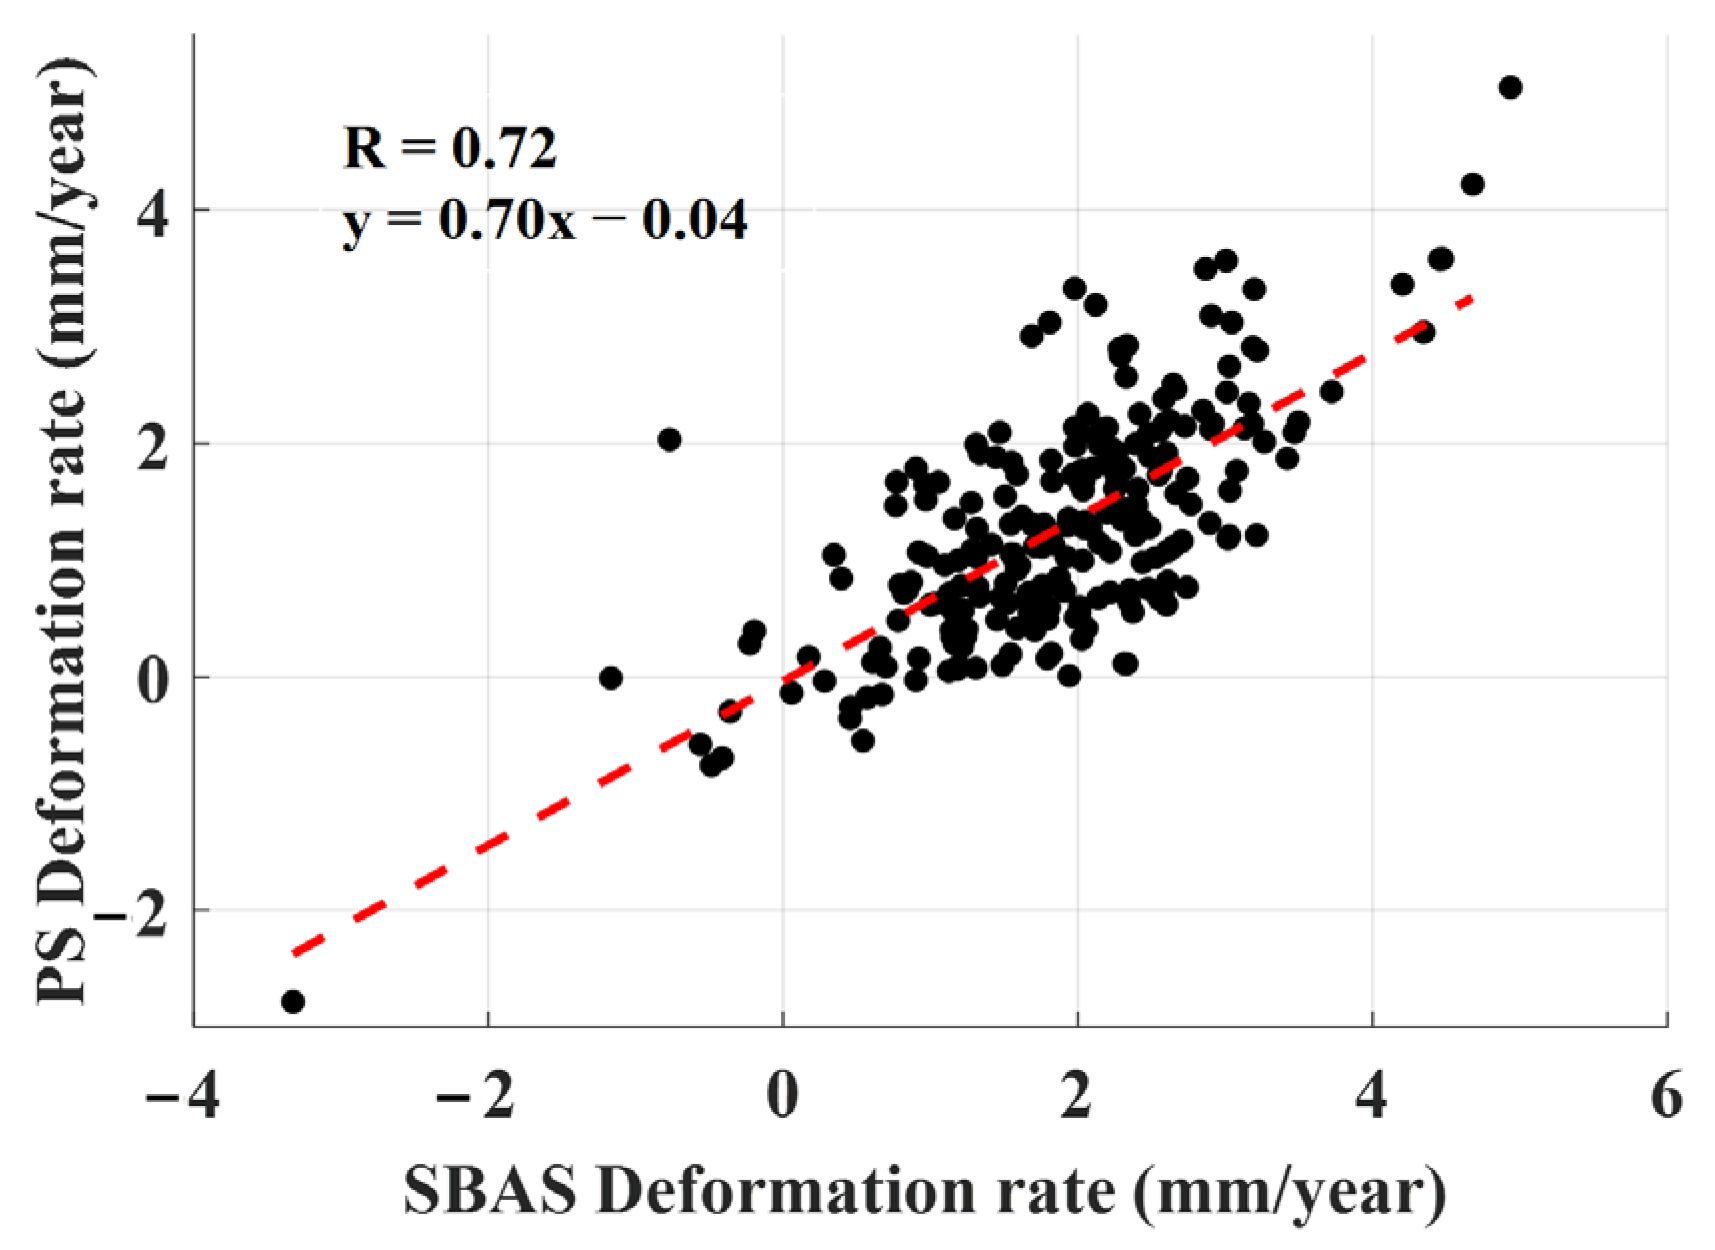
4.2. Precision Validation of SBAS Data

PS-InSAR, as another time-series deformation monitoring method, was used by us to validate the precision of the results. We set the threshold for adjacent distance within the same range to 2.5 m, and ultimately screened 232 pairs of adjacent points for cross-validation analysis; the analysis results are shown in Figure 6. The horizontal axis is the processing results of PS-InSAR technology and the vertical axis is the processing results of SBAS-InSAR technology; the correlation coefficient R is 0.72, indicating a good validation result. Considering the differences in candidate point selections between the two methods and the limitations of InSAR technology accuracy, the small deviation between the two results is satisfactory. Therefore, we can consider that the deformation rate results obtained by the two methods are similar in most regions.

5. Discussion

Due to the strong decorrelation of the river crossing bridge, the points on the bridge were distributed unevenly and gathered in a decentralized manner, so the characteristic points were selected at the places where the deformation points were dense. Eight characteristic points were selected from the west to the east side of the bridge, as shown in Figure 7. As shown in Table 2, P1 was located near No. 1 pier on the bridge’s west side and moves with a mean rate of 1.9 mm/year, P2 shows an annual mean deformation rate of −1.5 mm/year, P3 shows an annual mean deformation rate of −6.3 mm/year, P4 shows an annual mean deformation rate of −10.7 mm/year, P5 shows an annual mean deformation rate of 15.4 mm/year, and P6 shows an annual mean deformation rate of 4.6 mm/year. The annual mean deformation rate of P7 reaches −1.8 mm/year.
We divide the deformation characteristic points on the bridge into points on the west side of the bridge, points on the middle span of the bridge, and points on the east side of the bridge according to their spatial distribution. The deformation time series for characteristic points in the three regions during the study period are illustrated in Figure 8. In the figure, P1 exhibits a minor uplift, while the deformation at P2 remains negligible. In contrast, P3 experiences a notable subsidence. The deformations at P4 and P5 are more pronounced, with P4 experiencing a maximum subsidence of 38.5 mm and P5 showing a maximum uplift of 37.3 mm. Points P6 and P7 display minimal deformations.
While the deformation rate of the bridge structure remains relatively modest (−15.6 to 10.7 mm/year), it is noteworthy that, during the study period, the maximum uplift and subsidence values recorded were 37.3 mm and −38.5 mm (Figure 8), respectively. This observation suggests the possibility of partial deformation rebound within the bridge structure which has the ability to dissipate external loads and return to its original state.

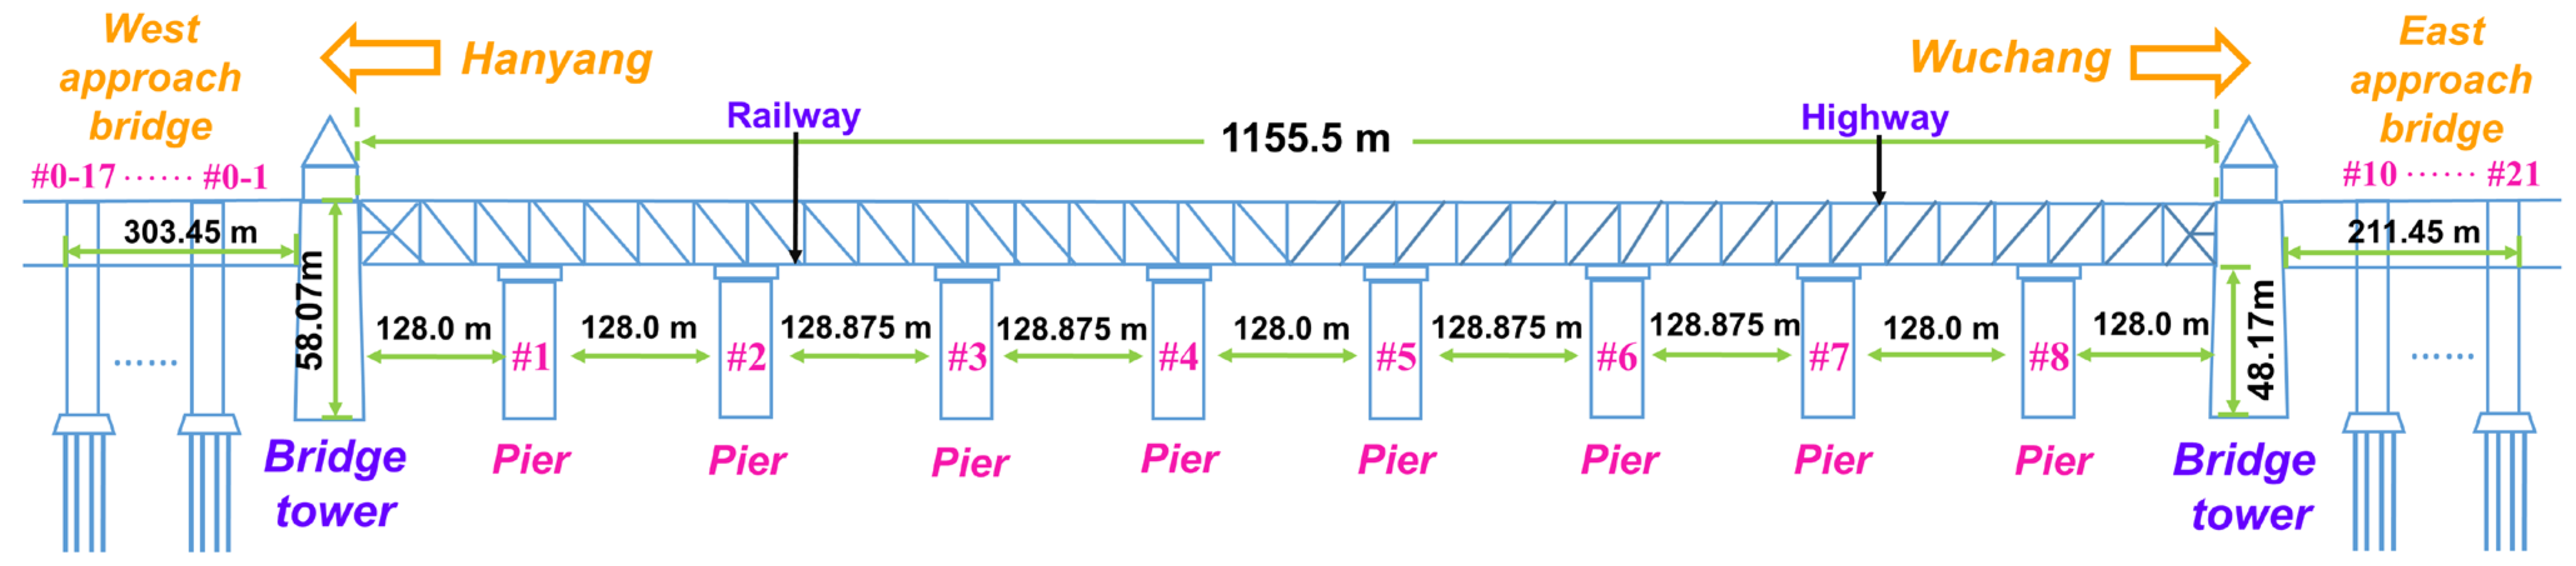
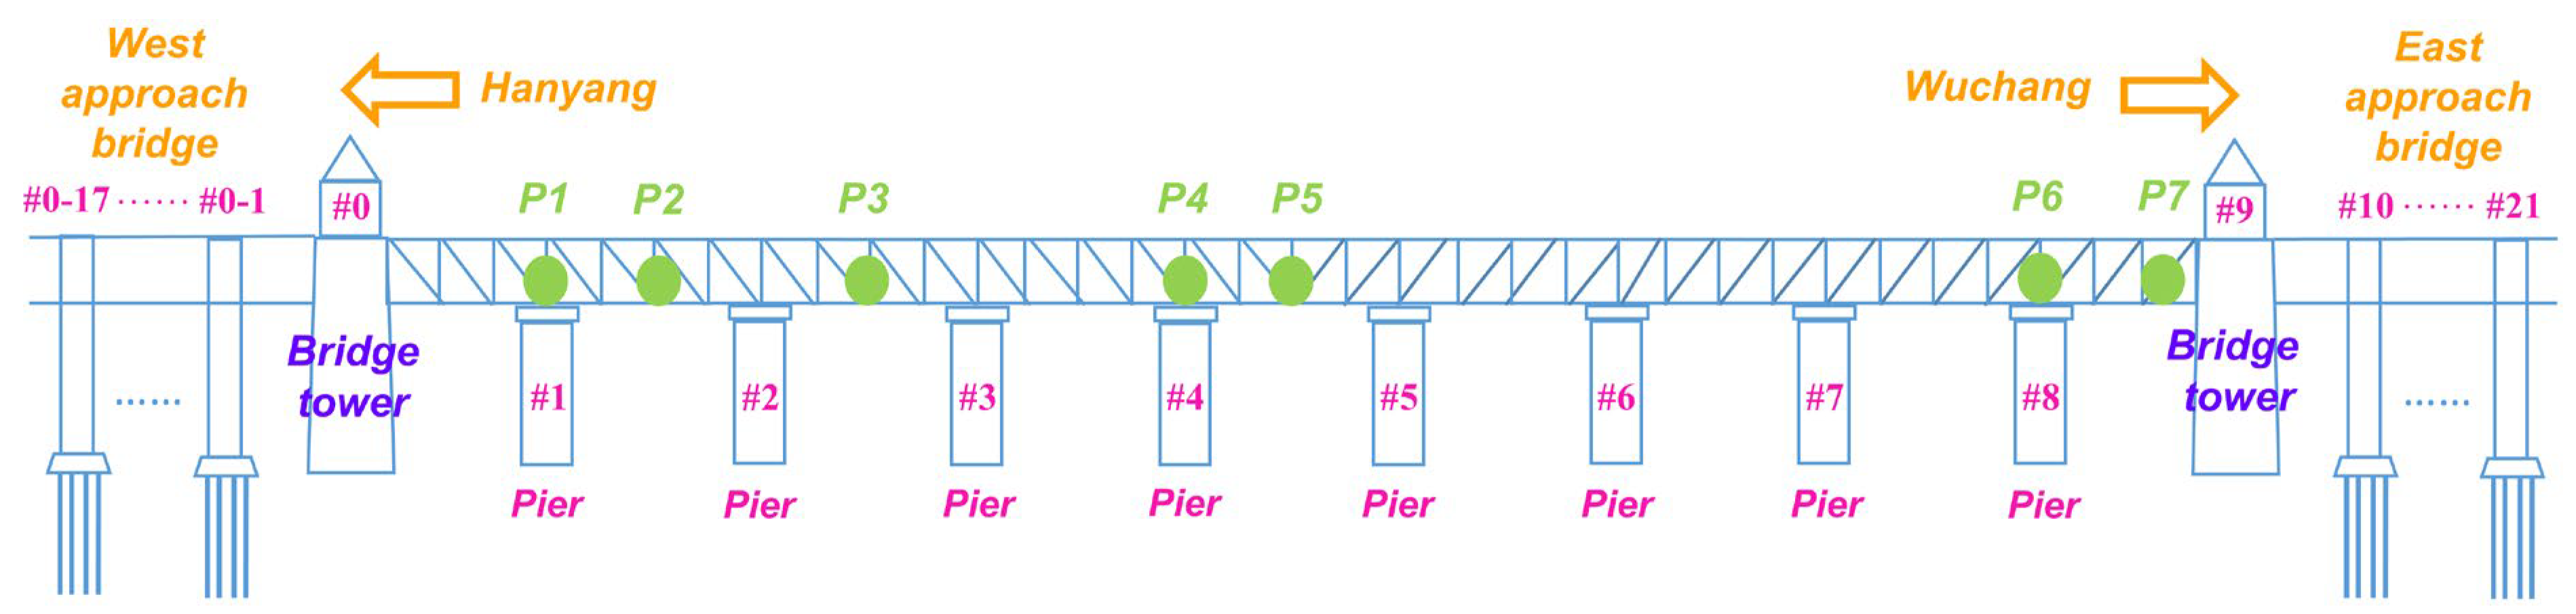
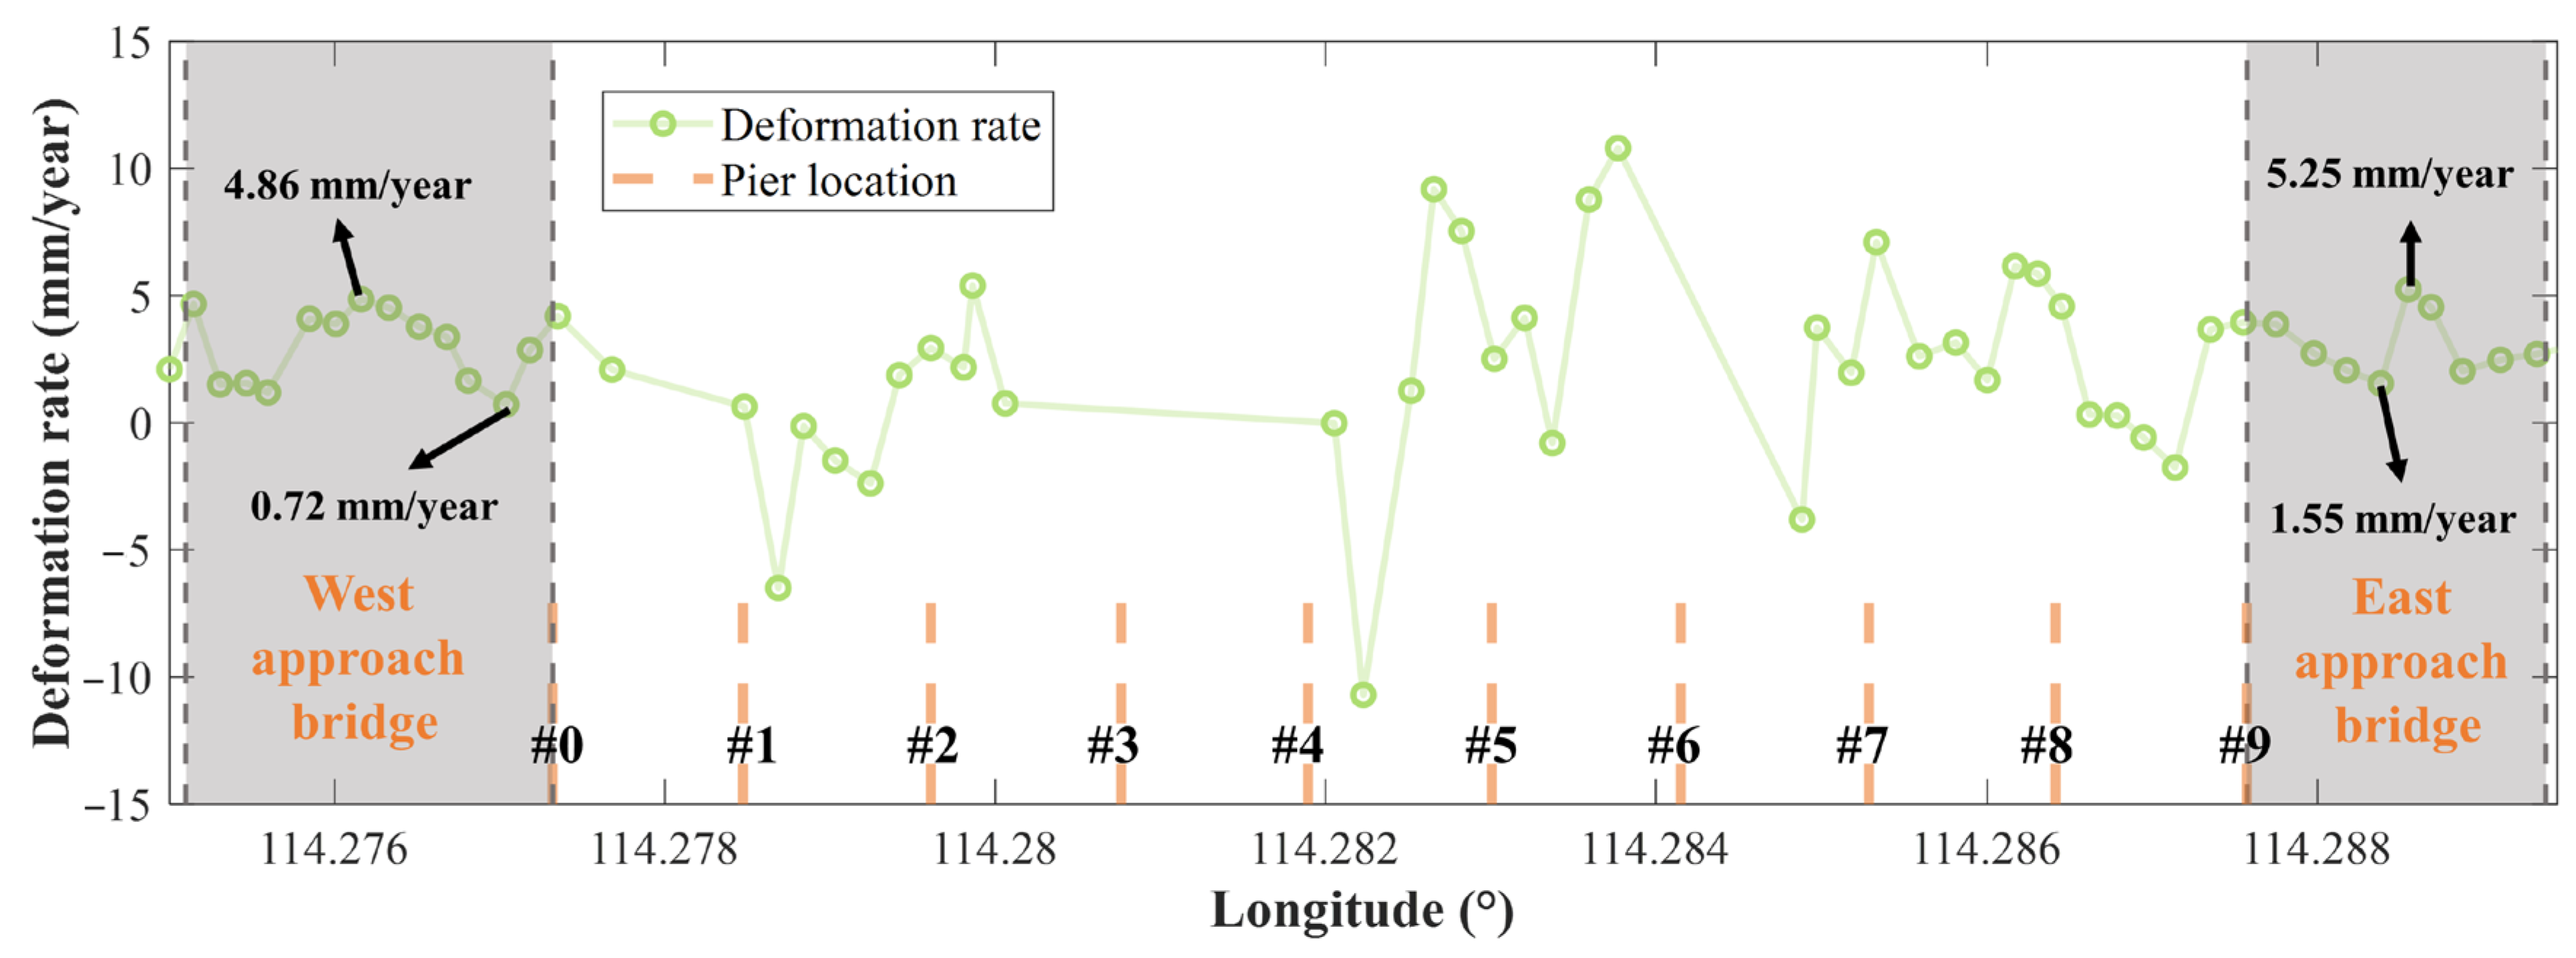
5.1. Relationship between Bridge Structure and Deformation

There are eight piers under the main body of the bridge. The simplified structure is shown in Figure 9. Among the seven characteristic chosen points, P4 is the point with the largest subsidence, with a subsidence of −37.8 mm, P5 is the point with the largest uplift, with an uplift of 37.3 mm. P4 and P5 are located in the middle of the main bridge. The central section of the bridge, being relatively distant from the bridge towers, exhibited a greater tendency for irregular deformations compared to other segments. This leads to a scenario where the central portion of the bridge experiences the most significant deformations, with alternating uplift and subsidence. This behavior can be attributed to the bridge piers, which are subject to longitudinal damping from the pile foundation and lateral restraint from the bearing system. As a result, they typically maintain a stable position between the main bridge deck’s sinking and rising [26].

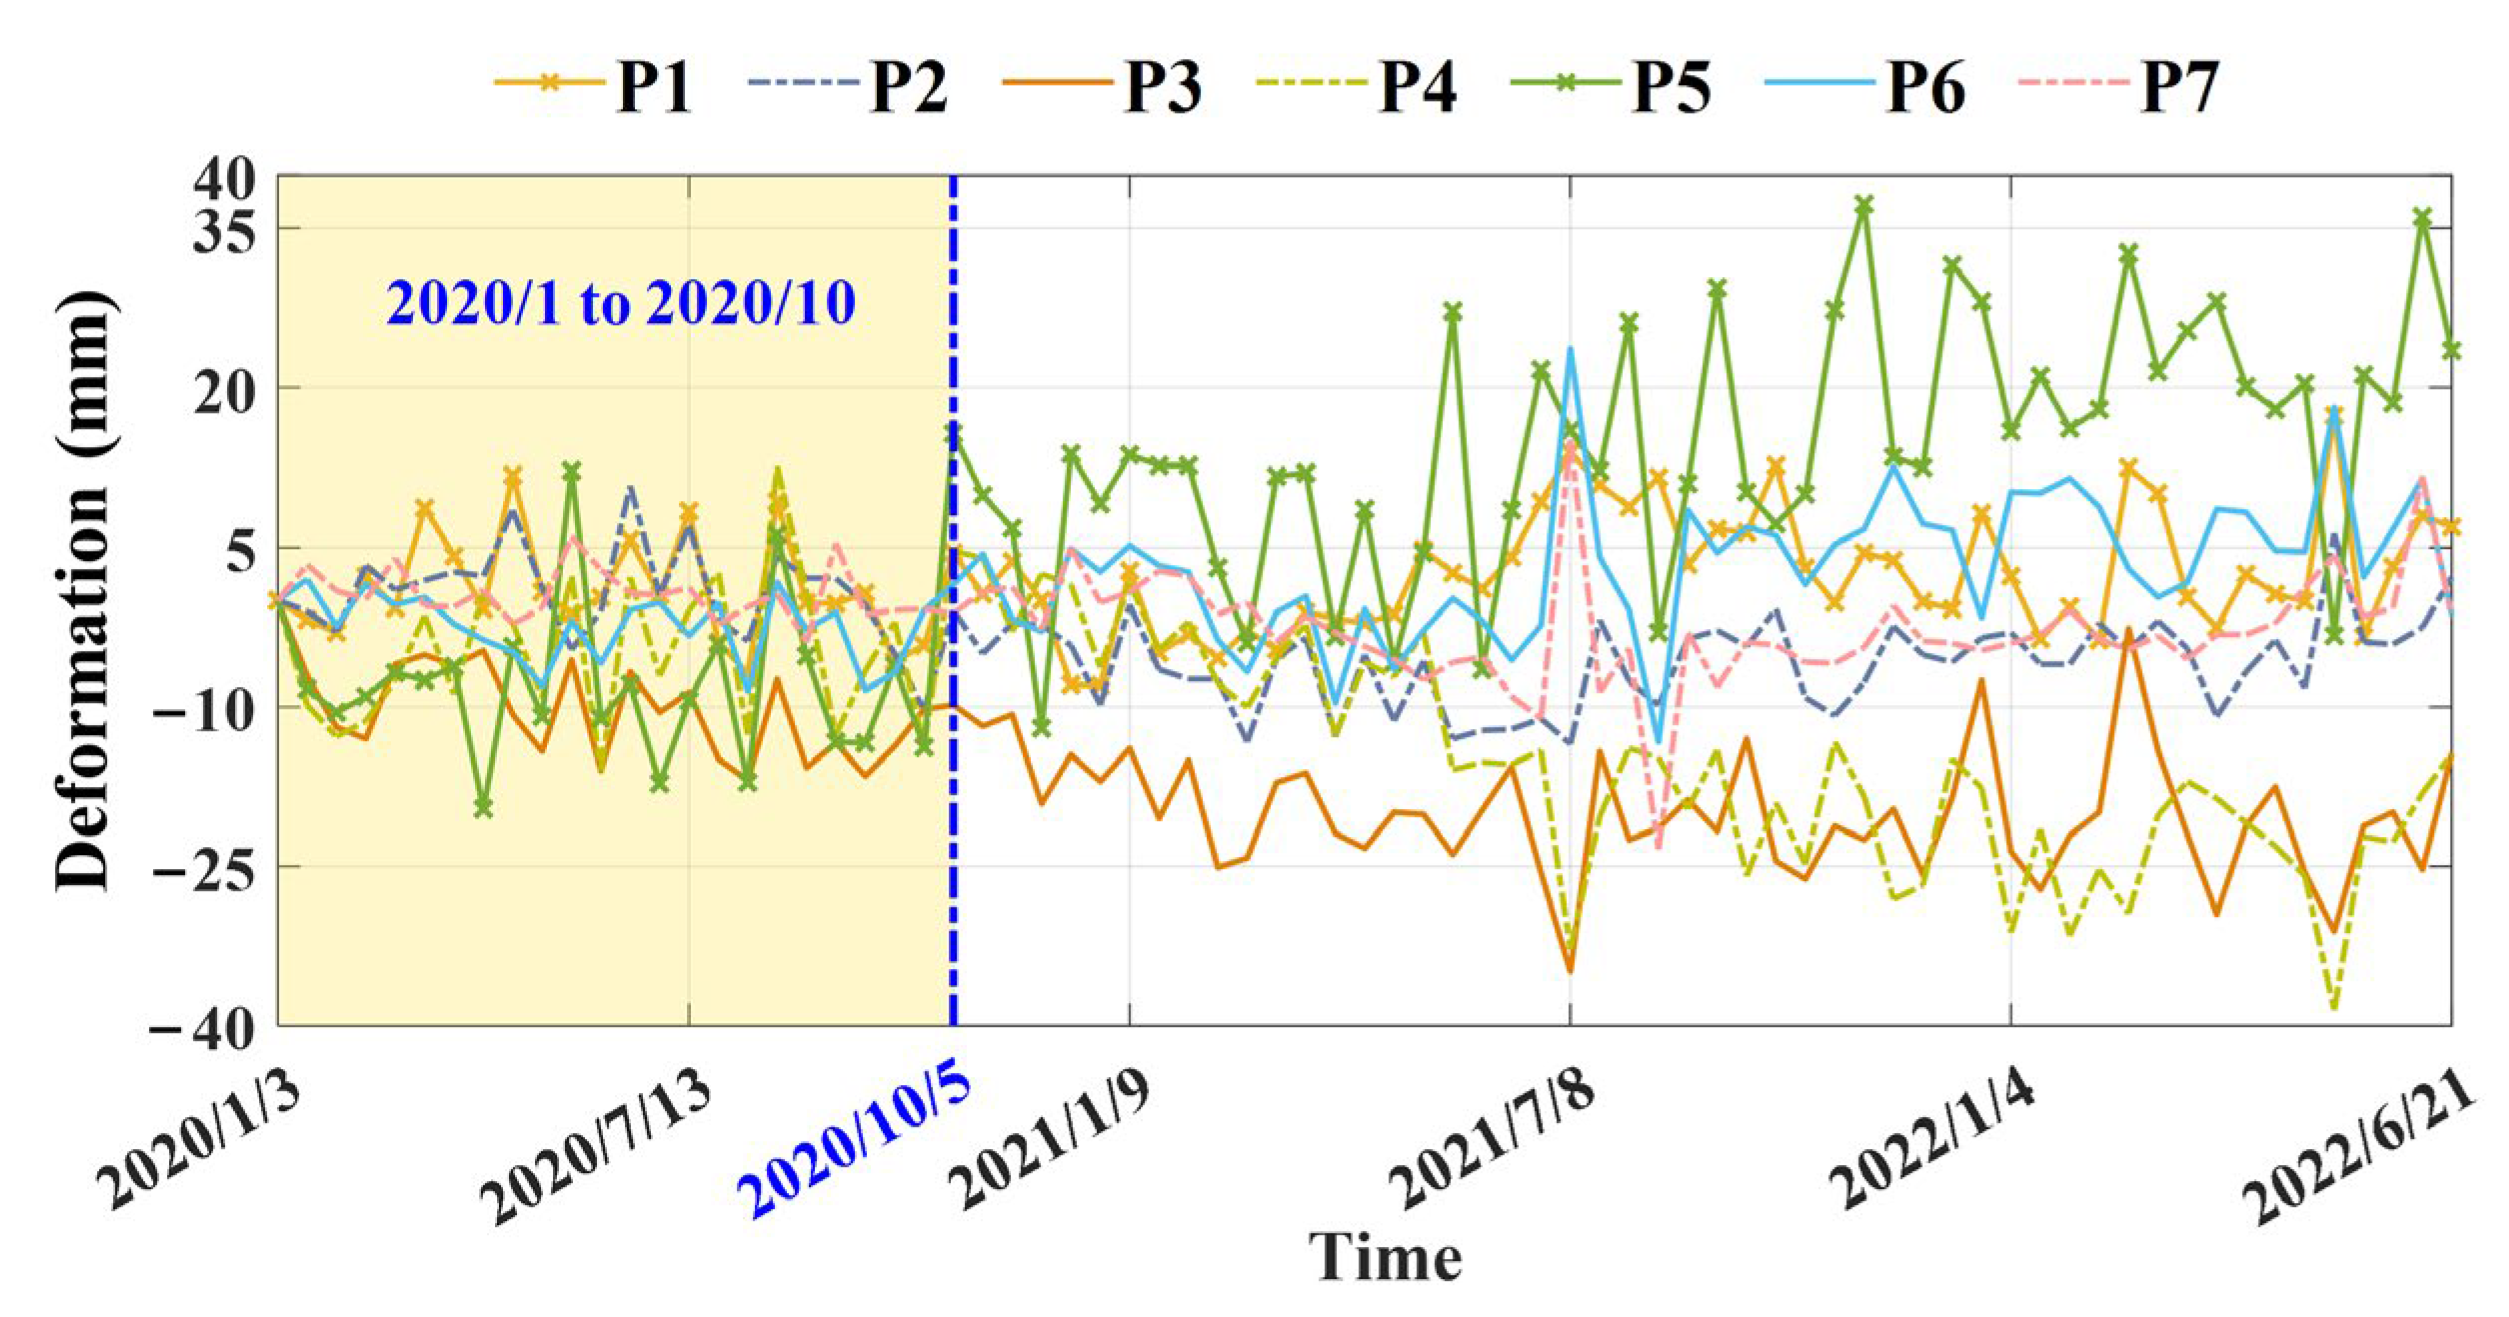
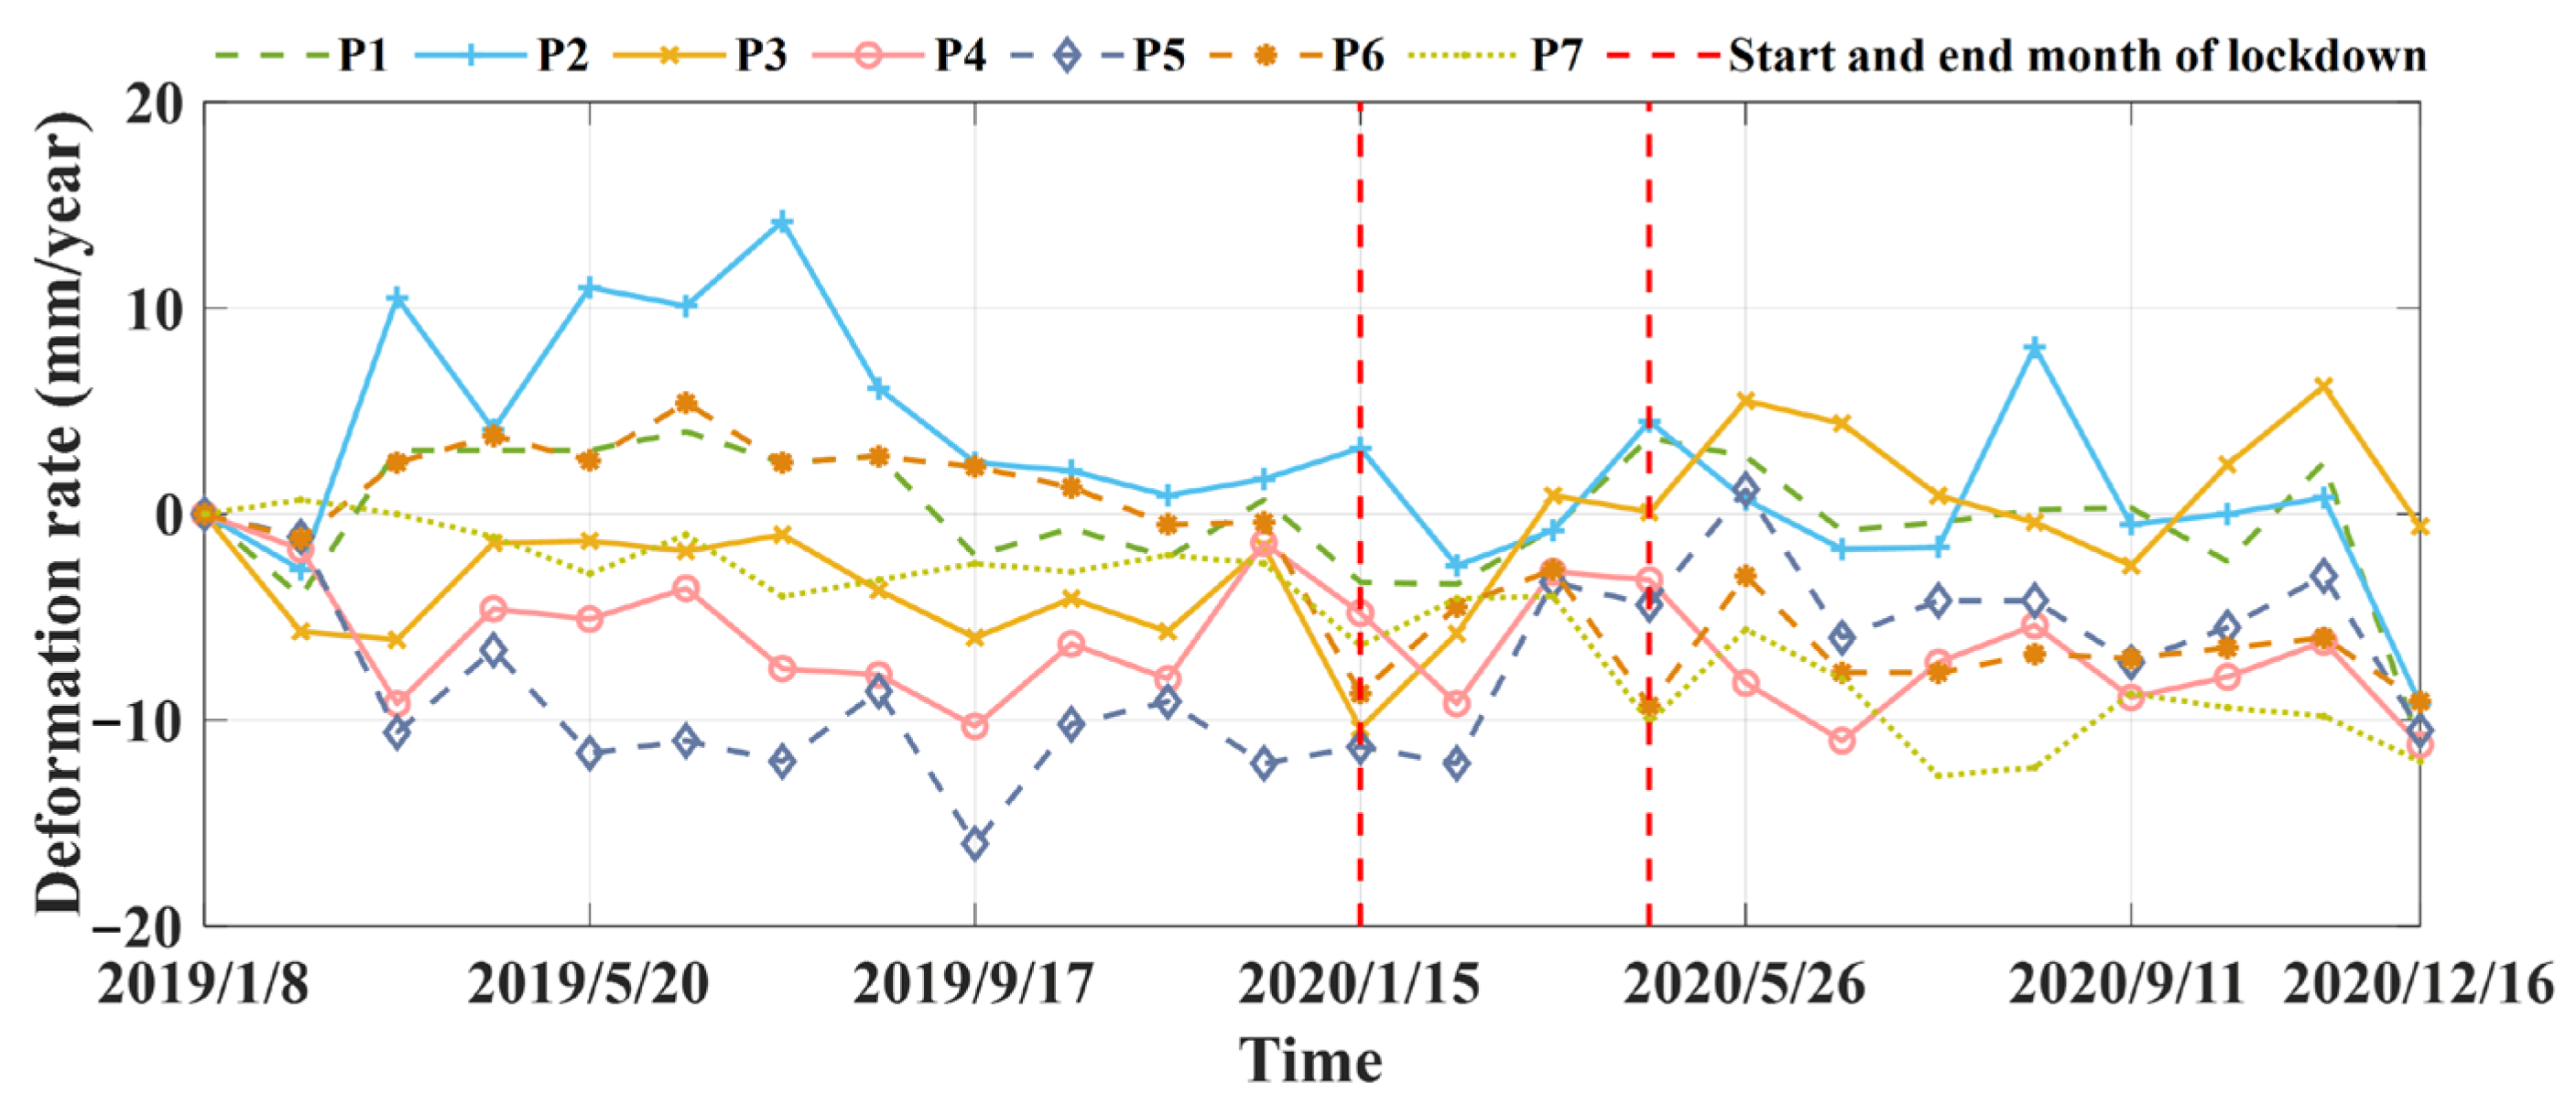
5.2. Relationship between Human Activity and Deformation

Figure 10 shows the deformation time series of the seven characteristic chosen points. Figure 10 shows that the magnitude of deformation of the characteristic points from January to September 2020 was significantly smaller than that from October 2020 to June 2022, with significant deformation starting from October 2020. The COVID-19 outbreak occurred in December 2019, with Wuhan being the hardest-hit city during the early stages of the COVID-19 pandemic. Starting at 10:00 a.m. on 23 January 2020, Wuhan suspended city bus, subway, ferry, and long-distance passenger transport services. Additionally, access from the airport and train station to Wuhan was temporarily halted. Therefore, the human activity on the bridge connecting Wuchang District and Hanyang District was greatly reduced, greatly easing the external load of the bridge. Until the second half of 2020, the epidemic situation improved, and human activity gradually returned to normal, thus the bridge deformation magnitude began to increase. Thus, it was speculated that this phenomenon has a certain relationship with the occurrence of COVID-19.
In order to verify the experimental results, we conducted a new experiment to calculate the deformation of the Wuhan Yangtze River Bridge from January 2019 to December 2020 in another seven selected characteristic points on different parts of the bridge to make a comparison before and after the epidemic, and the results are shown in Figure 11. Compared with the pre-lockdown period (January 2020), a decrease in the magnitude of each characteristic point on the bridge was clearly observed after the blockade. The overall deformation of the Wuhan Yangtze River Bridge after the beginning of epidemic has decreased compared with that before the epidemic. In the early morning of 8 April 2020, Wuhan resumed orderly external transportation, and the magnitude of deformation increased. However, due to the pandemic, human activities decreased with respect to before the pandemic, resulting in a deformation magnitude relatively smaller after the city was opened.

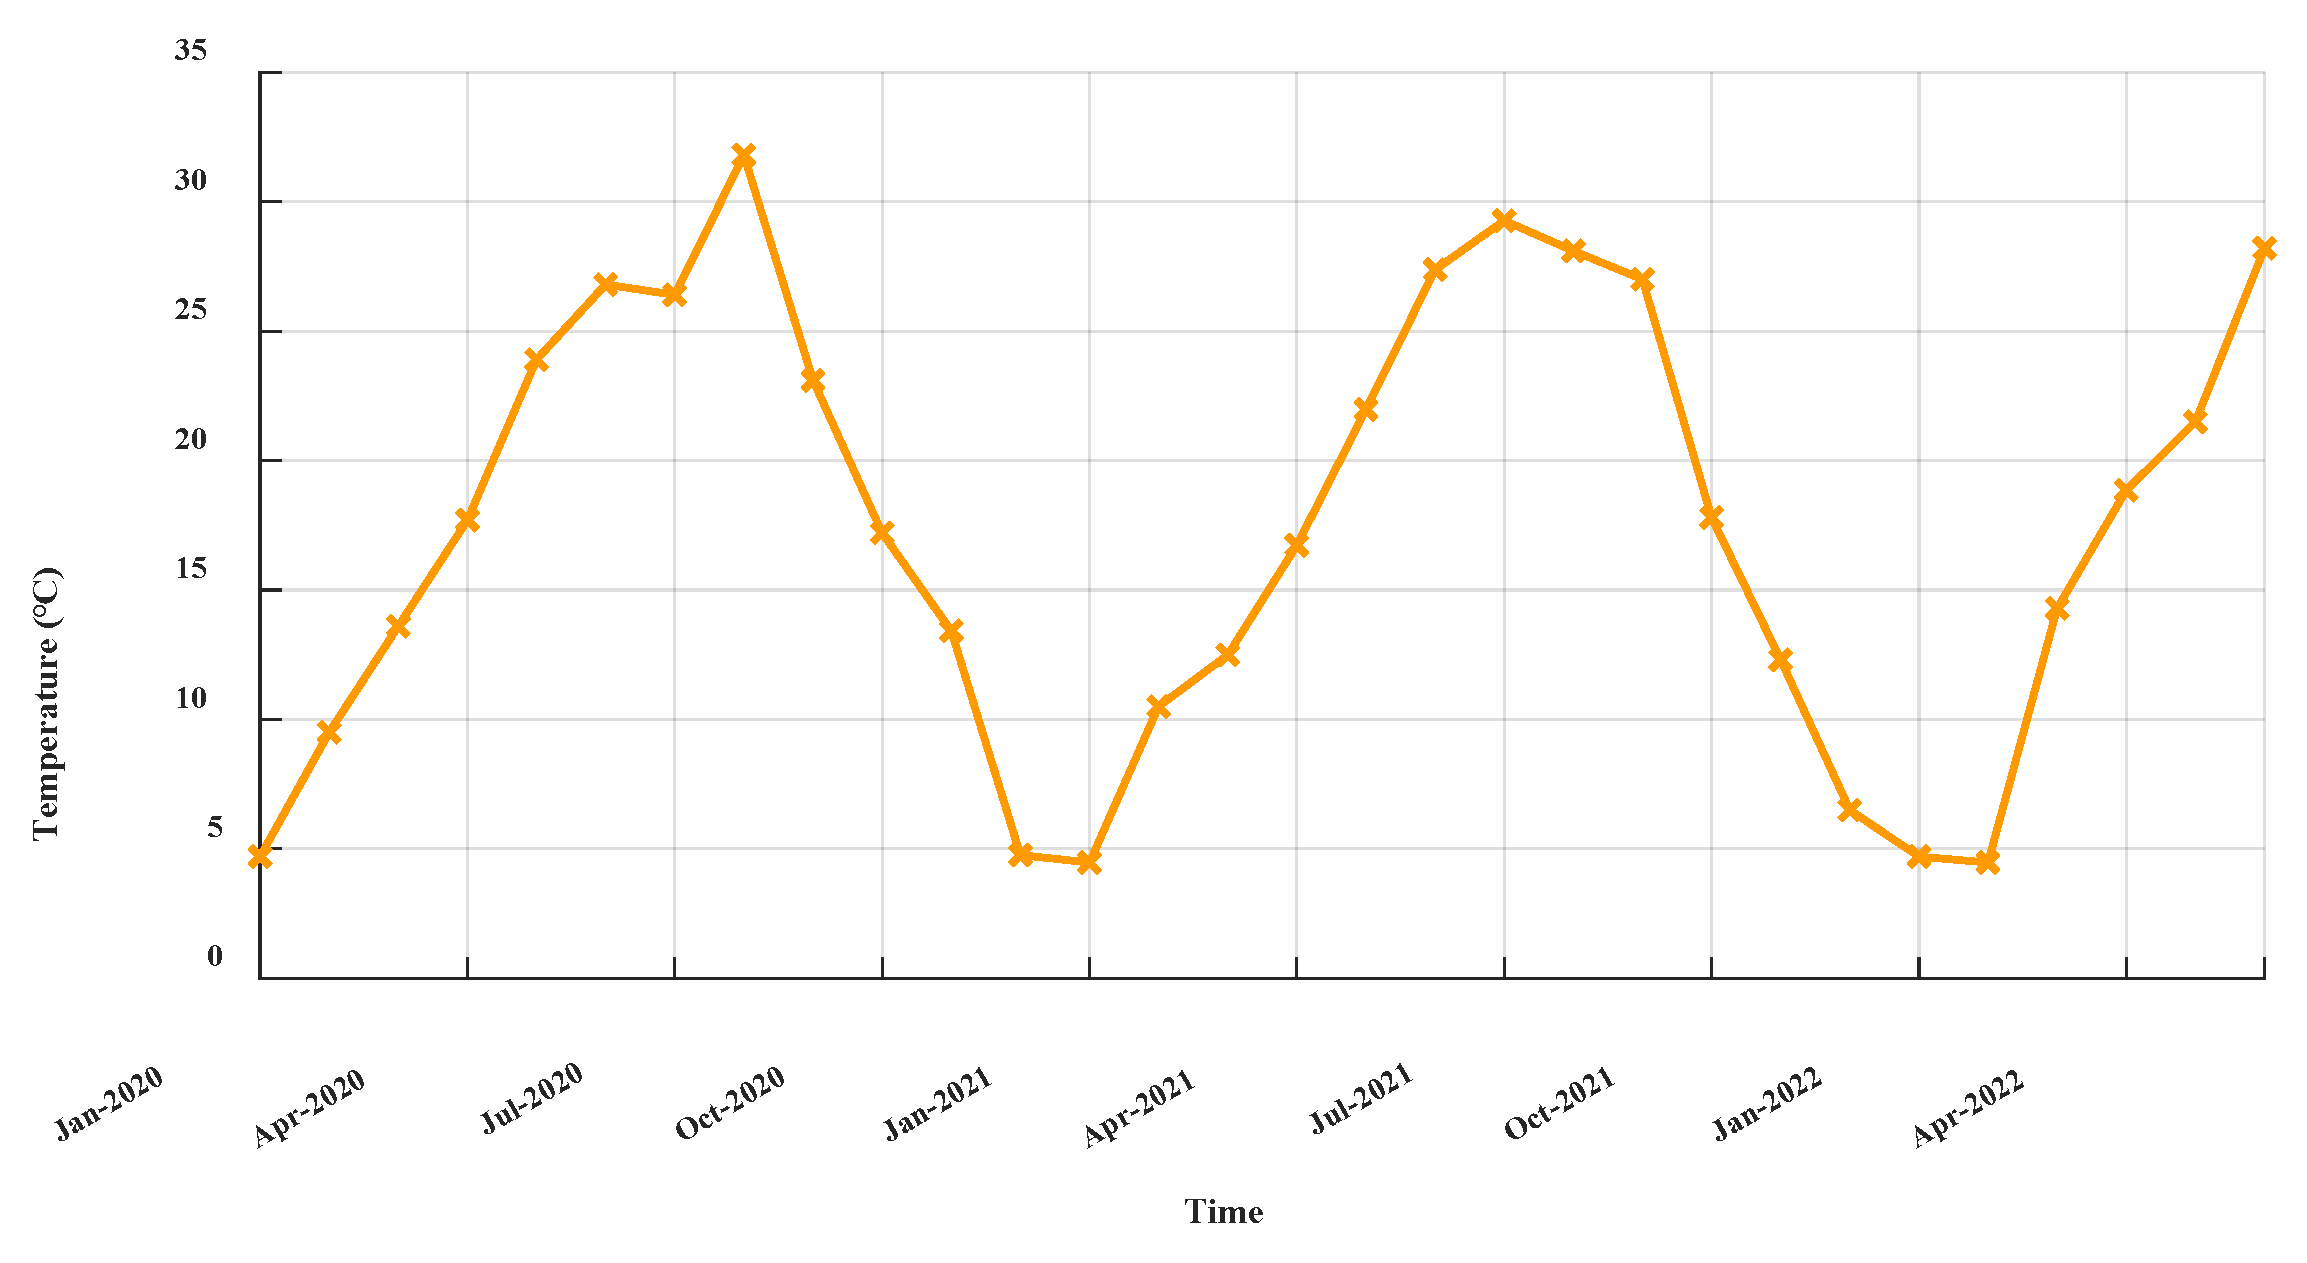
5.3. Relationship between Temperature and Deformation

A steel truss bridge is a structural form that converts a solid mesh steel plate beam bridge into an open mesh according to certain rules, resulting in a light weight and strong crossing ability. Steel truss beam bridges have a large coefficient of temperature expansion and are sensitive to temperature changes. The geometric shape and internal force state of the bridge structure are closely related to temperature changes [27].
The monthly average temperature from January 2020 to June 2022 is shown in Figure 12. The temperature during the period was 4.5~31.8 °C, showing a relatively obvious seasonality. In order to correlate the dimensions of deformation and temperature during the study period, the temperature data were interpolated, as shown in Figure 13. The interpolated temperature was plotted against the deformations of P1–P7, and it can be observed that only P1 and P2 showed a positive correlation with temperature.
The Spearman correlation coefficient can not only respond to linear correlations but also detect nonlinear monotonic relationships [28]. Therefore, we calculated the Spearman correlation coefficients of temperature and the seven characteristic points, and the results are shown in Table 3. The calculated results were basically consistent with the comparison results shown in Figure 13, but the overall correlations were all weak. It must be considered that an influencing factor could be due to the temperature data being sourced from a meteorological station located 15.5 km away from the bridge, which may not accurately represent the temperature on the bridge itself, therefore having a certain impact on the results. Currently, we observed a clear positive temperature–deformation correlation for only a portion of the Wuhan Yangtze River Bridge. However, further quantification of this relationship will require the use of more precise temperature data in the future for verification.

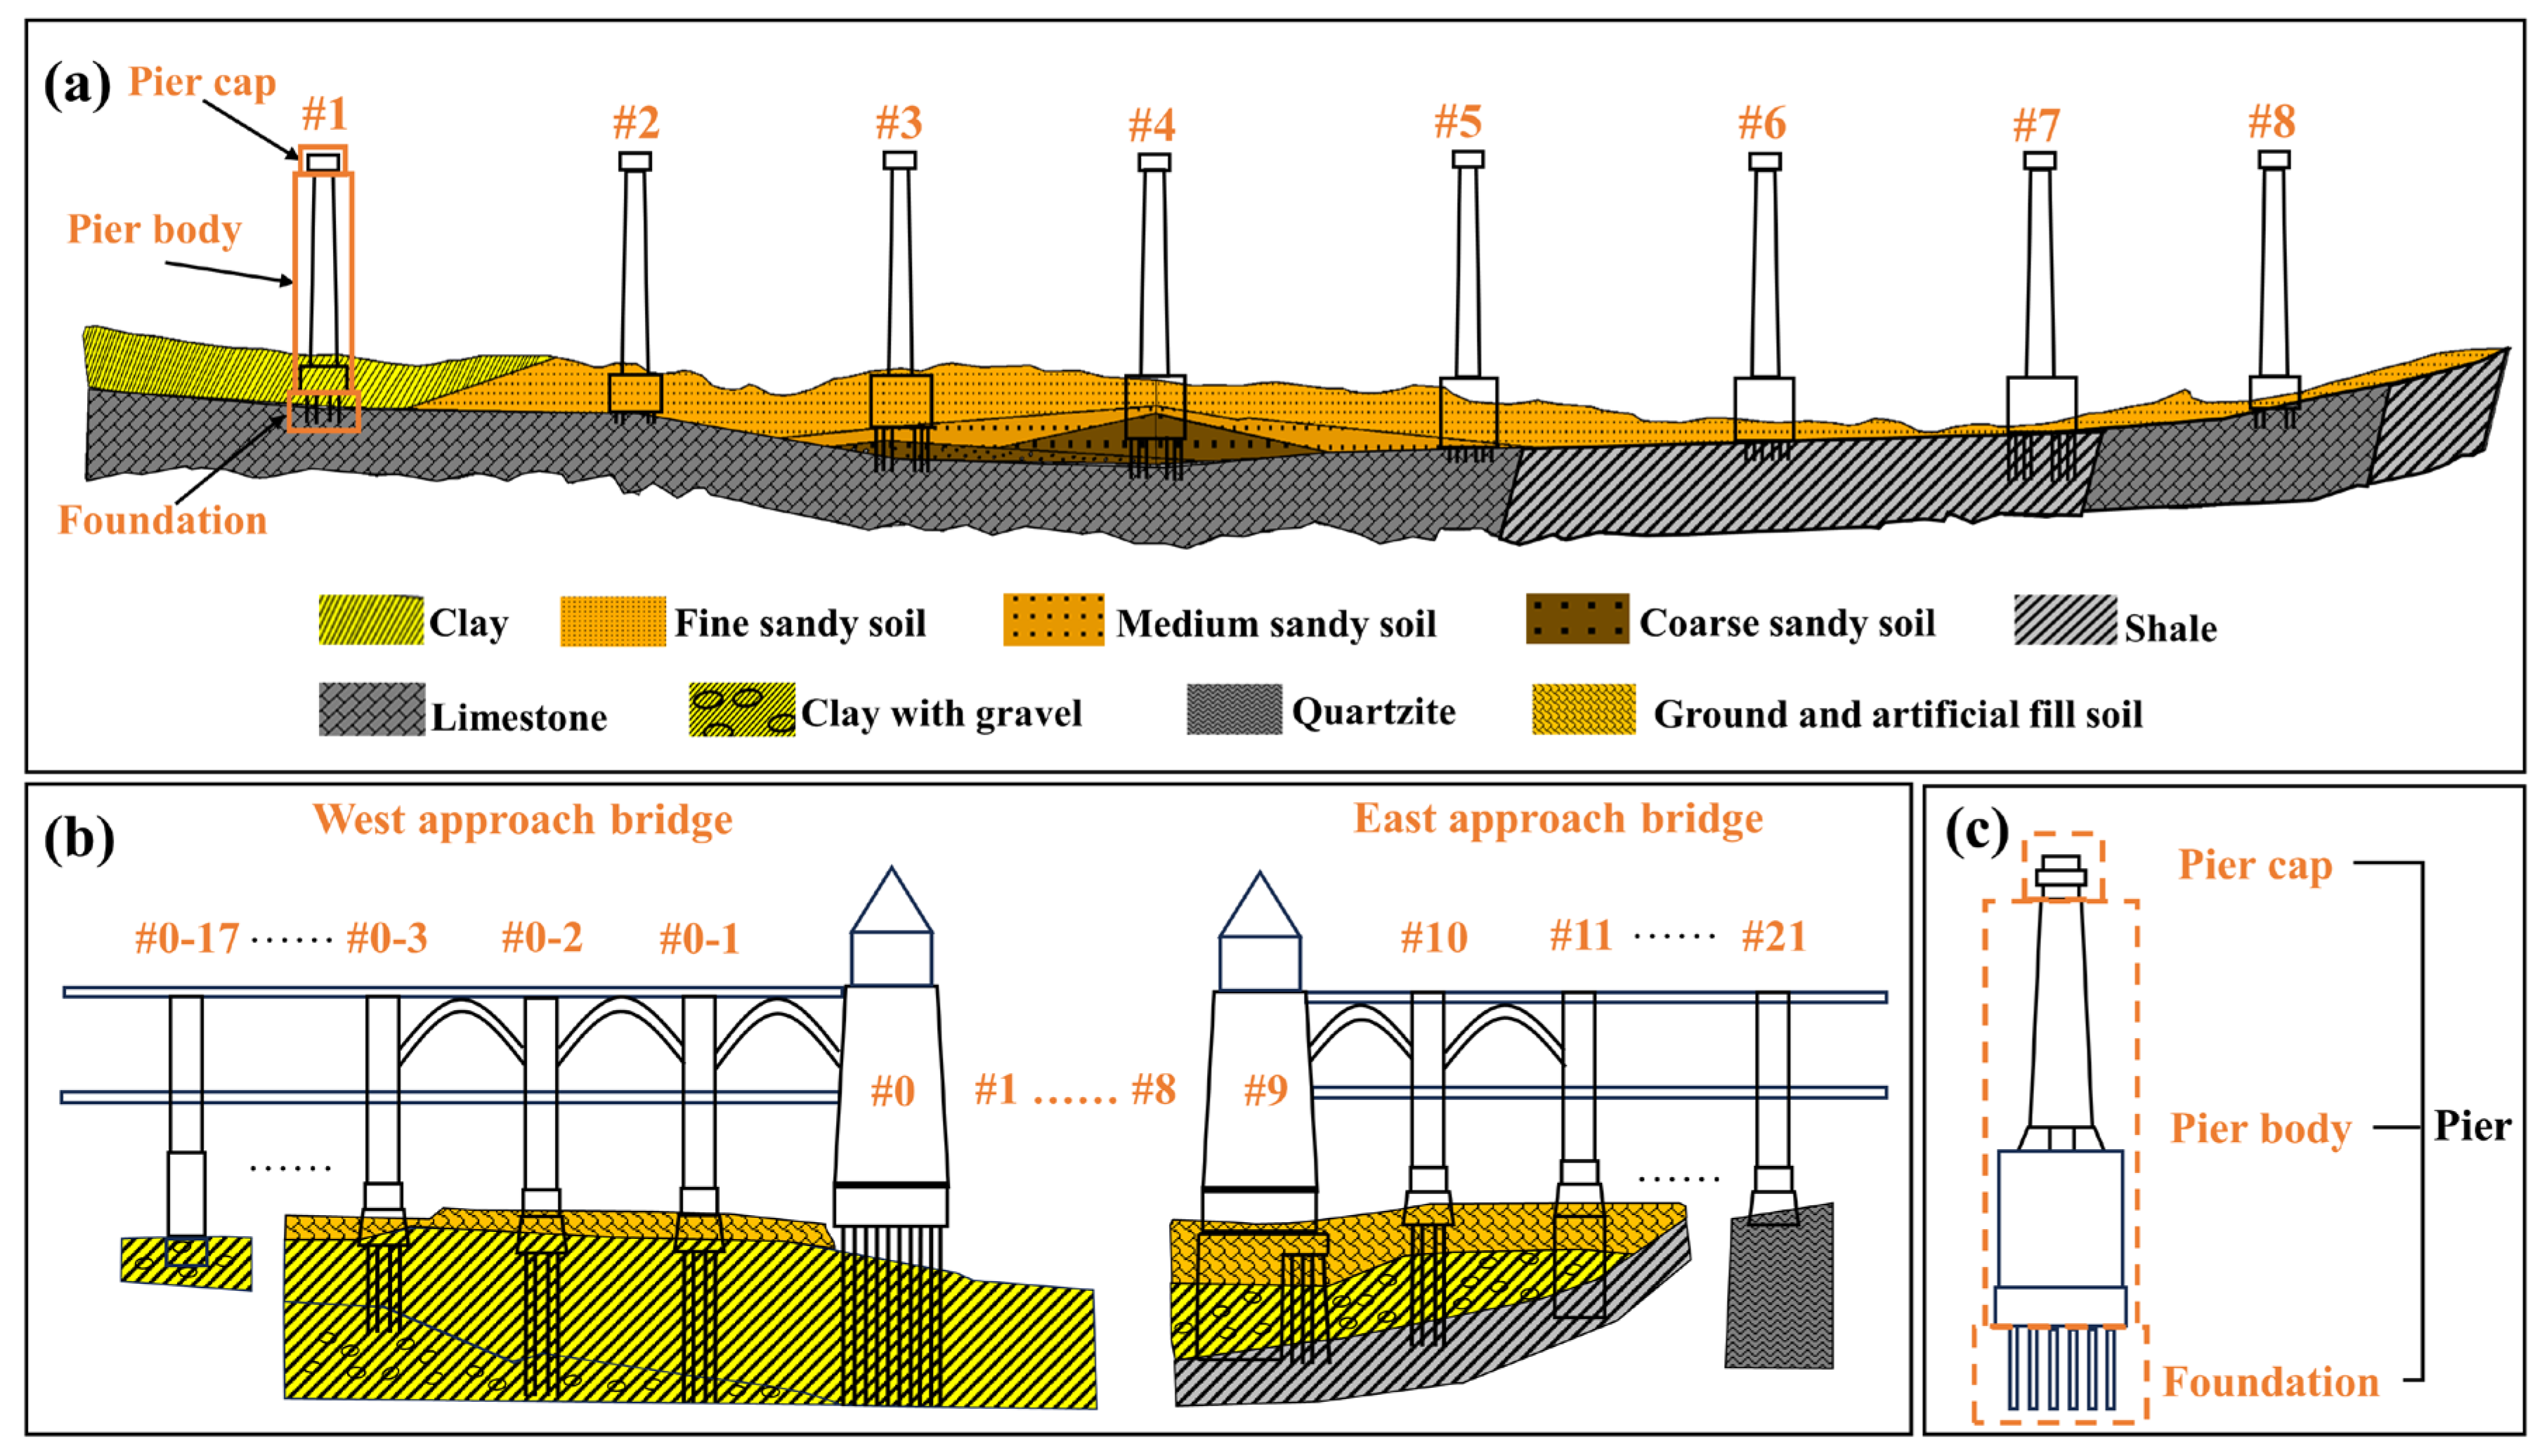
5.4. Relationship between Stratigraphy under the Bridge and Deformation

Based on the drawings of the Wuhan Yangtze River Bridge provided by China Railway Major Bridge Engineering Group Co., Ltd., we reconstructed the stratigraphic cross-sections and the diagram illustrating the bridge pier composition of Figure 14. The bridge pier includes the pier cap, pier body, and foundation. The stratigraphy is complex, mainly composed by clay, clay with gravel, sandy soil, limestone, shale, quartzite and artificial fill soil. Nos. 1–5 piers are built on limestone, Nos. 6–7 piers are built on shale, No. 8 pier is built on limestone, No. 0 pier of the west approach bridge is built on clay, Nos. 0–1~0–17 piers are built on clay with gravel, No. 9–11 piers of the east approach bridge are built on shale, and No. 12–21 piers are built on quartzite. Shale, limestone, and quartzite have typically good geotechnical properties, showing excellent load-bearing capacity. Clay has high water content, large void ratio, low strength, poor permeability, and slow consolidation rate under self-weight or load [29]. Clay has greater compressibility than shale, limestone, and quartzite, which means that clay soils are more susceptible to reversible or irreversible volume changes when subjected to external pressure or loading, and therefore bridge sections constructed on clay are presumably more susceptible to subsidence. Clay with gravel may still lead to subsidence of the bridge, but the gravel can enhance the load-bearing capacity.
Considering a west to east profile line of the Wuhan Yangtze River Bridge, Figure 15 shows the deformation rates at points along the profile line. The deformation rates along the west approach bridge range from 0.72 to 4.86 mm/year, while the deformation rates along the east approach bridge range from 1.55 to 5.25 mm/year. In other words, Nos. 9–21 piers, which were built on shale and quartzite, like that of No. 0 pier, which was built on highly compressible clay and Nos. 0–1~0–17 piers, which were built on clay with gravel, do not show any subsidence. Instead, the deformations are more pronounced along the main bridge (in particular, points close to piers No. 1, No. 4 and No. 7 show a subsiding trend), which is built on shale and limestone. This implies that the deformations are presumably absorbed by the structure of the bridge, which is able to accommodate or compensate for the sinking. Our results show no significant sinking for piers built on highly compressible soils and no significant deformation for piers built on rock.
The Wuhan Yangtze River Bridge was put into service in 1957 and has been in operation for 67 years. Nevertheless, our analysis showed a general steadiness of the bridge, but a regular maintenance plan should be established, which includes routine inspections, monitoring and preservation/reinforcing interventions, to ensure the long-term stability of the structure.

6. Conclusions

We used Sentinel-1A data to monitor the deformation of the Wuhan Yangtze River Bridge by means of SBAS InSAR technology. The contribution factors of deformation and the deformation mode of the Wuhan Yangtze River Bridge were explored. In particular, we analyzed the InSAR data in comparison with bridge structure, human activities, temperature and stratigraphy. The main conclusions are as follows:
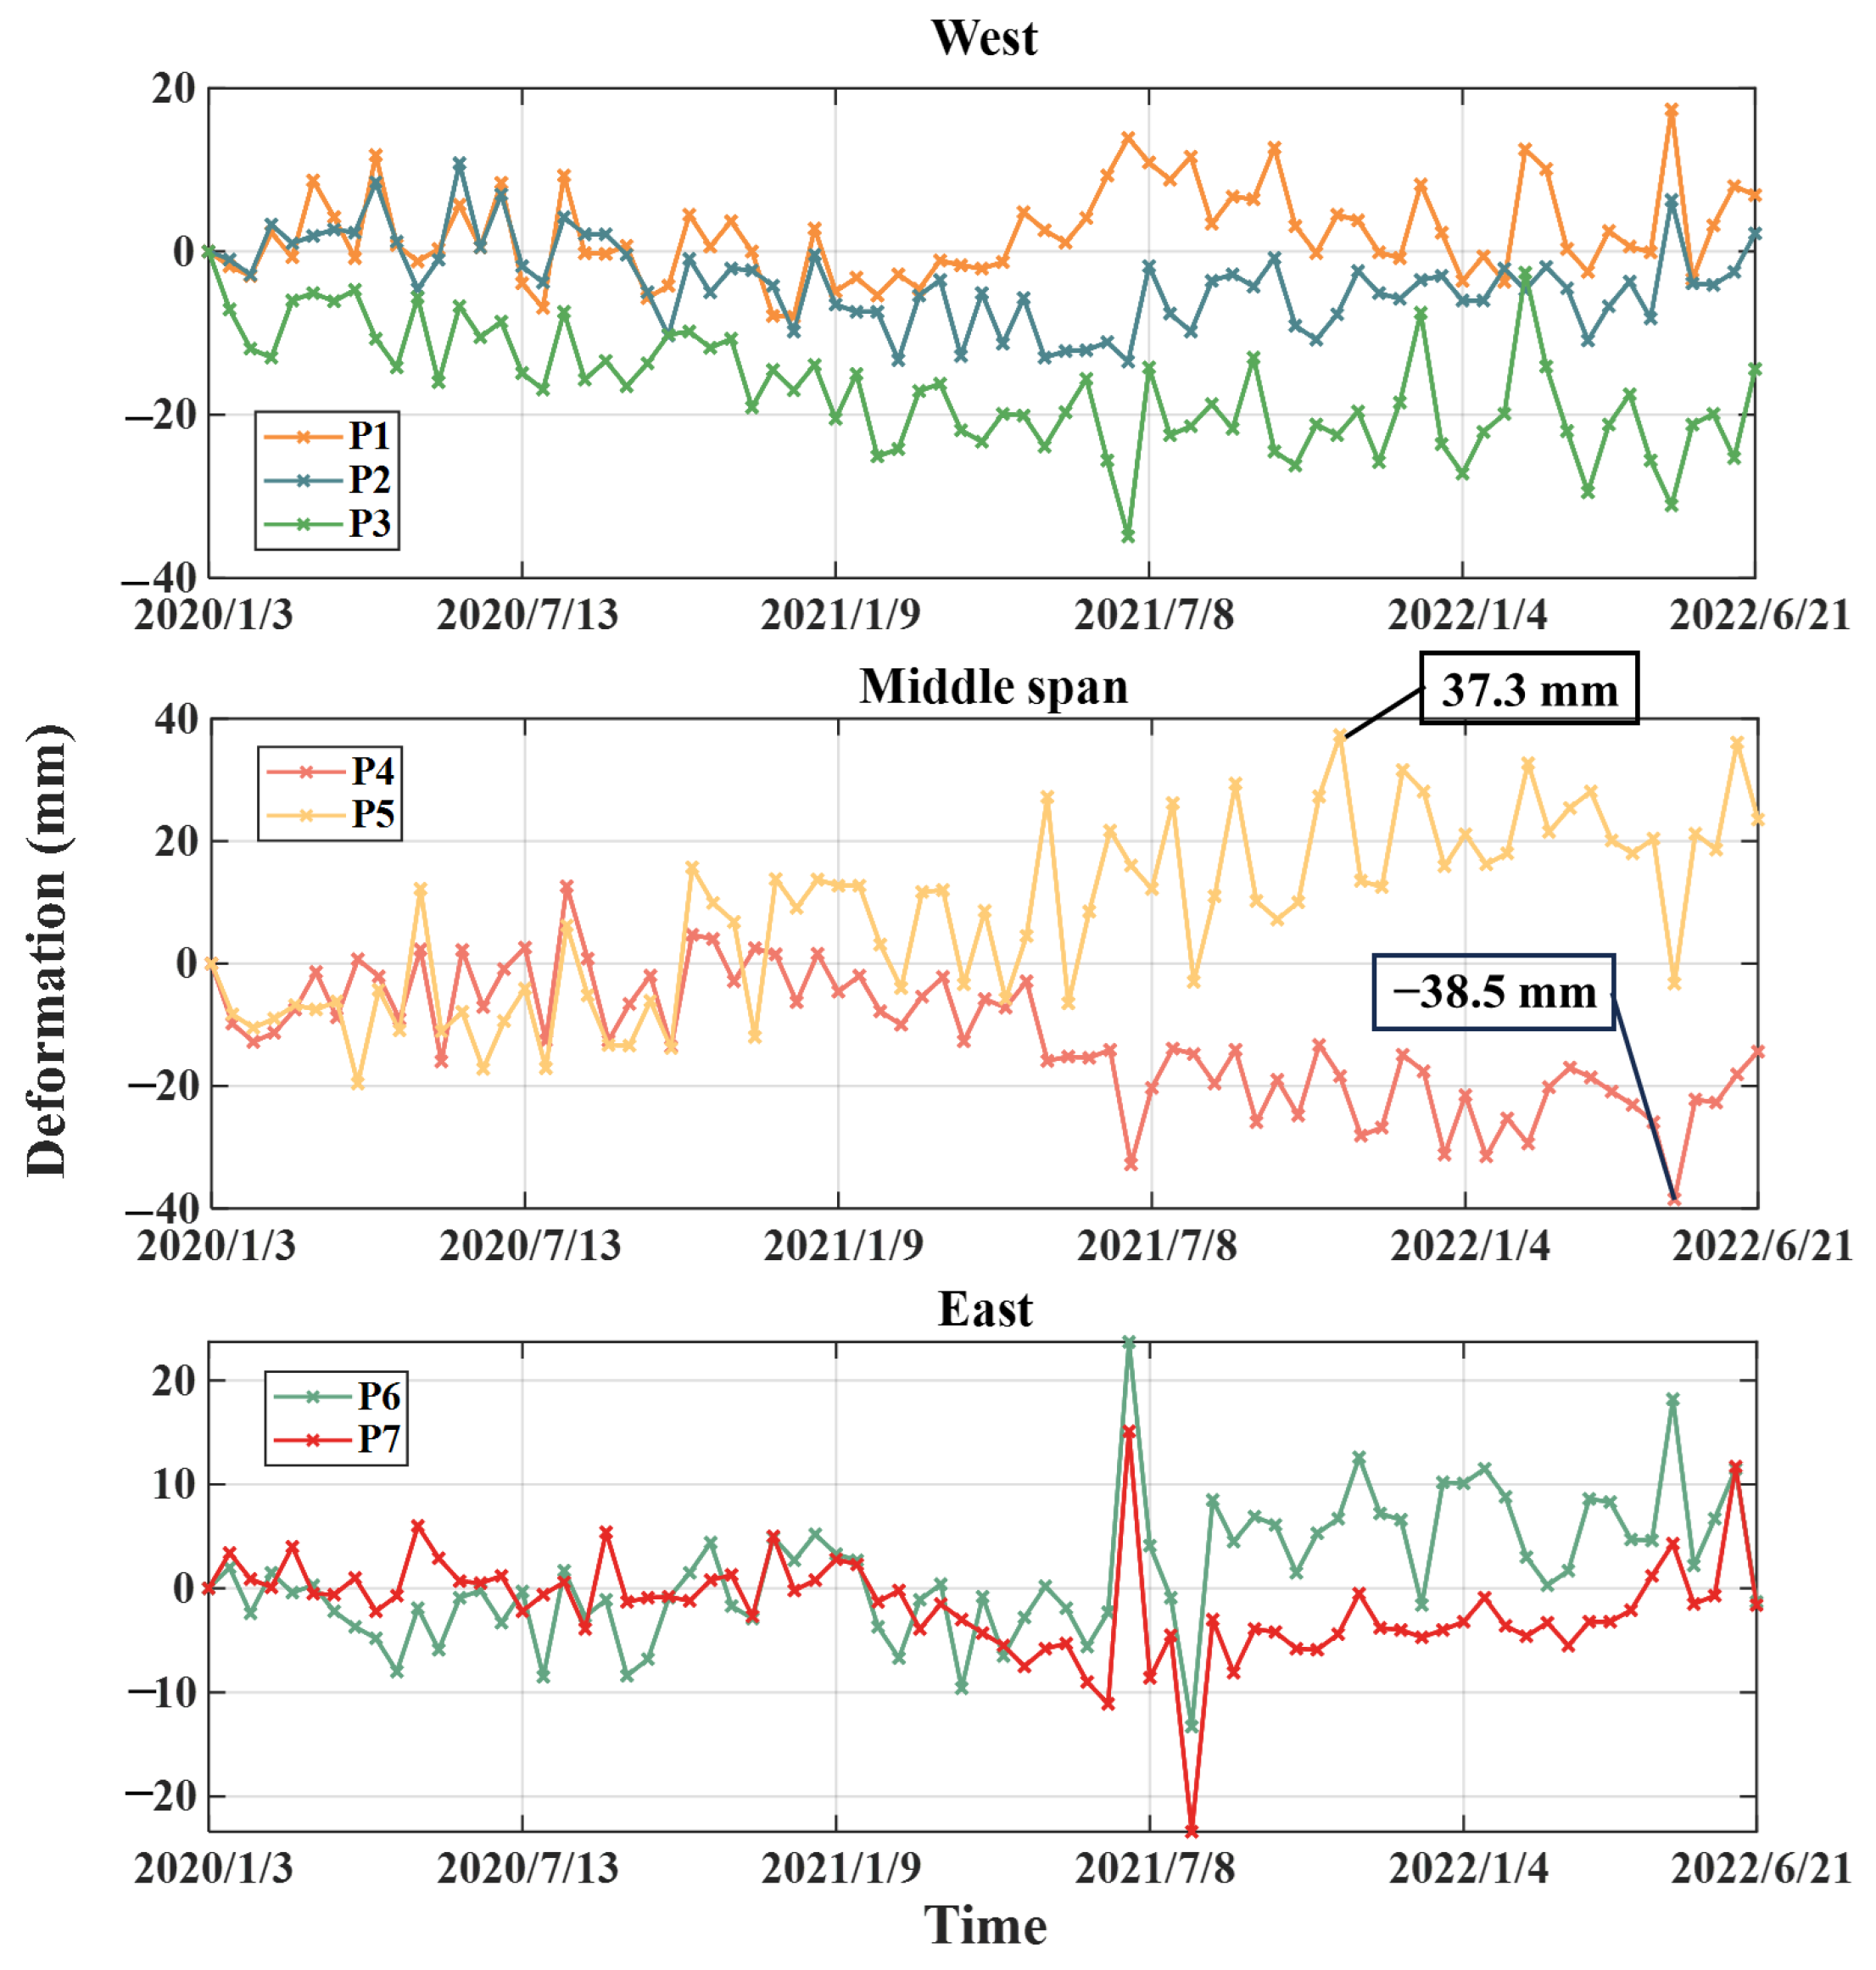
  • The SBAS-InSAR results indicate a vertical deformation rate for the Wuhan Yangtze River Bridge and area around the bridge ranging from −18.2 to 15.4 mm/year. While the vertical deformation rate of the bridge structure remains relatively modest (−15.6 to 10.7 mm/year), during the study period, the maximum uplift and lowering values recorded were 37.3 mm and −38.5 mm, part of the deformation belonging to rebound deformation.
  • According to the experimental results, it was found that the lowering and uplifting of the Wuhan Yangtze River Bridge body occurred alternately.
  • By analyzing the deformation time series of characteristic points, it can be inferred that the reduction in human activity is the reason for the lower deformation amplitude from January to October 2020 compared to after October 2020.
  • After comparing the deformation of characteristic points with the temperature data of meteorological stations located 15.5 km apart from the bridge, a positive correlation was found for only a portion of the bridge.
  • By analyzing the deformation rates along the Wuhan Yangtze River Bridge, it was found that there is no significant settlement for piers built on highly compressible soils and no significant deformation for piers built on rock. This implies that the observed deformations are presumably absorbed by the structure. In conclusion, there is no direct correlation between observed sinkings and stratigraphy under the bridge piers.

Author Contributions

All authors contributed to the manuscript. C.W. and L.Z. proposed the idea of this work, they were inspired by their previous bridge research work and proposed this work. C.W. processed and analyzed the InSAR data and contributed to the manuscript. L.Z. analyzed the time series deformation of the bridge. X.L. provided feedback and revised the manuscript. J.Q. provided access to temperature data. J.Q. and J.M. analyzed the effect of temperature on bridge deformation. L.Z. and Z.L. made a critical comment on the manuscript. L.L. also revised the manuscript. In addition, J.M. provided the information and photos from the field survey of the Wuhan Yangtze River Bridge, which facilitated a better understanding of the bridge structure. All authors have read and agreed to the published version of the manuscript.

Funding

This work was supported by the National Natural Science Foundation of China (Grant No. 42264004), the Open Fund of Hubei Luojia Laboratory (Grant No. 230100018) and the Guangxi Universities’ 1000 Young and Middle-aged Backbone Teachers Training Program.

Institutional Review Board Statement

Not applicable.

Informed Consent Statement

Not applicable.

Data Availability Statement

Data are openly available in the public repository.

Acknowledgments

The authors thank the China Railway Major Bridge Engineering Group Co., Ltd. for providing information of the Wuhan Yangtze River Bridge; the Copernicus Program (https://www.copernicus.eu (accessed on 18 February 2023)) of the European Space Agency (ESA) for freely supplying Sentinel-1A SAR images; the National Aeronautics and Space Administration (NASA) for providing the Shuttle Radar Topography Mission digital elevation model (SRTM DEM; https://earthexplorer.usgs.gov (accessed on 18 February 2023)); the National Meteorological Science Data Center for providing the temperature data (http://data.cma.cn/ (accessed on 18 February 2023)).

Conflicts of Interest

Author Jie Qin was employed by Natural resources and real estate registration center of Guangxi Zhuang Autonomous Region, author Jun Ma was employed by China Railway Siyuan Survey and Design Group Co., Ltd. The remaining authors declare that the research was conducted in the absence of any commercial or financial relationships that could be construed as a potential conflict of interest. The funders had no role in the design of the study; in the collection, analyses, or interpretation of data; in the writing of the manuscript; or in the decision to publish the results.

References

  1. Guo, M.W.; Dong, X.C.; Yang, Z. Settlement analysis of the giant open caisson during the construction of the Changtai Yangtze River Bridge. Front. Earth Sci. 2023, 10, 1056695. [Google Scholar] [CrossRef]
  2. Wang, C.; Zhou, L.; Ma, J.; Shi, A.; Li, X.; Liu, L.; Zhang, Z.; Zhang, D. GB-RAR Deformation Information Estimation of High-Speed Railway Bridge in Consideration of the Effects of Colored Noise. Appl. Sci. 2022, 12, 10504. [Google Scholar] [CrossRef]
  3. Ni, Y.Q.; Wang, Y.W.; Zhang, C. A Bayesian approach for condition assessment and damage alarm of bridge expansion joints using long-term structural health monitoring data. Eng. Struct. 2020, 212, 110520. [Google Scholar] [CrossRef]
  4. Zhu, S.; Levinson, D.; Liu, H.; Harder, K. The traffic and behavioral effects of the I-35W Mississippi River bridge collapse. Transp. Res. Part A Policy Pract. 2010, 10, 771–784. [Google Scholar] [CrossRef]
  5. Milillo, P.; Giardina, G.; Perissin, D.; Milillo, G.; Coletta, A.; Terranova, C. Pre-Collapse Space Geodetic Observations of Critical Infrastructure: The Morandi Bridge, Genoa, Italy. Remote Sens. 2019, 12, 1403. [Google Scholar] [CrossRef]
  6. Long, S.; Liu, W.; Ma, J.; Tong, A.; Wu, W.; Zhu, C. Health monitoring and safety evaluation of bridge dynamic load with a ground-based real aperture radar. Surv. Rev. 2021, 91, 172–186. [Google Scholar] [CrossRef]
  7. Beshr, E.W. Structural deformation monitoring and analysis of highway bridge using accurate geodetic techniques. Engineering 2015, 8, 488–498. [Google Scholar] [CrossRef]
  8. Cusson, D.; Trischuk, K.; Hébert, D.; Hewus, G.; Gara, M.; Ghuman, P. Satellite-Based InSAR Monitoring of Highway Bridges: Validation Case Study on the North Channel Bridge in Ontario, Canada. Transp. Res. Rec. 2018, 2672, 76–86. [Google Scholar] [CrossRef]
  9. Yi, T.H.; Li, H.N.; Gu, M. Recent research and applications of GPS based technology for bridge health monitoring. Sci. China Technol. Sci. 2010, 10, 2597–2610. [Google Scholar] [CrossRef]
  10. Beshr, E.W.; Kaloop, M.R. Monitoring bridge deformation using auto-correlation adjustment technique for total station observations. Positioning 2013, 4, 28338. [Google Scholar] [CrossRef]
  11. Liu, X.; Wang, P.; Lu, Z.; Gao, K.; Wang, H.; Jiao, C.; Zhang, X. Damage Detection and Analysis of Urban Bridges Using Terrestrial Laser Scanning (TLS), Ground-Based Microwave Interferometry, and Permanent Scatterer Interferometry Synthetic Aperture Radar (PS-InSAR). Remote Sens. 2019, 11, 580. [Google Scholar] [CrossRef]
  12. Ferretti, A.; Prati, C.; Rocca, F. Permanent scatterers in SAR interferometry. IEEE Trans. Geosci. Remote Sens. 2001, 1, 8–20. [Google Scholar] [CrossRef]
  13. Hanssen, R.F. Satellite radar interferometry for deformation monitoring: A priori assessment of feasibility and accuracy. Int. J. Appl. Earth Obs. Geoinf. 2005, 6, 3–4. [Google Scholar] [CrossRef]
  14. Di Martino, G.; Esposito, M.; Festa, B.; Lodice, A.; Mancini, L.; Poreh, D.; Riccio, D.; Ruello, G. Railway Bridge Monitoring with Sar: A Case Study. In Proceedings of the IEEE IGARSS2018—2018IEEE International Geoscience and Remote Sensing Symposium, Valencia, Spain, 22 July 2018. [Google Scholar]
  15. Huang, Q.H.; Xie, X.Y.; Fan, H.T. Interferometric Deformation Monitoring Method and Application of Spaceborne/Ground-Based Radar, 1st ed.; Science Press: Beijing, China, 2014; pp. 1–5. [Google Scholar]
  16. Castellazzi, P.; Garfias, J.; Martel, R.; Brouerd, C.; Rivera, A. InSAR to support sustainable urbanization over compacting aquifers: The case of Toluca Valley, Mexico. Int. J. Appl. Earth Obs. Geoinf. 2017, 63, 33–44. [Google Scholar] [CrossRef]
  17. Huang, Q.H.; Crosetto, M.; Monserrat, O.; Crippa, B. Displacement monitoring and modelling of a high-speed railway bridge using C-band Sentinel-1 data. ISPRS-J. Photogramm. Remote Sens. 2017, 128, 204–211. [Google Scholar] [CrossRef]
  18. Zhang, L.; Sun, Q.; Hu, J. Potential of TCPInSAR in Monitoring Linear Infrastructure with a Small Dataset of SAR Images: Application of the Donghai Bridge, China. Appl. Sci. 2018, 8, 425. [Google Scholar] [CrossRef]
  19. Zhao, J.; Wu, J.; Ding, X.; Wang, M. Elevation Extraction and Deformation Monitoring by Multitemporal InSAR of Lupu Bridge in Shanghai. Remote Sens. 2017, 9, 897. [Google Scholar] [CrossRef]
  20. Berardino, P.; Fornaro, G.; Lanari, R.; Sansosti, E. A new algorithm for surface deformation monitoring based on small baseline differential SAR interferograms. IEEE Trans. Geosci. Remote Sens. 2002, 11, 2375–2383. [Google Scholar] [CrossRef]
  21. Ma, J. BDS/GPS deformation analysis of a long-span cable-stayed bridge based on colored noise filtering. Geod. Geodyn. 2023, 14, 163–171. [Google Scholar] [CrossRef]
  22. Zhao, Y.Z.; Zhou, L.; Wang, C.; Li, J.H.; Qin, J.; Sheng, H.Q.; Huang, L.K.; Li, X. Analysis of the Spatial and Temporal Evolution of Land Subsidence in Wuhan, China from 2017 to 2021. Remote Sens. 2022, 14, 3142. [Google Scholar] [CrossRef]
  23. Xu, Y.; Li, T.; Tang, X.; Zhang, X.; Fan, H.; Wang, Y. Research on the Applicability of DInSAR, Stacking-InSAR and SBAS-InSAR for Mining Region Subsidence Detection in the Datong Coalfield. Remote Sens. 2022, 14, 3314. [Google Scholar] [CrossRef]
  24. Zhou, L.; Guo, J.; Hu, J.; Li, J.; Xu, Y.; Pan, Y.; Shi, M. Wuhan Surface Subsidence Analysis in 2015–2016 Based on Sentinel-1A Data by SBAS-InSAR. Remote Sens. 2017, 9, 982. [Google Scholar] [CrossRef]
  25. Hooper, A.; Segall, P.; Zebker, H. Persistent scatterer interferometric synthetic aperture radar for crustal deformation analysis, with application to Volcán Alcedo, Galápagos. J. Geophys. Res. Solid Earth 2007, 112, 1–21. [Google Scholar] [CrossRef]
  26. Du, Y.L.; Su, M.B.; Liu, Y.H.; Wang, Q.M. Study on the Long-term Health Monitoring and Safety Evaluation System for the Wuhan Yangtze River Bridge. J. China Railw. Soc. 2015, 3, 101–110. [Google Scholar]
  27. Housner, G.W.; Bergman, L.A.; Caughey, T.K.; Housner, G.W.; Bergman, L.A.; Caughey, T.K.; Chassiakos, A.G.; Claus, R.O.; Masri, S.F.; Skelton, R.E.; et al. Structure Control: Past, Present and Future. J. Eng. Mech. 1997, 123, 897–971. [Google Scholar] [CrossRef]
  28. Tu, Q. Probability Statistics Is Applied to Meteorology; Meteorological Press: Beijing, China, 1984; pp. 222–229. [Google Scholar]
  29. Wuhan Geotechnical Engineering and Surveying Co. Ltd. Wuhan Engineering Geology, 1st ed.; Huazhong University of Science & Technology Press: Wuhan, China, 2018; pp. 76–77. [Google Scholar]
Figure 1. (a) Picture of the Wuhan Yangtze River Bridge (b) satellite image of the Wuhan Yangtze River Bridge (c) location of the Wuhan Yangtze River Bridge (d) location of the Wuhan Yangtze River Bridge in the the Wuhan district.
Applsci 13 11955 g001
Figure 2. The Wuhan Yangtze River Bridge structural characteristics.
Applsci 13 11955 g002
Figure 4. SBAS results on the Wuhan Yangtze River Bridge.
Applsci 13 11955 g004
Figure 5. Statistics of the deformation rate in the study area.
Applsci 13 11955 g005
Figure 6. Results obtained from cross-validation of 232 pairs of adjacent PS and SBAS data.
Applsci 13 11955 g006
Figure 7. Distribution of characteristic points along the Wuhan Yangtze River Bridge.
Applsci 13 11955 g007
Figure 8. P1–P7 deformation time series during the study period.
Applsci 13 11955 g008
Figure 9. Structure of the Wuhan Yangtze River Bridge and selected characteristic points.
Applsci 13 11955 g009
Figure 10. Deformation time series of chosen characteristic points during the study period.
Applsci 13 11955 g010
Figure 11. Deformation time series of another seven characteristic points from January 2019 to December 2020.
Applsci 13 11955 g011
Figure 12. Monthly average temperature measured at the meteorological station during the study period.
Applsci 13 11955 g012
Figure 13. Comparison between P1–P7 deformation time series and temperature during the study period.
Applsci 13 11955 g013
Figure 14. (a) Stratigraphy section along the main bridge (b) stratigraphy section along the approach bridge (c) composition of the bridge pier.
Applsci 13 11955 g014
Figure 15. Deformation rates at points on the west-to-east profile line of the Wuhan Yangtze River Bridge.
Applsci 13 11955 g015
Table 1. Sentinel-1A data basic parameters.
Satellite ModelSentinel-1A
Orbit directionAscending orbit
Angle of incidence39.7°
BandC
Polarization modeVV
Amount75
Time span3 January 2020~21 June 2022
Table 2. Description of the deformation points.
Point NumberLatitude
(Degree)
Longitude (Degree)Mean Deformation Rate (mm/Year)Location
P1114.2783930.554681.9Near No. 1 pier
P2114.2790330.55440−1.5Between No. 1 pier and No. 2 pier
P3114.2801030.55367−6.3Between No. 2 pier and No. 3 pier
P4114.2822330.55258−10.7Near No. 4 pier
P5114.2827930.5524115.4Between No. 4 pier and No. 5 pier
P6114.2864530.550294.6Near No. 8 pier
P7114.2871430.54988−1.8Between No. 8 pier and the eastern bridgehead
Table 3. Spearman correlation coefficients of P1–P7.
Point NumberP1P2P3P4P5P6P7
Correlation0.420.12−0.05−0.02−0.18−0.20−0.13
Disclaimer/Publisher’s Note: The statements, opinions and data contained in all publications are solely those of the individual author(s) and contributor(s) and not of MDPI and/or the editor(s). MDPI and/or the editor(s) disclaim responsibility for any injury to people or property resulting from any ideas, methods, instructions or products referred to in the content.

