Article

The Vibration Analysis Based on Experimental and Finite Element Modeling for Investigating the Effect of a Multi-Notch Location of a Steel Plate

by
Kritchanan Charoensuk
and
Thunyaseth Sethaput
*
School of Manufacturing Systems and Mechanical Engineering (MSME), Sirindhorn International Institute of Technology (SIIT), Thammasat University, 99 Moo 18, Km. 41 on Paholyothin Highway Khlong Luang, Pathumthani 12120, Thailand
*
Author to whom correspondence should be addressed.
Appl. Sci. 2023, 13(21), 12073; https://doi.org/10.3390/app132112073
Submission received: 16 June 2023 / Revised: 6 July 2023 / Accepted: 10 July 2023 / Published: 6 November 2023

Abstract

:
Vibration is challenging and significant in solving engineering problems. The issue of vibration in loaded objects by utilizing a three-dimensional model and experiments. Typically, an object is subjected to a random frequency, which changes the notch shape depending on the frequency model. The investigations determined the performance difference by conducting modal analysis with the finite element method and examining the various forms of each mode. We simulated metal plates with V notch and multiple notch locations on both sides and one side of the notch. The test kits included an accelerometer and a force sensor for correcting the national frequency via Simulink Matlab® and verifying the result from the finite element methods. The V-shaped vibration testing provided significant insights into its accuracy and potential for predicting damage and fracture through experimentation and the finite element method. The tested specimen analyzed the behavior of two models and found that the two V-shaped exhibited varying natural frequency values. Specifically, the double-sided V-shaped increased natural frequency, whereas the single-sided notched V-shaped cutting showed a significant decrease in natural frequency. Accordingly, this investigative approach, the result of the experiment, and the finite element shows that correlation disposition can be utilized to forecast various random frequencies for vibration analysis.

1. Introduction

Nowadays, integrating legal matters and mechanical parts in engineering inventions has opened up new possibilities for predicting vibrations caused by loading or moving forces. Accurate 2D modeling and analytical methods are crucial for designing and maintaining structures effectively, from railways to bridges and cable lines. Engineers can achieve specific objectives efficiently with the help of 1D or 2D modeling, making these methods essential for successful structural designs. However, due to their rigid nature, machine parts and structures develop irregularities in their lifespan, leading to a notch location development. Vibration is a fundamental problem in the science of resistance of materials, and modeling the notch location is essential in studying the behavior of damaged structures. By knowing the effect of the notch location on steel plates, they can be modeled using either Euler−Bernoulli or Timoshenko beam theories. The beam boundary conditions and notch location compatibility relations derive the characteristic equation relating the natural frequency, notch depth, and location with other beam properties. Research on structural health monitoring for crack detection deals with changes in natural frequencies and mode shapes of the beam.
The investigation of vibration analysis considers load movement in one-dimensional and two-dimensional models. The primary focus is to explore various methods to identify the dynamic behavior of a moving load, in this case, a vehicle or manufacturing process, while carrying the load in their statures. Subsequently, the researchers use a rectangular plate to demonstrate the circumstance for creating the situation from the case study. The loads are modeled as groups of wheel or axle loads moving at a fixed distance on the deck’s surface. Accordingly, the researcher can determine the dynamic response of the bridge deck with great precision. The research article uses modal analysis [1,2,3], integral transformation (ITM) [4,5], Galerkin [6,7], differential [8,9], and finite difference [10].
The finite element method (FEM) has effectively predicted and verified vibration problems. In the quest to analyze the dynamic response of a flat plate subjected to various moving loads, the FEM approach was employed. Plate elements were utilized to carry out the analysis. A discrete system of isoperimetric rectangular plate elements replaced the continuous flat plate [11,12]. Several techniques were implemented, including dynamic stiffness [13] and frequency-domain spectral element (SEM) [14,15] methods. This numerical procedure is widely used in engineering and science to solve many problems. The FEM’s most significant advantage is its ability to handle all geometries and nonhomogeneous materials without altering computer-code formulations. This method breaks down the problem into numerous planes, each with a straightforward geometry that simplifies problem solving [16].
Additionally, the behavior of materials in terms of fractures differs significantly when observed at a micro-scale due to various side effects. In order to gain better insights into how materials fracture under stress and size effects, a series of tensile and compression tests were conducted on pure copper with different microstructures and geometrical sizes. The experiment’s findings revealed that microvoids appeared in the compressed samples, due to the localization of the shear band, rather than macro fracture. Understanding shear damage and its potential size effects is crucial for exploring micro-scaled damage and fracture mechanisms. A combined constitutive model is used to characterize the size effect on flow stress, along with an approach for applying a phenomenological shear damage evolution law to the GTN-Thomason model by considering the size effect. This enables the prediction of micro-scaled fractures in a comprehensive stress triaxiality range. The proposed model is validated and verified through both simulation and experiment. The research article of J.L. Wang et al. [17,18] details the size effect on flow stress and shear stress. Meanwhile, extensive research has been conducted on the properties of metallic materials when exposed to dynamic forces, including deformation, strengthening due to strain rate, and fracture mechanisms. However, the effects of size on these dynamic mechanical properties at the micro and mesoscale have not been thoroughly explored. To investigate the impact of size on these properties, experiments were conducted on oxygen-free, high-conductivity (OFHC) copper using both quasi-static compression and split Hopkinson pressure bar (SHPB) testing with varying geometrical and grain sizes. The effects of changing geometrical and grain sizes on dynamic forces were reported by C. Jing et al. [19]
A valuable method for detecting cracks and notch location is through vibration-based techniques. These methods analyze changes in dynamic properties to determine the presence of cracks. Djidrov et al. [20] found that the natural frequencies of a cantilever beam with a notch shift primarily when the damage is near the end. Additionally, the depth of the damage is inversely proportional to the natural frequency. According to research conducted by Liang et al. [21] and Li et al. [22], the presence and location of cracks can have an impact on vibration amplitude. Liang et al. used linear finite element analysis and the local flexibility method to determine the relationship between normalized stiffness and notch locations. They identified crack locations by finding the intersection points of normalized stiffness at the first two natural frequencies of the beam. Li et al. utilized wavelet finite element methods to detect the location and depth of cracks in a free−free beam. The frequency contour lines were used to identify the gaps with an error rate of 26.5% and 26.1% for location and depth, respectively, without Young modulus correction. The correction reduced the error rate to 9.9% and 15.0%. Numerous studies have been carried out to identify cracks present in beam-type structures. Barad et al. employed a frequency-based approach and achieved an accuracy of 4% in detecting surface cracks [23]. Meanwhile, Reddy et al. [24] utilized contour graphs of the first three normalized natural frequencies to locate and determine the size of the damage. Rizos and Aspragathos used the measurement of natural frequencies and solved nonlinear equations to calculate crack locations and depths. However, their method has limited accuracy in detecting tiny cracks, specifically those with a crack depth ratio of less than 0.1 [25]. Labib et al. [26] developed a new method that utilizes a rotational spring model to calculate the natural frequencies of beams with multiple cracks. Agarwalla and Parhi [24] investigated the impact of notch location on the modal parameters of a cantilever beam subjected to vibration. Lastly, Ostachowicz and Krawczuk [27] studied the effect of natural frequencies for two types of single-sided and double-sided notch locations. Owolabi et al. [26] also developed a modified approach to detect cracks’ location via notch shape in beams, which can be seen as a significant contribution to the field.
Extensive research has been conducted in the literature regarding the free vibration of thin-walled beams. Yaman [28] utilized a wave propagation approach to solving the triply coupled vibrations of beams, employing a Fourier transform for the displacement components and a Laplace transform for the time factor. Piana et al. [29] compared the natural frequencies and buckling loads of aluminum non-symmetric thin-walled beams under axial forces through experimental and numerical methods. Their experimental approach involved a vibration testing apparatus, while their numerical analysis utilized a finite element method. The development of the finite element method (FEM) to analyze the free vibration behavior of thin-walled beams based on the Timoshenko beam theory and including a substructuring technique for the efficient analysis of complex structures that agree well with R. Augello et al. [30] was reported the energy method to derive the differential motion equations of FT thin-walled beams with arbitrary cross sections, studying the triply coupled free vibrations. Their approach involved using the principle of virtual work to derive the equations of motion.
The study of supported beams was also conducted using a semi-analytical method involving a power series expansion. Mohri et al. [31] investigated the vibration behavior of pre-buckled and post-buckled thin-walled beams with open sections through a nonlinear model considering FT coupling and warping effects. Their approach involved using a perturbation technique to obtain the nonlinear differential equations of motion. Previous works primarily focused on the vibration problem from an analytical or numerical perspective. Furthermore, rotational terms were examined to determine their impact on bending, revealing that their presence can significantly affect the natural frequencies of thin-walled beams.
This study delves into applying a hybrid technique that merges the finite element method (FEM) to investigate the vibrational properties of complex structures exposed to moving notch locations. Notably, the FEM utilizes a shape function insensitive to the structure’s vibration frequency. However, precise solutions require an accurate discretization of the structure, especially in the high-frequency range. The research examined various plate geometries representing structural components. These plates were simulated using the finite-element method and verified with an experiment test. Various notch location classes were considered in carbon steel, including v-notch grooves with one and both sides. The study’s primary objective was to conduct a vibrational analysis that aimed to quantify the natural frequency characteristics of the designed plates with the effect of notch location.

2. Materials and Methods

In this study, the test materials obtained low carbon steel. The test is divided into vibration tests with three workpieces—Virgin, V-shaped notches, and holes. The shape of the test work has shown the relationship between frequency and time with the force and time by bringing the natural frequency that has been compared to the result of the FE model to create a prediction of the obtained to predict the behavior of testing material and the natural frequency of carbon steel and that material in the test; it was carried to locate the frequency from the accelerometer and the force of the force sensor via Simulink Matlab® compared with the result of the FE model.

2.1. Material Characterization

The test material employed is carbon steel, which boasts strength and weakness. Its properties vary depending on the amount of carbon mixed with iron, which allows for its use in multiple applications, such as accumulating heat, conducting electricity, and resisting corrosion. Adding carbon to the steel mixture enhances strength, toughness, and efficiency. Conversely, low carbon steel is rigid, durable, and wear-and-tear-resistant. It is commonly used as a raw material for building pipes, bridges, and cars and producing structural components. The amount of carbon does not solely determine the properties of carbon steel but also crystal type and distribution, as well as the presence of other elements, as shown in Table 1. Subsequently, the same methodology was applied to determine differences in results compared to random frequencies, as presented in Table 2. Subsequently, the properties of each material were set in the FE simulation material, which is necessary for calculating the behavior of the test material.
In Table 2, the value has tested only the tension force of the examination steel, operated by using the international ASTM E8 standard test [32]. The metal plate has been prepared in one direction to study the behavior of anisotropic materials. Zero degrees is related to the rolling direction (RD). The strain rate is fixed at 0.001 S−1. The properties are calculated during the test, the longitudinal stretch was measured, and the reduced width of the gauge length was measured with the extensor meter.

2.2. Geometry Designed and Condition

The metal sheet form used in this study is shown in Figure 1a. It is a metal sheet with a V-shaped groove to find the effect of the sheets and the position in the metal sheet with the same material. In this case, etching into the metal sheet makes it the lightest material compared to different categories. The metal sheets do not have or have a hole. The cross section has a thick material of 5 mm. However, as Figure 1a shows, the V shape is operated with the smallest different volume. The weight between the three shapes of materials during their respective changes is insignificant.
The design of the sheet in each shape with the same material in the millimeter unit is all simulated for random vibrations [28,33,34,35,36]. The experiment used multiple-input-multiple-output random vibration tests first using the time domain randomization approach. This paper uses the time domain randomization approach to generate stress time histories of any length. In addition, each sheet has 20 modes of image changes, but the experiment did not show all the forms of loss. The display of complete loss is demonstrated in two ways. This is the result achieved by modifying the shape of the V-shaped baking round. The metal sheet design is precisely 300 × 400 mm for each sheet. To ensure the testing apparatus is securely held, the test area measures 300 × 300 mm and stands at a height of 100 mm. The V shape was to study the influence of the notch marks. The second is a metal sheet with 24 holes and a diameter of 20 mm per hole; the third type is a complete metal sheet. It is a test that can be reliable by using the research of V. Khalkar et al. [37] and the research of A. Endo et al. [38] studied a full metal sheet for frequency. The nature of the test materials is low carbon metal, both tested. In addition, the research of B. W. Lengana et al. [39] tested three metal sheets using full sheets and hole drilling. The three types of research have a common point. The overall disadvantage of each sheet of metal sheets is based on the mode shape analysis in the finite element model of mode analysis and harmonic response simulation.
Each metal sheet’s general failure emanates from module analysis in software simulation. In addition, the response to the harmonic test is also created in the FE simulation model to amplify the frequency of the metal sheet. By conducting an accurate simulation, the experiment performed a harmonic response test on the metal sheet, ensuring that one side was firmly fixed and a stable force of 200 N was attained. Figure 1 illustrates the dimensions of the design test, while Figure 1b,c demonstrate the design’s behavior using the same principles in a distinct format.

2.3. Identification of Natural Frequency in Experiments

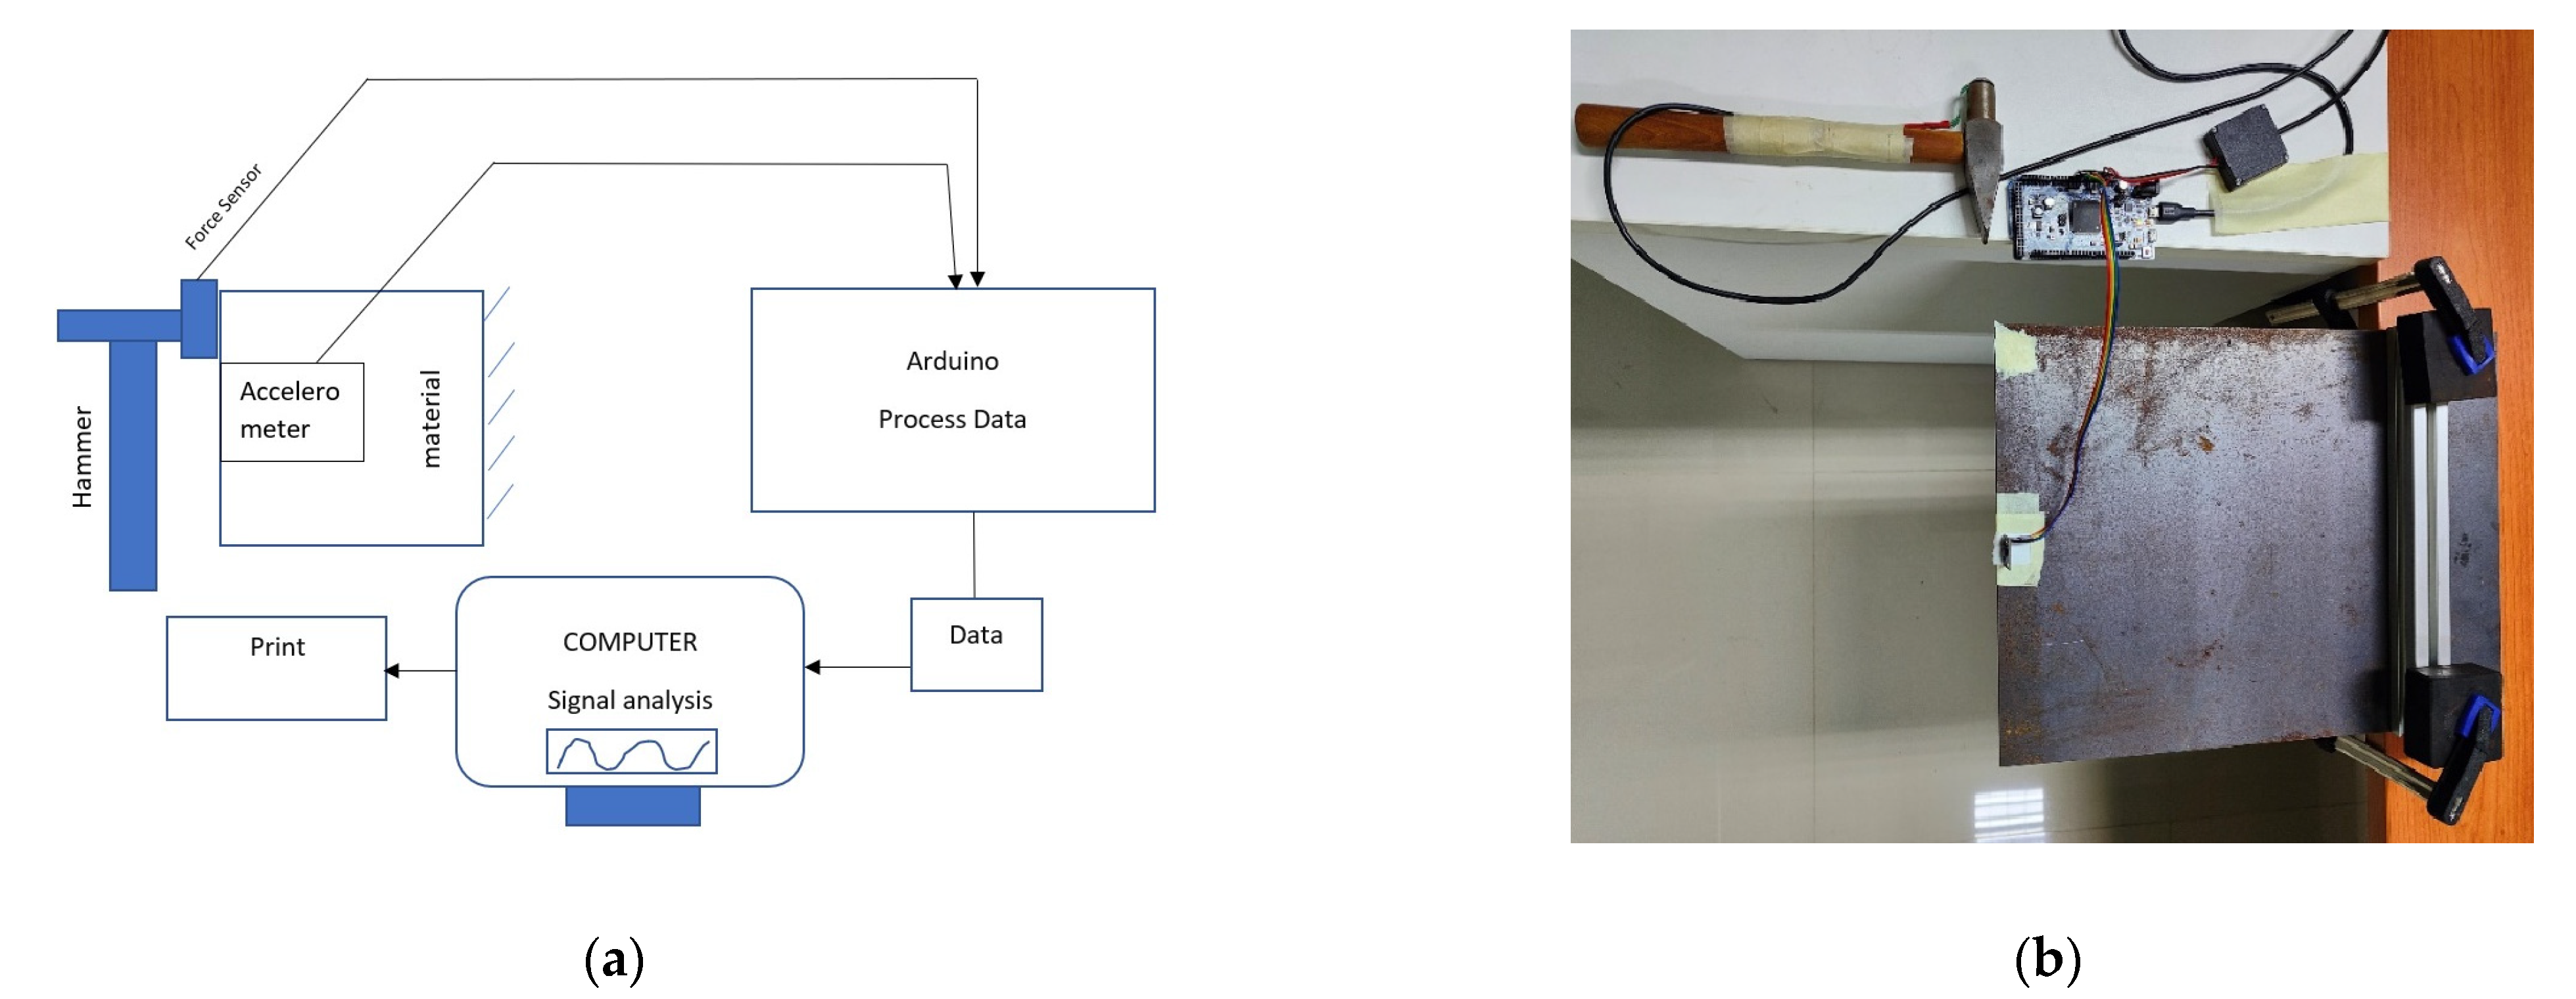
The natural frequency testing force sensor attached to the hammer is utilized for knocking. The device will change impact energy to electricity and convert it to the data used to signal the experimental material by the exam equipment that receives signals (accelerometer) by installing this device to the experimental material sheet when the trial strikes the material. This device will change mechanical movement to electrical signals into signal analysis devices, which will use the signal to analyze the signal analysis. This experiment uses the Matlab® program as a signal analysis using the Arduino board, which is a microcontroller. It is commonly used to analyze the signal of A. González et al. [40] and M. H.M.Ghazali et al. [41]. Both researchers brought an Arduino microcontroller to make a face that controls the natural frequency by examining with the board to receive electrical signals from the force sensor and accelerometer processing and sending data to the Matlab® program to show the values obtained from various experiments. It was found that when the values obtained from the Arduino microcontroller were compared, they proceeded with professional vibration technology and low-cost systems. The most relevant low- and medium-frequency results work with 2.19% errors for testing. Therefore, it can be concluded that these test kits are used to use the Arduino microcontroller with practical vibration tests. This will help the project cost decrease and facilitate access to this type of research. Therefore, the researcher designed by reading the Arduino model Due 2012 R3, with the value consisting of the results of the term, frequency, time, and characteristics of various graphs and can also record various data in the form of image files. The work test set was installed for the experiment by designing signal analysis equipment based on a stable platform with a fastening of the EF Calmp. In summary, it is simple as Figure 2a and the installation of equipment for testing, according to Figure 2.
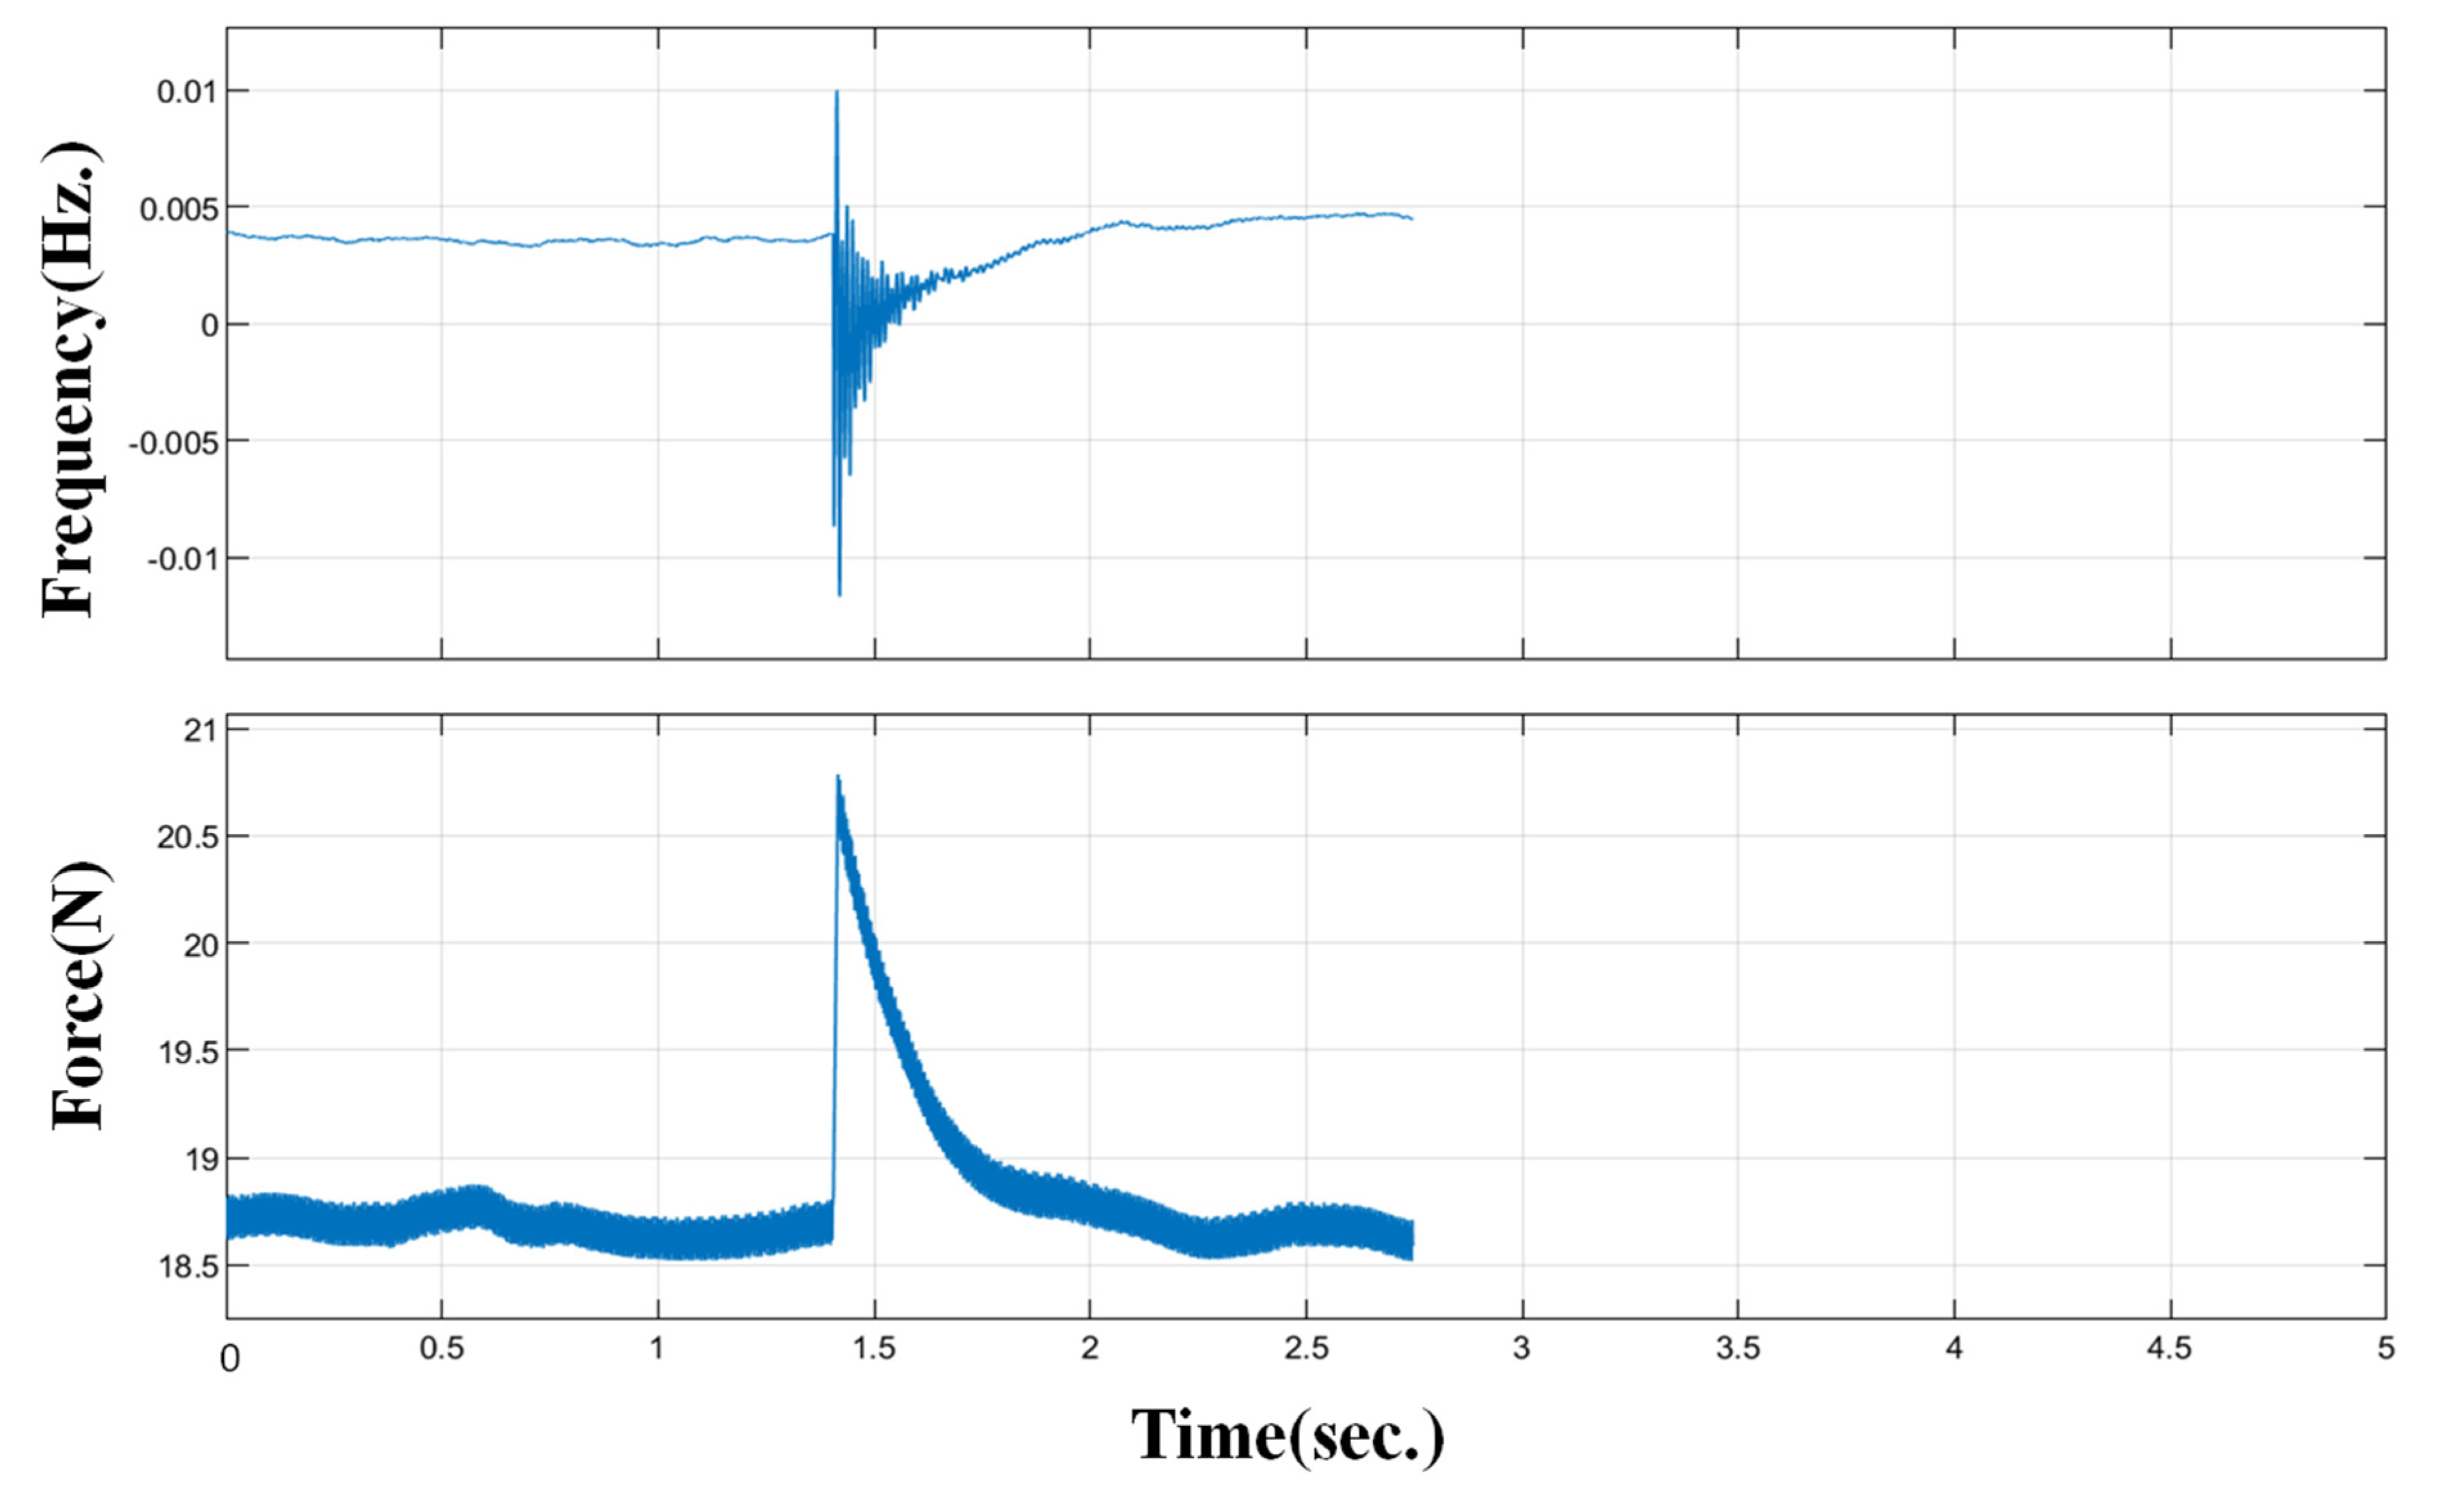
The calibration of signals is a crucial aspect of various experiments, and the Arduino Board Due 2012 R3 is an effective tool for this purpose. The U-by-mingle value indicates the precision achieved, which is 0.001%. These experiments provide valuable data that can be used to locate natural frequencies, which can then be utilized in various applications. In a recent vibration test involving four workpieces, including a U- and V-shaped cutting sheet and holes, the frequency and force were measured using an accelerometer and a force sensor via Simulink. The relationship between frequency and time was then analyzed, with force and time plotted accordingly, as shown in Figure 3. The steel plate used a review article [36] to confirm the correct experimental arrangement. This analysis was conducted using the fast Fourier transform theory, similar to the research report of K. Grabowski et al. [42].
In the analysis of vibration, the test used the impulse function. An impact is a brief but intense force, like a hammer striking a vibrating object. When plotting a graph of the force exerted over time, the impact force only lasts for a short time. Typically, the force generated during impact is quite large. Mathematically, impact force can be simulated by applying a constant pressure at specific intervals, with the magnitude of the energy remaining constant during that time. The function of impact force can be written to Equation (1).
F ( t ) = { 0 t τ ε F ^ 2 ε τ ε < t < τ + ε 0 t τ + ε
by F is impact force, t is time, τ is initiation time, and ε is difference of time. The ε has a small positive value. From the definition of F(t) the above x can be integrated to find the impulse of force as Equation (2).
I ( ε ) = τ ω τ + ω F ( t ) d t
when F(t) impulse function will be called impulse function, or the Dirac delta function, the symbol is transformed to δ(t) and has units of N, given by Equations (3) and (4).
δ ( t τ ) = 0 ; t τ
and
+ δ ( t τ ) d t = 1
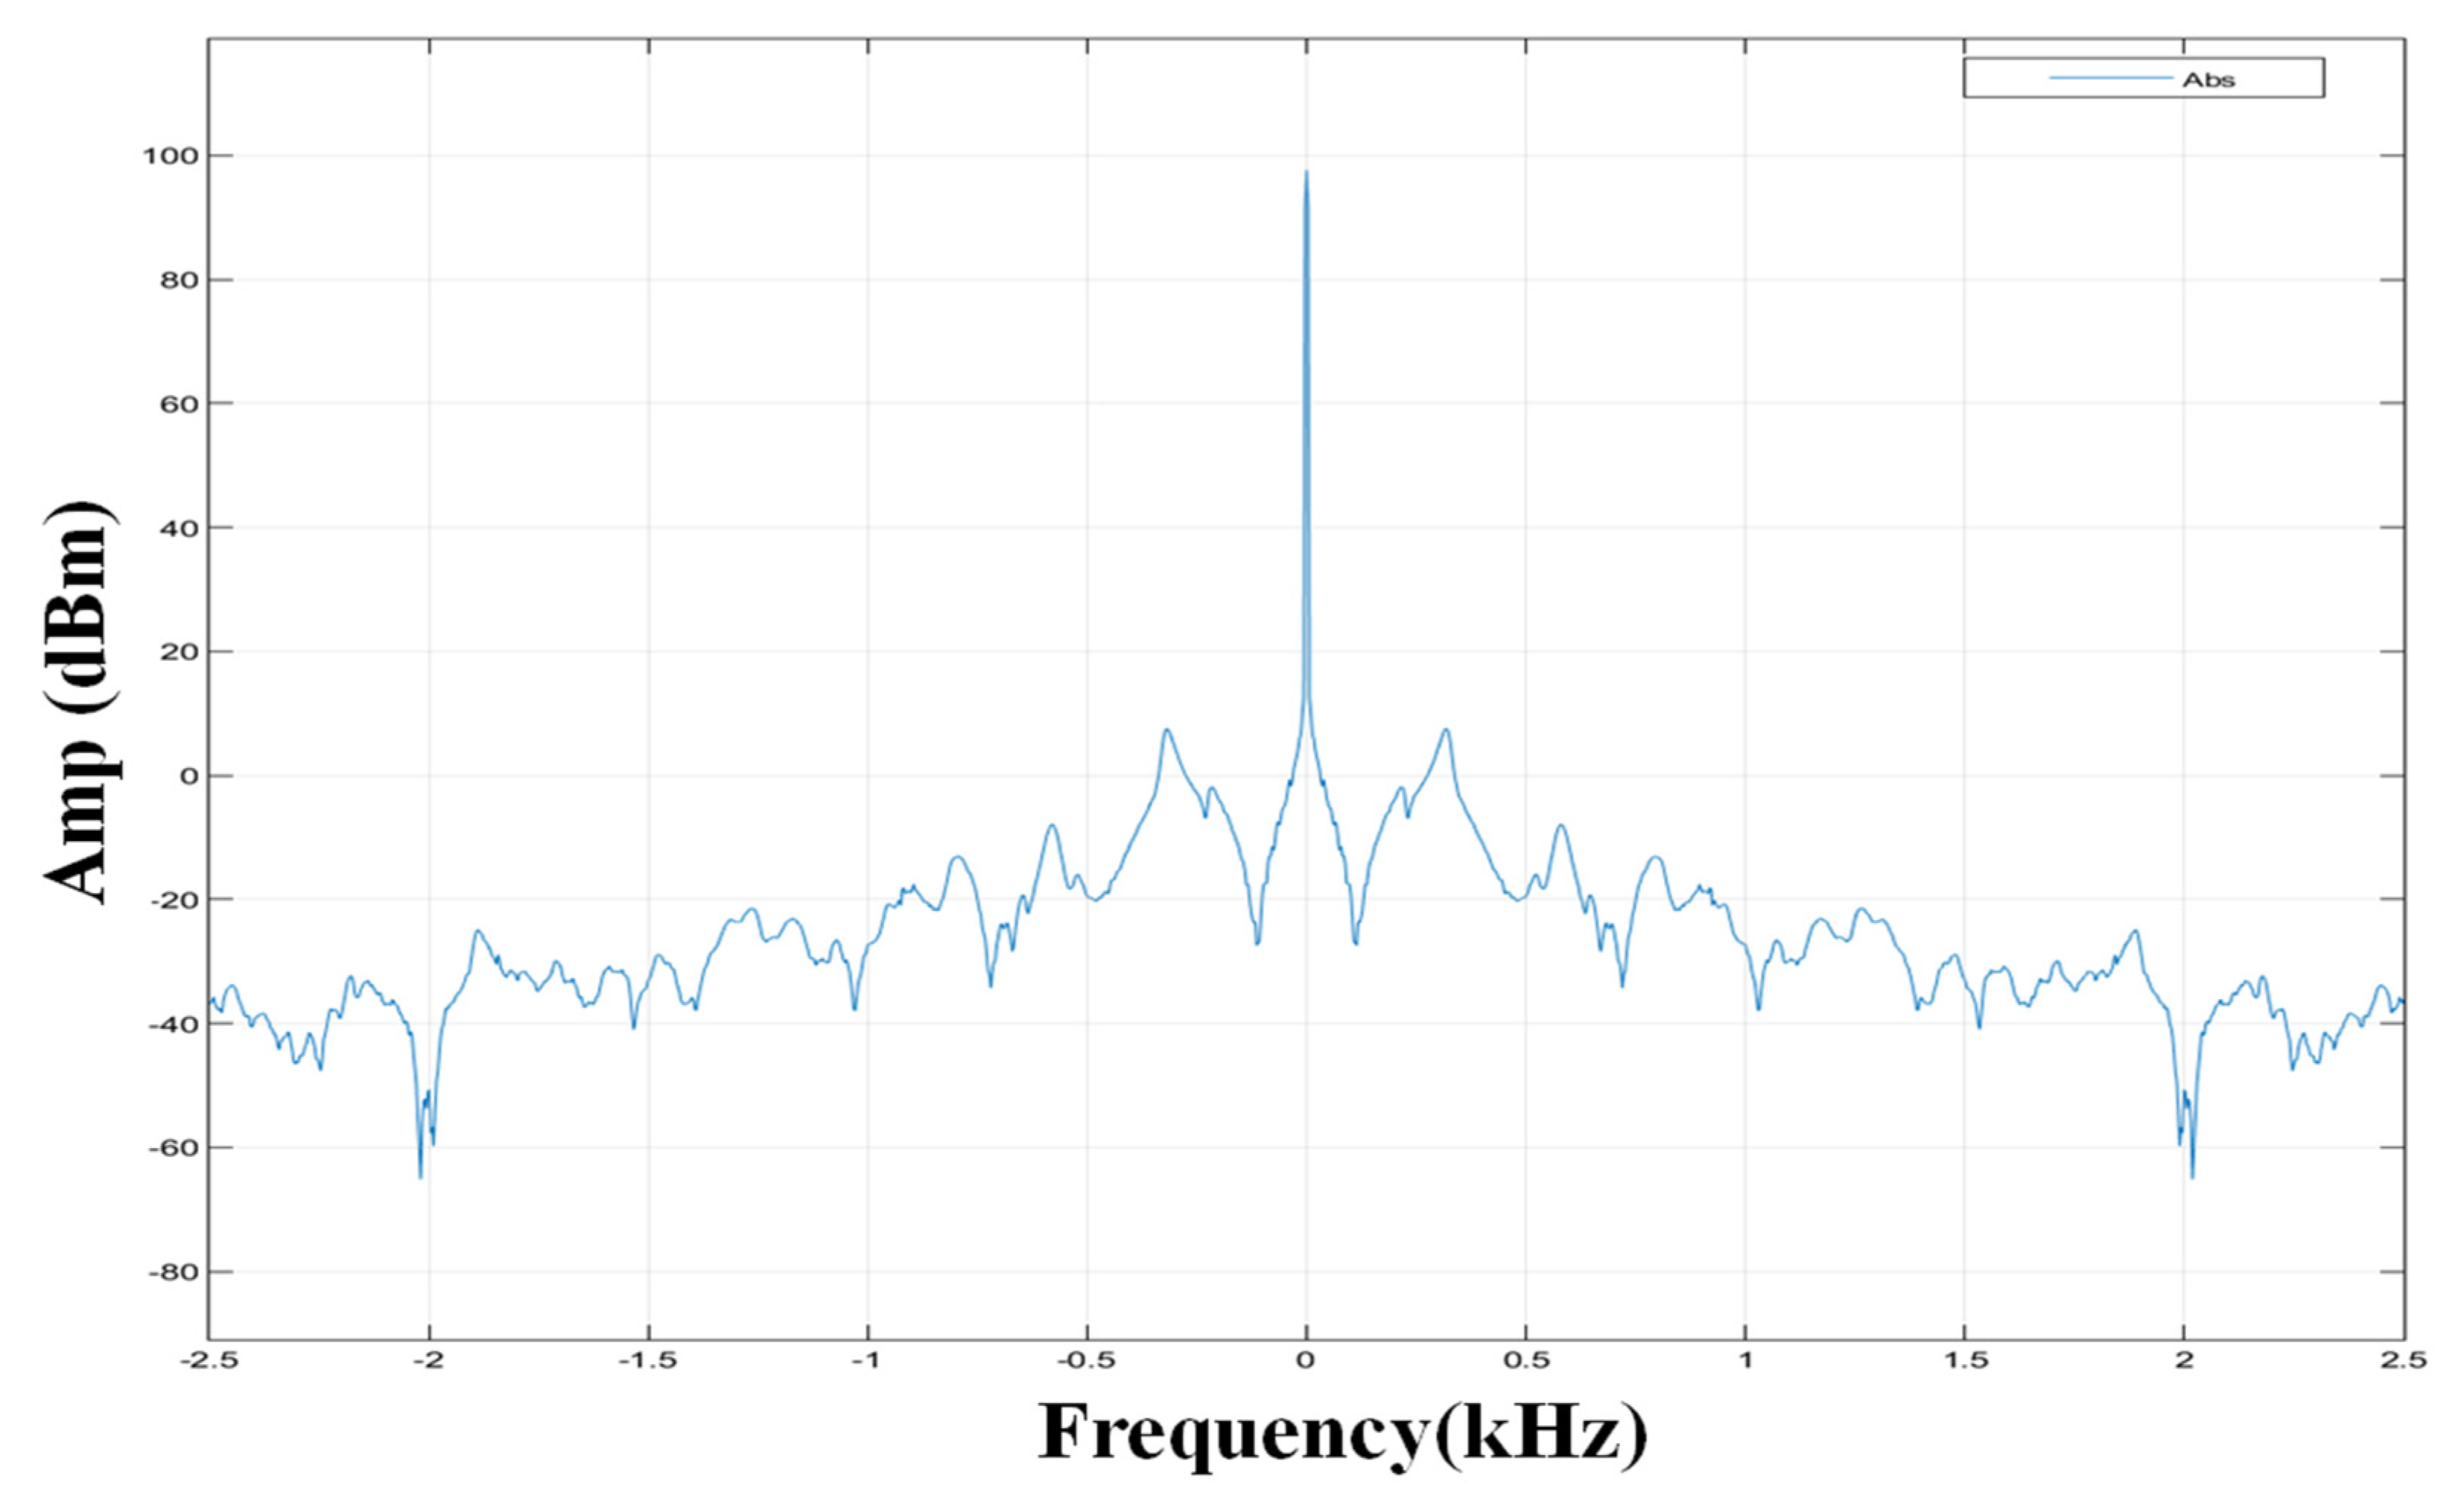
In addition, the function integrated the impulse function into Simulink and conducted a sensitivity test using the elimination method. This allowed us to compare the experimental results with the expected outcomes. We customized the structure based on the test results to meet capacity limit requirements. Furthermore, the test set determined the natural frequencies and compared the experimental results with those from the FE model, as shown in Figure 4. These experiments provide valuable insights into the behavior of different workpieces, which can be applied across multiple industries to enhance product designs and manufacturing processes.

3. Results and Discussion

3.1. Verification for Experiment and FE Models

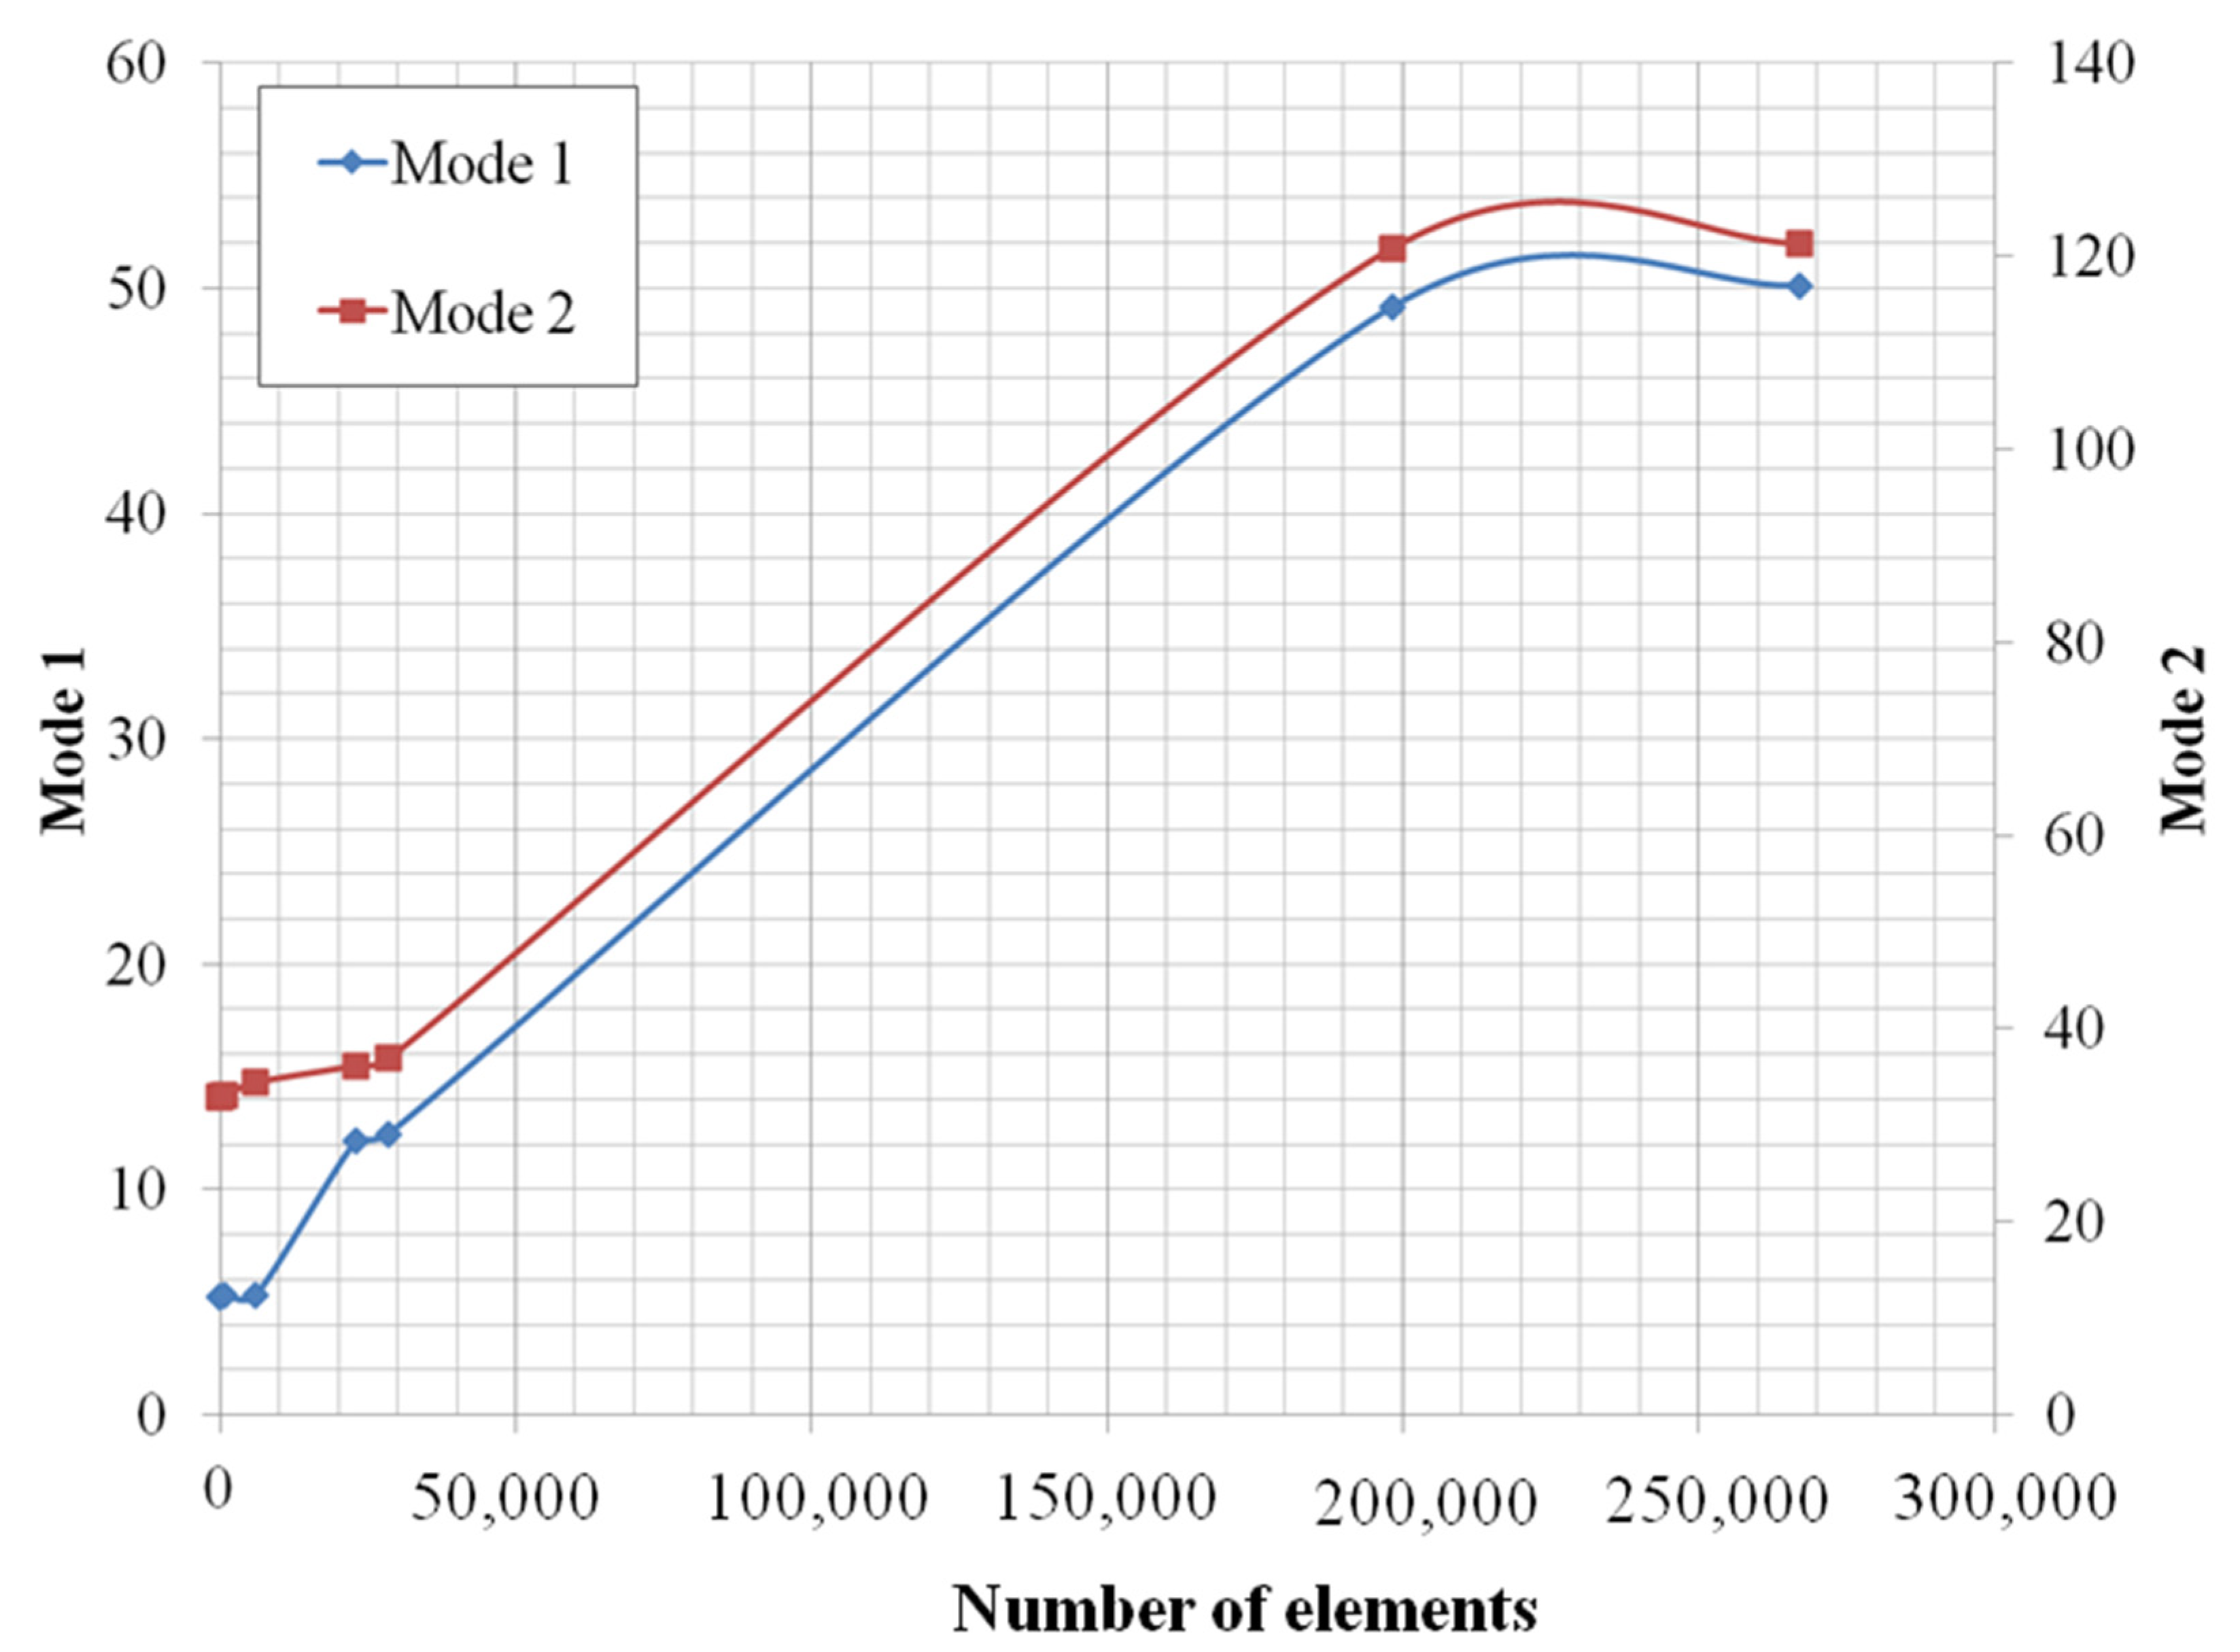
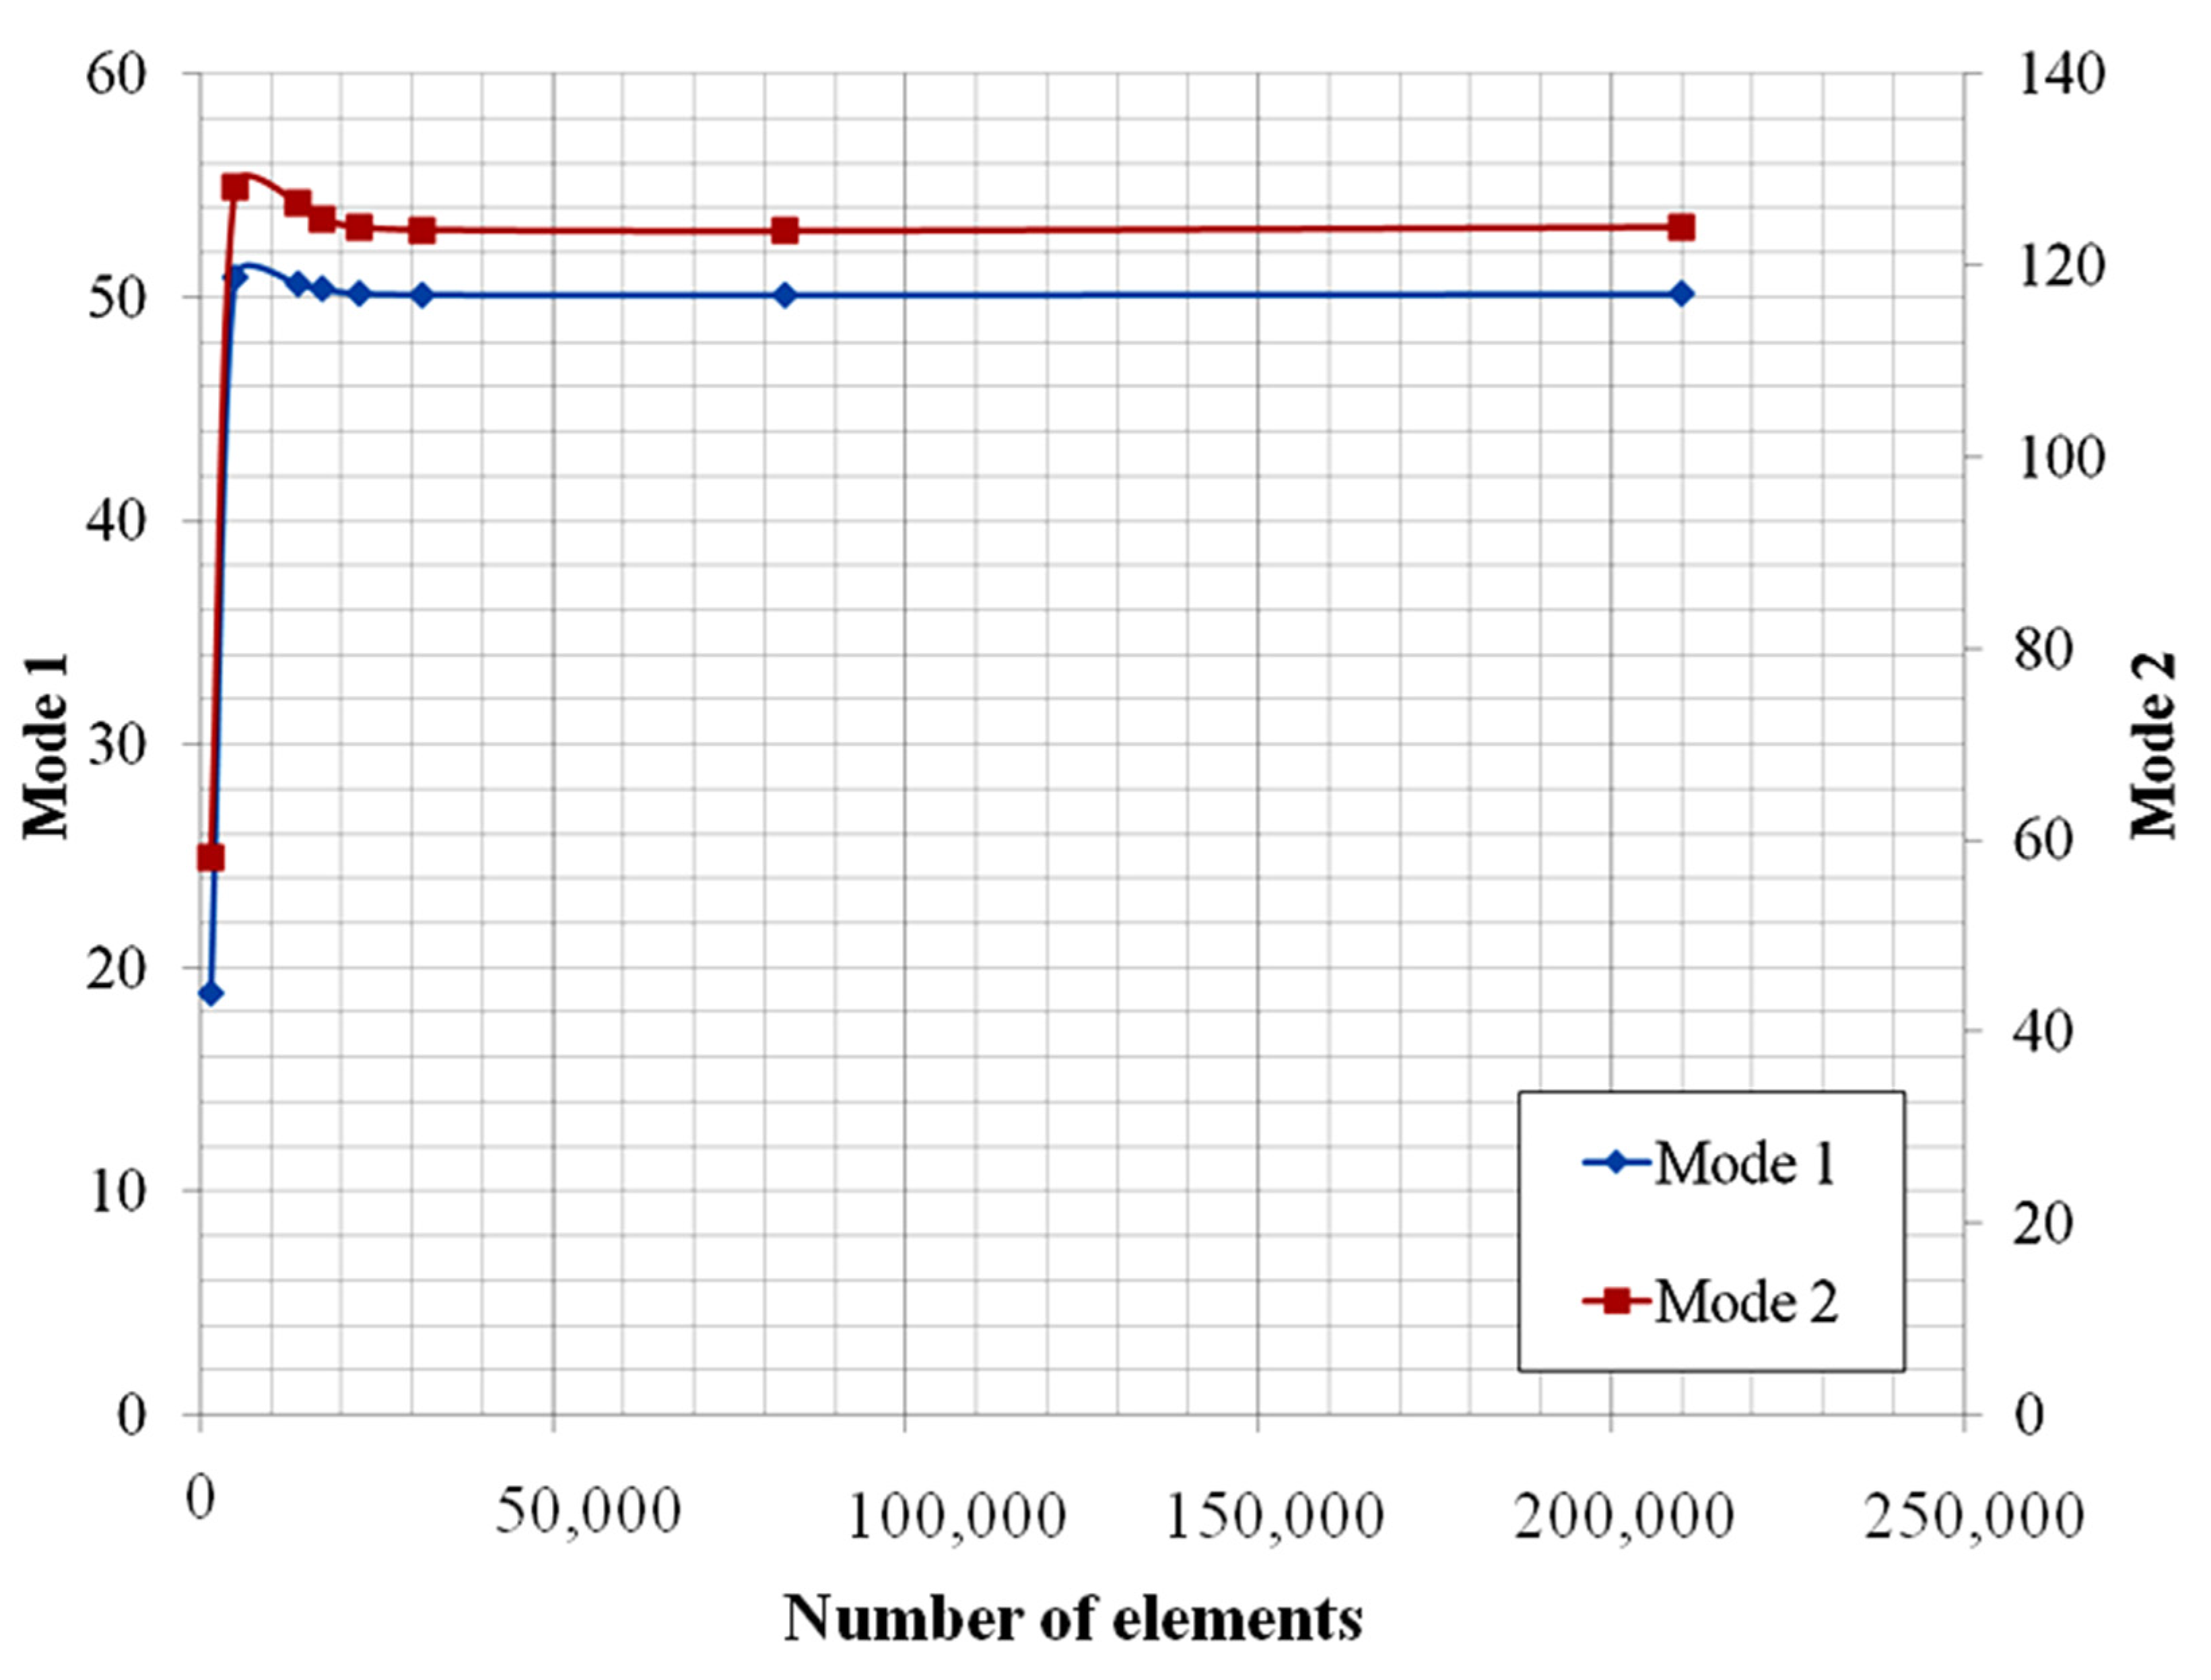
The FE model was created with the Abaqus® education version. Extensive testing was done on different models to determine the best element size as shown in Table 3. The selected element size was 2 mm with 150,000 elements for stable outcomes. The FEA result in mode one and mode two was shown as a monotonic result when the element of the model was close to 150,000 elements and had an element size of 2 mm. The FEA results compared determinations with the research conducted by R. J. Melosh [43], V. Khalkar et al. [37], and R. Ridwan et al. [41] explicitly concerning the number of nodes and element size. The results were deemed unacceptable if the Figure 5 was too rough to show the structural system. Natural frequency was explained by vibrating uniformly sized elements with node distribution. FEA results were a vibrating convergence curve and could be effectively used for vibration analysis [44,45]. This approach is consistent with studies providing insight into optimal element size for FE models.
The tetrahedral elements with mid-side nodes (C3D10M) were used to predict vibration elements in the modeling design. This design contained ten nodes per element and produced a consistent number of 16–267,062 elements compared to the previous case study. Research conducted by H. Zsoltet al. [46] and G.M. Owolabi et al. [29] found that the modeling design was comparable when using 23,022 elements with a 4 mm size element. The study results showed a 2.69% difference in mode 1 and mode 2, compared to the natural frequency value generated from the FE model. The virgin steel plate test results aligned with other research results in Table 4.
The test results with the virgin steel workpiece and the frequency value from the FE model were similar when the number of elements was equal to 23,022. Figure 6 shows that the discourse value decreased with increased elements when adding the number of nodes, indicating a tracking behavior. To accurately predict the test piece’s behavior, this research study employed tetrahedral elements with mid-side nodes (C3D10M) consisting of 198,367 elements.
The model used tetrahedral elements with mid-side nodes (C3D10M) for complex illustrations. They have ten nodes per element and are ideal for testing tracks. A recent study was found in H. Zsolt et al. [46], and M. Behzad et al. [47]. Moreover, the study of G.M. Owolabi et al. [29] works well for designs of various sizes when the number of nodes is 23,022 and the element size is 4 mm as shown in Table 5.
The test results showed a slight 0.85% deviation from natural frequencies in modes 1 and 2, which aligned with other studies(in Figure 7). With 23,022 elements, the FE model frequency matched the test results for virgin steel. Insights gained can aid future designs.
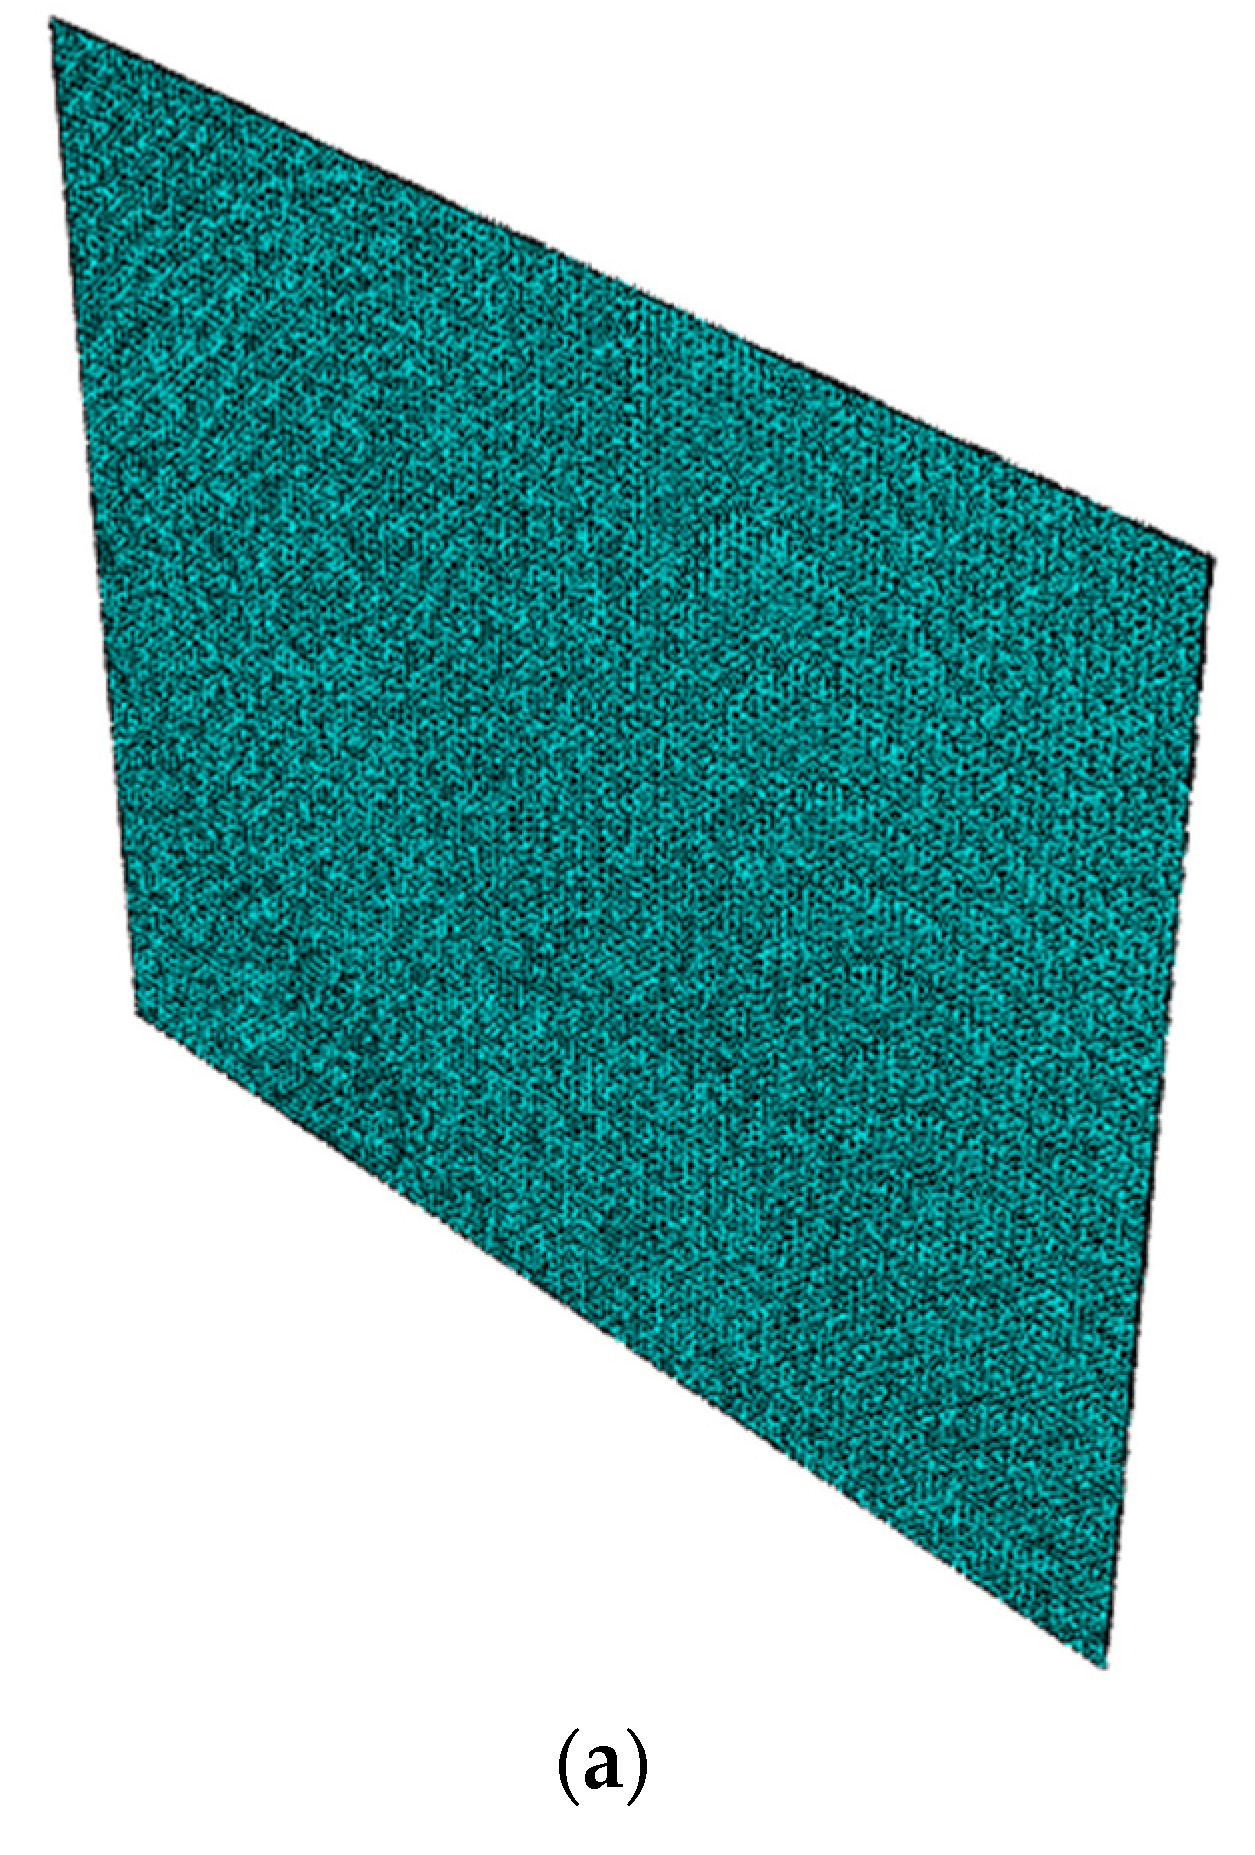
From the testing and convergence of natural results, the results can be precise about natural frequencies using sufficient components and more detailed mesh in the nearby area. The models used the tetrahedral elements with mid-side nodes (C3D10M) format [46]. The frequency analysis is performed for examples that do not have different processes and different notches. All three are shown in Figure 8a–c.
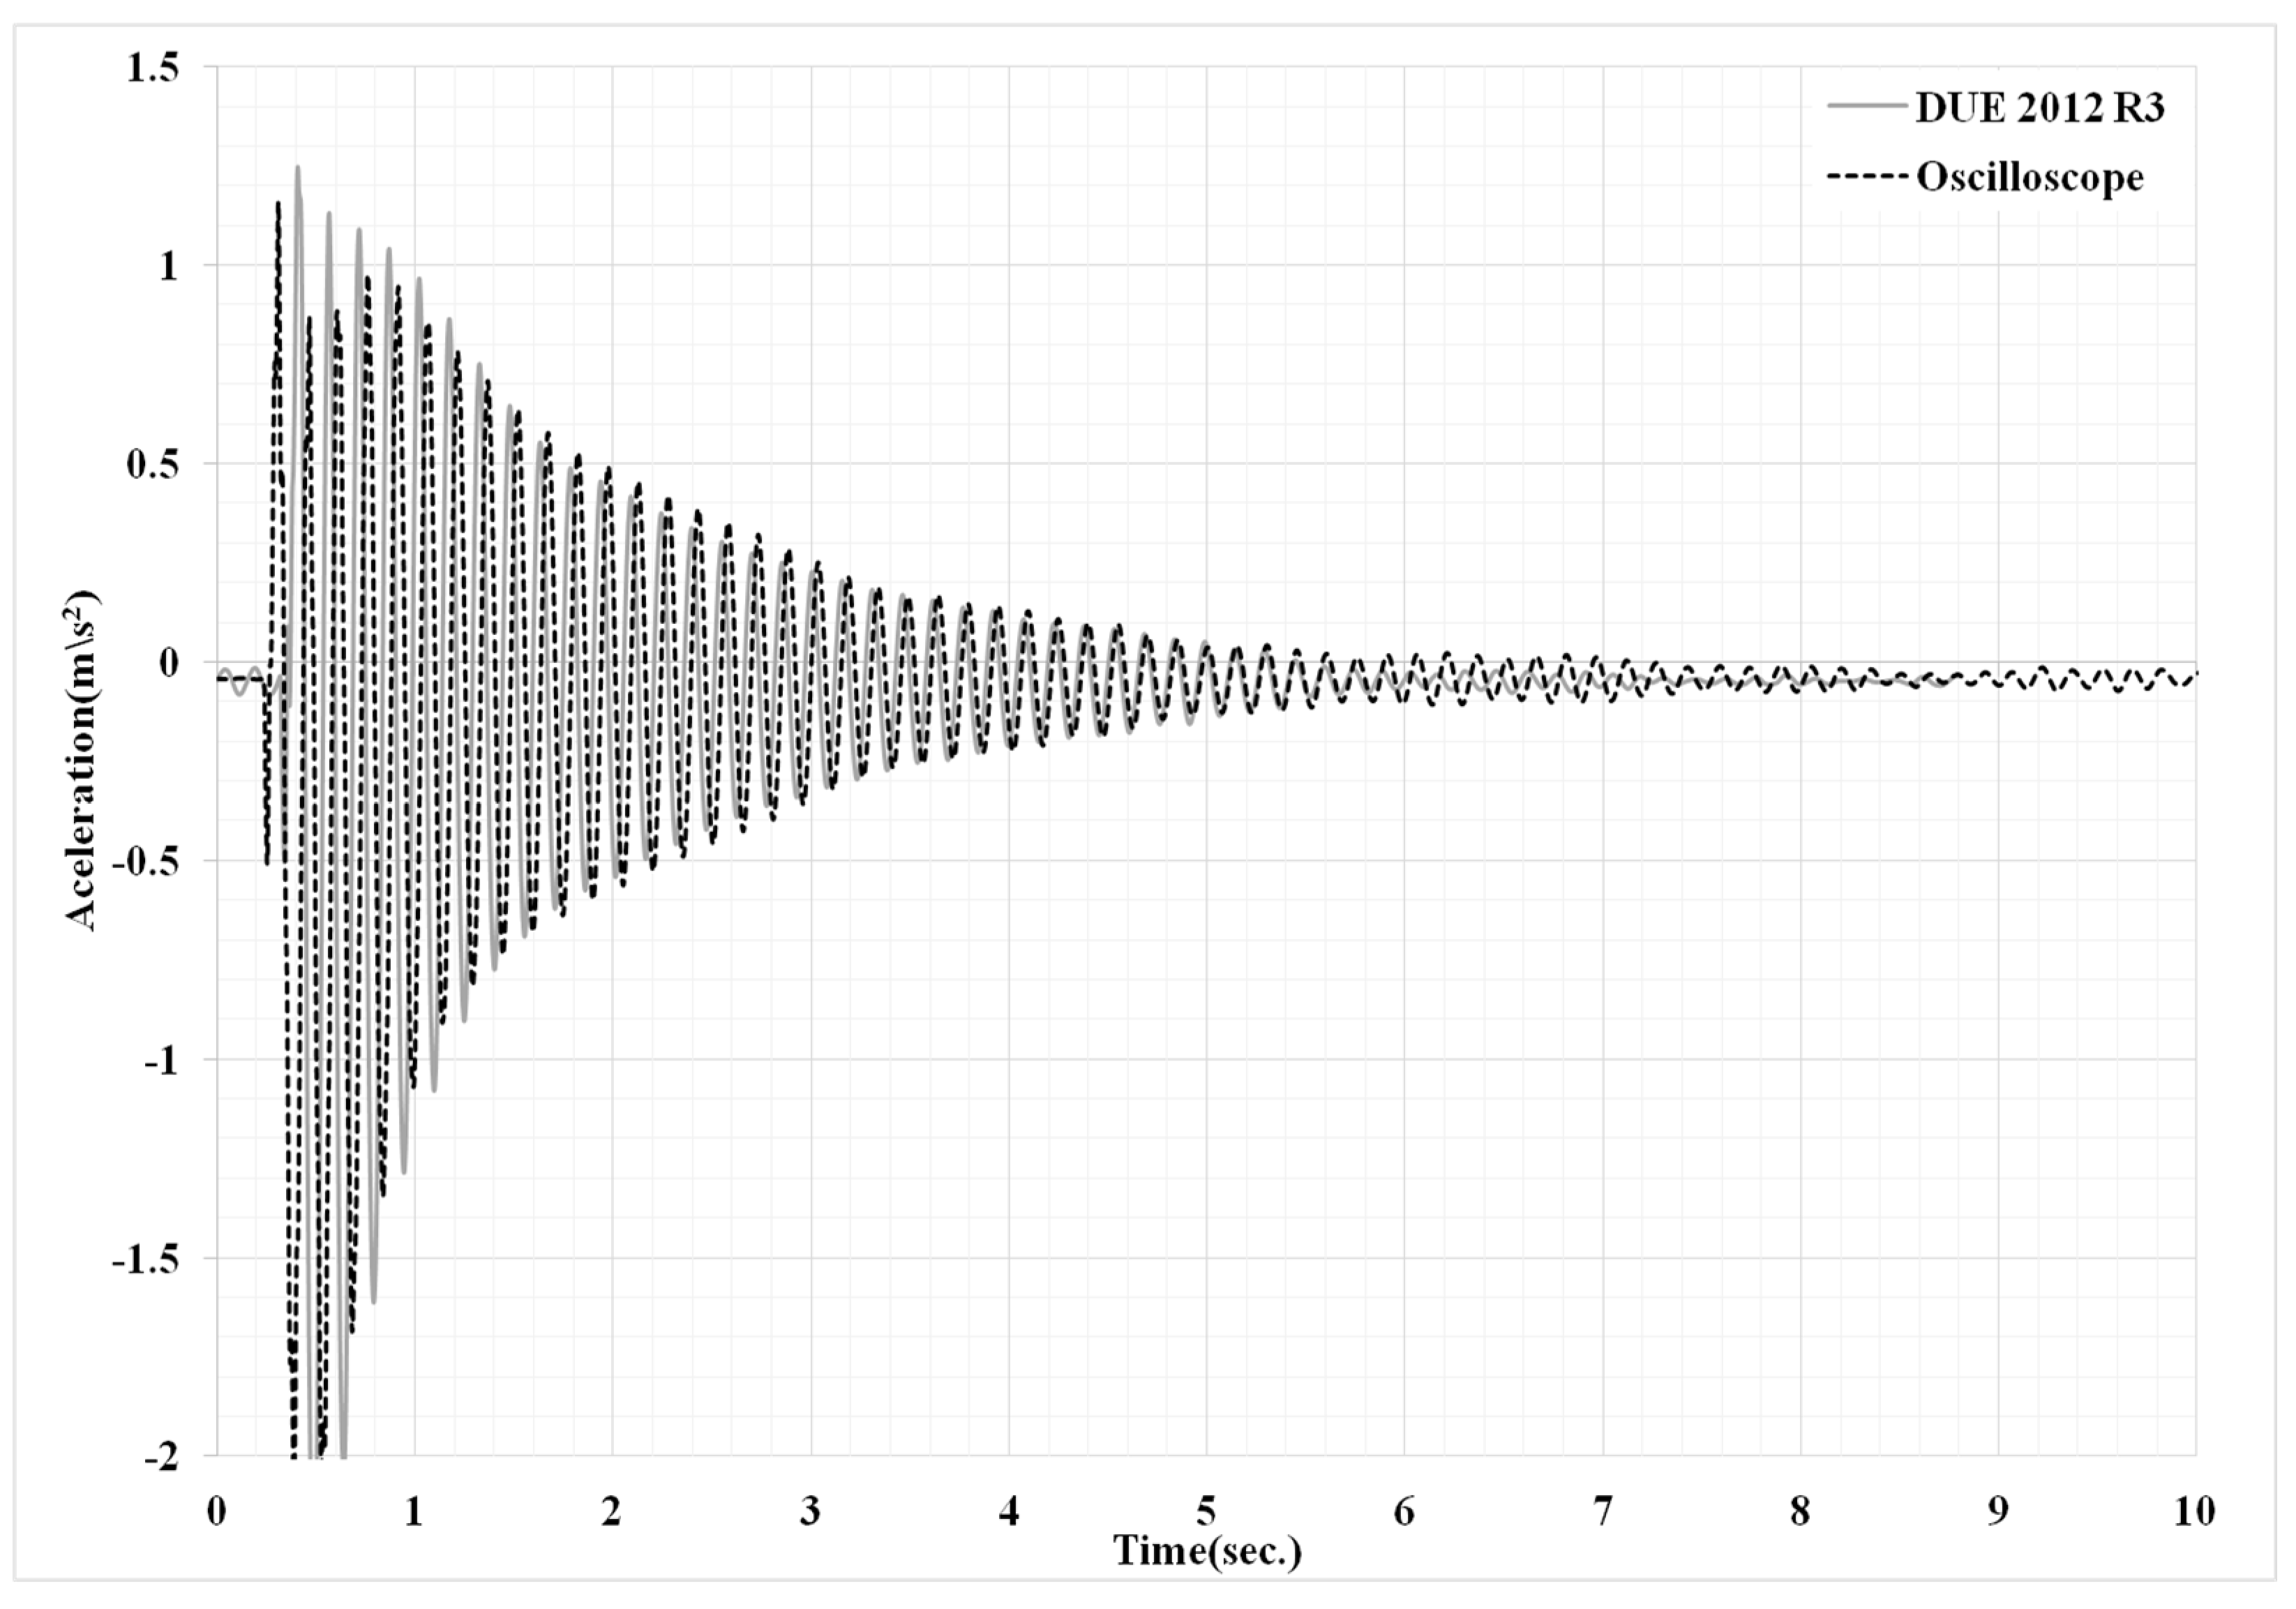
The FE model can predict better test results, so the experiment confirms the performance of the natural frequency value. There is a tight seizing of the test of low carbon steel sheet. As depicted in Figure 2b, the experiment setup was monitored using the accelerometer signal from the Arduino Board, Due 2012 R3. The oscilloscope from Keysight Technologies 3000 T was used to test the signal in the workpiece. Both devices could read the signal value, as shown in Figure 9. The results of the Arduino model Due 2012 R3 and the oscilloscope were similar, with an expectation of just a 0.001% difference in calculations. In addition, the force sensor calibration uses the testing machine with the universal testing machine by testing the force between 0 and 122 Newtons testing five times, using a significance of 0.95, which is in line with the research of A. González et al. [40], and M. H. M. Ghazali et al. [41] reported the Arduino 2012 R3 that is equivalent to a device that is high priced. The results of the body’s movement test and the electric train’s movement found that the Arduino model Due 2012 R3 stands the actual test [48]. In the same way, the value that has been analyzed is regression using the R-squared value. When calculated, it is equal to 0.997 when calibrating the accelerometer and force from the force sensor test when connecting and working simultaneously. The signal can be captured as shown in Figure 10. The result is in line with the results of the dynamic test of the structure. The research report using the Arduino 2012 R3 shows that Arduino is lower than other systems that are used in comparison and has better accuracy in low frequencies for the amplitude of low-speed acceleration than the final result of the fast Fourier transform (FFT) assessment that shows a better observation resolution for Arduino than the control system as performed in the research of S. Komarizadehasl et al. [49] and S. Kumar et al. [50].

3.2. Discussion

The results of the finite element method in the vibration test experiment determine the natural frequency with three types of specimens. The specimens have a 5 mm thickness and a clamping distance of 100 mm. These are the same for all three types: full square sheets, hole sheets, and V-notch sheets. The natural frequencies obtained from the experiment were compared with the finite element method model results and used to create behavioral predictions and predict the onset of internal damage and fracture in low carbon steel. The motion region was set the same as the test result, as shown in Figure 11. The natural frequency of each sheet metal design was collected from the FE model analysis; the natural frequency is shown in Table 6 and Figure 11, which is a graph and the natural frequency in Hz. The values in Table 3 show that the natural frequency of each sheet metal design is different. The value representing the natural frequency is the natural frequency in modes 1 to 20 for carbon steel sheet metal; when using such values to plot the relationship between mode and natural frequency, the values differ for each shape. Figure 11 shows that in mode 1 to mode 3, the natural frequency values are similar; with similar values, the difference is 5 ± 0.45%, and when considering mode 4 to mode 12, it shows that the V- and U-shaped notch patterns have natural frequencies higher than in the notched form and perforated, respectively The resulting difference was 25 ± 7.32%. Subsequently, in mode 13 to mode 20, the V- and U-shaped notch patterns showed a marked increase in the natural frequency difference. Moreover, there are also higher values in the unnotched form and perforated, respectively; the resulting difference is 40 ± 12.47%. The naturalness of the virgin steel and hole workpieces being displayed consistently has led to the research of H. Yoon et al. [51], Huszar Zsolt [46], and B. W. Lenggana et al. [39], who lead research in structural engineering on the problem of vibration under a loaded object. An example to simulate is sheet metal with three models: a pure sheet metal without holes plate, with designated holes, and a solid metal plate on one side. The model was simulated with modal analysis. Therefore, 20 natural frequencies were recorded. The sample also used low carbon steel material. Several random frequency models prove the deformation of various objects. Many types of sheet metal designs, such as pure sheet metal, used side hole punches, and the work of A.R. Prabowo et al. [49], who have studied and reported the results of this work, analyzed a series of container ship collisions in the maritime realm to examine the structural phenomena that occur. The finite element method is chosen to resolve the designed collision case. Discussions will be directed toward the selected protection criteria. By testing and comparing the FE model by using an entire rectangular piece to calibrate the actual test results with a calculated value, the FE model methodology from the research report shows that with the result of the calculation with the FE model methodology, the test results can be significantly predicted.
To measure different types of deformation in a given mode, one must first determine the distance that the workpiece has deformed. Specifically, mode 5 is operated for analysis with random frequencies. Upon examination of Figure 12, it becomes apparent that the deformation is relatively uniform across the workpiece. However, it is worth noting that the pure sheet metal model, without any notches at the corners, experiences the most severe deformation elongation. Furthermore, the center of the workpiece displays a variation in mean value.
On the other hand, the perforated sheet metal model, as shown in Figure 12, displays the worst deformation out of all the models. It has the four worst deformation points. This is because deformation intensity is present in almost all parts of this model due to the holes. The passage between the two holes has relatively poor deformation intensity. Figure 12 clearly and concisely illustrates how the sheet metal model with a V-shaped notch is less affected than the first two models. Specifically, the worst deformation only occurs on a small amount on both sides of the model’s corners. According to the sheet metal model, the center and whole of the model have better deformation due to the force distribution from the notches from two sides. The results indicate that the sheet metal model with a V-shaped notch is the most effective, as shown in Figure 13.
In this section, we will delve into the findings of an experimental prototype kit that boasts the remarkable ability to read natural frequencies. For our study, we selected three different specimens, namely the full rectangular plate, the V-shaped plate, and the perforated plate, and conducted thorough vibration tests on each. By employing an accelerometer and force sensor through Simulink as shown in Figure 14, we could accurately plot the relationship between frequency and time and force and time. To further analyze our results, we compared the natural frequencies obtained from the FE model and utilized them to make behavioral predictions [52]. By doing so, we could anticipate initiating internal damage and fracture of carbon steel during the behavioral analysis. We utilized a frequency testing machine equipped with an accelerometer and force sensor through Simulink to test carbon steel vibrations on the above three workpieces.
During the test, we set the force range to 20–25 Newtons and carefully collected the frequency when the vibration was stationary. These results have been instrumental in enhancing our understanding of the behavior of carbon steel under varying conditions and will undoubtedly serve as a valuable resource in future studies. The unilaterally reinforced perimeter conditions of P. Dumond et al. [53] and K. Luo et al. [54] have consistent results with both studies, as shown in Table 7.
Determining the modal constraint frequency of a workpiece is a complex process that involves various factors. These factors include the positional characteristics of grooving and the workpiece’s geometric parameters and material properties. In Table 8, experimental data are compared with the FE model to obtain accurate results, allowing for a comparison of natural frequencies. The research findings indicate that the experimental natural frequency and FE modeling were similar across modes 1–4, with an average tolerance of 1.47%. Moreover, the vibration values of workpiece distortion in various modes were also found to be comparable. Although modes 5–7 had higher workpiece values, the difference of 5.538% between the experimental natural frequency and FE modeling was considered acceptable, as it did not significantly affect the overall accuracy of the results. The results are consistent with the research of E. Ahmed et al. [55]. Moreover, E. Ahmed et al. [56] reported the tolerance of the work from the experimental results. Moreover, the results from the model will be in the range of 5–25% and can be shown visually. The generated FE model can predict the behavior of the natural frequency in a higher mode.

4. Influence of Notch Location on the Vibration Characteristics

The natural frequency analysis results make it difficult to use experimental methods. The current research uses the generated FE model to predict natural frequency behavior in different modes. The direct method of testing the specimen is the only actual measurement method, and measuring the natural frequency in all ranges would be difficult. As shown in the reports of P. Cawley et al. [57] and P. Gudmunson [36], it was shown that the FE model was used to analyze specimens when the results that could be contained in all seven modes were analyzed. The natural frequency effect from the experimentally measured natural FE model was compared with the calculated value from the finite element method model. The items in shape modes 1–7 are close to the experimentally measured values when observing the calculated results from the model. The values shift as the shape mode progresses from the seventh shape mode. The calculated values obtained from the finite element method model are higher than the experimentally obtained values. The Figure shows that the calculated values from the FE model and the experimental values tend in the same direction. In the section, take the V-shaped workpiece plate, and change the position of the notch. There are straight and oblique types, each divided into two notched plates. This is shown in Figure 15 for an oblique traverse in which the notch moves in the reverse direction and Figure 16 for a straight traverse in which the notch moves in the same direction. The shape modification will determine the proportion by taking the distance between the notch: L and from the notch to the workpiece edge: H by the dimensionless proportion, as shown in Table 9.
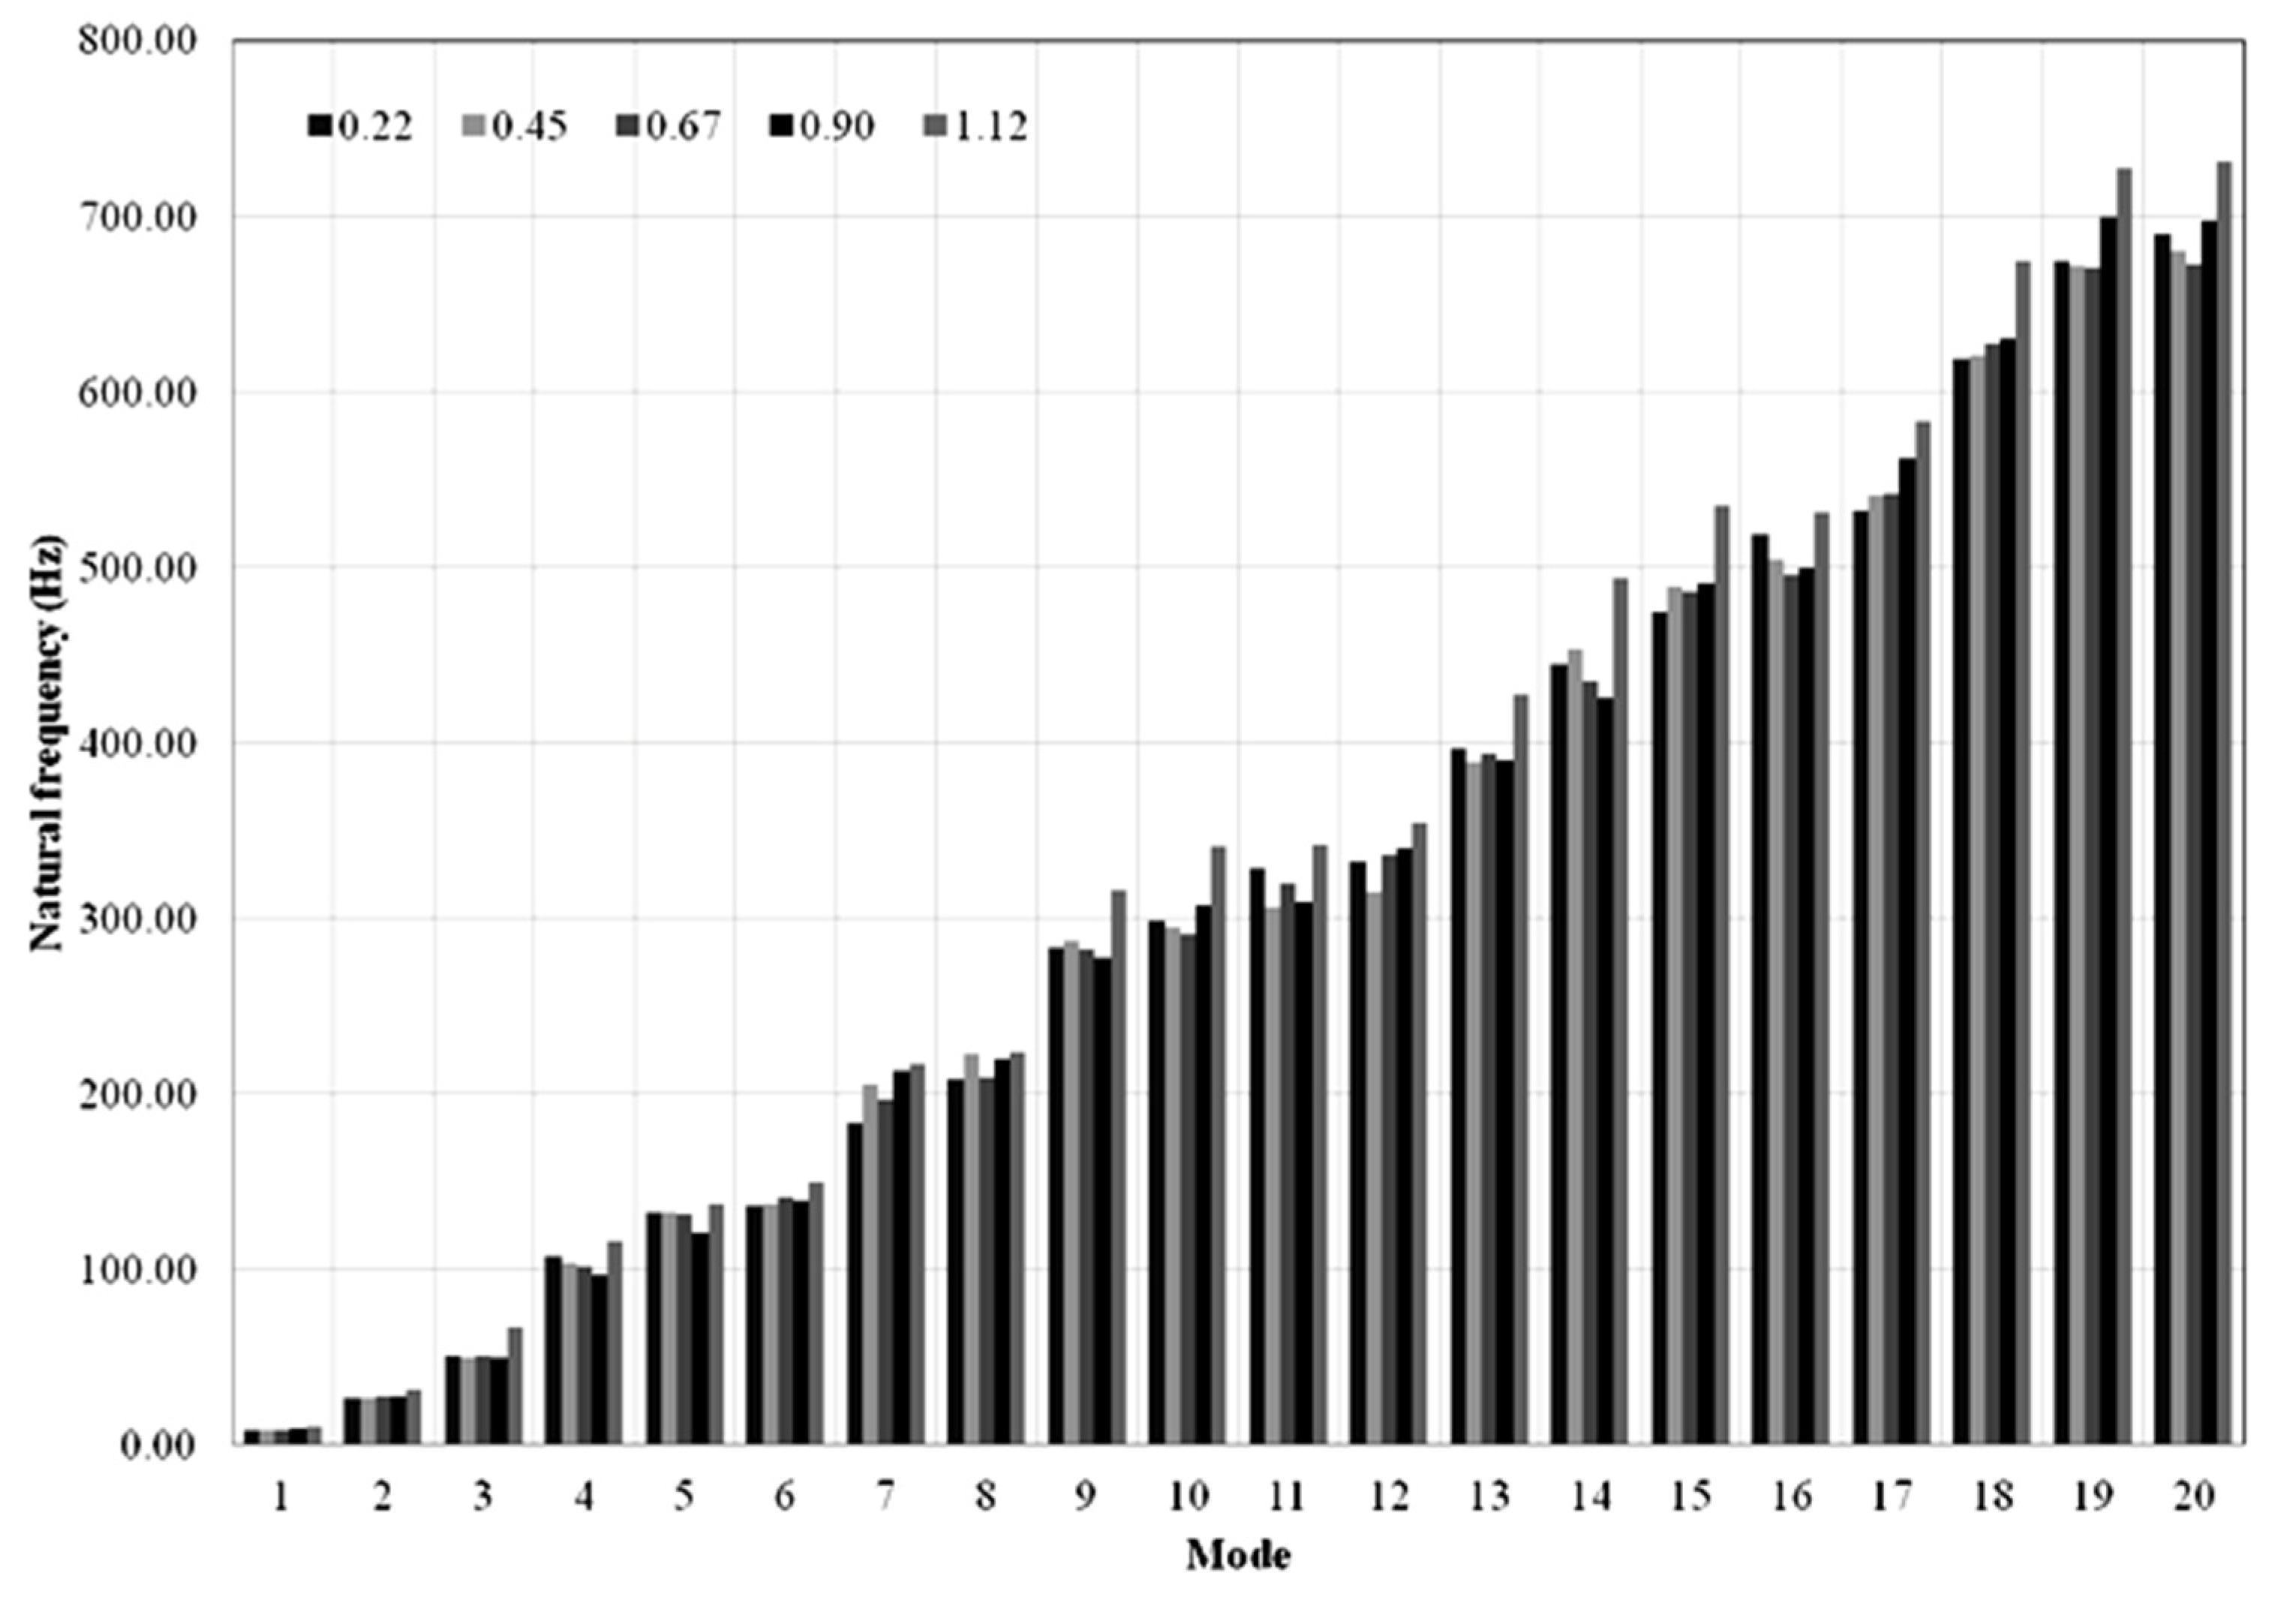
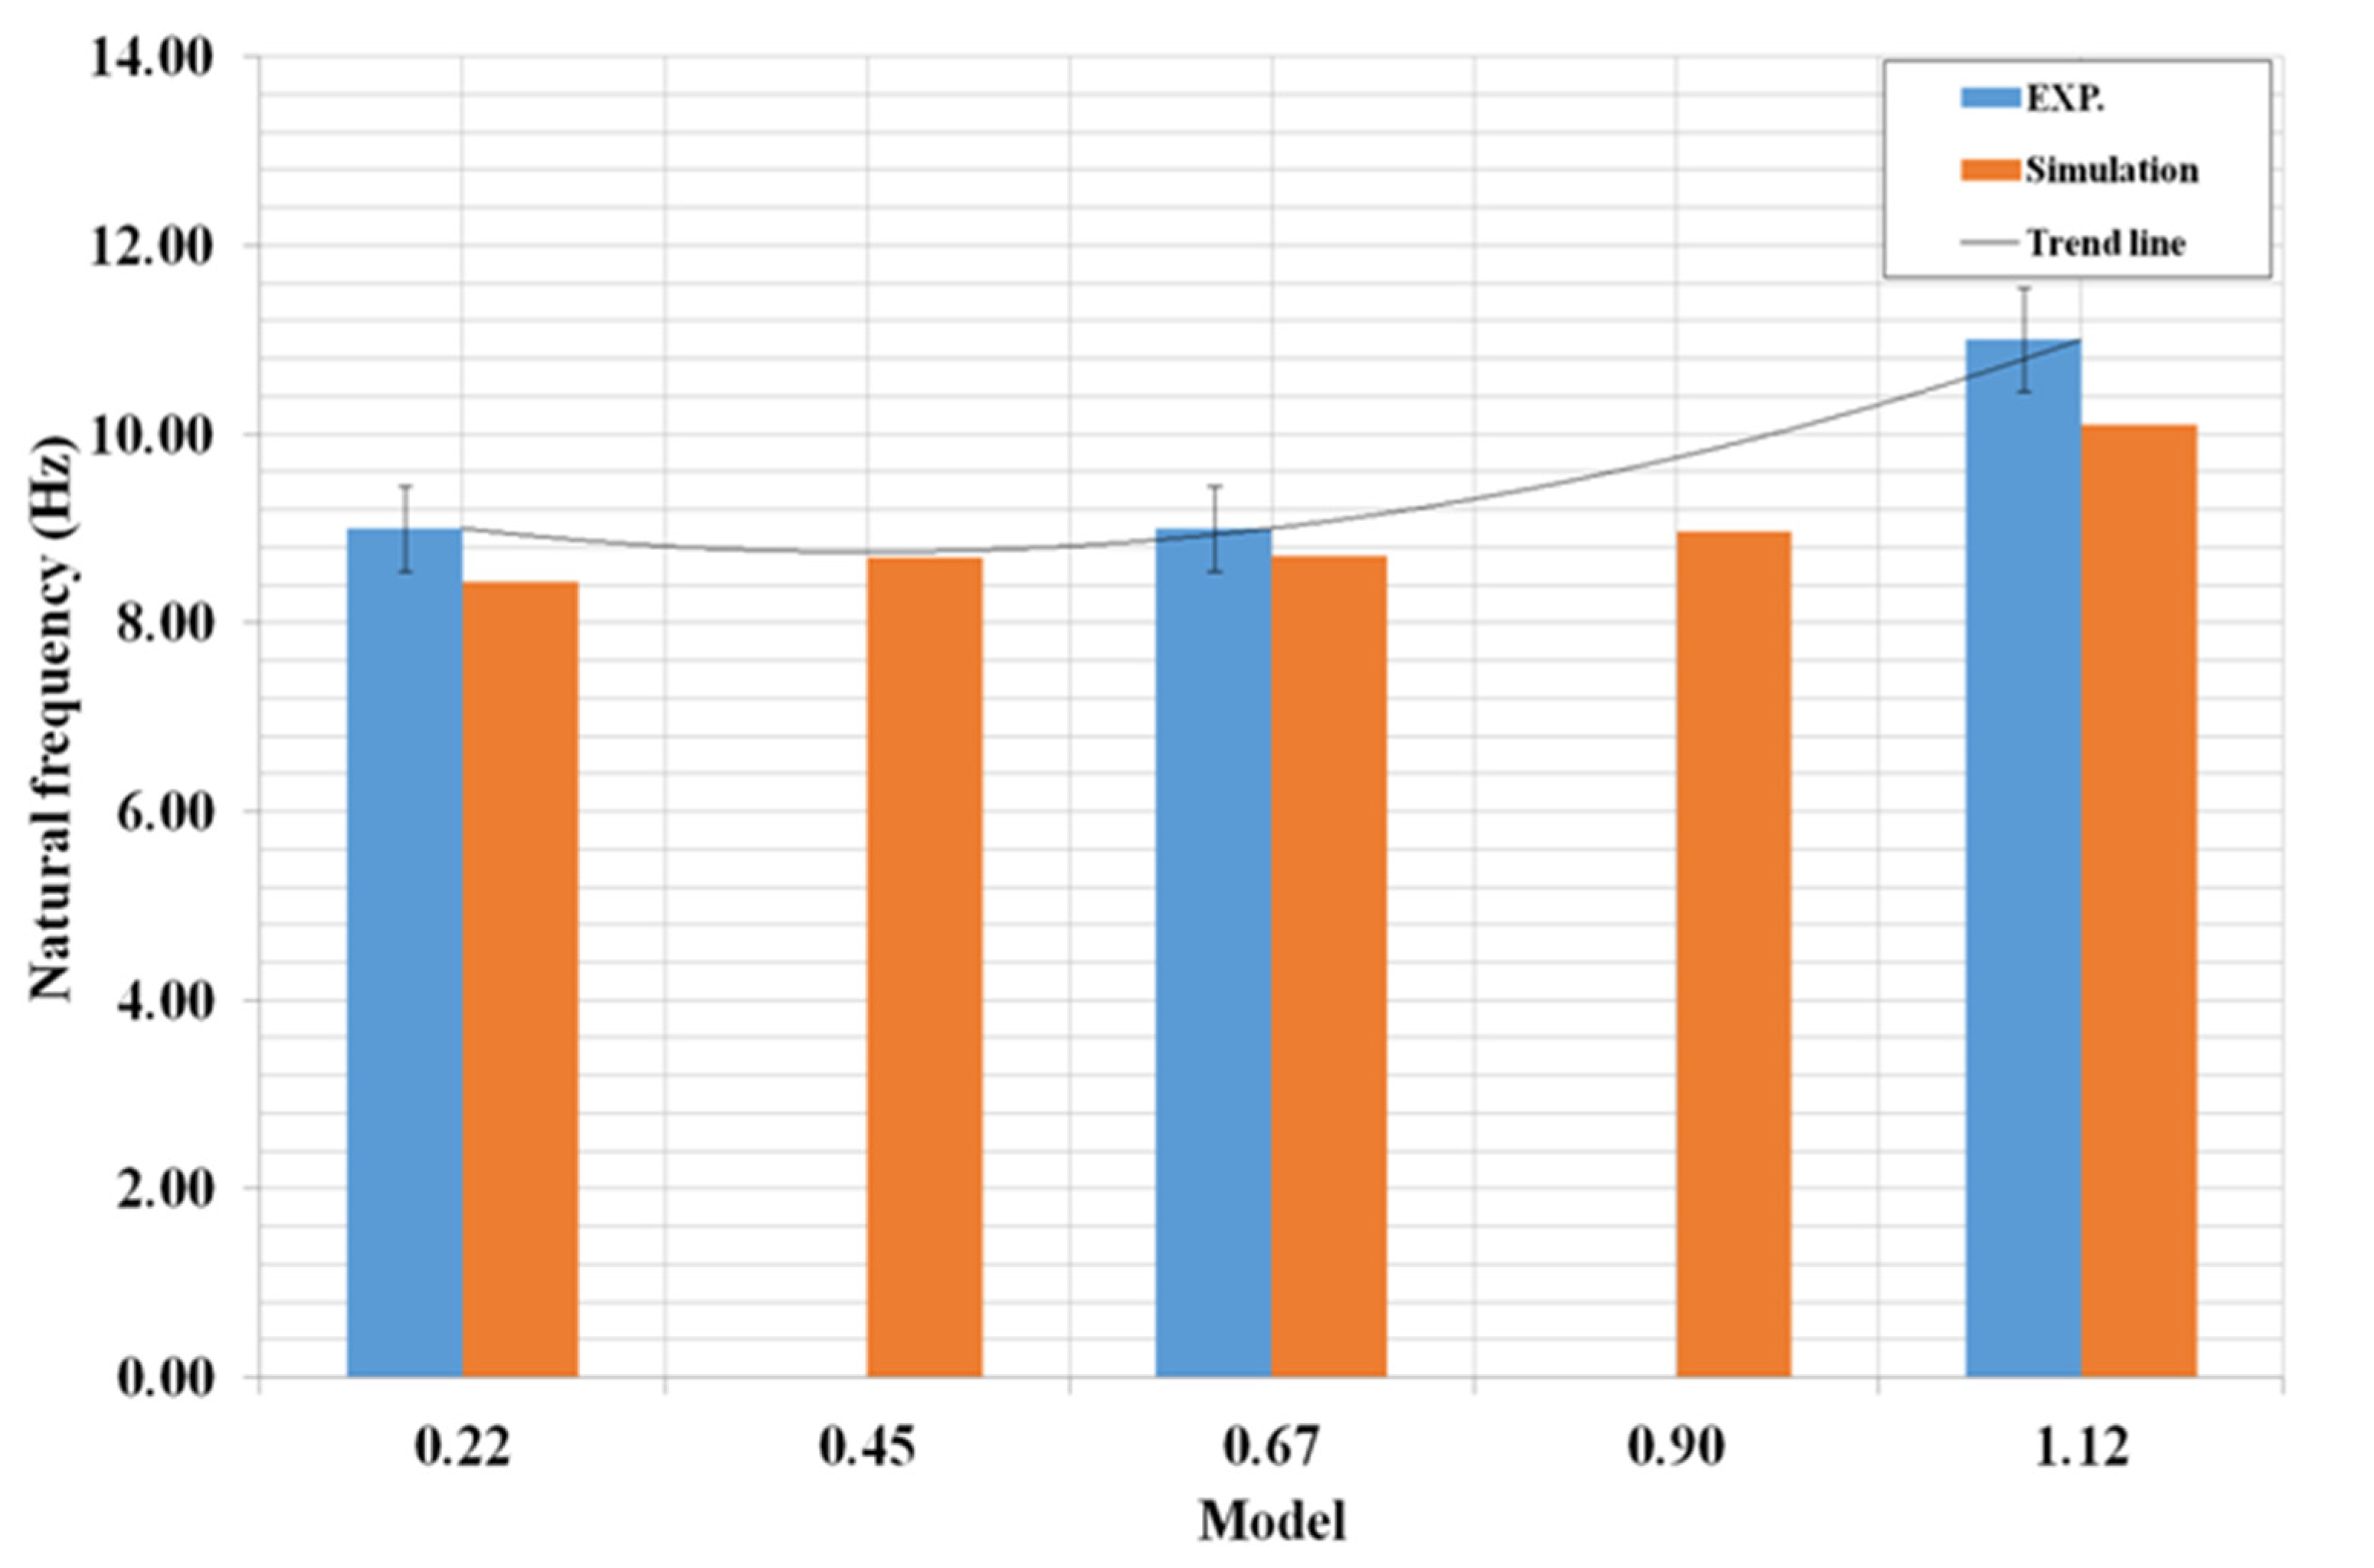
The natural frequency is found in the mode range, the maximum value in straight-tuned workpieces in dimensionless proportions is 1.12, and the tendency of the natural frequency tends from small to large values, starting from 0.22, 0.45, 0.67, 0.90, and 1.12 accordingly. In addition, it was found that the smallest natural frequency values in modes 9–14 were at 0.67 and 0.45, respectively, and would return in the same order as in the first set at mode 15. The results are shown in Figure 17. When brought, test the workpiece by a method with a good test set calibrated. Taking the set of values from the natural frequency in mode 1 (Figure 18), the dimensionless proportions tested were 0.22, 0.67, and 1.12, respectively. The natural frequencies were 9, 9.26, and 11.00 Hz, respectively. The nature obtained from the FE model was 8.44, 8.70, and 10.10 Hz, respectively; when the trend line was diversified, it could be seen that the obtained higher value A indicates the distance from the notch to the edge of the workpiece H; the smaller the shift, the higher the natural frequency. According to the works of Khoa Viet Nguyen et al. [58], C. S. Kumar et al. [27], and W. P. P. Aye et al. [59], the relationship between the location and size of cracks in beams was first studied. The finite element method calculated the natural frequencies of strong and fractured cantilevers and validated them by experimental testing. Although the position of the notch is closer to the edge of the workpiece, the value of the natural frequency is significantly higher; all three studies were tested, and the finite element method was used to confirm the test results consistent with this research’s test results.
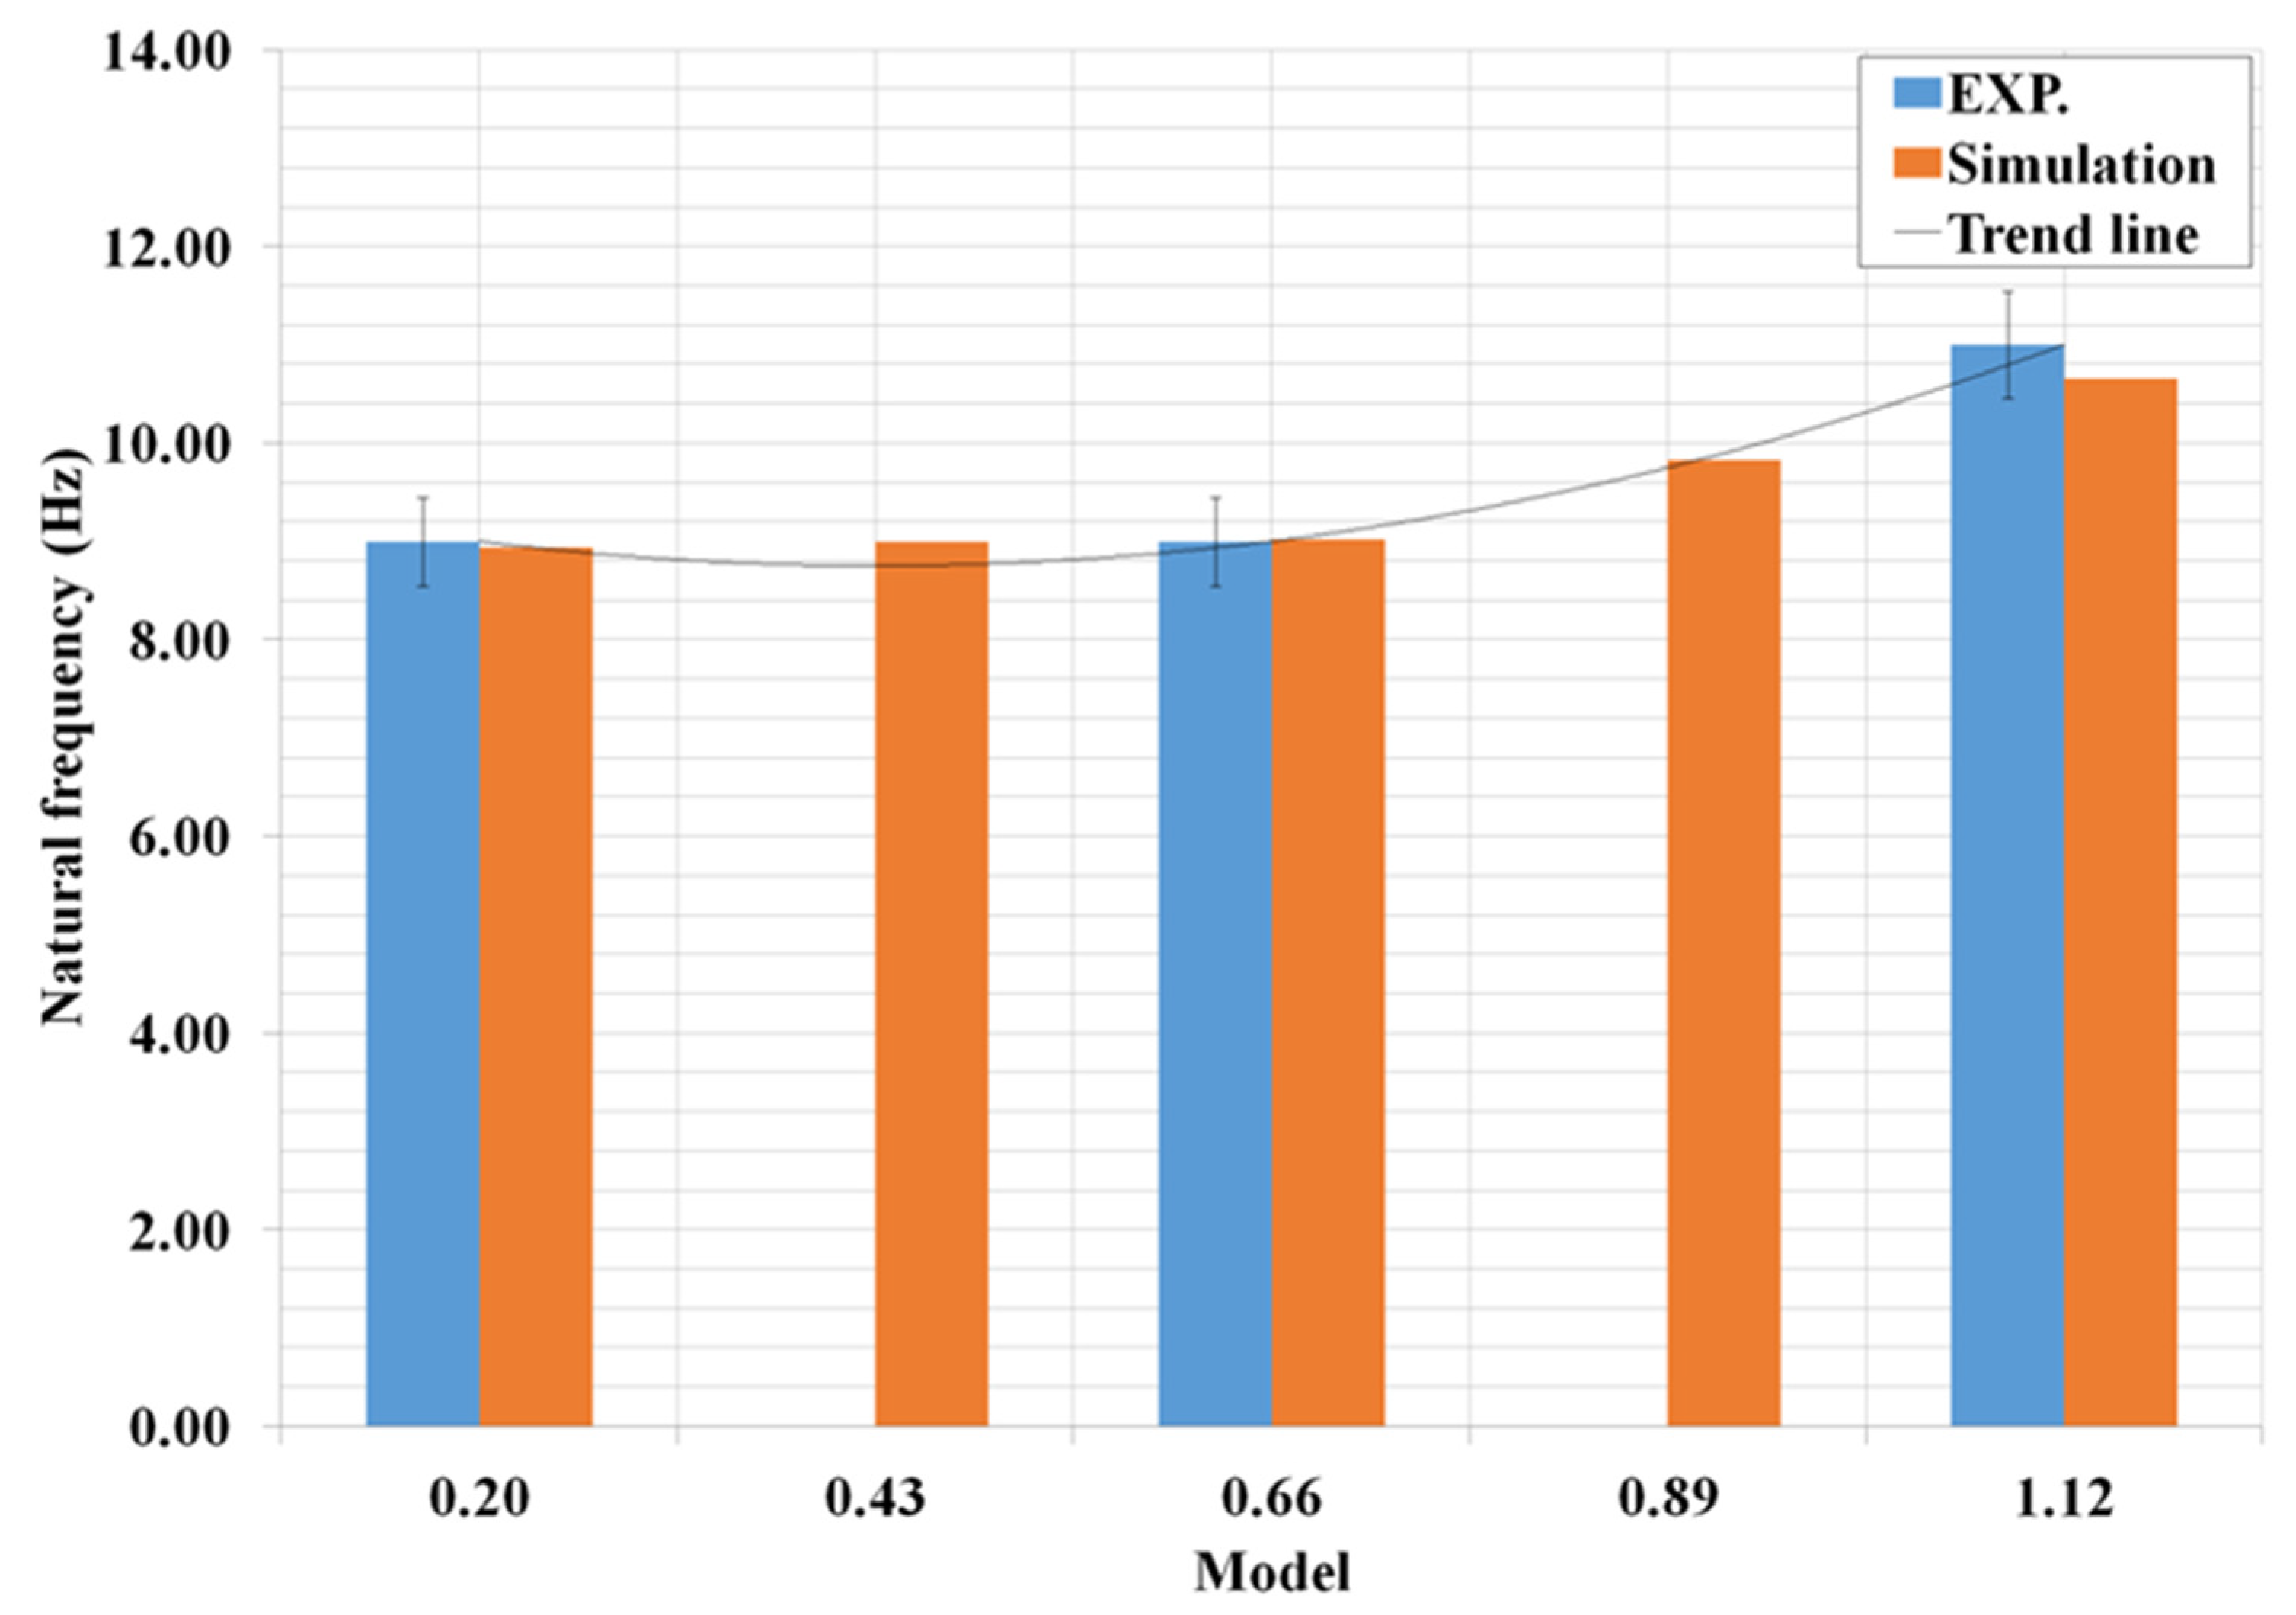
When observing (in Figure 17) the natural frequency, it was found that the maximum value of the mode range in the obliquely adjusted workpiece in the dimensionless proportion was 1.12, and the tendency of the natural frequency tended from the smallest to the most significant value, starting from 0.22, 0.45, 0.67, 0.90, and 1.12, respectively. In addition, it was found that the most miniature natural frequency in modes 9–11 was at 0.89 and 0.60, respectively, and would return in the same order as in the first force set at mode 12. as shown in Figure 19. When testing the workpiece by a method with a good test set calibrated by taking the values from the natural frequency in mode 1, the dimensionless proportions tested were 0.22, 0.67, and 1.12, respectively. The natural frequencies were 9.00, 9.14, and 11.00 Hz, respectively. The natural frequencies obtained from the model FE were 8.94, 9.02, and 10.65 Hz, respectively, and when the trendline was multiplied, it showed that the potential had a higher steepness indicating the distance from the notch to the edge of the piece. The shift H shifts result in higher natural frequencies, as shown in Figure 20, which relates to the report of Khoa Viet Nguyen et al. [58], C. S. Kumar et al. [60], and W. P. P. Aye et al. [59] who studied the relationship between the location and size of cracks in cantilever beams. First, the finite element method calculated the natural frequencies of strong and cracked cantilevers and validated them by experimental testing. Although the position of the notch is closer to the edge of the workpiece, the value of the natural frequency is higher. Significantly all three studies were tested, and the finite element method was used to confirm the test results, which were consistent with the test results of this research.
Subsequently, the workpiece was V-shaped on one side, changing the position of the notch. There are two types, straight and oblique, similar to the previous work. Each type is divided into two notch plates, as shown in Figure 21 for the oblique traverse, where the notch moves alternately, and in Figure 22 for the straight traverse, where the notch moves upward in the same direction. Modifying the shape determines the proportion by taking the distance from the notch to the vertical axis of the workpiece: L and the distance from the notch to the workpiece edge: H by the dimensionless proportions shown in Table 9. When determining the natural frequency, it was found that the mode range was the highest value in the workpiece. The 1-sided v-notch straightened in dimensionless proportions was 0.12, and the tendency of natural frequency tended from small to large values starting from 0.12, 0.24, 0.36, 0.48, and 0.60, respectively.
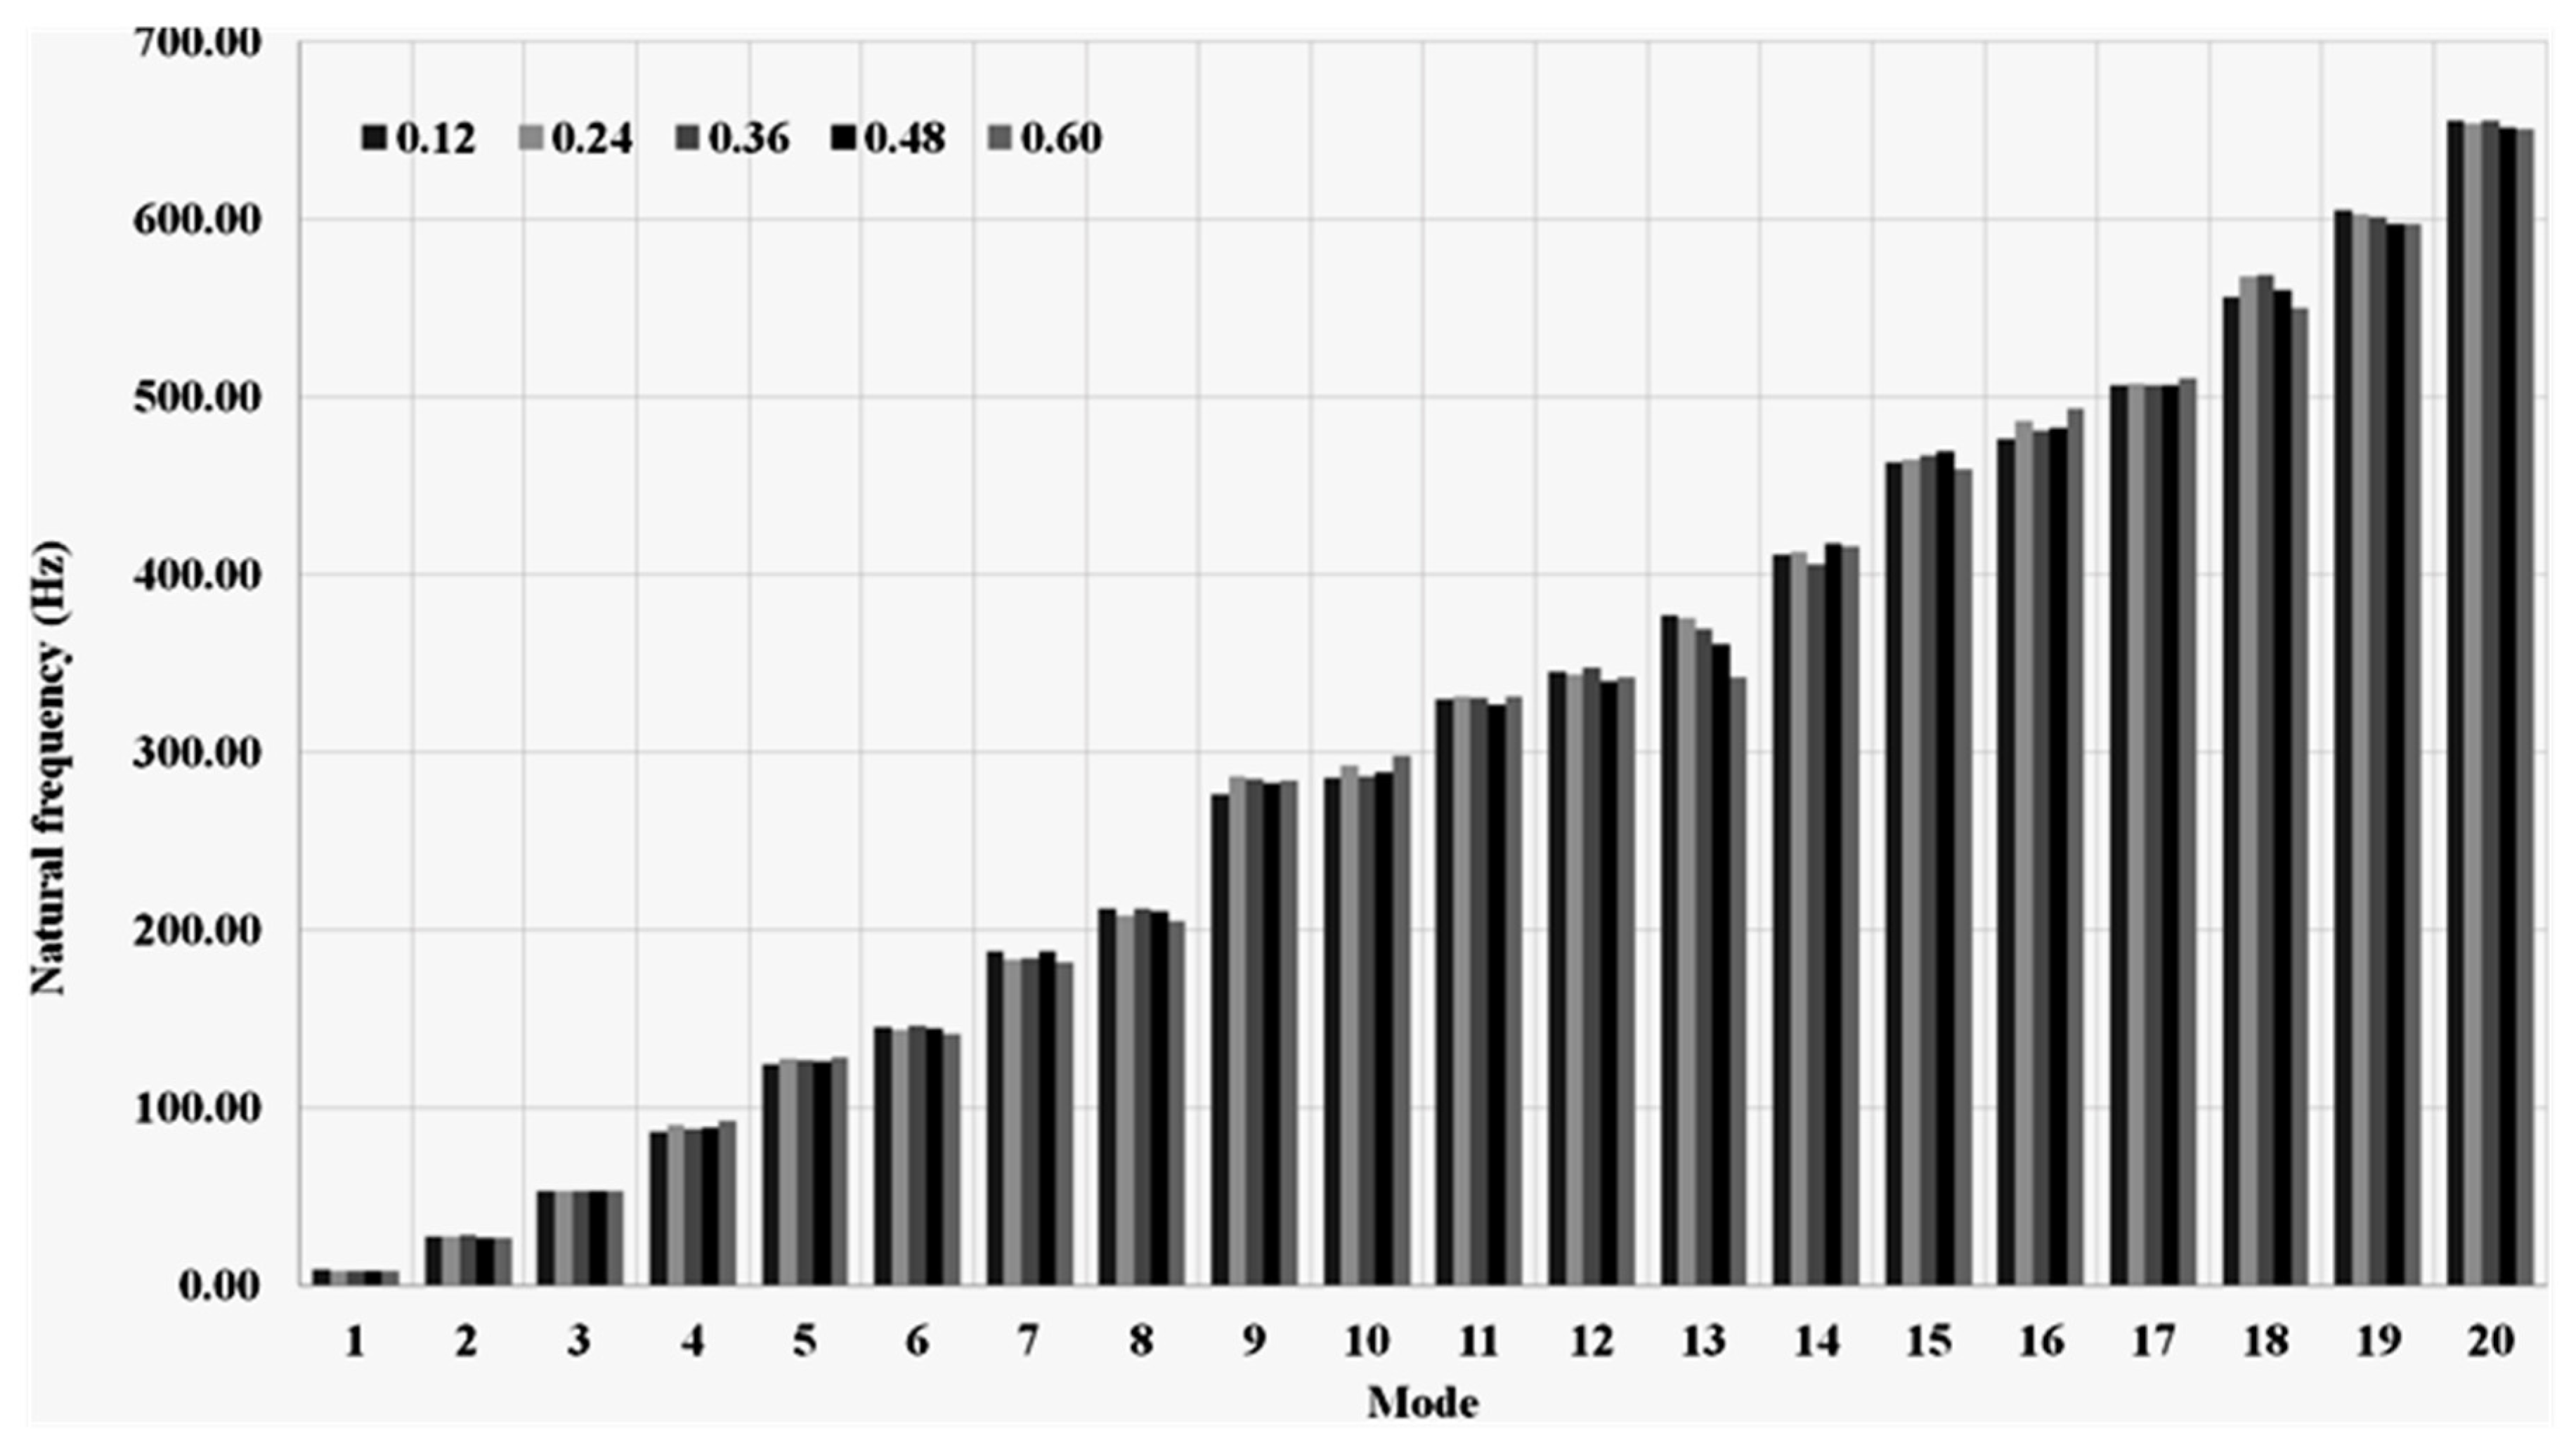
Concurrent with the test result of the specimen, there is an alternating orientation. It can be seen when the notch approaches the top edge of the changed the notch’s position. When the notch approaches the workpiece, the chevron in the resulting position will reduce the value of naturalness, consistent with the test results in this research. In addition, it was found that in modes 9–11, the minor natural frequency was at 0.60 and 0.48, respectively, and would return in the same order as in the first set of mode 12. The results are shown in Figure 23.
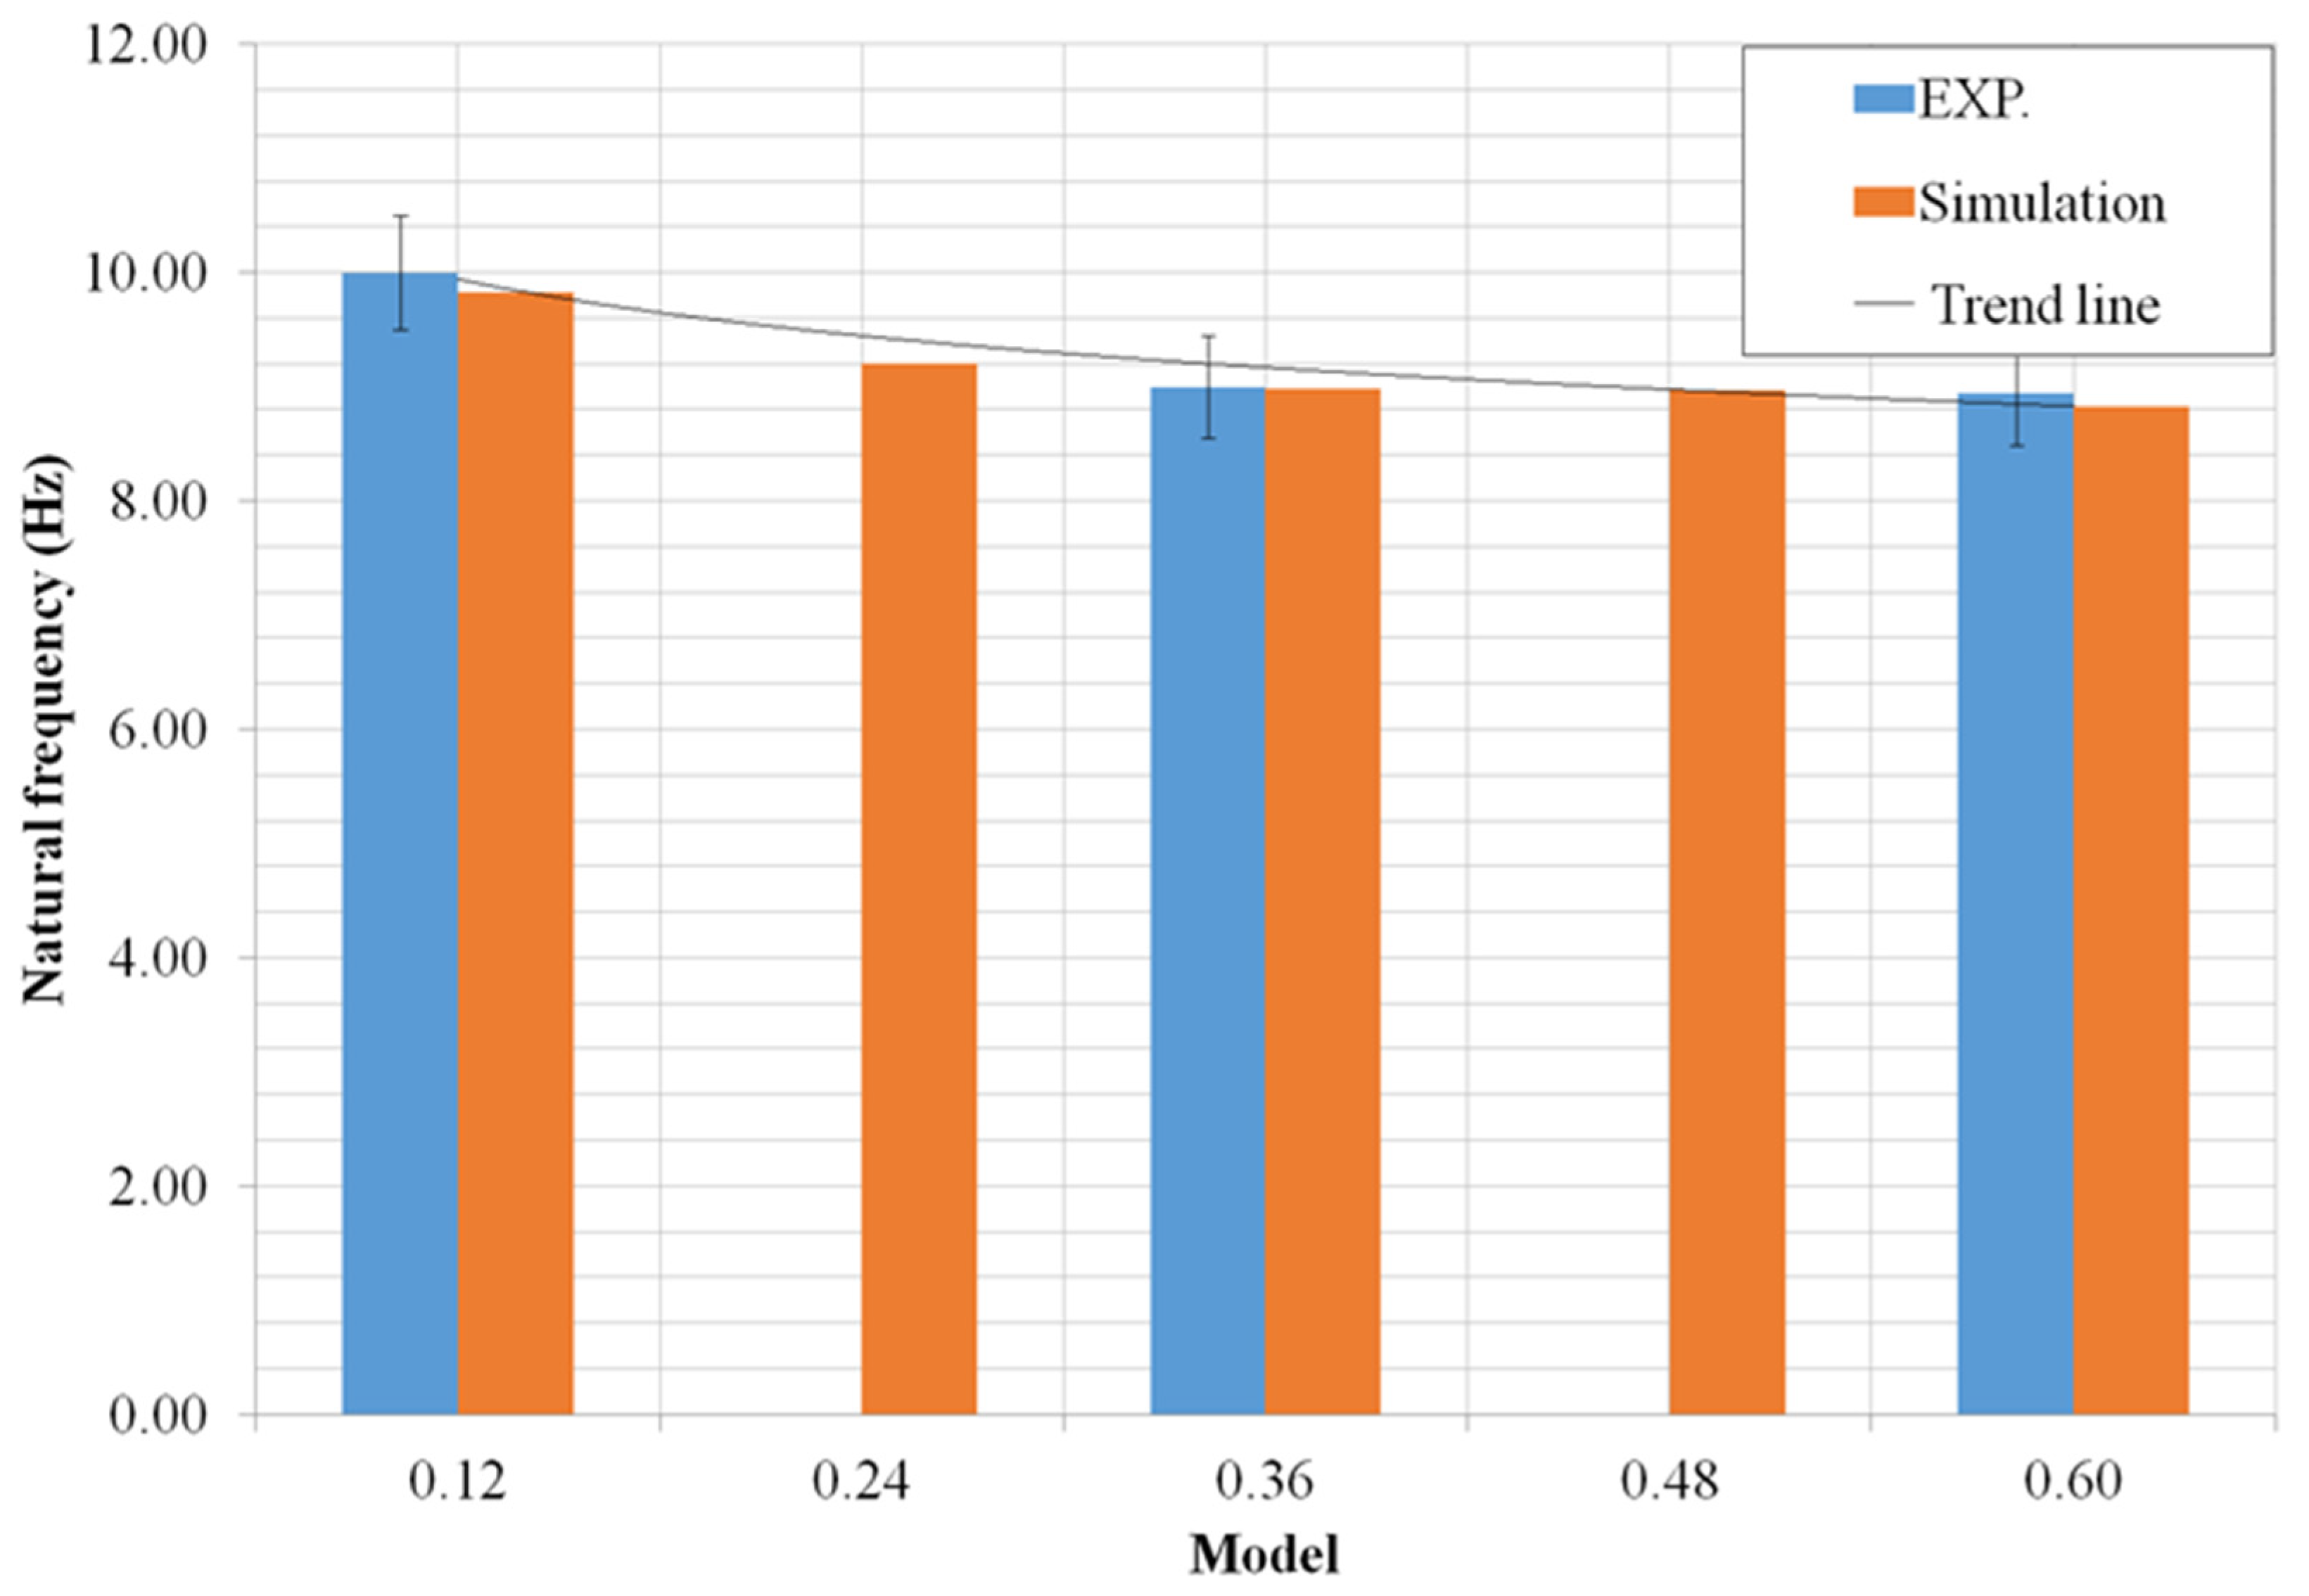
Afterward, when testing the workpiece by a method with a good test set calibration by taking the set of values from the natural frequency in mode 1, the dimensionless proportions tested were 0.12, 0.36, and 0.60, respectively, as shown in Table 10. The natural frequencies were 9.00, 8.00, and 8.00 Hz, respectively. The nature obtained from the FE model was 8.81, 8.23, and 8.09 Hz, respectively, and when trendlines were diversified, it was shown that the potential values obtained had a decrease in slope. As shown in Figure 23, the distance from the notch to the workpiece edge: the smaller the change in value, the lower the natural frequency shown in Figure 24, according to the research of C.S. Huang et al. [61] and Y. Yang et al. [62], who studied the relationship for determining the location and size of cracks in beams. The first known independent vibrations were studied for sheet metal with V notches. The V-shaped notch has the singular moment bent at an acute angle due to the transverse oscillating motion. Theoretical analysis was performed using the accepted displacement function. The finite element method calculated the natural frequency of the sheet metal that is strong and has a V-shaped notch and validated by experimental testing. When the position of the notch is closer to the edge of the workpiece, the value of the natural frequency is significantly higher. All three studies were tested, and the finite element method was used to confirm the test results consistent with this research’s test results.
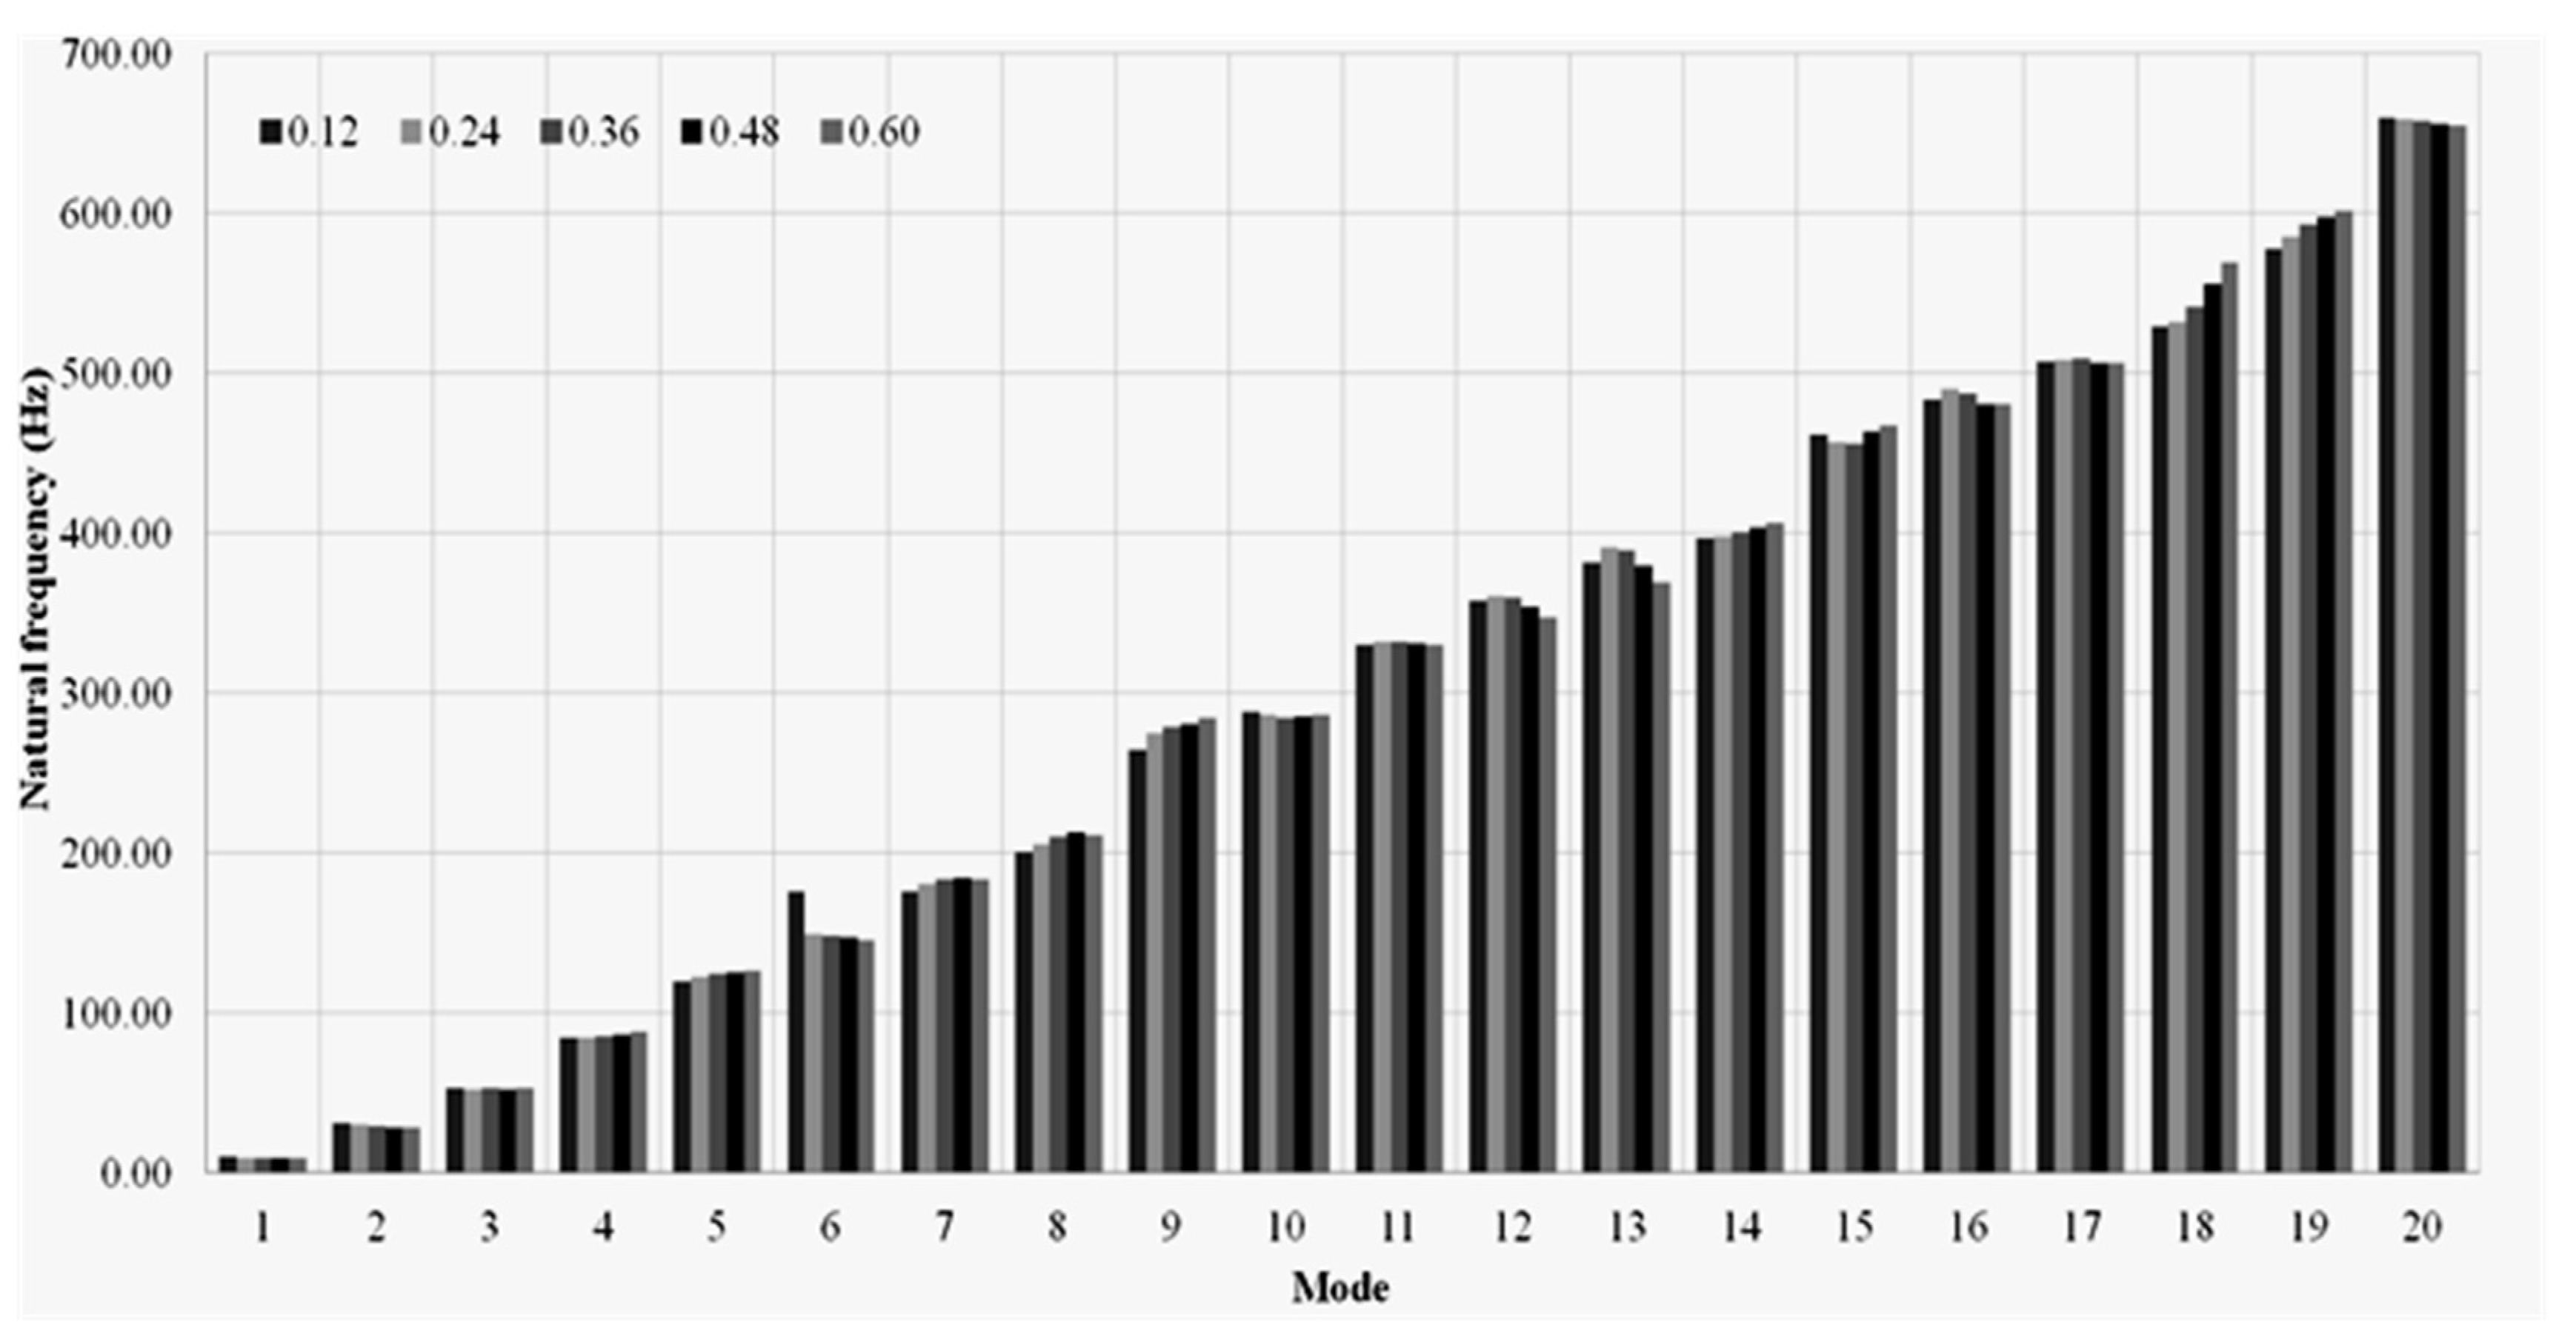
Thereon, the natural frequency found the maximum value of the mode range in the obliquely adjusted workpiece. In a V-shaped notch on one side, the natural frequency was obtained. It was found that the maximum value of the mode range in the straight workpiece in the dimensionless value was 0.12, and the tendency of the natural frequency tended from the smallest value to the most considerable value starting from 0.12, 0.24, 0.36, 0.48, and 0.60, respectively, compared with the test results of the workpiece. There is an alternating orientation. It can be seen that when the notch approaches the top edge of the workpiece in Figure 25, (follow the white arrow) according to the test results of A. W. Leissa et al. [63,64], the notch’s position changed when the notch approached the workpieces; the notch in the resulting position will decrease the value of guilelessness consistent with the test results in this research. In addition, it was found that in modes 9, 14–15, and 18–19, the minor natural frequencies were at 0.12, 0.24, 0.36, 0.48, and 0.60, respectively, and would return in the same order as in the first-period mode 12; the effect is shown in Figure 25.
Subsequently, the workpiece experienced a particular examination using a meticulously calibrated test set. The examination revealed dimensionless proportions of 0.12, 0.36, and 0.60, respectively, based on the natural frequency in mode 1. Notably, the frequencies recorded were 10.00, 9.00, and 8.94 Hz, respectively. In contrast, the finite element (FE) model predicted natural frequencies of 9.83, 8.98, and 8.83 Hz, respectively, with a noticeable decrease in slope observed when multiplying the trendlines. Further analysis revealed that the distance (H) from the notch to the workpiece edge was critical in shaping the natural frequency (Figure 26). C.S. Huang et al. [61] explored this relationship in detail and Y. Yang et al. [62] in their studies on the location and size of cracks in beams. Specifically, the first independent vibrations were studied for sheet metal with V notches, which have a singular moment bent at an acute angle due to a transverse oscillating motion. Theoretical analysis was performed using the accepted displacement function. The natural frequencies of intense and cracked beams were calculated using the finite element method, which was then validated by experimental testing. The results indicated that the position of the notch closer to the edge of the workpiece resulted in a higher natural frequency. These findings were further confirmed in both studies, thus underscoring the reliability and validity of this research approach.

5. Conclusions

In conclusion, the analysis of vibration testing in this section has provided valuable insights into its accuracy and potential for predicting damage and fracture. The behavior of two specimens was studied through experimentation and the finite element method, and their accuracy was evaluated. The results were analyzed using Simulink, providing a deeper understanding of the relationship between frequency and time and force and time. The natural frequencies obtained from the FE model were utilized to predict the onset of internal damage and carbon steel fracture. This study’s findings have the potential to inspire further research and development in the field of V-shaped plate vibration testing. The study found that the two V-shaped plates exhibit varying natural frequency values. Specifically, the double-sided V-shaped plate demonstrated an increase in natural frequency, while the single-sided notched V-shaped plate showed a significant decrease in natural frequency. These observations were consistent across both oblique and straight position adjustments, indicating the reliability of the results. In addition, the experimental natural frequencies were compared to those calculated using the finite element method model. The comparative analysis revealed that the calculated frequencies from the model presented in Figure 18, Figure 20, Figure 24, and Figure 26 are remarkably similar to the experimental measurements.
Furthermore, the calculated results from the model demonstrate high consistency. However, the experiment is essential to take note of the significant changes in value once the shape reaches its seventh mode. Recent observations have shown that the calculated value generated by the finite element method model surpasses the actual experimental value, raising concerns regarding the model’s reliability and accuracy in predicting values beyond the seventh mode shape. To establish more dependable and accurate models that can predict values at higher shape modes, further research is necessary to identify the underlying factors leading to this deviation. Acknowledging that finite element modeling is a precise and valuable tool for determining natural frequencies is essential.

Author Contributions

Conceptualization, K.C. and T.S.; methodology, K.C.; software, T.S.; validation, K.C. and T.S.; formal analysis, K.C.; investigation, K.C.; resources, K.C.; data curation, K.C.; writing—original draft preparation, K.C.; writing—review and editing, K.C. and T.S. All authors have read and agreed to the published version of the manuscript.

Funding

This research received no external funding.

Institutional Review Board Statement

Not applicable.

Informed Consent Statement

Not applicable.

Data Availability Statement

The data are contained within the article.

Conflicts of Interest

The authors declare no conflict of interest.

References

  1. Chan, T.H.T.; Ashebo, D.B. Theoretical study of moving force identification on continuous bridges. J. Sound Vib. 2006, 295, 870–883. [Google Scholar] [CrossRef]
  2. Law, S.S.; Bu, J.Q.; Zhu, X.Q.; Chan, S.L. Moving load identification on a simply supported orthotropic plate. Int. J. Mech. Sci. 2007, 49, 1262–1275. [Google Scholar] [CrossRef]
  3. Kim, T.; Lee, U. Vibration analysis of thin plate structures subjected to a moving force using frequency-domain spectral element method. Shock. Vib. 2018, 2018, 1908508. [Google Scholar] [CrossRef]
  4. Ghafoori, E.; Kargarnovin, M.; Ghahremani, A.R. Dynamic responses of a rectangular plate under motion of an oscillator using a semi-analytical method. J. Vib. Control. 2010, 17, 1310–1324. [Google Scholar] [CrossRef]
  5. Amiri, J.V.; Nikkhoo, A.; Davoodi, M.R.; Hassanabadi, M.E. Vibration analysis of a Mindlin elastic plate under a moving mass excitation by eigenfunction expansion method. Thin-Walled Struct. 2013, 62, 53–64. [Google Scholar] [CrossRef]
  6. Bajer, C.I.; Dyniewicz, B. Numerical Analysis of Vibrations of Structures under Moving Inertial Load; Springer: Berlin, Germany, 2012. [Google Scholar]
  7. Shadnam, M.R.; Rofooei, F.R.; Mofid, M.; Mehri, B. Periodicity in the response of nonlinear plate, under moving mass. Thin-Walled Struct. 2002, 40, 283–295. [Google Scholar] [CrossRef]
  8. Yang, Y.; Ding, H.; Chen, L.-Q. Dynamic response to a moving load of a Timoshenko beam resting on a nonlinear viscoelastic foundation. Acta Mech. Sin. 2013, 29, 718–727. [Google Scholar] [CrossRef]
  9. Vosoughi, A.R.; Malekzadeh, P.; Razi, H. Response of moderately thick laminated composite plates on elastic foundation subjected to moving load. Compos. Struct. 2013, 97, 286–295. [Google Scholar] [CrossRef]
  10. Wang, X.; Jin, C. Differential Quadrature Analysis of Moving Load Problems. Adv. Appl. Math. Mech. 2016, 8, 536–555. [Google Scholar] [CrossRef]
  11. Wu, J.-S.; Lee, M.-L.; Lai, T.-S. The dynamic analysis of a flat plate under a moving load by the finite element method. Int. J. Numer. Methods Eng. 1987, 24, 743–762. [Google Scholar] [CrossRef]
  12. Ghafoori, E.; Asghari, M. Dynamic analysis of laminated composite plates traversed by a moving mass based on a first-order theory. Compos. Struct. 2010, 92, 1865–1876. [Google Scholar] [CrossRef]
  13. Baltzis, K.B. The finite element method magnetics (FEMM) freeware package: May it serve as an educational tool in teaching electromagnetics? Educ. Inf. Technol. 2010, 15, 19–36. [Google Scholar] [CrossRef]
  14. Chondros, T.G.; Dimorogonas, A.D.; Yao, J. Vibration of a beam with a breathing crack. J. Sound Vib. 2001, 239, 457–475. [Google Scholar] [CrossRef]
  15. Wu, J.-J. Free vibration characteristics of a rectangular plate carrying multiple three-degree-of-freedom spring–mass systems using equivalent mass method. Int. J. Solids Struct. 2006, 43, 727–746. [Google Scholar] [CrossRef]
  16. Gawande, S.H.; More, R.R. Effect of Notch Depth & Location on Modal Natural Frequency of Cantilever Beams. Structures 2016, 8, 121–129. [Google Scholar] [CrossRef]
  17. Wang, J.; Fu, M.; Shi, S. Influences of size effect and stress condition on ductile fracture behavior in micro-scaled plastic deformation. Mater. Des. 2017, 131, 69–80. [Google Scholar] [CrossRef]
  18. Wang, J.; Li, C.; Wan, Y.; Zhang, C.; Ran, J.; Fu, M. Size effect on the shear damage under low stress triaxiality in micro-scaled plastic deformation of metallic materials. Mater. Des. 2020, 196, 109107. [Google Scholar] [CrossRef]
  19. Jing, C.; Wang, J.; Zhang, C.; Sun, Y.; Shi, Z. Influence of Size Effect on Dynamic Mechanical Properties of OFHC Copper at Micro/Mesoscopic Scale. Res. Sq. 2021, 1–32. [Google Scholar] [CrossRef]
  20. Djidrov, M.; Gavriloski, V.; Jovanova, J. Vibration analysis of cantilever beam for damage detection. FME Trans. 2014, 42, 311–316. [Google Scholar] [CrossRef]
  21. Liang, R.Y.; Choy, F.K.; Hu, J. Detection of cracks in beam structures using measurements of natural frequencies. J. Frankl. Inst. 1991, 328, 505–518. [Google Scholar] [CrossRef]
  22. Li, B.; Chen, X.; Ma, J.; He, Z. Detection of crack location and size in structures using wavelet finite element methods. J. Sound Vib. 2005, 285, 767–782. [Google Scholar] [CrossRef]
  23. Barad, K.H.; Sharma, D.S.; Vyas, V. Crack Detection in Cantilever Beam by Frequency based method. Procedia Eng. 2013, 51, 770–775. [Google Scholar] [CrossRef]
  24. Reddy, L.R.; Debora, S.N. Damage detection in structural elements using frequency contour method. In Proceedings of the 2017 First International Conference on Recent Advances in Aerospace Engineering (ICRAAE), Coimbatore, India, 3–4 March 2017; pp. 1–6. [Google Scholar]
  25. Rizos, P.; Aspragathos, N.; Dimarogonas, A.D. Identification of crack location and magnitude in a cantilever beam from the vibration modes. J. Sound Vib. 1990, 138, 381–388. [Google Scholar] [CrossRef]
  26. Labib, A.; Kennedy, D.; Featherston, C. Free vibration analysis of beams and frames with multiple cracks for damage detection. J. Sound Vib. 2014, 333, 4991–5003. [Google Scholar] [CrossRef]
  27. Agarwalla, D.; Parhi, D.R. Effect of Crack on Modal Parameters of a Cantilever Beam Subjected to Vibration. Procedia Eng. 2013, 51, 665–669. [Google Scholar] [CrossRef]
  28. Ostachowicz, W.; Krawczuk, M. Analysis of the effect of cracks on the natural frequencies of a cantilever beam. J. Sound Vib. 1991, 150, 191–200. [Google Scholar] [CrossRef]
  29. Owolabi, G.; Swamidas, A.; Seshadri, R. Crack detection in beams using changes in frequencies and amplitudes of frequency response functions. J. Sound Vib. 2003, 265, 1–22. [Google Scholar] [CrossRef]
  30. Yaman, Y. Vibrations of open-section channels: A coupled flexural and torsional wave analysis. J. Sound Vib. 1997, 204, 131–158. [Google Scholar] [CrossRef]
  31. Piana, G.; Lofrano, E.; Manuello, A.; Ruta, G. Natural frequencies and buckling of compressed non-symmetric thin-walled beams. Thin-Walled Struct. 2017, 111, 189–196. [Google Scholar] [CrossRef]
  32. Augello, R.; Daneshkhah, E.; Xu, X.; Carrera, E. Efficient CUF-based method for the vibrations of thin-walled open cross-section beams under compression. J. Sound Vib. 2021, 510, 116232. [Google Scholar] [CrossRef]
  33. Mohri, F.; Azrar, L.; Potier-Ferry, M. Vibration analysis of buckled thin-walled beams with open sections. J. Sound Vib. 2004, 275, 434–446. [Google Scholar] [CrossRef]
  34. William, D.; Callister, J.; Rethwisch, D.G. Materials Science and Engineering, 8th ed.; John Wiley & Sons, Inc.: Hoboken, NJ, USA, 2009. [Google Scholar]
  35. Zheng, D.Y. Free Vibration Analysis of a Cracked Beam by finite Element Method. J. Sound Vib. 2004, 273, 457–475. [Google Scholar] [CrossRef]
  36. Gudmunson, P. Eigen frequency changes of structures due to cracks, notches or other geometrical changes. J. Mech. Phys. Solids 1982, 30, 339–353. [Google Scholar] [CrossRef]
  37. Khalkar, V.; Ramachandran, S. Analysis of the effect of V-shape and Rectangular Shape cracks on the natural frequencies of a spring steel cantilever beam. Mater. Today Proc. 2018, 5, 855–862. [Google Scholar] [CrossRef]
  38. Endo, A.; Itoyama, R.; Kuroda, J.; Uchino, D.; Ogawa, K.; Ikeda, K.; Kato, T.; Narita, T.; Kato, H. Vibration Characteristics of Flexible Steel Plate on Proposed Magnetic Levitation System Using Gravity. Vibration 2022, 5, 936–945. [Google Scholar] [CrossRef]
  39. Lenggana, B.W.; Prabowo, A.R.; Ubaidillah, U.; Imaduddin, F.; Surojo, E.; Nubli, H.; Adiputra, R. Effects of mechanical vibration on designed steel-based plate geometries: Behavioral estimation subjected to applied material classes using finite-element method. Curved Layer Struct. 2021, 8, 225–240. [Google Scholar] [CrossRef]
  40. González, A.; Olazagoitia, J.L.; Vinolas, J. A Low-Cost Data Acquisition System for Automobile Dynamics Applications. Sensors 2018, 18, 366. [Google Scholar] [CrossRef] [PubMed]
  41. Ghazali, M.H.M.; Rahiman, W. An Investigation of the Reliability of Different Types of Sensors in the Real-Time Vibration-Based Anomaly Inspection in Drone. Sensors 2022, 22, 6015. [Google Scholar] [CrossRef]
  42. Grębowski, K.; Rucka, M.; Wilde, K. Non-Destructive Testing of a Sport Tribune under Synchronized Crowd-Induced Excitation Using Vibration Analysis. Mater. Today Proc. 2019, 12, 2148. [Google Scholar] [CrossRef]
  43. Melosh, R.J. Modeling Accuracy in FEA of Vibrations of a Drumhead. Shock. Vib. 1993, 1, 15–20. [Google Scholar] [CrossRef]
  44. Ridwan, R.; Prabowo, A.R.; Muhayat, N.; Putranto, T.; Sohn, J.M. Tensile analysis and assessment of carbon and alloy steels using FE approach as an idealization of material fractures under collision and grounding. Curved Layer Struct. 2020, 7, 188–198. [Google Scholar] [CrossRef]
  45. Orhan, S. Analysis of free and forced vibration of a cracked cantilever beam. NDT E Int. 2007, 40, 443–450. [Google Scholar] [CrossRef]
  46. Zsolt, H. Vibration of cracked reinforced and prestressed concrete beams. Archit. Civ. Eng. 2008, 6, 155–164. [Google Scholar]
  47. Meghdari, A.; Behzad, M.; Ebrahimi, A. A continuous vibration theory for beams with a vertical edge crack. Mech. Eng. 2010, 2010, 194–204. [Google Scholar]
  48. Logan, D.L. A First Course in the Finite Element Method, 4th ed.; Thomson: Stamford, CT, USA, 2004. [Google Scholar]
  49. Komarizadehasl, S.; Mobaraki, B.; Ma, H.; Lozano-Galant, J.-A.; Turmo, J. Development of a Low-Cost System for the Accurate Measurement of Structural Vibrations. Sensors 2021, 21, 6191. [Google Scholar] [CrossRef]
  50. Kumar, S.; Kolekar, T.; Patil, S.; Bongale, A.; Kotecha, K.; Zaguia, A.; Prakash, C. A Low-Cost Multi-Sensor Data Acquisition System for Fault Detection in Fused Deposition Modelling. Sensors 2022, 22, 517. [Google Scholar] [CrossRef]
  51. Yoon, H.-I.; Son, I.-S.; Ahn, S.-J. Vibration analysis of Euler-Bernoulli beam with double cracks. J. Mech. Sci. Technol. 2007, 21, 476–485. [Google Scholar] [CrossRef]
  52. Prabowo, A.R.; Laksono, F.B.; Sohn, J.M. Investigation of structural performance subjected to impact loading using finite element approach: Case of ship-container collision. Curved Layer Struct. 2020, 7, 17–28. [Google Scholar] [CrossRef]
  53. Dumond, P.; Monette, D.; Alladkani, F.; Akl, J.; Chikhaoui, I. Simplified setup for the vibration study of plates with simply-supported boundary conditions. MethodsX 2019, 6, 2106–2117. [Google Scholar] [CrossRef]
  54. Luo, K.; Lei, X.; Ou, K. Study on the influence of damping plates on structural vibration and radiation characteristics of the railway box girder. J. Low Freq. Noise Vib. Act. Control 2021, 40, 252–262. [Google Scholar] [CrossRef]
  55. Ahmed, E.; Badaruzzaman, W.W.; Wright, H. Experimental and finite element study of profiled steel sheet dry board folded plate structures. Thin-Walled Struct. 2000, 28, 125–143. [Google Scholar] [CrossRef]
  56. Ahmed, E.; Badaruzzaman, W.H.W. Vibration Performance of Profiled Steel Sheet Dry Board Composite Floor Panel. KSCE J. Civ. Eng. 2013, 17, 133–138. [Google Scholar] [CrossRef]
  57. Cawley, P.; Adams, R.D. The location of defects in structures from measurements of natural frequencies. J. Strain Alysis Eng. Des. 1979, 14, 49–57. [Google Scholar] [CrossRef]
  58. Nguyen, K.V. Mode shapes analysis of a cracked beam and its application for crack detection. J. Sound Vib. 2014, 333, 848–872. [Google Scholar] [CrossRef]
  59. Aye, W.P.P.; Htike, T.M. Inverse method for identification of edge crack using correlation model. SN Appl. Sci. 2019, 1, 590. [Google Scholar] [CrossRef]
  60. Kumar, C.S.; Rao, M.P.; Rao, L.G.; Chintala, D. Numerical Simulation of Cantilever Beam with Multiple Cracks Using Neural Networks and Multiple Regression Analysis Tool. Int. J. Innov. Res. Sci. Eng. Technol. 2016, 5, 12502–12511. [Google Scholar]
  61. Huang, C.; Leissa, A.; Liao, S. Vibration analysis of rectangular plates with edge V-notches. Int. J. Mech. Sci. 2008, 50, 1255–1262. [Google Scholar] [CrossRef]
  62. Yang, Y.; Cheng, C.; Niu, Z.; Hu, Z. Free vibration analysis for V-notched Mindlin plates with free or clamped radial edges. Acta Mech. 2022, 233, 2271–2285. [Google Scholar] [CrossRef]
  63. Leissa, A.; McGee, O.; Huang, C. Vibrations Of Circular Plates Having V-notches Or Sharp Radial Cracks. J. Sound Vib. 1993, 16, 227–239. [Google Scholar] [CrossRef]
  64. Leissa, A.W.; Huang, C.S.; Chang, M.J. Accurate frequencies and mode shapes for moderately thick, cantilevered, skew plates. Int. J. Struct. Stab. Dyn. 2007, 7, 425–440. [Google Scholar] [CrossRef]
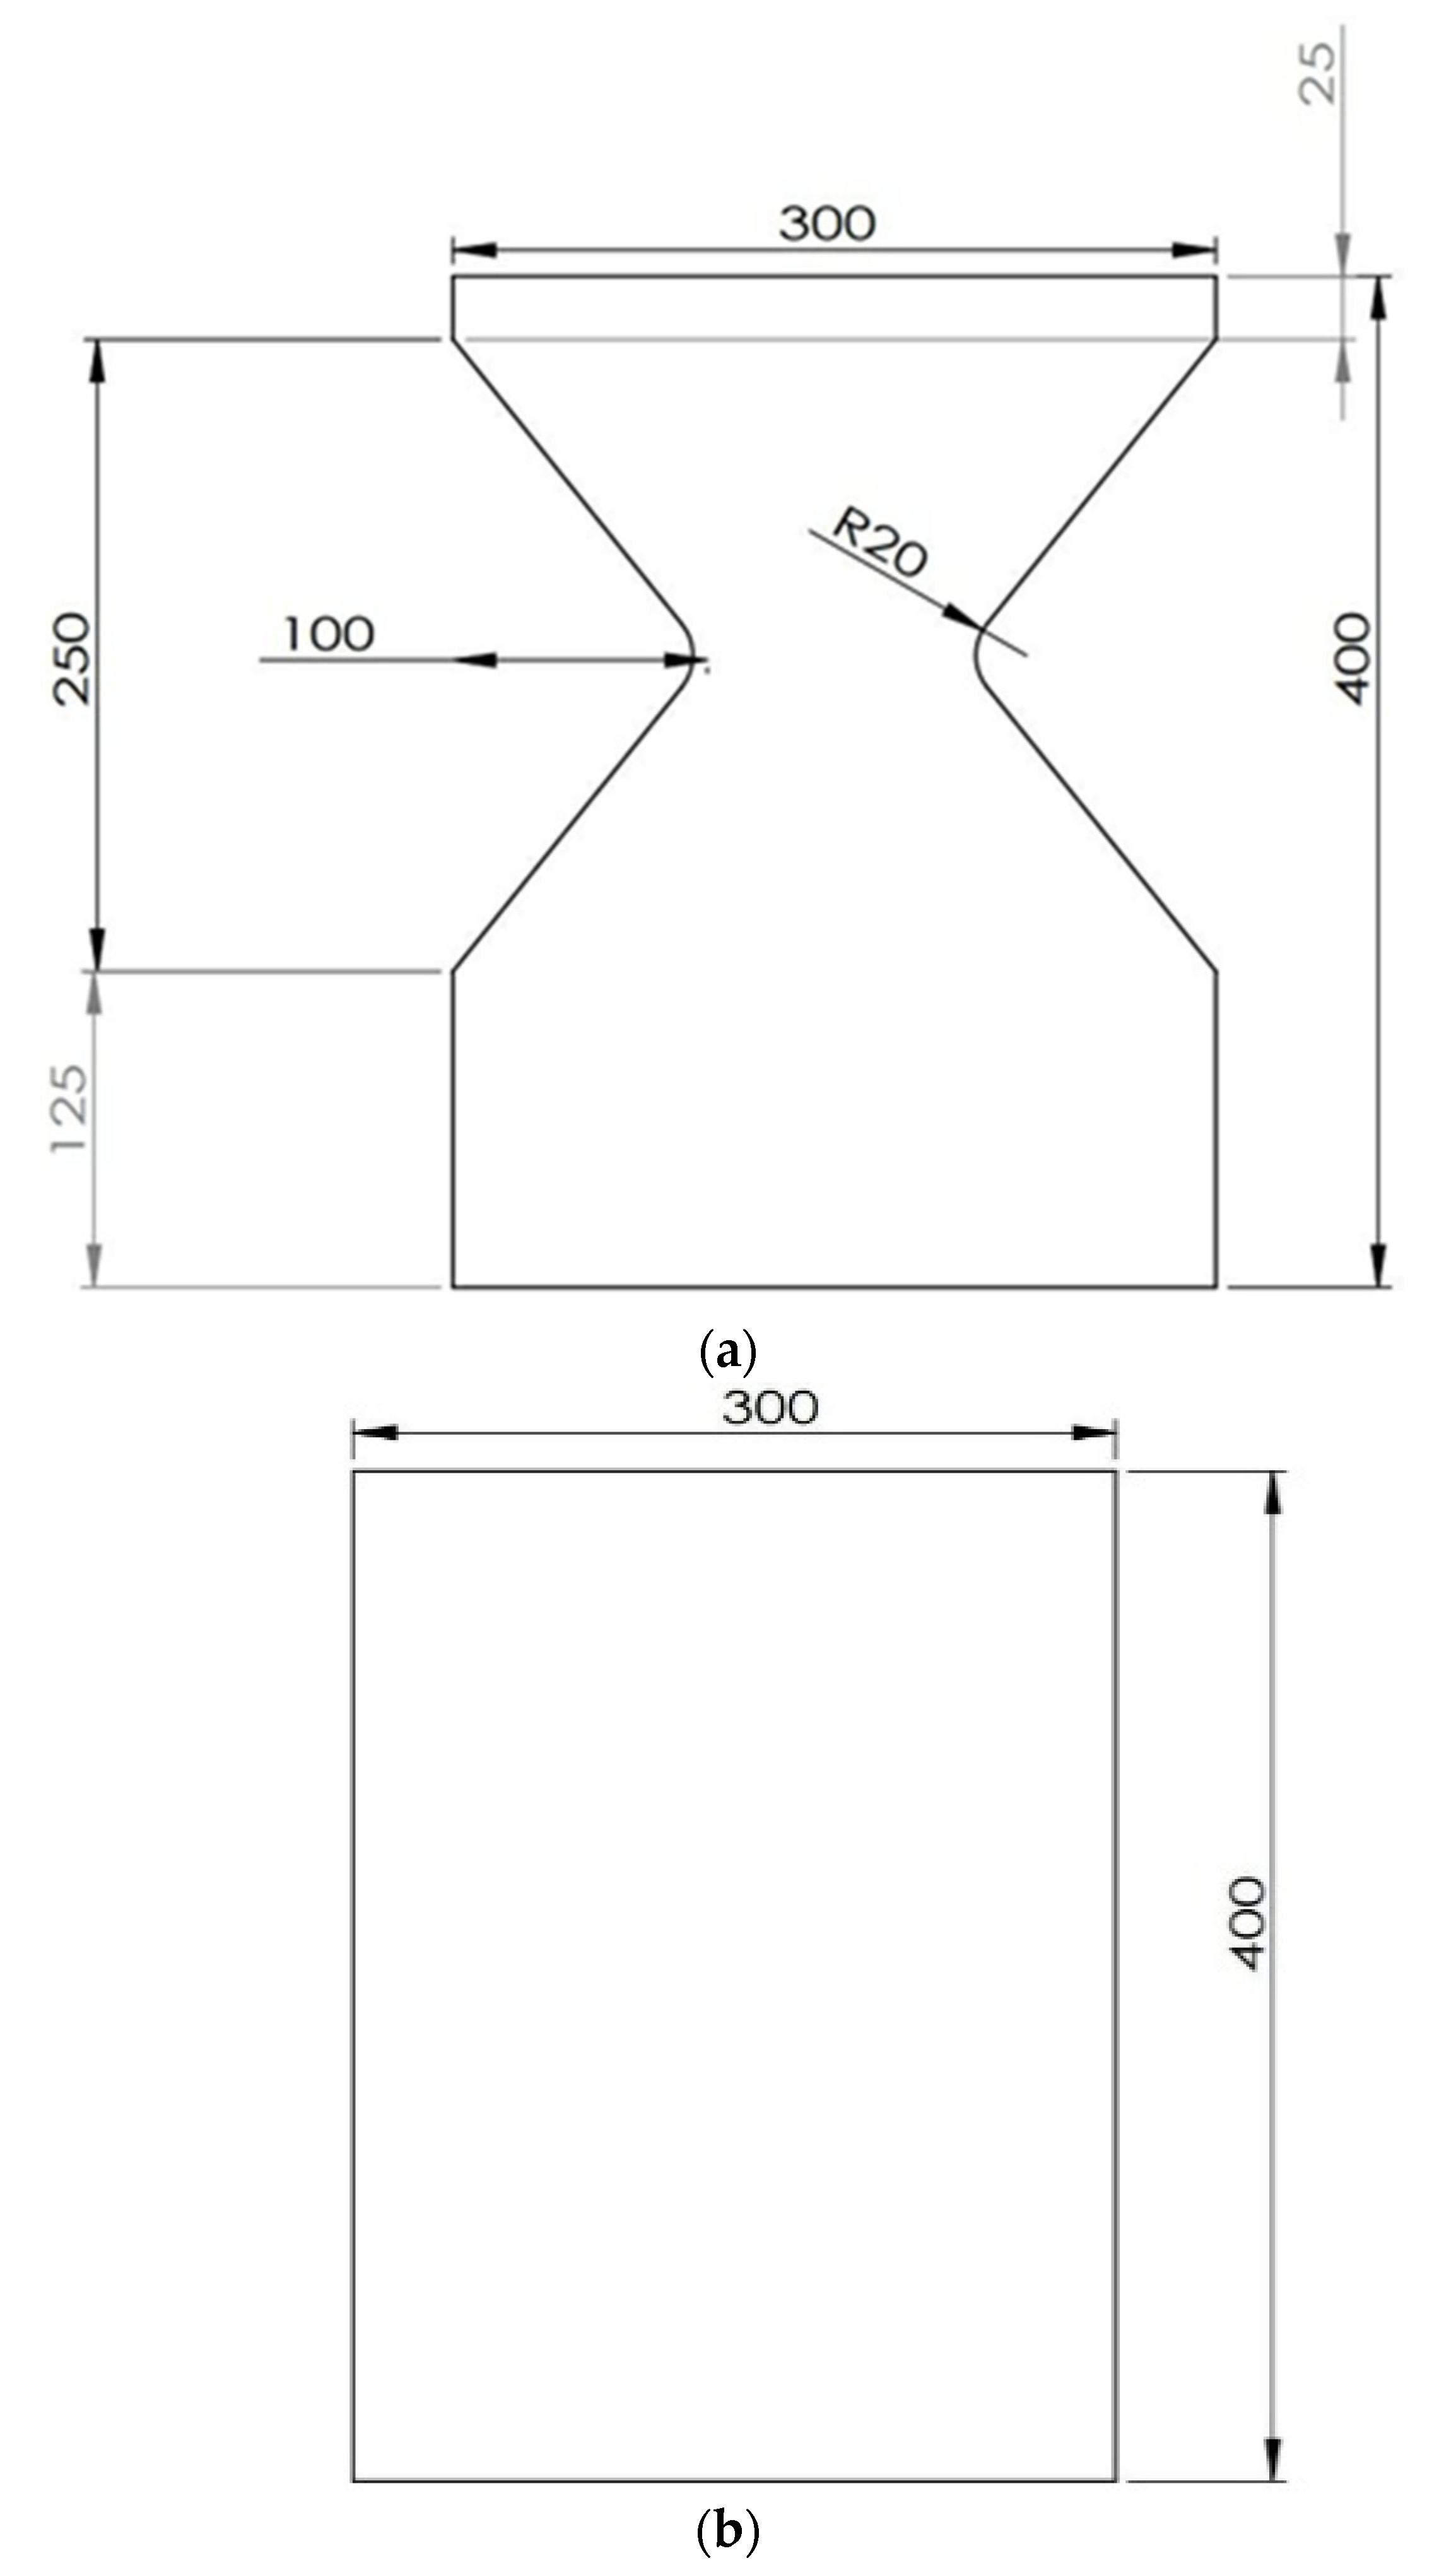
Figure 1. Technical drawing of models and sketch application: (a) V notch metal sheet; (b) virgin metal sheet; (c) hole metal sheet.
Applsci 13 12073 g001aApplsci 13 12073 g001b
Figure 2. (a) Experiment specified connection diagram and (b) Installation of experimental materials.
Applsci 13 12073 g002
Figure 3. The relationship graph between frequency and time, force and time from the accelerometer and force sensor.
Applsci 13 12073 g003
Figure 4. Signal analysis using frequency and time spectrum with FFT.
Applsci 13 12073 g004
Figure 5. The convergence test on the finite element model for cubic element types: C3D8.
Applsci 13 12073 g005
Figure 6. The convergence test on the finite element model for tetrahedral elements with mid-side nodes: C3D10M of virgin steel.
Applsci 13 12073 g006
Figure 7. The convergence test on the finite element model for tetrahedral elements with mid-side nodes: C3D10M of hole steel.
Applsci 13 12073 g007
Figure 8. Meshing the geometry (a) virgin sheet metal, (b) hole notch, and (c) V notch.
Applsci 13 12073 g008aApplsci 13 12073 g008b
Figure 9. The signal of the accelerometer was evaluated from DUE 2012 R3 and the oscilloscope.
Applsci 13 12073 g009
Figure 10. The accelerometer and force sensor signal evaluated from DUE 2012 R3 3.2 simulation result.
Applsci 13 12073 g010
Figure 11. Contours of total deformation from mode 1 (a) sheet metal, (b) hole notch, and (c) V notch.
Applsci 13 12073 g011aApplsci 13 12073 g011b
Figure 12. Natural frequencies of low carbon steel material on different models.
Applsci 13 12073 g012
Figure 13. Contours of total deformation from mode 5 V notch.
Applsci 13 12073 g013
Figure 14. The relationship graph between frequency and time; force and time from the accelerometer and force sensor of a V-shaped sheet plate.
Applsci 13 12073 g014
Figure 15. Whole V notch modified with slide directions.
Applsci 13 12073 g015
Figure 16. Whole V notch modified with explicit directions.
Applsci 13 12073 g016
Figure 17. Natural frequencies modified with natural shapes on different models.
Applsci 13 12073 g017
Figure 18. Natural frequencies modified with natural shapes on the first models.
Applsci 13 12073 g018
Figure 19. Natural frequencies modified with side shapes on different models.
Applsci 13 12073 g019
Figure 20. Natural frequencies modified with V notch slide shape on the first models.
Applsci 13 12073 g020
Figure 21. One-sided V notch modified with slide directions.
Applsci 13 12073 g021
Figure 22. One-sided V notch modified with explicit directions.
Applsci 13 12073 g022
Figure 23. Natural frequencies modified with one-sided V notch natural shape on different models.
Applsci 13 12073 g023
Figure 24. Natural frequencies of one-sided V notch natural shape on the first models.
Applsci 13 12073 g024
Figure 25. Natural frequencies of modified with one-sided V notch slide shape on different models.
Applsci 13 12073 g025
Figure 26. Natural frequencies of one-sided V notch slide shape on the first models.
Applsci 13 12073 g026
Table 1. Chemical composition of the investigated low carbon steel (in %).
Steel GradeCSiMnPSAl
Low carbon0.0550.1750.2530.001140.00210.0126
Table 2. Material properties of low carbon steel.
Steel GradeTensile Strength, Ultimate
[MPa]
Tensile Strength, Yield
[MPa]
Modulus Elasticity
[GPa]
Poisson’s RatioShear Modulus
[MPa]
Density
[g/cm3]
Low carbon4183212070.29827.533
Table 3. The national frequency in modes 1 and 2 of virgin steel for C3D8 type.
Number of ElementMode 1Mode 2
FEMExp.Research
Article [36,42]
FEMExp.Research
Article [36,42]
165.198853.6352.50632.908129.5125.2
215.257832.973
9075.284833.106
60455.28634.415
23,02212.16336.146
28,52312.45736.868
198,36749.176120.78
267,06250.1121.26
Table 4. The national frequency in modes 1 and 2 of virgin steel for C3D10M type.
Number of ElementMode 1Mode 2
FEMExp.Research
Article [36,42]
FEMExp.Research
Article [36,42]
1654.10753.6352.506138.69129.5125.2
2153.227142.91
90752.573130.16
604552.298128.48
23,02252.163128.04
28,52352.156128.02
198,36752.149127.98
267,06252.144127.95
Table 5. The national frequency in modes 1 and 2 of hole steel for C3D10M type.
The Number of ElementsMode 1Mode 2
FEMExp.Research Article [36,42]FEMExp.Research Article [36,42]
1618.88250.351.6358.098125.2121.95
2150.901128.23
90750.578126.53
604550.372124.88
23,02250.184123.98
28,52350.131123.71
198,36750.111123.59
267,06250.154123.99
Table 6. Natural frequencies of low carbon steel.
Mode ShapeNatural Frequency (Hz)
Virgin HoleV-Notch
111.29010.79111.103
230.99829.89331.598
369.77766.95866.780
4109.030105.290135.950
5113.250105.290137.140
6196.580187.710179.880
7207.780197.530237.470
8235.790228.010273.760
9283.370262.370326.380
10349.350334.550340.700
11372.390351.560372.360
12388.460370.180394.620
13427.970412.120467.720
14460.690425.960543.900
15527.640500.530575.640
16534.370502.340631.090
17550.890525.430643.730
18623.230586.710694.660
19643.370612.000807.460
20677.860653.520831.250
Table 7. Natural frequencies of low carbon steel experiment.
Mode ShapeNatural Frequency (Hz)
Virgin HoleV-Notch
1101111
2393349
3654659
49895107
5121109137
6189195202
7225213278
Table 8. Natural frequencies of low carbon steel from experiment and simulation.
Mode ShapeNatural Frequency (Hz)
Virgin HoleV-Notch
ExperimentSimulationExperimentSimulationExperimentSimulation
11011.2901110.7911111.103
23930.9983329.8934931.598
36569.7776666.9585966.780
498109.03095105.290107135.950
5121113.250109105.290137137.140
6189196.580195187.710202179.880
7225207.780213197.530278237.470
Table 9. Dimensionlessness of full V notch modified.
DirectionSpecimen LabelL/H
DirectV_D_10.22
V_D_20.45
V_D_30.67
V_D_40.90
V_D_51.12
SlideV_S_10.20
V_S_20.43
V_S_30.66
V_S_40.86
V_S_51.12
Table 10. Dimensions of one-sided V notch modified.
DirectionSpecimen LabelL/H
DirectV_DH_10.12
V_DH_20.24
V_DH_30.36
V_DH_40.48
V_DH_50.60
SlideV_SH_10.12
V_SH_20.24
V_SH_30.36
V_SH_40.48
V_SH_50.60
Disclaimer/Publisher’s Note: The statements, opinions and data contained in all publications are solely those of the individual author(s) and contributor(s) and not of MDPI and/or the editor(s). MDPI and/or the editor(s) disclaim responsibility for any injury to people or property resulting from any ideas, methods, instructions or products referred to in the content.