Article

Comparative Analysis of Pulsed Electric Fields (PEF) and Traditional Pasteurization Techniques: Comparative Effects on Nutritional Attributes and Bacterial Viability in Milk and Whey Products

by
Aivaras Šalaševičius
,
Dovilė Uždavinytė
,
Mindaugas Visockis
,
Paulius Ruzgys
and
Saulius Šatkauskas
*
Biophysical Research Group, Faculty of Natural Sciences, Vytautas Magnus University, Vileikos St. 8, LT-44404 Kaunas, Lithuania
*
Author to whom correspondence should be addressed.
Appl. Sci. 2023, 13(22), 12127; https://doi.org/10.3390/app132212127
Submission received: 18 August 2023 / Revised: 26 October 2023 / Accepted: 2 November 2023 / Published: 8 November 2023

Abstract

:
With the current upsurge in the desire to foster healthy lifestyles and consume nutritious food products, the food industry has been propelled to develop novel food processing technologies. In our study, we critically evaluated the influence of pulsed electric field (PEF) processing by comparing it to conventional thermal pasteurization protocols—low temperature, long time (LTLT), high temperature, short time (HTST), and microfiltration (MF)—and its ramifications on the nutritional properties inherent in raw milk, which comprises vitamins, whey protein, amino acids, cholesterol, and fatty acids. A significant difference in β-lactoglobulin content was observed in PEF-treated liquid whey samples compared to those treated with high-temperature (HT) pasteurization, where 4.8-fold reduction with a concentration of 0.80 mg/mL was observed. Liquid whey samples treated with PEF, LTLT, HTST and MF retained β-lactoglobulin content, PEF-treated samples yielded 3.85 mg/mL, while HTST, LTLT, and MF-treated samples had β-lactoglobulin content of 3.62 mg/mL, 3.63 mg/mL, and 3.62 mg/mL compared to raw whey control (RWC) at 3.81 mg/mL. The concentrations of nutritional properties, like vitamins (A, D, E), amino acids, cholesterol, and fatty acids, remained approximately consistent across all the pasteurization methodologies. Moreover, the bacterial viability in the context of various pasteurization methodologies was scrutinized, with an absence of colonies observed in whey specimens subjected to thermal pasteurization. PEF-treated samples exhibited a substantial 1.6-log reduction in coliform colony count to less than 4 CFU/mL after curd reduction, in contrast to raw milk samples.

1. Introduction

In recent years, pulsed electric fields (PEFs) have gained significant attention as a non-thermal alternative to traditional thermal pasteurization in the food industry. PEF technology utilizes high-voltage pulses of electricity to create electric fields that can permeabilize cell membranes, leading to inactivation of microorganisms and preservation of the nutritional properties of liquid foods. Several studies have investigated the application of PEFs for the inactivation of microorganisms in various liquid foods [1,2,3,4,5,6,7,8]. For instance, PEFs have been used for the inactivation of yeast in apple juice, resulting in up to 5-log yeast inactivation by varying PEF parameters [9]. Similarly, paneer cheese made from PEF-treated milk exhibited better sensory quality compared to cheese made from conventionally pasteurized milk. The cheese was softer, had a higher whiteness index, and only a slight decrease in shelf stability compared to the conventionally pasteurized cheese [10]. Whey protein, characterized by its exceptional nutritional profile and diverse functional properties, serves as a remarkably functional ingredient within the domain of the food industry [11]. Despite its numerous advantages, the thermal processing associated with whey protein powder can exert detrimental effects on its functional attributes, namely, solubility, emulsification, and foaming capabilities [12]. Elevated thermal conditions instigate denaturation, aggregation, and cross-linking of the protein macromolecules, consequently undermining their functionality [13,14,15]. Moreover, these high temperatures can potentially give rise to the generation of off flavors and off odors [16,17], further compromising its consumer appeal. As a result, PEF treatment presents a robust and promising solution for the preservation of the desired functional characteristics of whey protein following the completion of processing [18]. This evolving understanding underscores the potential for innovative approaches to maintaining the integrity of whey protein’s distinctive attributes in the face of processing challenges. Moreover, PEF treatment can be conducted at lower temperatures than thermal processing [19], reducing the risk of off-flavor development [16,17].
As the field of food science continually evolves, a salient topic of investigation pertains to the implications of processing methods on the nutritional integrity of consumables. The focus of this research endeavor is to critically appraise and juxtapose the nutritional profiles of milk and liquid whey subjected to pulsed electric field (PEF) treatment versus those processed via traditional thermal pasteurization methodologies, encompassing high temperature, short time (HTST), low temperature, long time (LTLT), and microfiltration (MF). This study seeks to elucidate potential differences, with the ultimate goal of informing optimized processing strategies that balance food safety and nutritional preservation. In this study, we analyzed the preservation of important nutrients, such as whey protein, casein, amino acids, cholesterol, fatty acids, and vitamins A, D, and E, to determine the effectiveness of PEFs in preserving these properties.
PEF technology has shown great potential for the food industry as a non-thermal alternative to traditional pasteurization methods. The ability to preserve nutritional properties while effectively inactivating microorganisms makes PEFs a promising technology in the production of liquid foods [20,21]. Our study seeks to evaluate the efficacy of curd reduction and pulsed electric field (PEF) treatments in microbial load reduction, specifically focusing on coliform and mesophilic lactic acid bacteria, in comparison to thermal pasteurization methods. Furthermore, this study aims to determine the impact of these treatments on the integrity of milk components, including β-lactoglobulin, amino acids, cholesterol, essential fatty acids, glycomacropeptide (GMP), vitamins A, D, and E, and their radical scavenging activity.

2. Materials and Methods

2.1. Raw Milk Preparation

The raw milk used in this study was sourced from local farmers and subjected to cooling on ice and degasification before each pulsed electric field (PEF) experiment. Vacuum degasification was performed in a laboratory using a vacuum system comprising a vacuum chamber and a vacuum pump (Mini Diaphragm Vacuum Pump N 816.3KN.18, KNF Neuberger GmbH, Freiburg, Germany). The vacuum degasification process was carried out for 1 h at a pressure of −0.8 bar. In the present investigation, the local manufacturer-obtained milk samples that had been subjected to different pasteurization techniques, as previously conducted, were replaced. Instead, all thermal pasteurization treatments were carried out in a laboratory setting. In this scientific investigation, we employed various processing strategies to examine their respective impacts on milk. These methodologies encompassed low-temperature, long-time (LTLT) pasteurization, conducted at a temperature of 63 °C sustained over a duration of 30 min, high-temperature short time (HTST) pasteurization implemented at 72 °C for a succinct 25-s period, and a microfiltration (MF) process utilizing a filter with pore size of 1.4 µm, followed by a secondary pasteurization phase at 72 °C for 15 s. Thermal pasteurization was performed using a batch system, wherein the sample was placed in a conical flask fitted with a reflux condenser. These flasks were then heated on a magnetic hotplate stirrer (smartSence, Gate Scientific, Inc., Milpitas, CA, USA) until the target temperatures were achieved. An essential preliminary step to each experimental iteration was the assessment of milk sample conductivity at a neutral pH of 7, which consistently yielded an approximate value of 4.4 mS/cm, setting the baseline for subsequent analysis.

2.2. Whey Preparation

A quantity of 10 mL calf liquid rennet was introduced to 1 L of raw milk to facilitate the separation of whey from curds. The resulting whey samples were subjected to a range of pasteurization methods, including low-temperature, long-time (LTLT) pasteurization at 63 °C for 30 min, high-temperature, short-time (HTST) pasteurization at 72 °C for 25 s, and microfiltration (MF) employing a 1.4 µm pore filter, followed by pasteurization at 72 °C for 15 s. An additional pasteurization method, involving high temperature (HT) at 95 °C for 4 s, was employed in comparison to raw milk experiments. This modification was necessitated by the inability to replicate ultrahigh-temperature (UHT) pasteurization at 140 °C for 4 s within a laboratory setting, and the fact that the production of whey protein powder via spray-drying at elevated temperatures leads to further denaturation of whey protein.

2.3. Determination of Bacterial Load in Samples

During the course of the experiment, three key parameters pertaining to microbial load, namelym coliforms, mesophilic lactic acid bacteria, and the total bacterial count, were evaluated in whey samples. In the food industry, assessment of milk quality primarily entails monitoring coliforms and total bacterial count during the production phase in order to verify suitability for consumption. The total bacterial count was enumerated on PCA agar, following incubation (BD 400 model incubator, Binder GmbH, Tuttlingen, Germany) for 72 h at 30 °C. The coliform count was determined on VRBL agar and confirmed in BGLB broth, following incubation (BD 400 model incubator, Binder GmbH, Germany) for 24 h at 30 °C. Determination of total bacterial count and coliforms was carried out by means of a pour plate technique, involving dispensation of 1000 µL of the sample, in accordance with ISO 4833-1:2013. The mesophilic lactic acid bacteria load in the samples was determined according to ISO 15214:1998: “Microbiology of Food and Animal Feeding Stuffs—Horizontal Method for the Enumeration of Mesophilic Lactic Acid Bacteria—Colony-count Technique at 30 °C”. Two petri dishes were prepared using MRS agar (de Man, Ragosa and Sharpe) (Biolife Italiana Srl., Milan, Italy) set at a pH of 5.7. Decimal dilutions of the sample or the initial suspension were used for plating. The dishes were subsequently incubated (BD 400 model incubator, Binder GmbH, Germany) at 30 °C for 72 h under aerobic conditions. Mesophilic lactic acid bacteria were calculated as the weighted mean from two successive dilutions using Equation (1):
N = C V n 1 + 0.1 n 2 d
where ∑C is the sum of the colonies counted on all dishes from two successive dilutions, V is volume of inoculum applied to each dish, in milliliters, n1 is the number of dishes retained at the first dilution, n2 is the number of dishes retained at the second dilution, and d is the dilution factor corresponding to the first dilution retained.
Experimental procedures were performed as depicted in Figure 1. The whey samples were transferred to an electroporation cuvette, electroporated, and the resultant suspension was subsequently transferred to petri dishes, wherein colony-forming units were counted.

2.4. PEF Treatment

The pulsed electric field (PEF) system employed in this study comprised an electrical pulse generator (BTX T 820, Holliston, MA, USA), a digital oscilloscope (Rigol DS2072A, Rigol Technologies Inc., Bedford, OH, USA), and a treatment chamber containing two parallel electrodes. The electrodes were made of polished stainless steel (AISI 304) plates of equal size, and a polymethylmethacrylate (PMMA) cube was utilized to isolate them, creating a treatment chamber with a 0.1 cm gap. In the course of the experiment, the samples underwent treatment with monopolar rectangular pulses at an electric field strength of 24 kV/cm, employing a total of 20 pulses. The electric field strength (E, V/cm) was calculated using Equation (2) [22]:
E = U/d
where U represents the voltage (V) and d denotes the distance between the electrodes (cm). In all experiments, the single pulse duration was 10 µs and the pulse repetition rate was maintained at 1 Hz.

2.5. Determination of Vitamins A, D, E

For saponification, 2 g of sample was weighed into a flask. In total, 50 mL methanol, 0.25 g ascorbic acid, 5 mL KOH solution (50 g KOH dissolved in 100 mL H2O) and 1 mL vitamin D2 standard working solution (0.2 μg/mL) were added to the flask and mixed. The flask was placed in a water condenser at 80–100 °C for 30 min with occasional stirring. The saponified mass was cooled in a water bath, filter through a Whatman filter paper to avoid emulsions. An amount of water must be added to the saponified sample solution so that the ratio of methanol to water in the resulting solution is 1:1. N-hexane (40 mL) was used as solvent to extract the vitamins (D3, A, E) from the solution. The collected hexane was washed three times with water (50 mL) to remove any salts. The extract was evaporated with a rotary evaporator. The residue was dissolved in 1 mL (99% methanol). Prior to injection, samples were filtered through a 0.45 μm filter.
A Shimadzu Prominence analytical HPLC system with diode array detector set at 265 nm (vitamin D3), 325 nm (vitamin A) and fluorescence detector with an excitation wavelength set at 288 nm and an emission wavelength set at 332 nm (α-tocopherol, vitamin E), an autosampler and LC LabSolutions® Version 5.30 SP1were used (Shimadzu Corp., Kyoto, Japan). The YMC-Pack ODS-A column (YMC Europe GmbH, Dinslaken, Germany) (5 μm, 150 × 4 mm, silica) with YMC-Pack ODS guard column (5 μm, 10 × 4 mm) was used, and the column temperature was 40 °C. The mobile phase consisted of 96% acetonitrile and 4% water, the flow rate was 1 mL/min, and the injection volume was 50 μL. The vitamin D3 was quantified using a vitamin D2 internal standard according to ISO 14892:2002. The vitamin A was quantified according to EN 12823:2000. The α-tocopherol (vitamin E) was quantified according to EN 12822:2014.

2.6. Determination of Amino Acid Content

In our study, we modified the method outlined in the Shimadzu technical note titled “Auto-precolumn Derivatization for Amino Acid UHPLC Analysis by Using SIL-30AC”. Amino acid (AA) content in food samples was analyzed by ultrafast liquid chromatography (UFLC) with automated o-phthalaldehyde (OPA)/9-fluorenylmethyl chloroformate (FMOC). Standard solutions of the amino acids alanine (ALA), aspartic acid (ASP), arginine (ARG), cystine (CYS), glycine (GLY), valine (VAL), leucine (LEU), isoleucine (ILE), threonine (THR), serine (SER), proline (PRO), methionine (MET), glutamic acid (GLU), phenylalanine (PHE), lysine (LYS), histidine (HIS), tyrosine (TYR), and tryptophan (TRP) were analyzed (A9781 Sigma-Aldrich, Taufkirchen, Germany). For the analysis, the sample (0, 1 g) was hydrolyzed with 25 mL of 6 M HCl for 24 h at 37 °C. Prior to injection, all samples were filtered through 0.45 μm filters. The AAs were separated with UHPLC column YMC-Triart C18 (1.9 pm, YMC Co., Ltd.) using a UFLC instrument Shimadzu Prominence LC20AD (Shimadzu, Japan) equipped with a fluorescence detector RF-20 Axs and pretreatment function equipped with automatic injector SIL-30AC (Shimadzu, Japan). Analytical conditions were as follows: mobile phase—solvent A (20 mmol/L potassium phosphate buffer (pH 6.5), solvent B (45/40/15 acetonitrile/methanol/water); flow rate—0.8 mL/min, column temperature 35 °C; detection—RF-20Axs Ex. at 350 nm, Em. at 450 nm to Ex. at 266 nm, Em. at 305 nm (9.0 min) [23]. A five-level calibration set was used, covering a concentration range of 9.375–150.00 μmol/L.

2.7. Determination of Fatty Acids Content

Identification and quantification of fatty acids (FAs) were performed by gas chromatography using a capillary column and a flame ionization detector. Samples for the analysis of fatty acids were prepared in accordance with ISO 12966-2:2011. Prior to FA analysis by gas chromatography, FAs are converted to low-molecular-weight non-polar compounds—methyl esters. For this purpose, fatty acids were extracted from a 2 g analytical sample using 15 mL of n-hexane (Chempur, Piekary Śląskie, Poland), then methylated with 250 µL of anhydrous KOH in methanol (11.2 g of KOH and 100 mL of methanol) to give methyl esters. FA methyl esters were analyzed with a Shimadzu GC-2010-PLUS gas chromatograph (Shimadzu, Kyoto, Japan) using a 100 m Restek (Bellefonte, PA, USA) Rt-2560 column, internal diameter: 0.25 µm; thickness: 0.20 µm, according to ISO 15304:2003.2. The analytical conditions were as follows: injection volume 1 µL, split ratio 1:20, column temperature 100 °C for 4 min, then increased to 240 °C at 13 °C/min and maintained at 80 min at the end of the analysis, injector temperature 250 °C, and detector temperature 300 °C. Nitrogen was used as the carrier gas. The fatty acid content is determined from the linear regression equation of the calibration plots of the identified fatty acid methyl ester standards Supelco 37 Component FAME Mix (Supelco Analytical, Bellefonte, PA, USA). The percentage of fatty acids was calculated from the calibration equations for each methyl ester determined.

2.8. Determination of Biogenic Amine Content

Identification and quantification of biogenic amines were carried out by high-performance liquid chromatography (HPLC). For the extraction, 5 g of sample was homogenized with 20 mL of (0.4 mol/L) perchloric acid solution (HClO4, Chempur, Karlsruhe, Germany) into a 50 mL screw-cap tube and 250 μL internal standard (1,7-diaminoheptane, C7H18N2, Sigma-Aldrich®) stock solution (1 mg/mL) added to achieve 1 μg/mL concentration level in injection volume. After that, the mixture was centrifuged (Hermle Z 306, Gosheim, Germany) at 4000 rpm and supernatant rinsed into a 25 mL bottle through Whatman no. 1 filter paper (180 μm thickness and 11 μm particle retention rating at 98% efficiency). Filtrate was adjusted to 25 mL with perchloric acid solution (0.4 mol/L).
For the derivatization, 500 μL sample extract alkaline by adding 100 μL sodium hydroxide (NaOH, Eurochemicals, Kuprioniškės, Lithuania) solution (2 mol/L) and buffer sample by adding 150 μL saturated sodium bicarbonate (NaHCO3, Lachema, Brno, Czech Republic). Add 1 mL dansyl chloride (5-dimethylaminonaphtalene-1-sulfonyl chloride, Sigma-Aldrich®) solution (10 mg/mL), mix thoroughly with shaker mixer (Reax Top, Heidolph Instruments GmbH & Co. KG, Schwabach, Germany), and transfer reaction mixture to 40 °C incubator for 45 min. After incubation, cool to room temperature for 10 min and remove residual dansyl chloride by adding 50 μL ammonia (25%, NH3, Chempur, Germany). Mix with shaker mixer. After 30 min, adjust to 5 mL with ammonium acetate (0.1 mol/l, CH3COONH4, Reachem, Petržalka, Slovakia):acetonitrile (Carlo Erba, Val-de-Reuil, France) mixture (1:1, v/v) and mix well with shaker mixer. Filter through 0.20 μm nylon filter (UptiDisc, Interchim, Montluçon, France) and inject the solution into the analytical column.
A Shimadzu Prominence LC20AD (Shimadzu, Japan) coupled with a UV detector SPD/20 A chromatographic system was used with a LabSolution (Shimadzu, Japan) integrator using a Hydrosphere C18 (5 µm, 12 nm), 150 × 4.6 I.D. (YMC Co., Ltd., Kyoto, Japan) column and YMC precolumn (YMC Co., Ltd.) ProC18 (10 × 3.0 mm L.D., S-3 μm, 12 nm). LC mobile phase A: ammonium acetate (0.1 mol/L), phase B: acetonitrile. Operating conditions: flow rate 0.9 mL/min; injection volume 20 μL; column temperature 40 °C; peaks detected at 254 nm; gradient 50% B to 90% B in 19 min; run time 20 min; post-run before next run, 50% B, 8 min.
Histamine (C5H9N3) biogenic amine standard was purchased from Sigma-Aldrich®. Stock solutions (1 mg/mL) of amine were prepared in 0.1 N HCl (Stanlab, Lublin, Poland) and stored at 4 ± 1 °C. For amine identification, the standard solution of individual biogenic amine was chromatographed separately and mixed to determine the retention times and the response. Standard curves with correlation coefficients for stock solutions were obtained by the external standard method. All the results were expressed in milligrams per kilogram. Histamine was quantified using the HPLC method outlined in ISO 19343:2017.

2.9. Determination of Antioxidant Activity

The extracts were prepared by weighing 0.100 g of sample and adding 10 mL of a 70% (v/v) aqueous solution of methanol (1:100). The extract was placed in an ultrasonic bath for 15 min at 40 °C. The extract was filtered through paper filters into a 10 mL graduated tube. The extract was filled with 70% (v/v) methanol to 10 mL. The DPPH (2.2-diphenyl-1-picrylhydrazyl) method evaluates the ability of test extracts to bind DPPH free radicals. A DPPH standard solution was obtained by dissolving 0.0024 g (exact weight) of DPPH radical powder in 100 mL of 70%. (v/v) methanol. An ultrasonic bath was used to improve solubility. The reconstituted standard solution was kept in the dark until constant absorption was observed. The absorbance of the prepared solution was measured at a wavelength of 515 nm. As a reference solution, 70% (v/v) methanol was used.
The test solution was prepared by taking 50 µL of the test extract and adding and mixing it with 2 mL of DPPH standard solution; 50 µL 70% (v/v) methanol and 2 mL of DPPH standard solution were used to prepare the blank solution. The resulting mixtures were kept in complete darkness for half an hour. The spectrophotometer measured the decreases in the absorbance of the samples at 515 nm until absorbance equilibrium was reached (after 30 min) [24]. The antiradical activity of the extracts was expressed as a percentage of bound DPPH:
DPPH = [(Ab − Aa)/Ab] × 100%
Aa is the absorbance of the sample with the test extract (t = 30 min).
Ab is the absorbance of the blank (t = 30 min).

2.10. Determination of Cholesterol Content

For saponification, 0.25 g of sample was weighted into a 50 mL glass tube. In total, 5 mL 2% KOH in ethanol solution and 5 mL DI water were added to the glass tube and mixed. The saponification process was performed for 120 min at 50 °C in a water bath, stirring the tube every 15 min. The extraction process was performed with the n-hexane extraction solvent. Total volume of solvent used for single extraction was 10 mL. Two extractions with n-hexane were performed. Then, the combined extracts were evaporated using a rotary vacuum evaporator until dry and the residue was dissolved in 4 mL of acetonitrile methanol solution (70:30, v/v). Prior to injection, samples were filtered through a 0.45 μm filter.
A Shimadzu Prominence LC20AD (Shimadzu, Japan), coupled with a UV detector SPD/20 A chromatographic system was used with a LabSolution (Shimadzu, Japan) integrator using a Hydrosphere C18 (5 µm, 12 nm) 150 × 4.6 I.D. (YMC Co., Ltd.) column and YMC precolumn (YMC Co., Ltd.) ProC18 (10 × 3.0 mm ID, S-3 μm, 12 nm). The LC mobile phase acetonitrile:methanol ratio was 70:30 v/v. Operating conditions: flow rate 1.2 mL/min; injection volume 20 μL; column temperature, 40 °C; peaks detected at 205 nm; analysis time 10 min.

2.11. Determination of β-Lactoglobulin Content

The content of β-lactoglobulin was determined through high-performance liquid chromatography (HPLC). Calibration curves were prepared by dissolving β-lactoglobulin in deionized water at concentrations of 10, 7.5, 5, and 2.5 mg/g. Milk samples were treated with HCl solution to achieve a pH of 4.6 (the isoelectric point for proteins) and then filtered through S&S filter paper followed by a 0.45 µm syringe filter. Separation and quantification of β-lactoglobulin was performed using a Shimadzu Prominence series (Shimadzu corp., Kyoto, Japan) HPLC system equipped with a TSKgel G2000 SWXL column (Tosoh Bioscience, Griesheim, Germany) (30 cm length and 0.78 cm internal diameter) and a TSKgel SWXL guard column (4 cm length and 0.6 cm internal diameter). The mobile phase consisted of a buffer prepared by dissolving 1.74 g K2HPO4, 12.37 g KH2PO4, and 21.41 g Na2SO4 in 1 L of deionized water to achieve a pH of 6.0, followed by heating for 15 min in a water bath at 85 °C. The flow rate was set to 1 mL/min, and the column temperature was maintained at 30 °C. Detection was carried out using a UV detector at a wavelength of 280 nm and an injection volume of 20 µL [25,26].

2.12. Temperature Measurements

The temperature of the milk sample was assessed using a UTi260B infrared thermal imaging system (Unit-Trend Technology Co., Ltd., Dongguan, China), which has an accuracy of ±2 °C and can measure temperatures within a range of −15 to 550 °C.

2.13. Statistics

The experiments were performed in three independent replicates (n = 3). One-way analysis of variance (ANOVA) and two-way ANOVA with Bonferroni analysis were performed using SigmaPlot 11 (Systat Software, Inc., San Jose, CA, USA). Statistical significance was determined by Bonferroni test (p < 0.05).

3. Results

3.1. Amino Acid Composition Analysis after Pasteurization

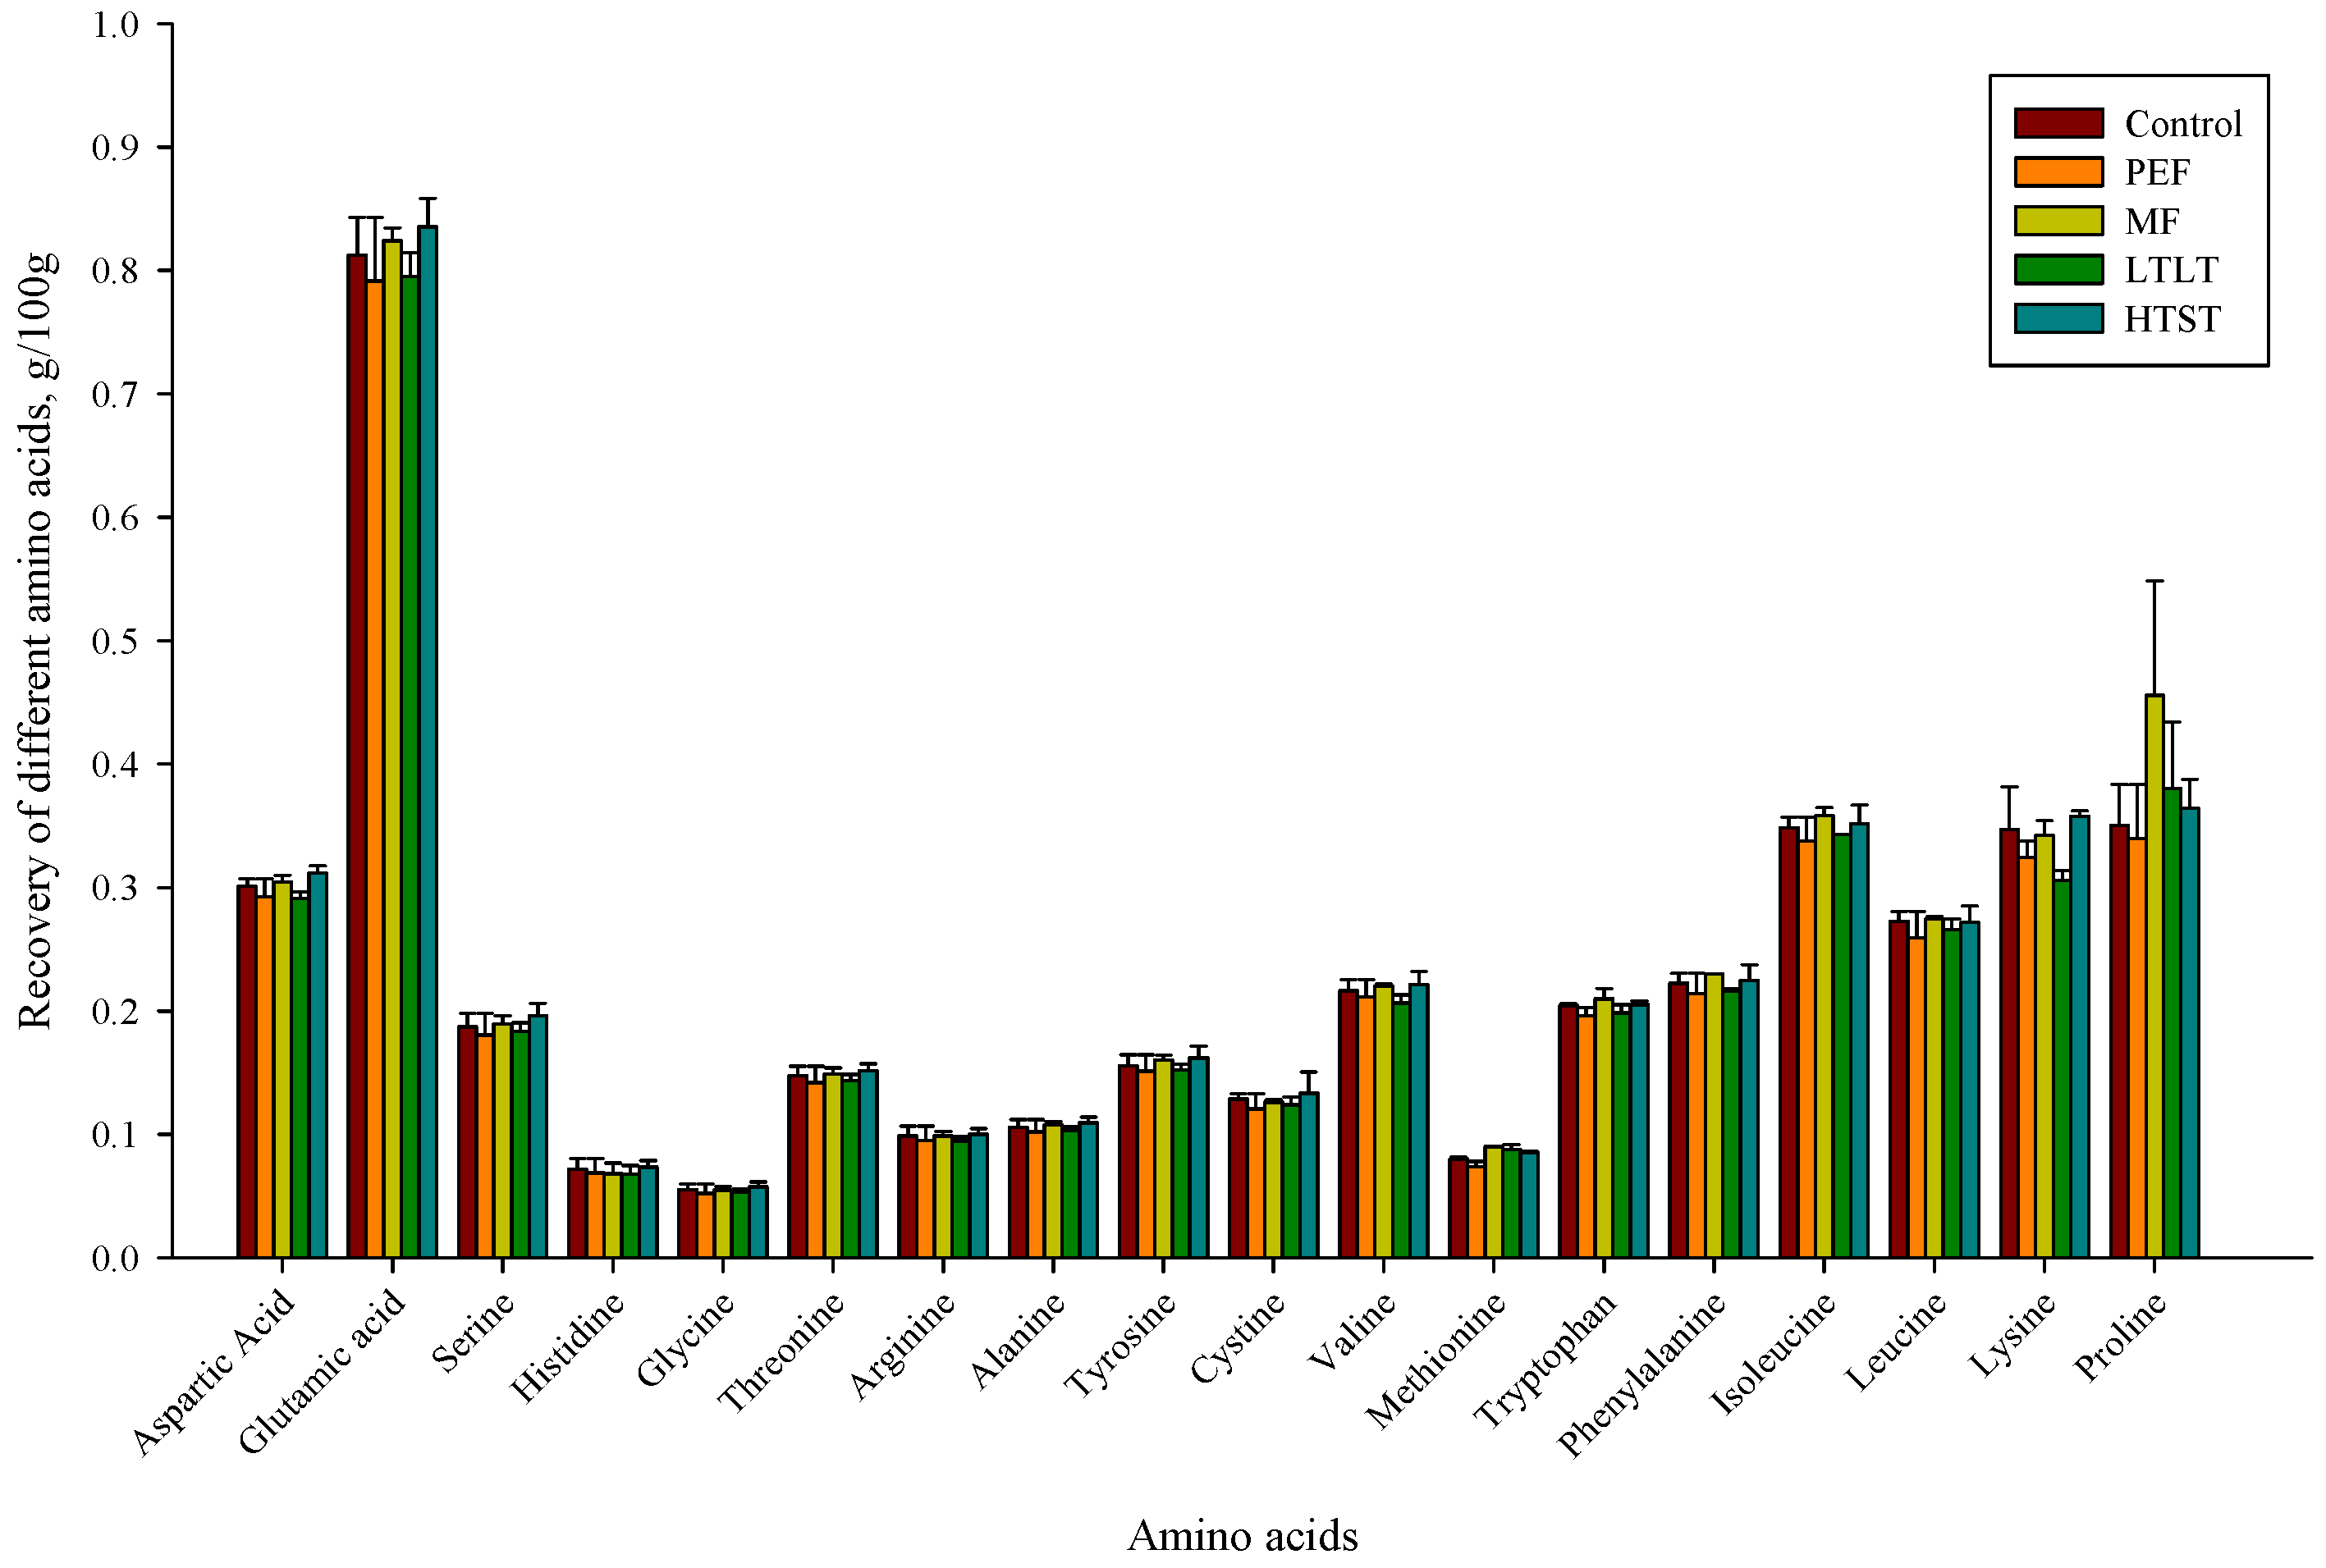
To assess the impact of various pasteurization techniques on milk samples, we conducted an extensive analysis of key parameters indicative of milk quality and nutritional attributes. Results in Figure 2 delineate the influence of these methods on the amino acid composition of the milk samples. A comparison between thermal pasteurization and pulsed electric field (PEF) treatment revealed no significant differences in amino acid content. The content of the various amino acids averaged as follows: aspartic acid 0.3 g/100 g, glutamic acid 0.8 g/100 g, serine 0.2 g/100 g, histidine 0.07 g/100 g, glycine 0.05 g/100 g, threonine 0.15 g/100 g, arginine 0.10 g/100 g, alanine 0.11 g/100 g, tyrosine 0.16 g/100 g, cystine 0.13 g/100 g, valine 0.22 g/100 g, methionine 0.09 g/100 g, tryptophan 0.21 g/100 g, phenylalanine 0.22 g/100 g, isoleucine 0.35 g/100 g, leucine 0.27 g/100 g, lysine 0.35 g/100 g, and proline 0.36 g/100 g.

3.2. β-Lactoglobulin Concentration Analysis after Pasteurization

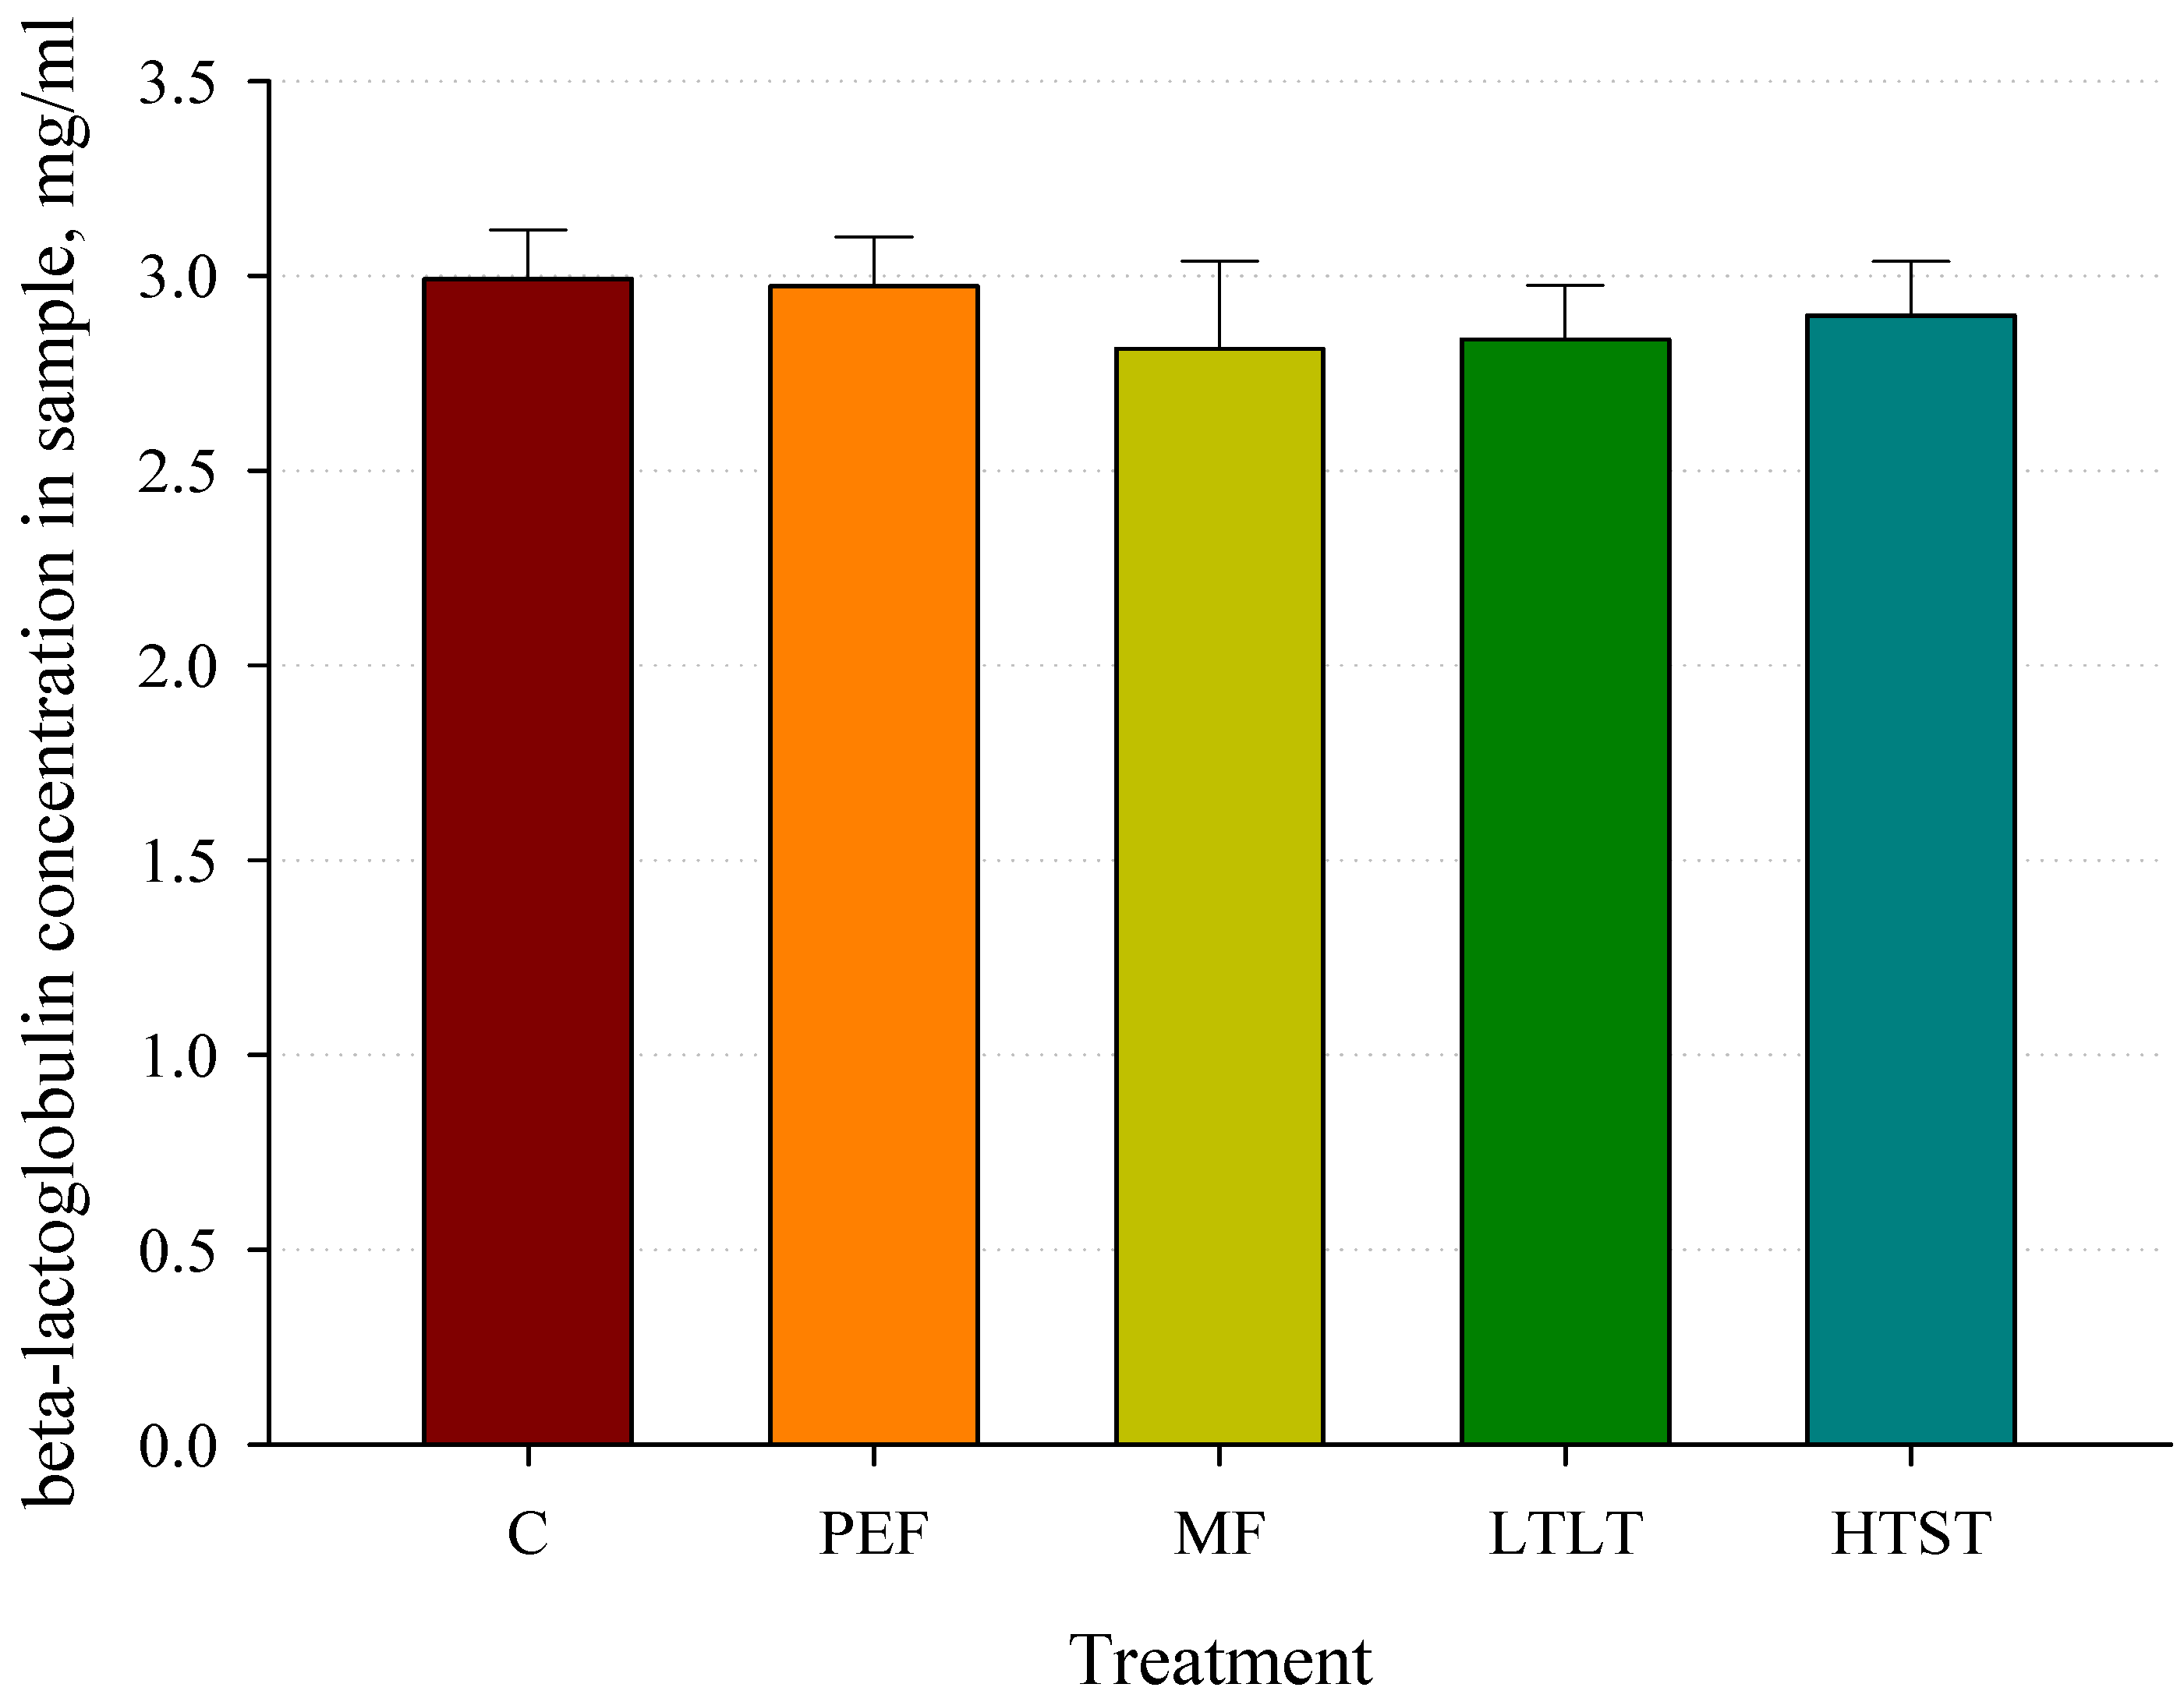
We quantified the β-lactoglobulin content in samples subjected to various pasteurization techniques, with the results displayed in Figure 3. No significant differences in β-lactoglobulin content were observed between PEF treatment and traditional pasteurization methods. PEF-treated milk samples exhibited a β-lactoglobulin concentration of 2.97 mg/mL, identical to that found in raw milk control samples. Milk samples treated with MF displayed a β-lactoglobulin content of 2.81 mg/mL, while LTLT-treated samples had a concentration of 2.84 mg/mL. HTST-treated samples revealed a β-lactoglobulin content of 2.89 mg/mL. However, we were unable to replicate the ultrahigh-temperature (UHT; 140 °C for 4 s) pasteurization technique, employed for extended shelf-life milk storage, in our laboratory setting. The effects of UHT on milk samples were described in our previous article [27].

3.3. α-Casein, β-Casein, and κ-Casein Concentrations Analysis after Pasteurization

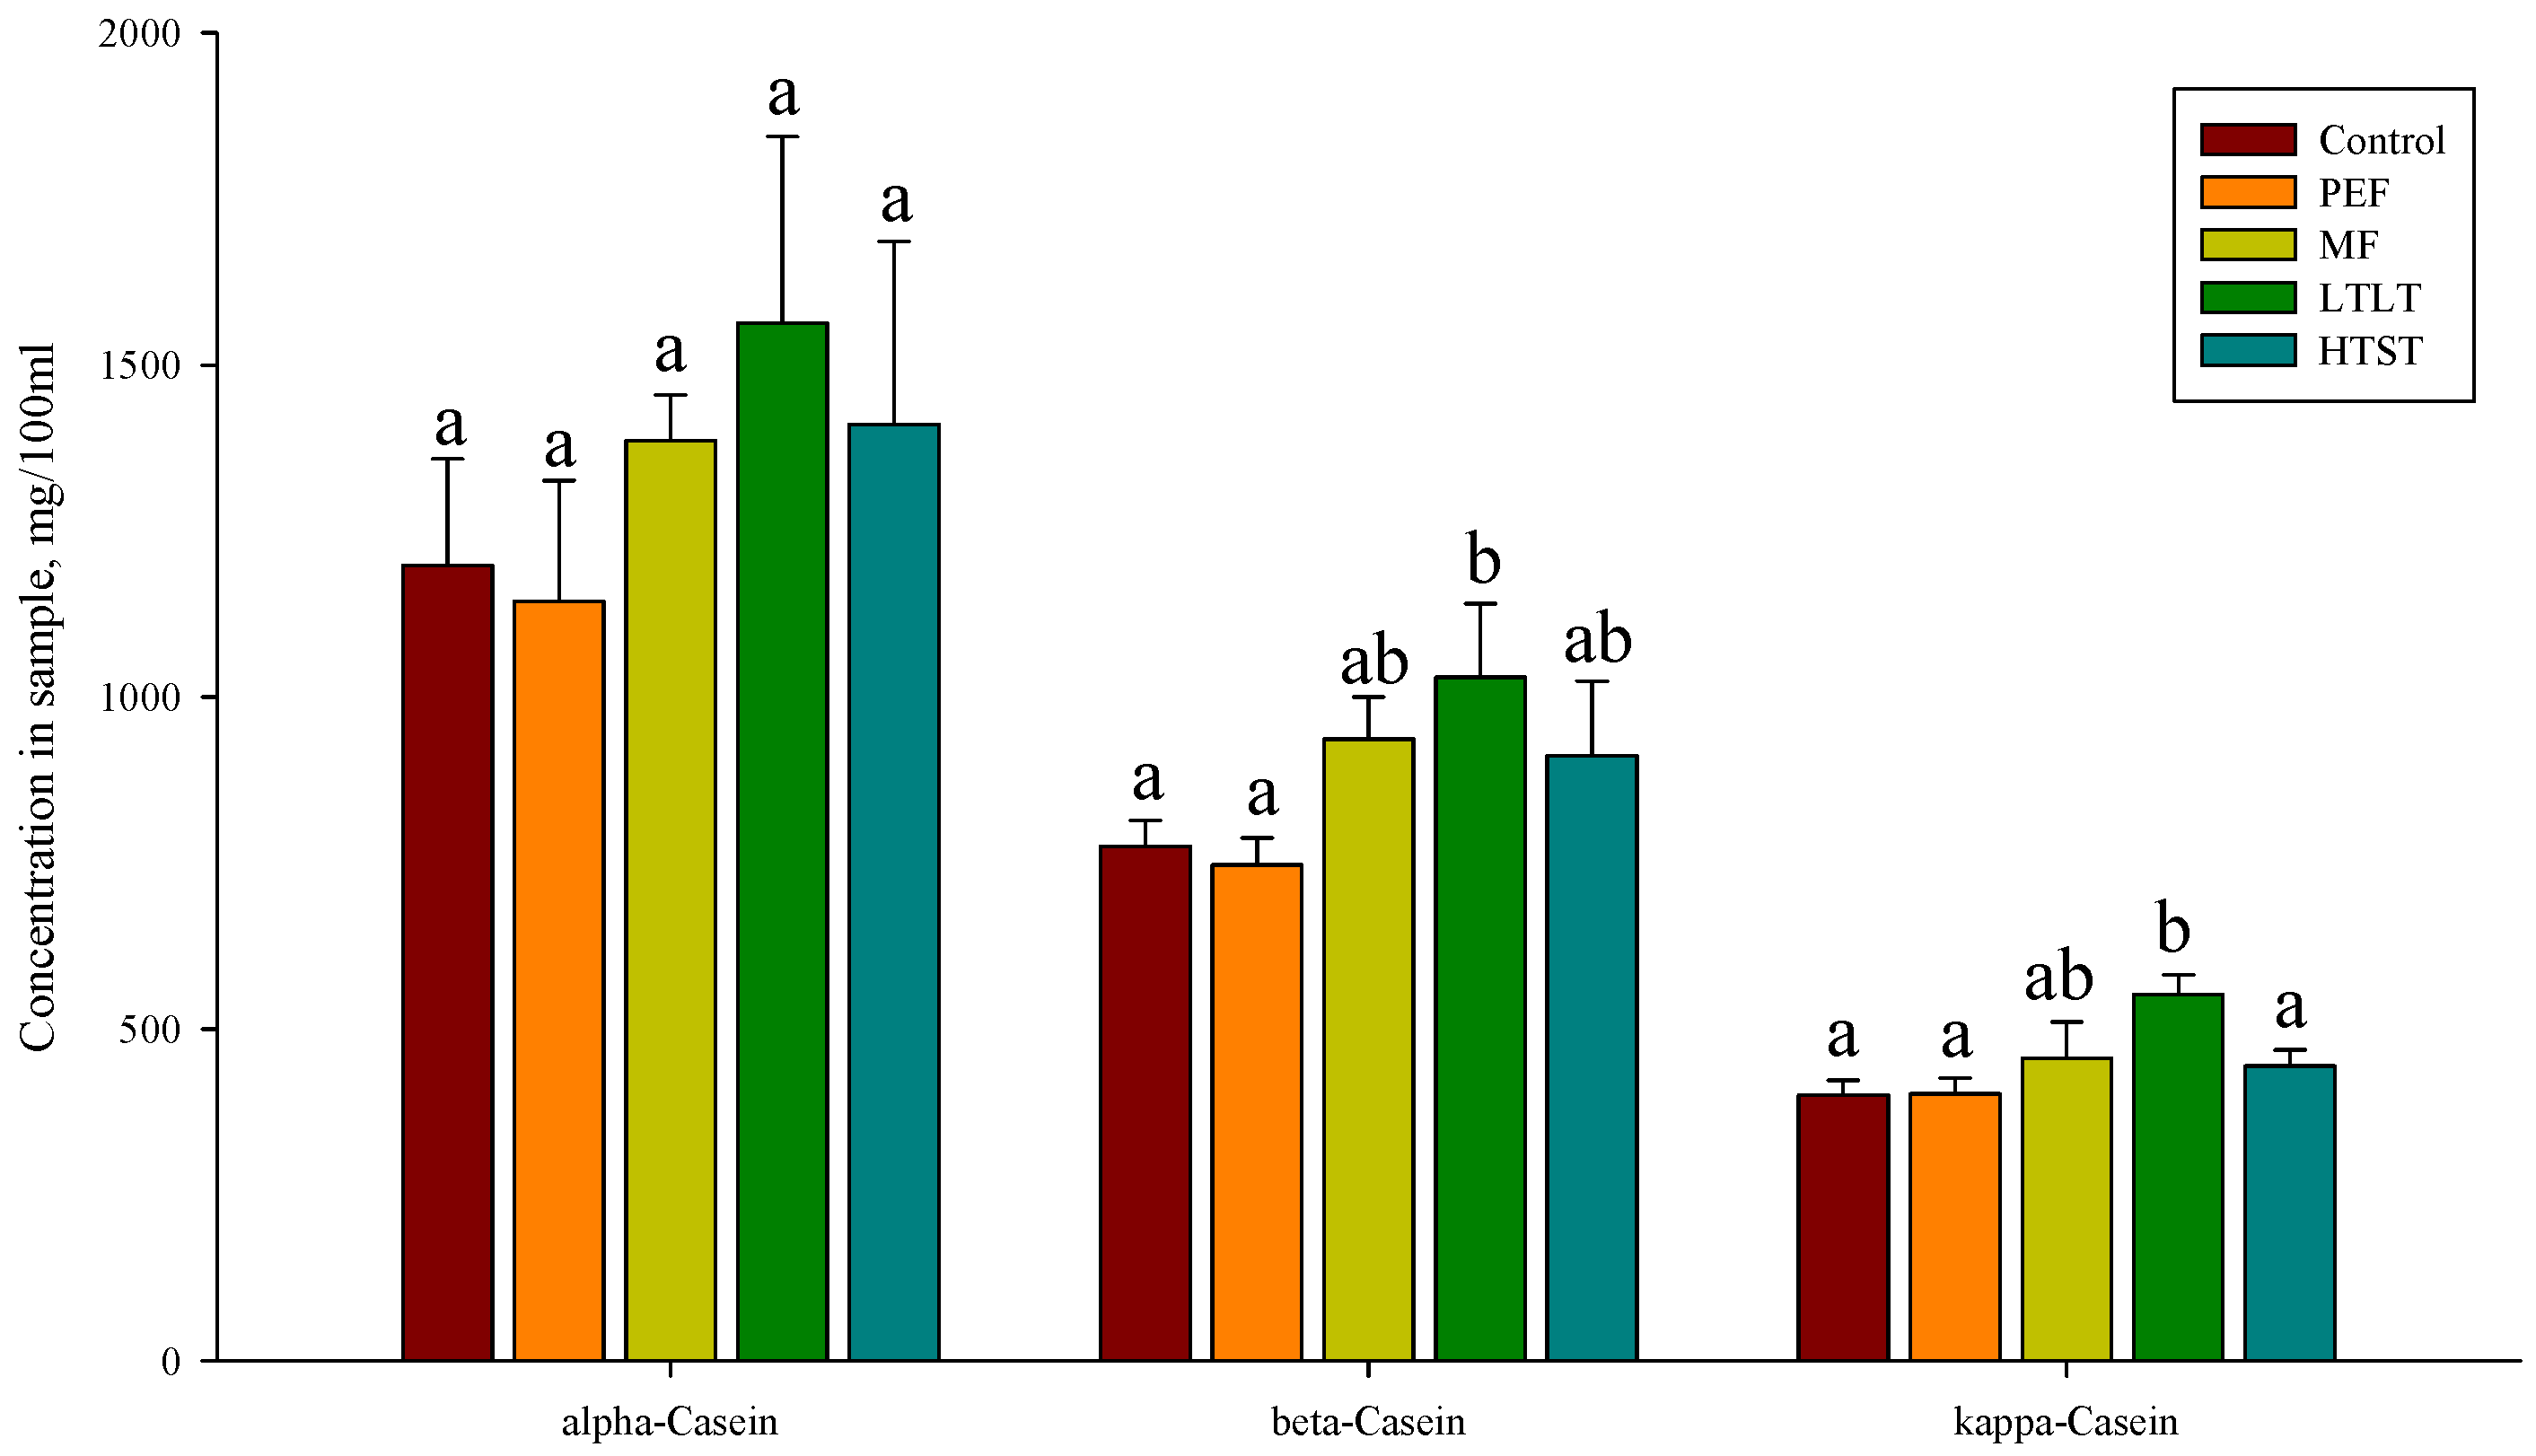
Figure 4 illustrates the quantification of α-casein, β-casein, and κ-casein concentrations in milk samples subjected to various thermal pasteurization treatments: MF, LTLT and HTST processes. The casein levels in these samples were compared to those in control and PEF-treated samples. The α-casein concentrations in control samples averaged 1197 mg/100 mL, comparable to the PEF treated samples at 1144 mg/100 mL. Thermal pasteurization treatments resulted in α-casein content of 1386 mg/100 mL in MF-treated samples, 1563 mg/100 mL in LTLT-treated samples, and 1410 mg/100 mL in HTST-treated samples. β-casein levels in control samples exhibited an average of 774 mg/100 mL, akin to PEF-treated samples at 747 mg/100 mL. The thermal pasteurization techniques led to increased β-casein concentrations: 936 mg/100 mL in MF-treated samples, 1030 mg/100 mL in LTLT-treated samples, and 911 mg/100 mL in HTST-treated samples. The κ-casein concentrations in control samples were observed at an average of 401 mg/100 mL, with PEF-treated samples displaying similar values at 402 mg/100 mL. The application of thermal pasteurization methods resulted in a rise in κ-casein content: 456 mg/100 mL in MF-treated samples, 552 mg/100 mL in LTLT-treated samples, and 444 mg/100 mL in HTST-treated samples.

3.4. Cholesterol Concentrations Analysis after Pasteurization

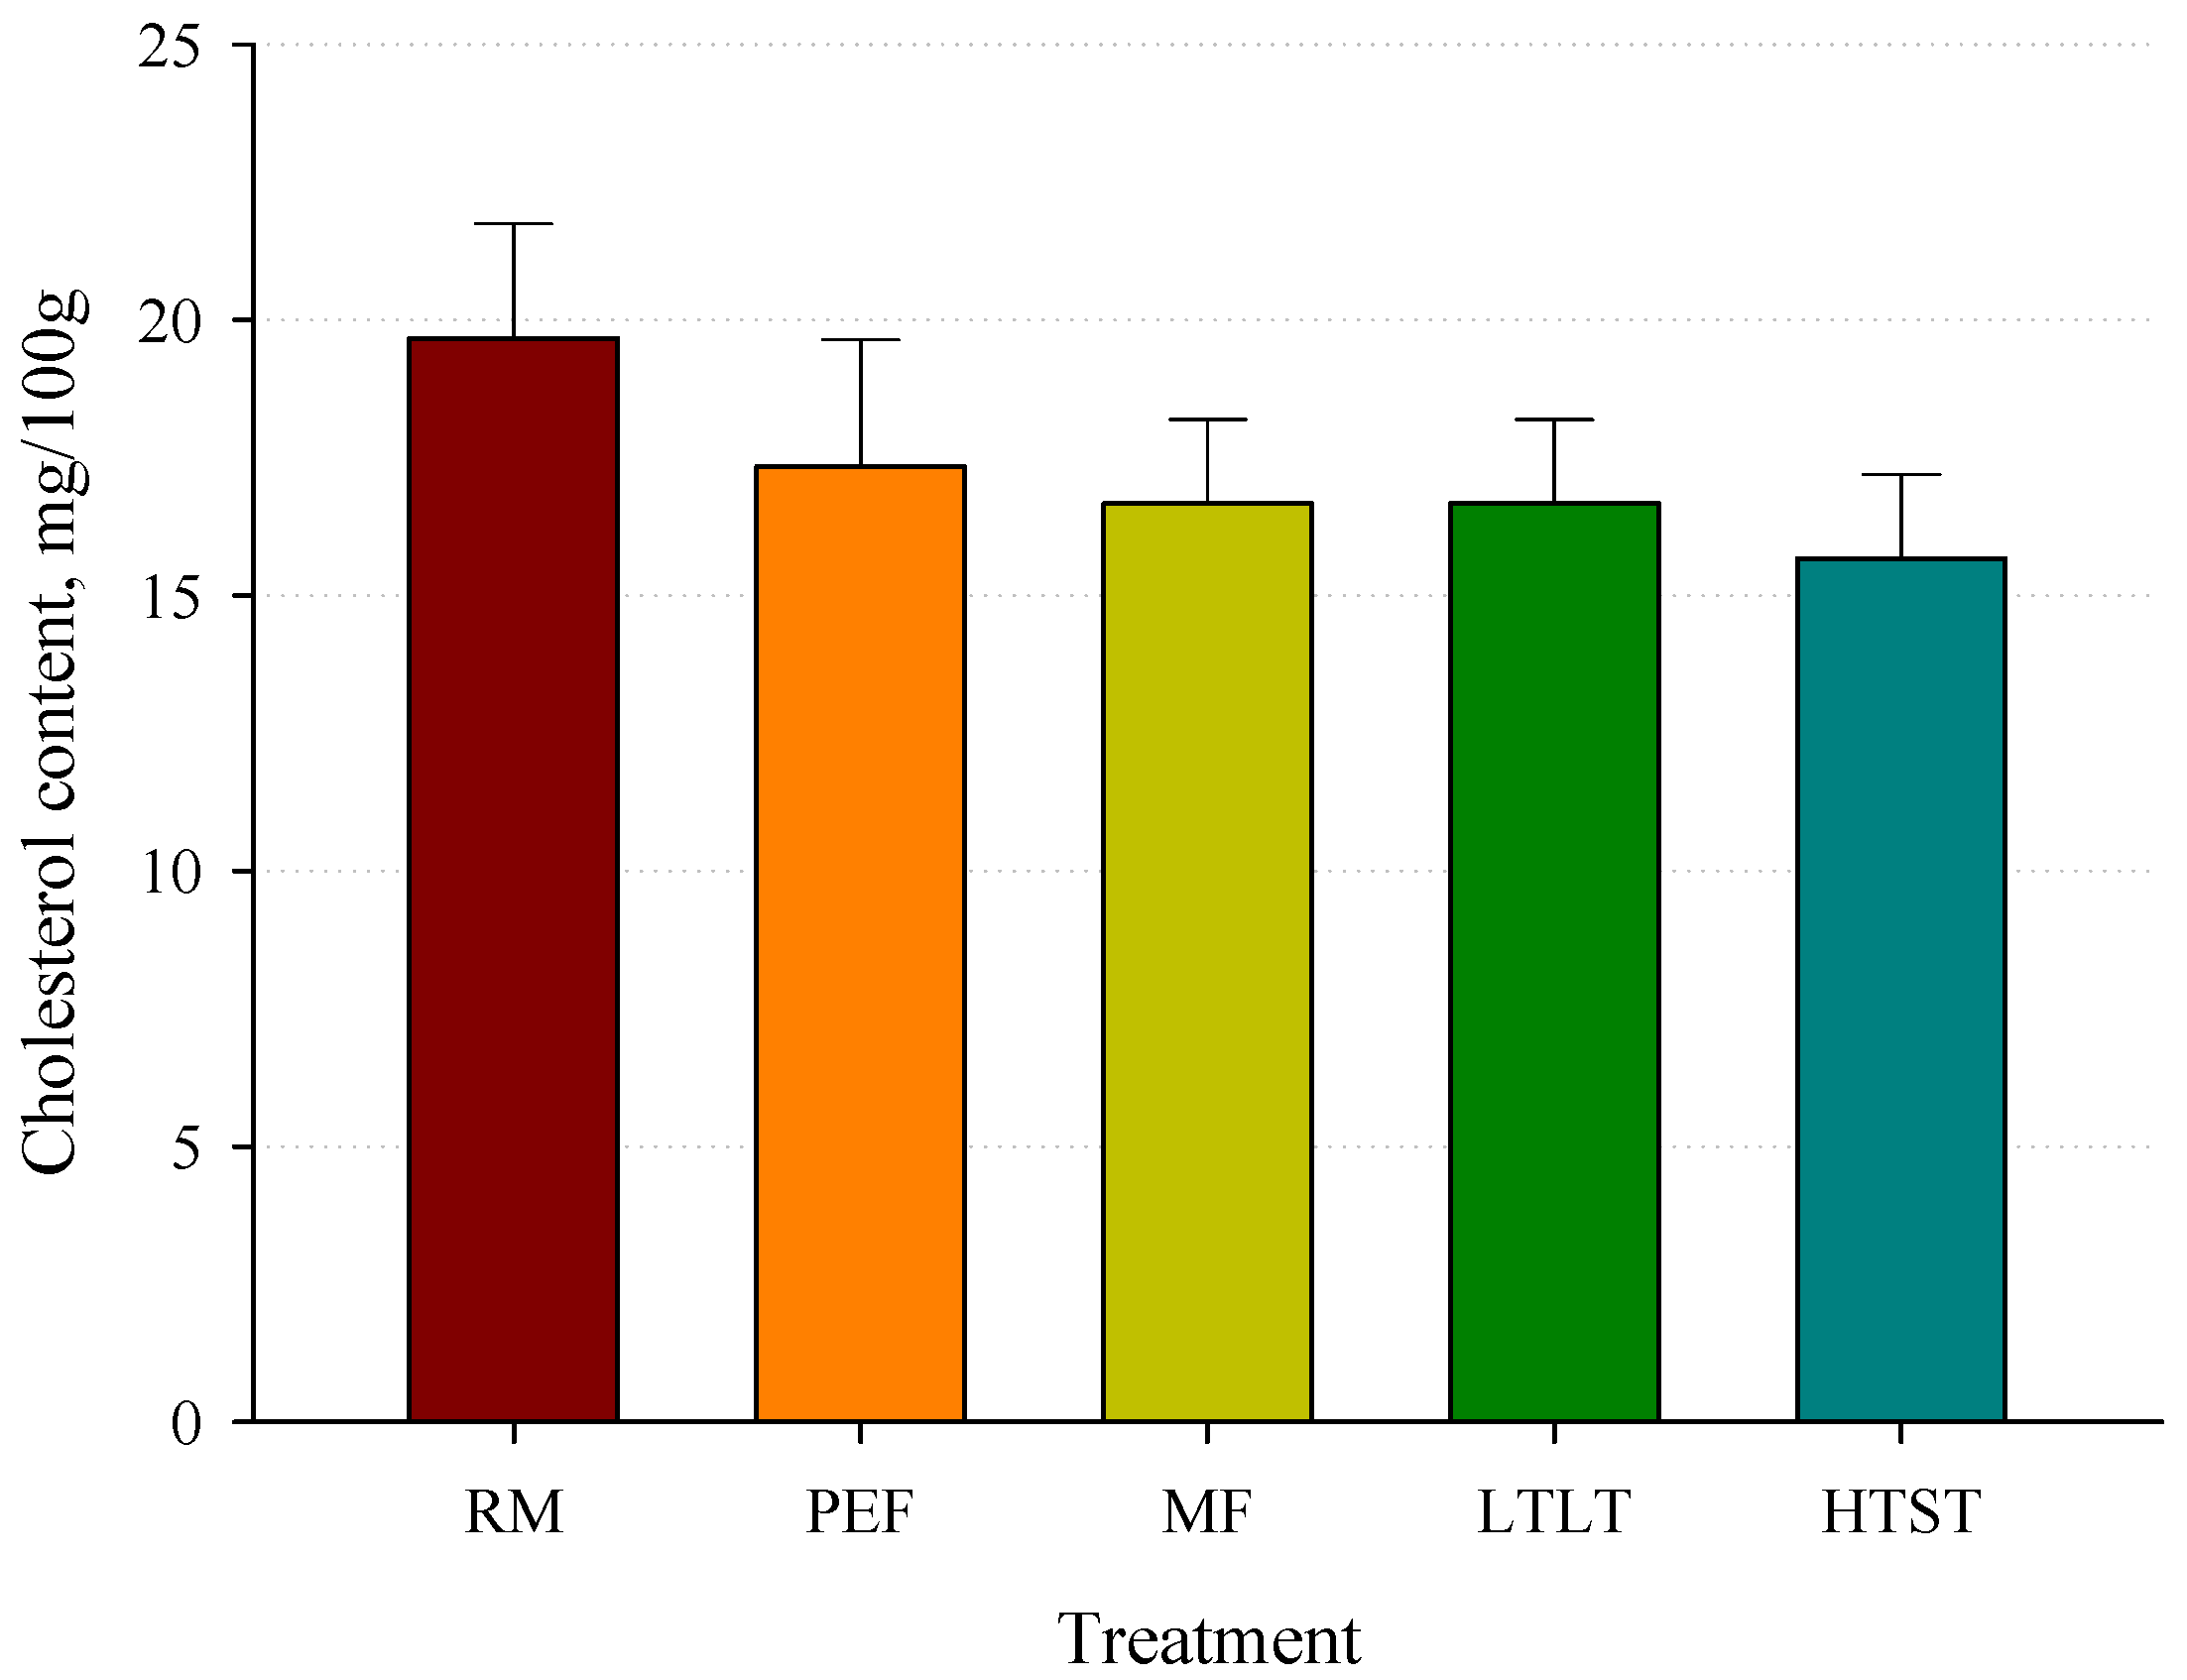
Figure 5 illustrates the cholesterol concentrations in milk samples subjected to pulsed electric field (PEF) treatment and thermal pasteurization techniques, including microfiltration (MF), low-temperature, long-time (LTLT), and high-temperature, short-time (HTST) processes. The cholesterol content across these treatments showed no significant difference when compared to the control value of 19.6 mg/100 g after accounting for variance. Cholesterol concentrations in the samples exhibited the following averages: 17.3 mg/100 g in PEF-treated samples, 16.6 mg/100 g in MF-treated samples, 16.6 mg/100 g in LTLT-treated samples, and 15.6 mg/100 g in HTST-treated samples.

3.5. DPPH Radical Scavenging Activity after Pasteurization

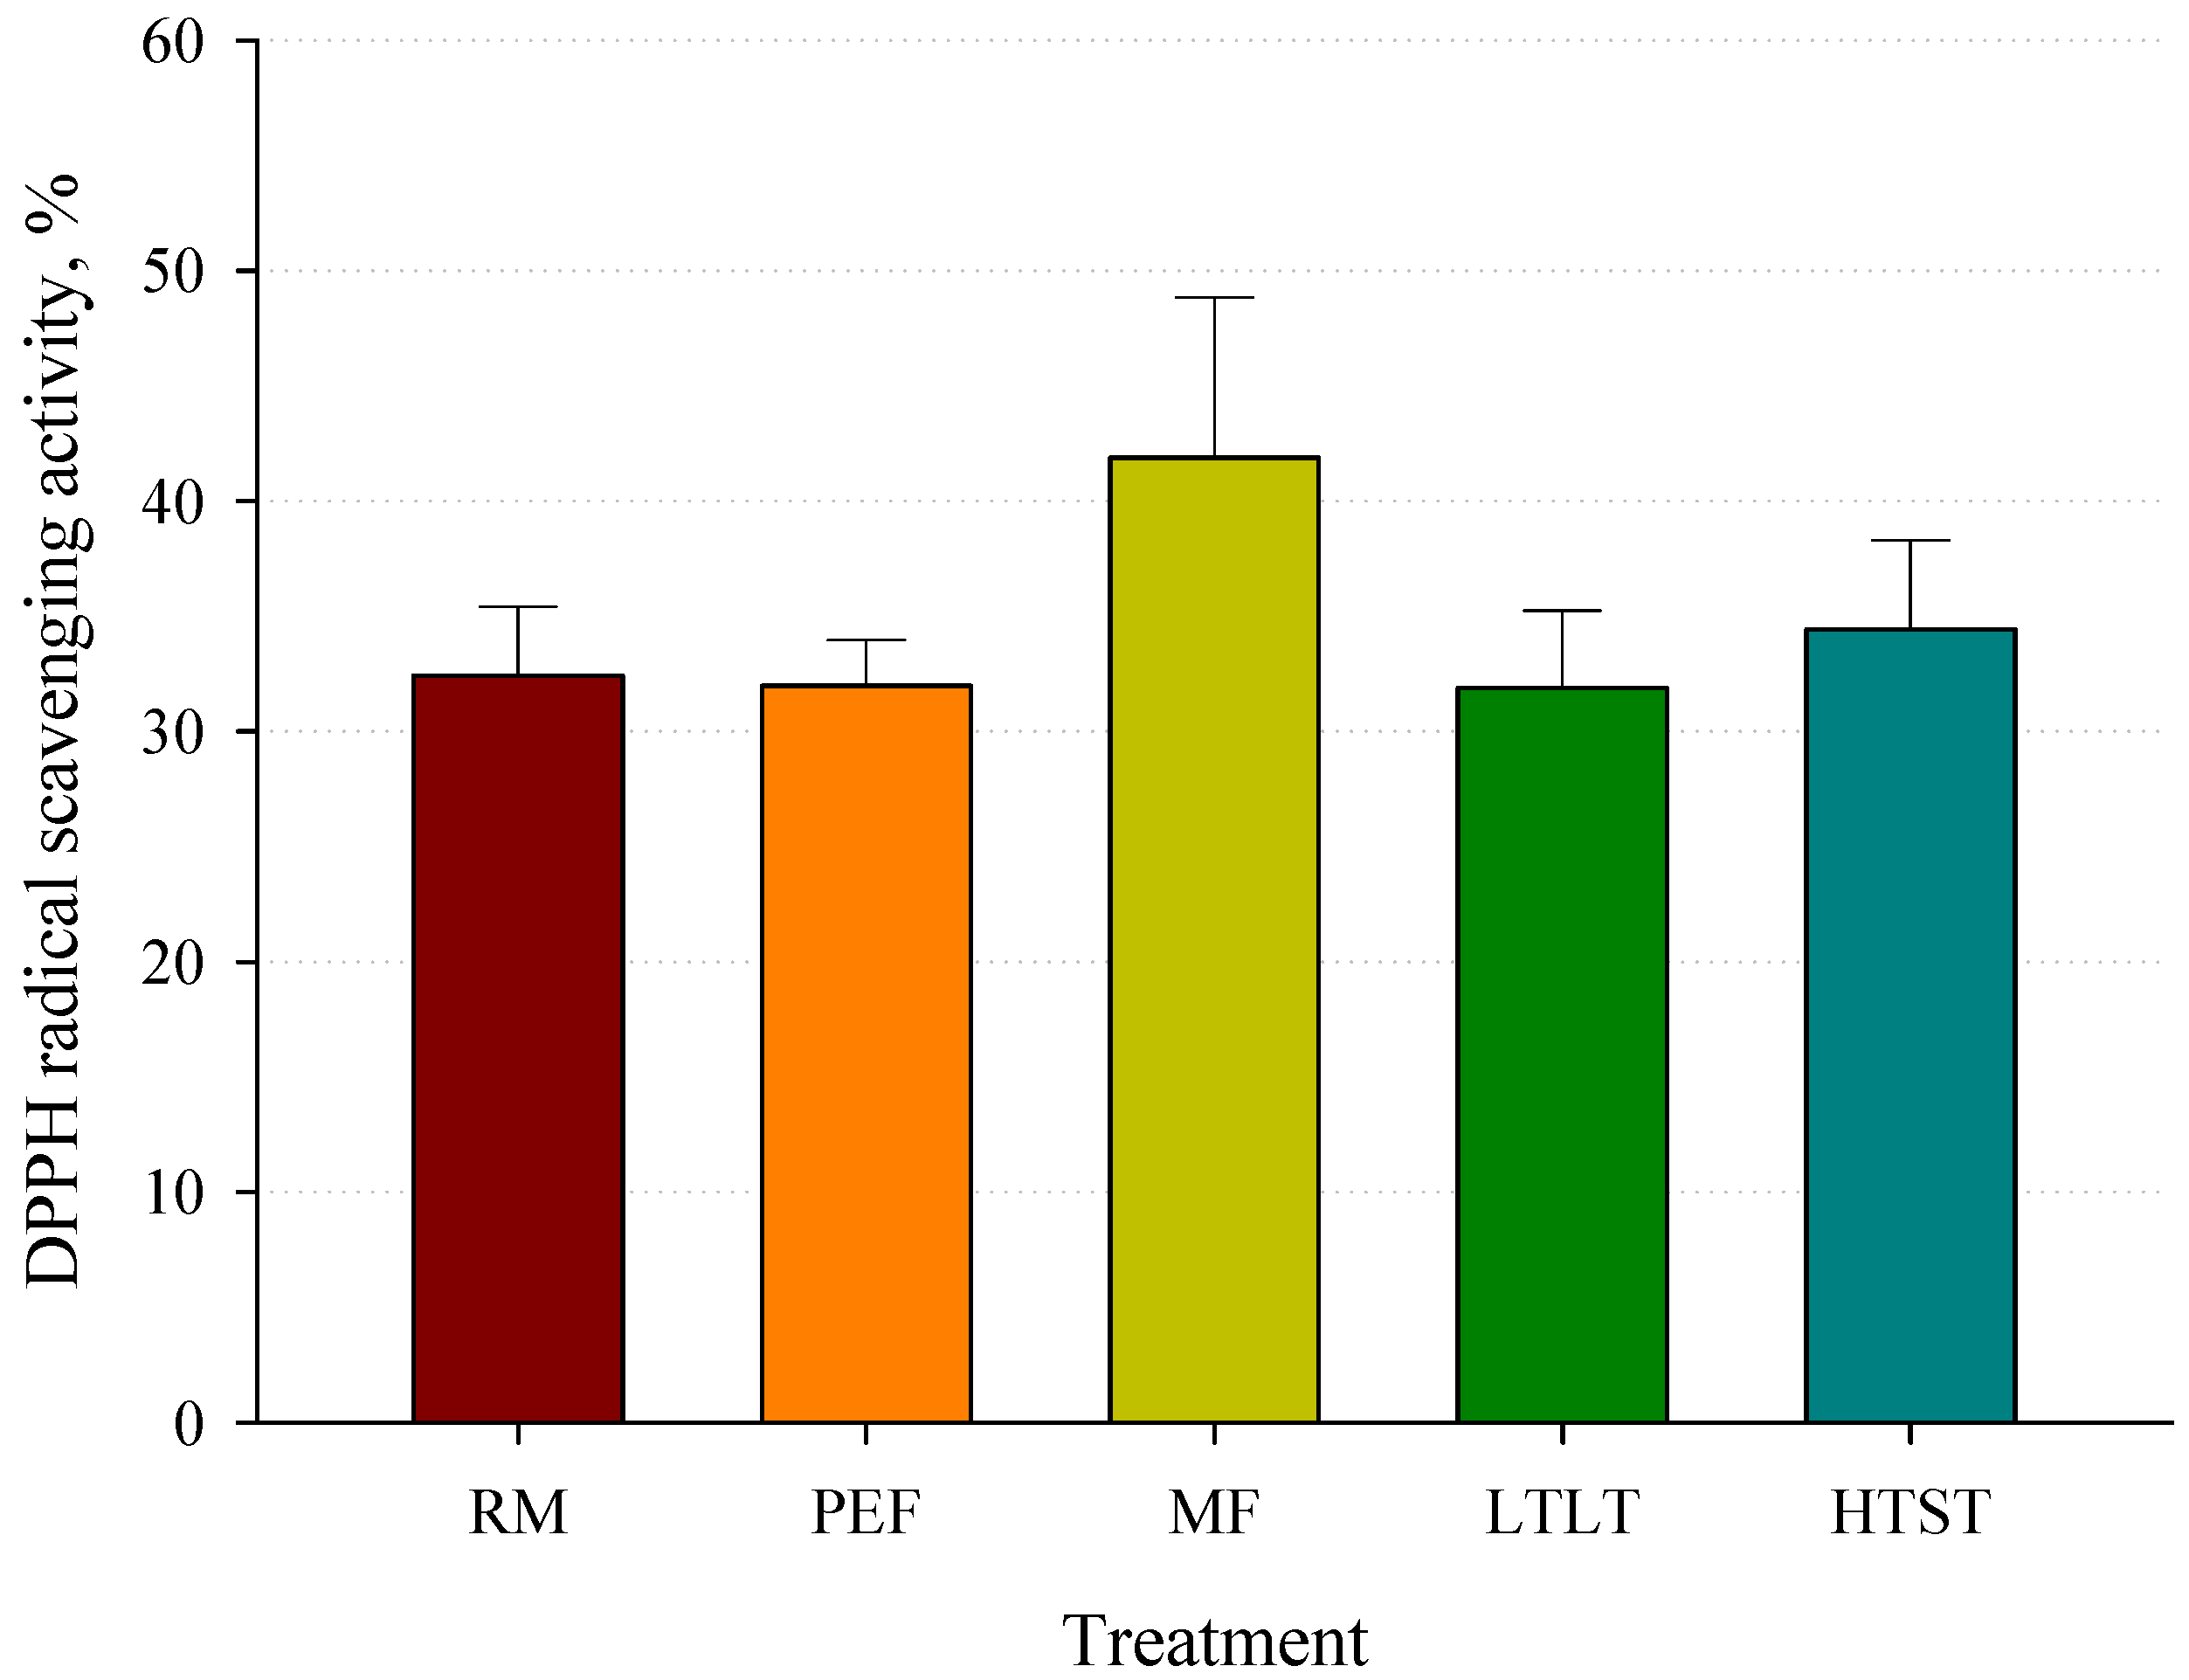
In Figure 6, we illustrate the results of our assessment of 2.2-diphenyl-1-picrylhydrazyl (DPPH) radical scavenging activity in milk samples subjected to various thermal pasteurization methods and PEF treatment. No significant differences were observed in the DPPH radical scavenging activity between the control group (32.4%), PEF-treated, and thermally pasteurized samples. Specifically, the average DPPH radical scavenging activity in the PEF-treated samples was 31.9%, while MF-treated samples exhibited an average of 41.9%. Furthermore, samples treated with LTLT pasteurization showed an average DPPH radical scavenging activity of 31.9%, and those subjected to HTST pasteurization displayed an average of 34.4%.

3.6. Fatty Acid Profile of Milk after Pasteurization

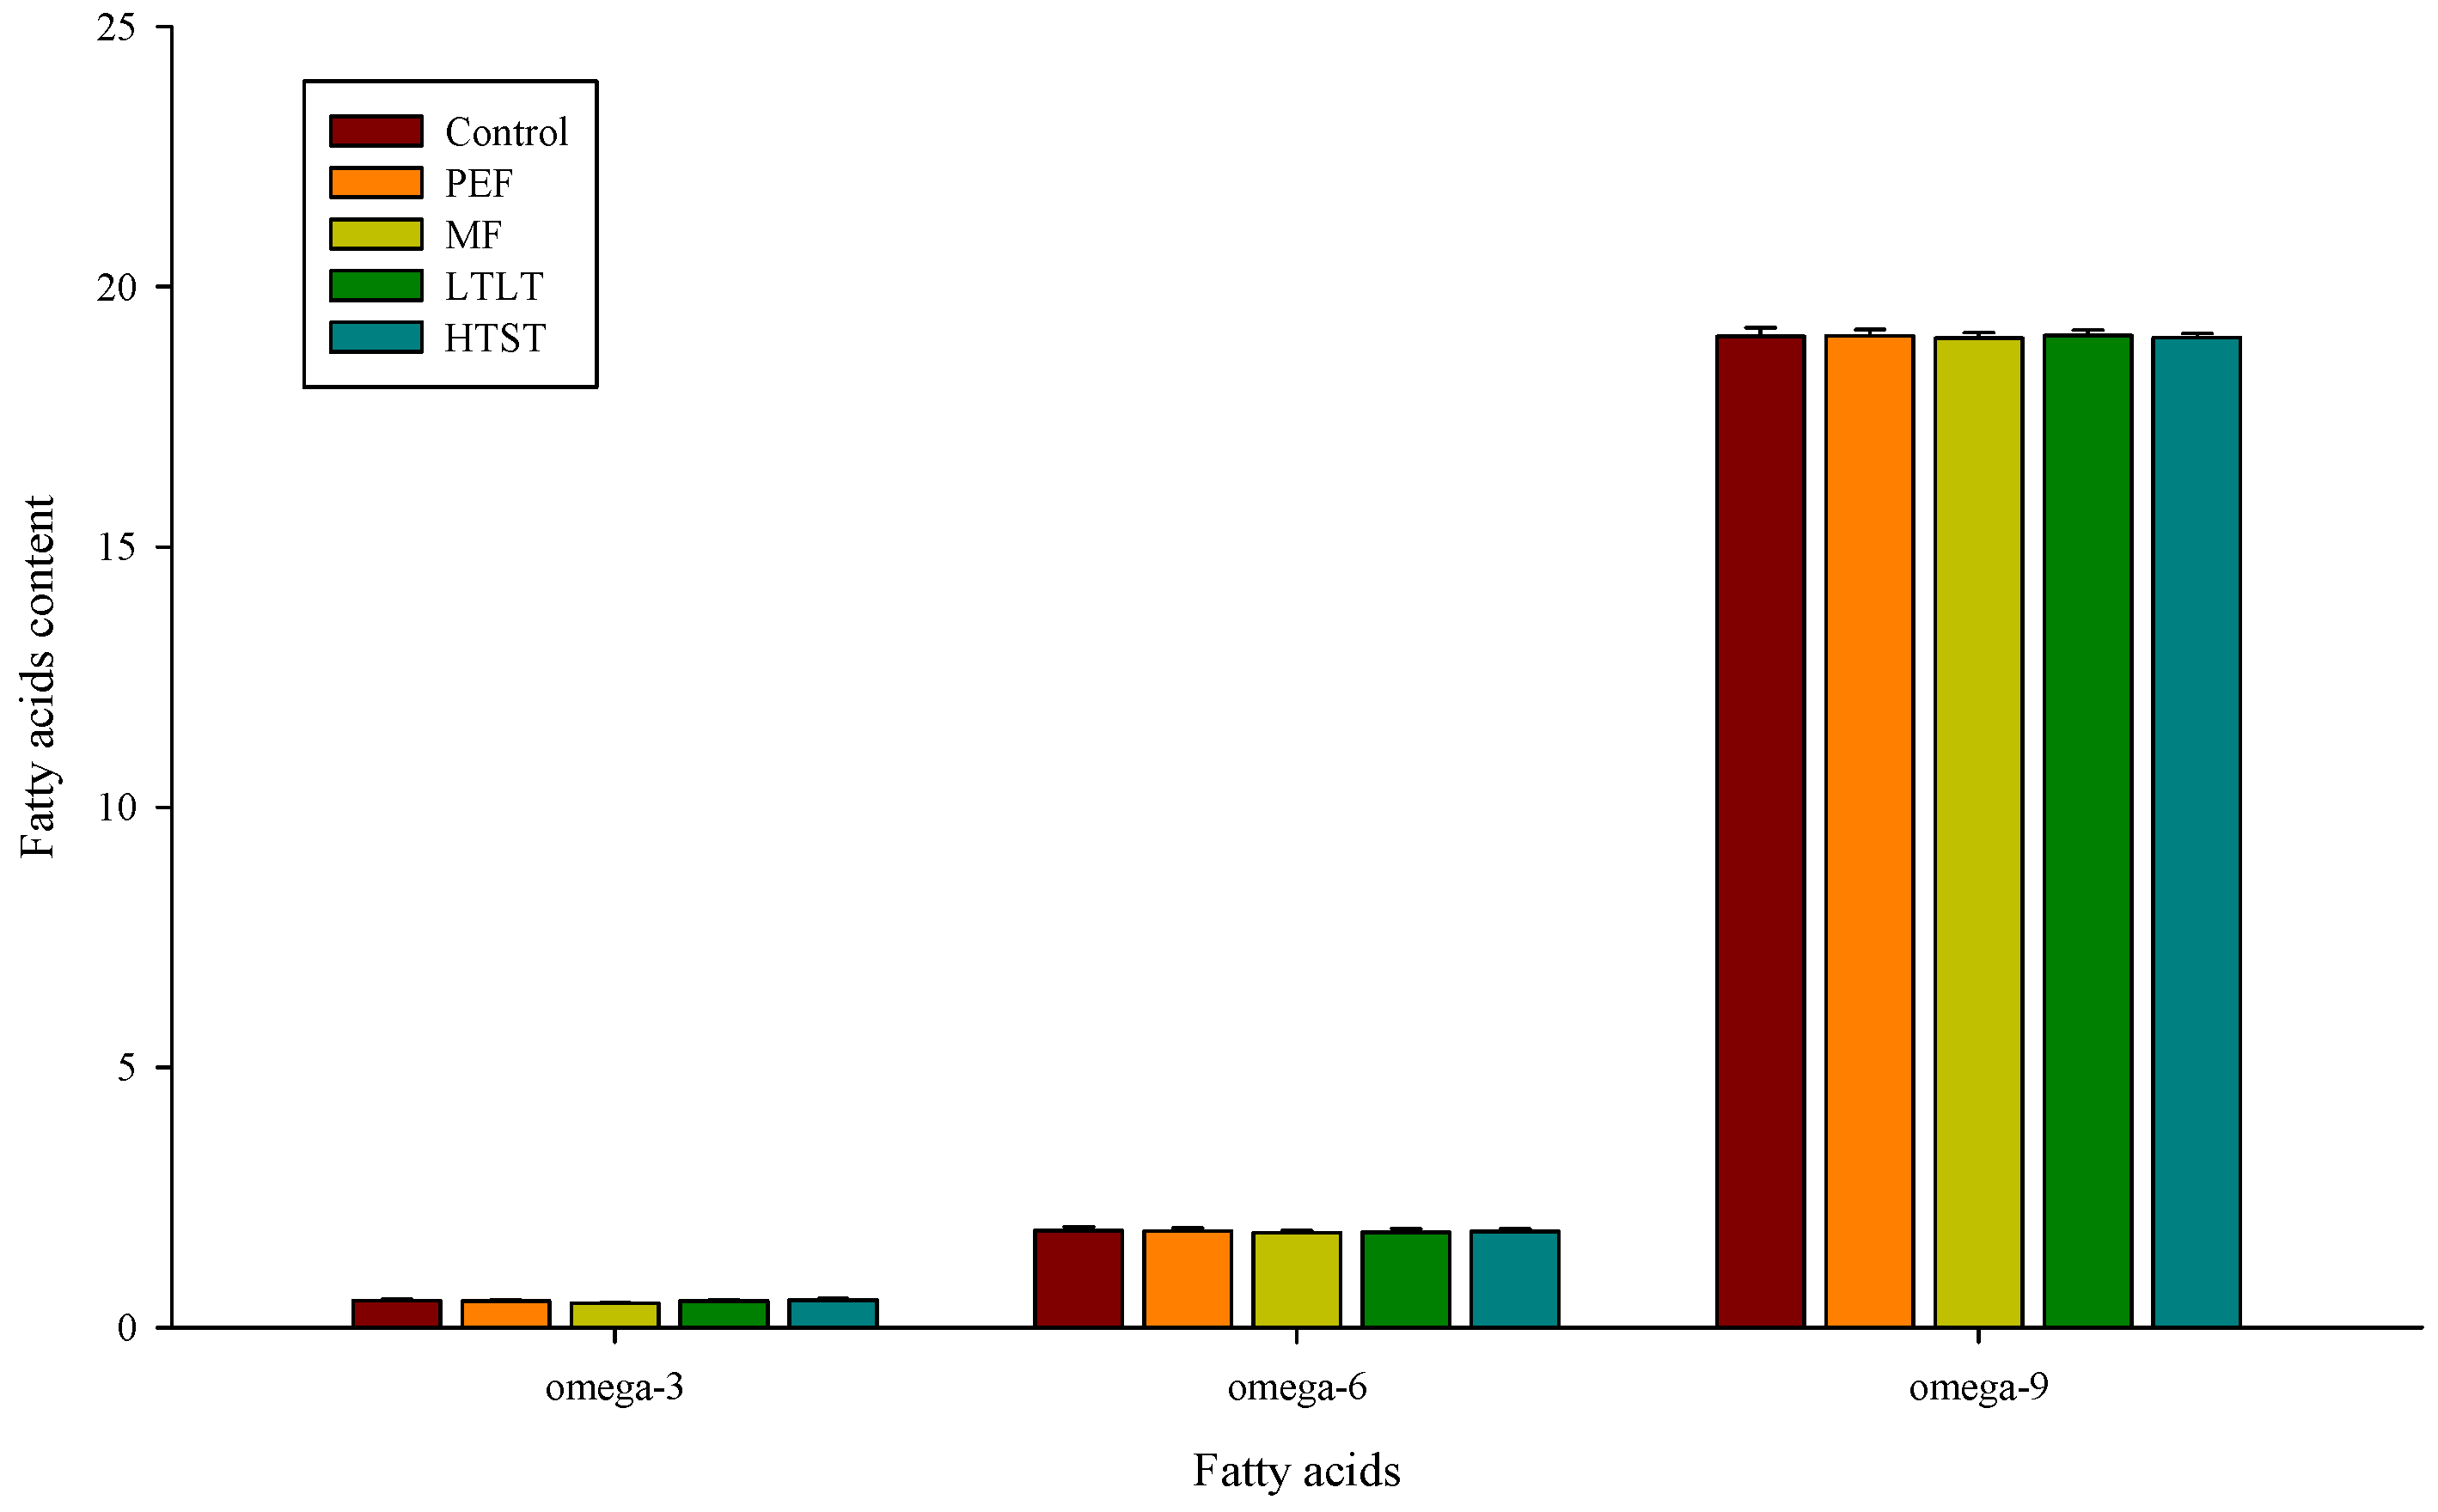
Figure 7 illustrates the results of our investigation into the fatty acid content in milk samples subjected to pasteurization techniques of PEF, MF, LTLT, HTST. No significant differences were observed between the control and treated samples. In control samples, average omega-3 content was 0.51%, omega-6 content 1.81%, and omega-9 content 19.04% of the total fatty acid content. In PEF-treated samples, omega-3 content was 0.50%, omega-6 1.85%, and omega-9 19.05%. For MF-treated samples omega-3 content was 0.47%, omega-6 1.82%, and omega-9 19.01%. LTLT-treated samples demonstrated similar results, with omega-3 content of 0.47%, omega-6 1.82%, and omega-9 19.01%. In HTST-treated samples, the average omega-3 content was 0.52%, omega-6 1.85%, and omega-9 19.02%.

3.7. Glycomacropeptide (GMP) Concentrations after Pasteurization

Figure 8 illustrates the impact of various pasteurization methods and PEF treatment on the glycomacropeptide (GMP) content in milk samples. No significant differences were observed in GMP content between the control group and the samples subjected to PEF, MF, LTLT, and HTST treatments. The control samples exhibited an average GMP content of 12.25 mg/100 mL. PEF-treated samples had an average GMP content of 13.32 mg/100 mL, while MF-treated samples showed an average GMP content of 11.95 mg/100 mL. In addition, LTLT-treated samples exhibited an average GMP content of 11.68 mg/100 mL, and HTST-treated samples had an average GMP content of 11.78 mg/100 mL.

3.8. Histamine Concentrations after Pasteurization

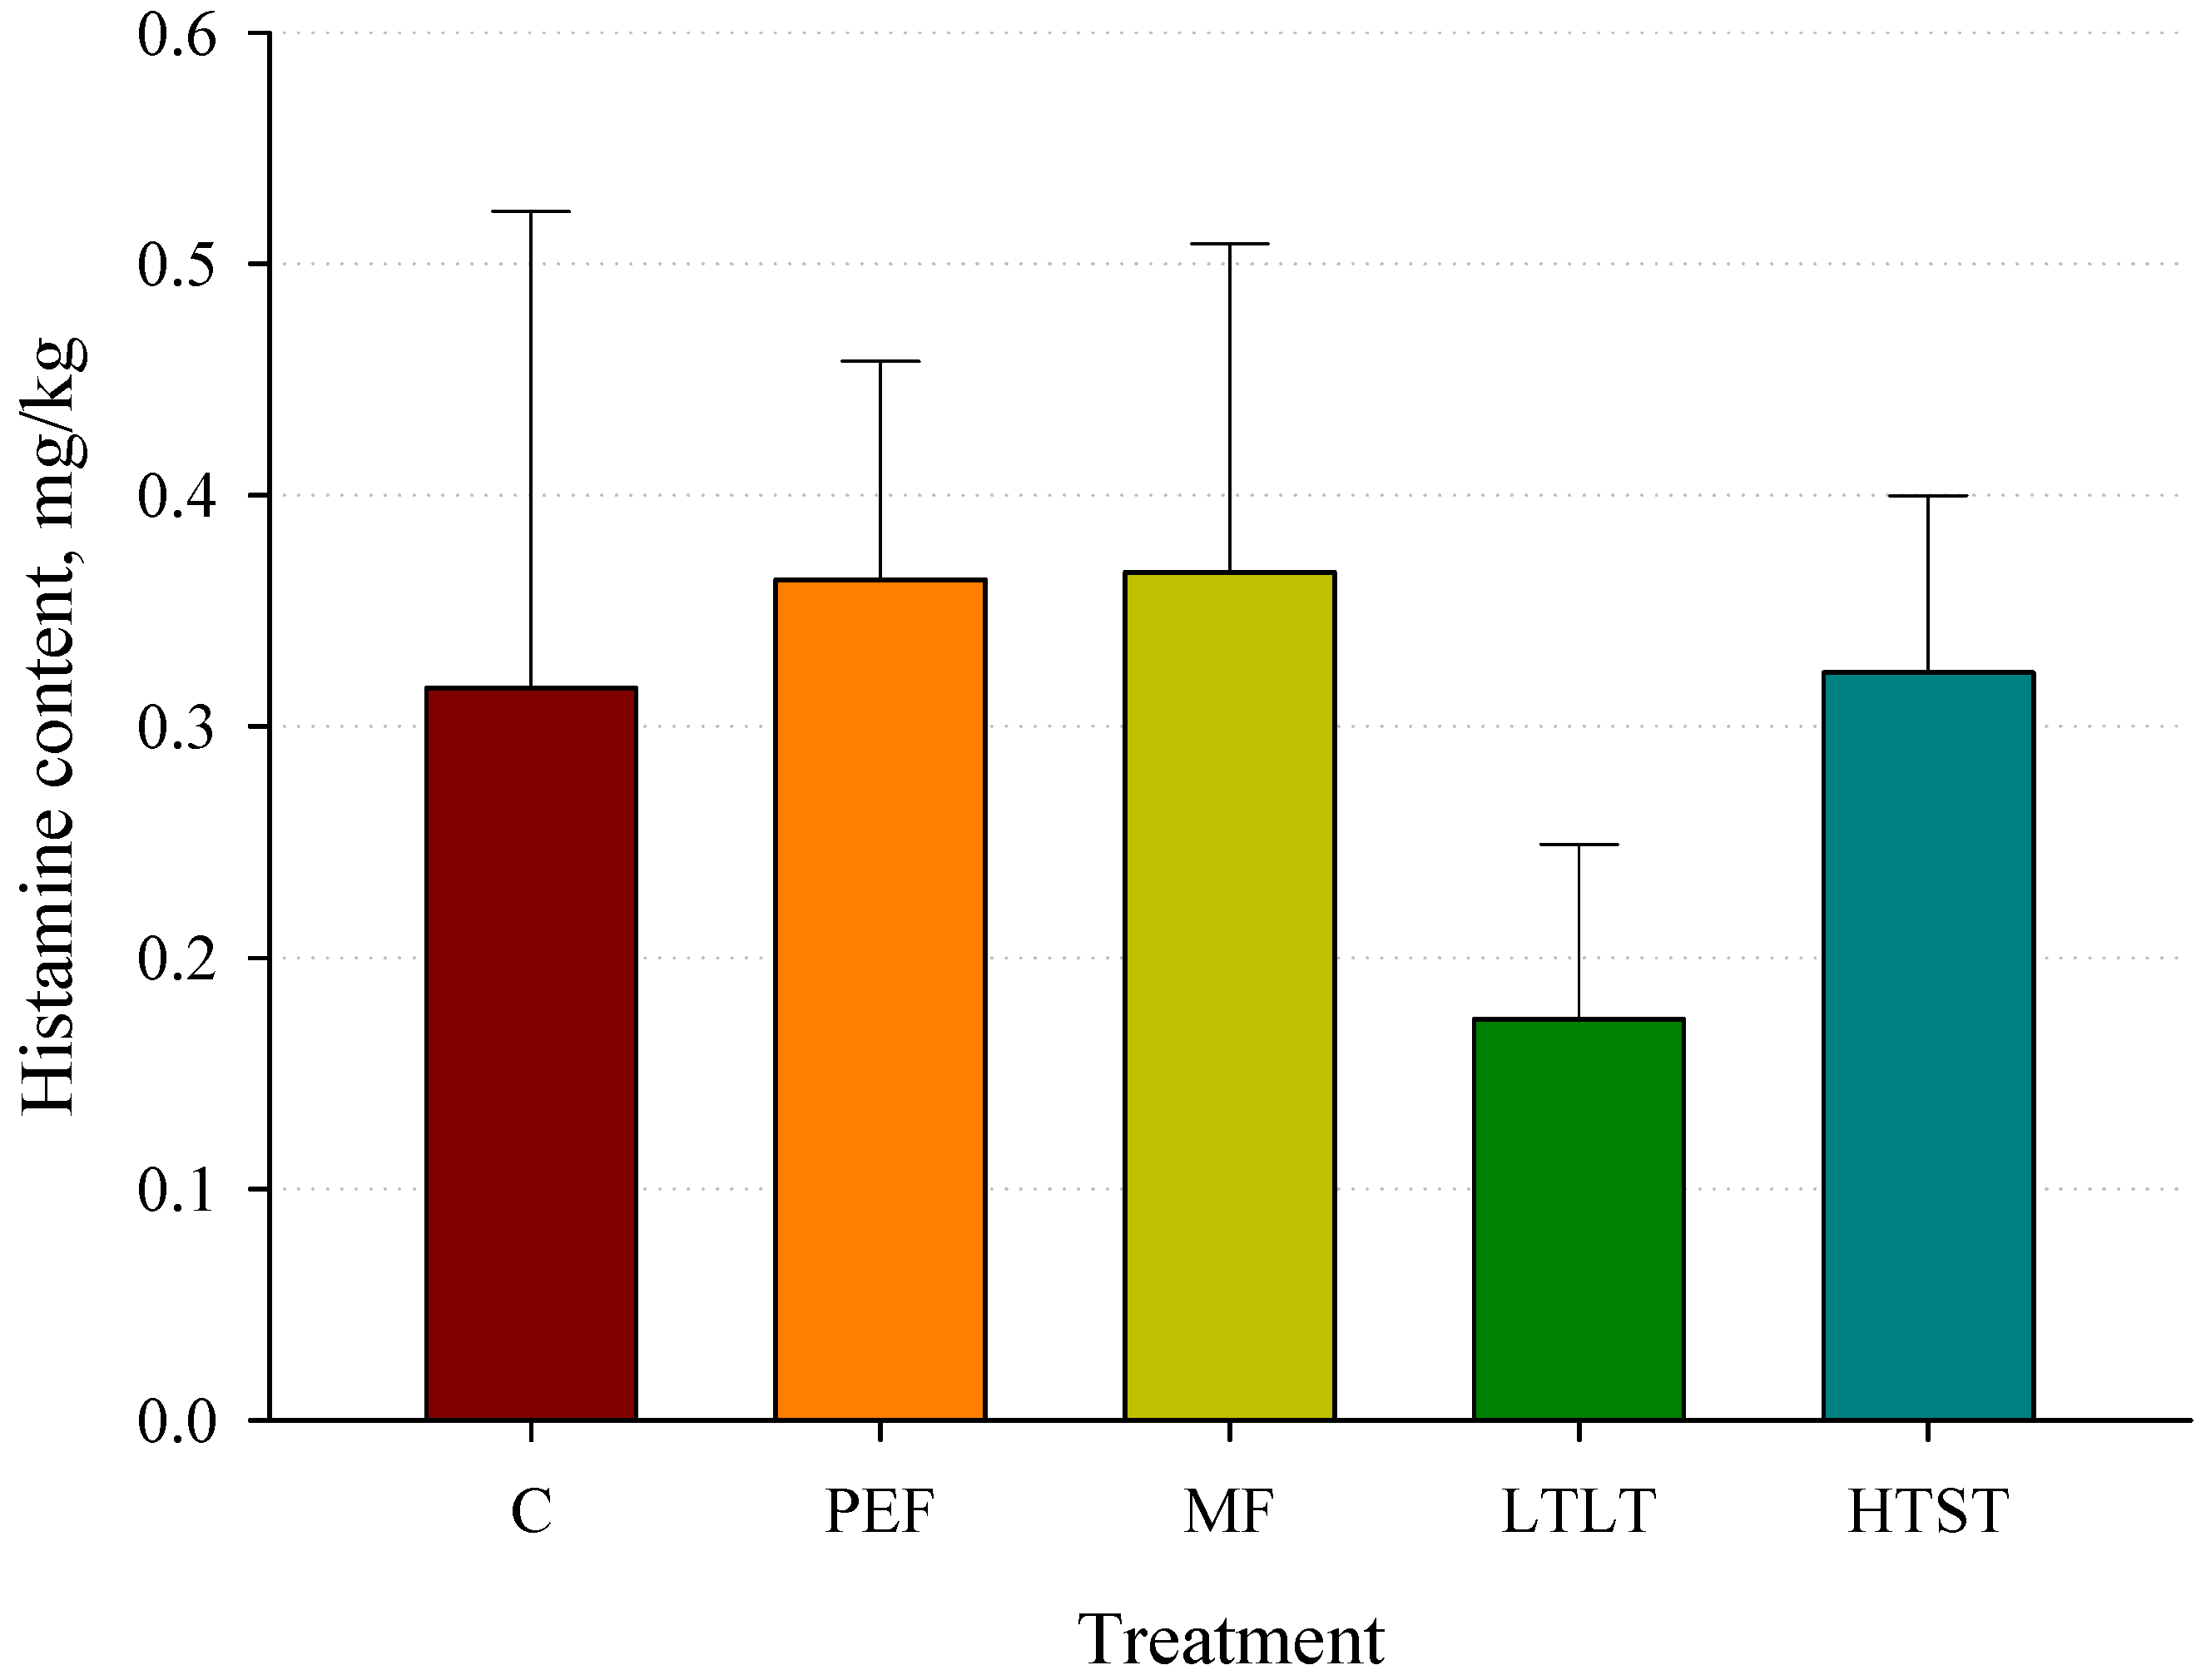
In the next step, we evaluated the impact of PEF treatment and thermal pasteurization methods on histamine concentration in milk samples (Figure 9). The analysis accounted for dispersion and histamine amounts in milligrams per kilogram. No significant difference was observed between the control and treated samples. The control group exhibited a histamine concentration of 0.32 mg/kg. For PEF-treated samples, the histamine concentration was 0.36 mg/kg. MF treatment resulted in a histamine concentration of 0.37 mg/kg. LTLT pasteurization yielded a histamine concentration of 0.17 mg/kg, while HTST pasteurization method a histamine concentration of 0.32 mg/kg.

3.9. Vitamin A Concentrations after Pasteurization

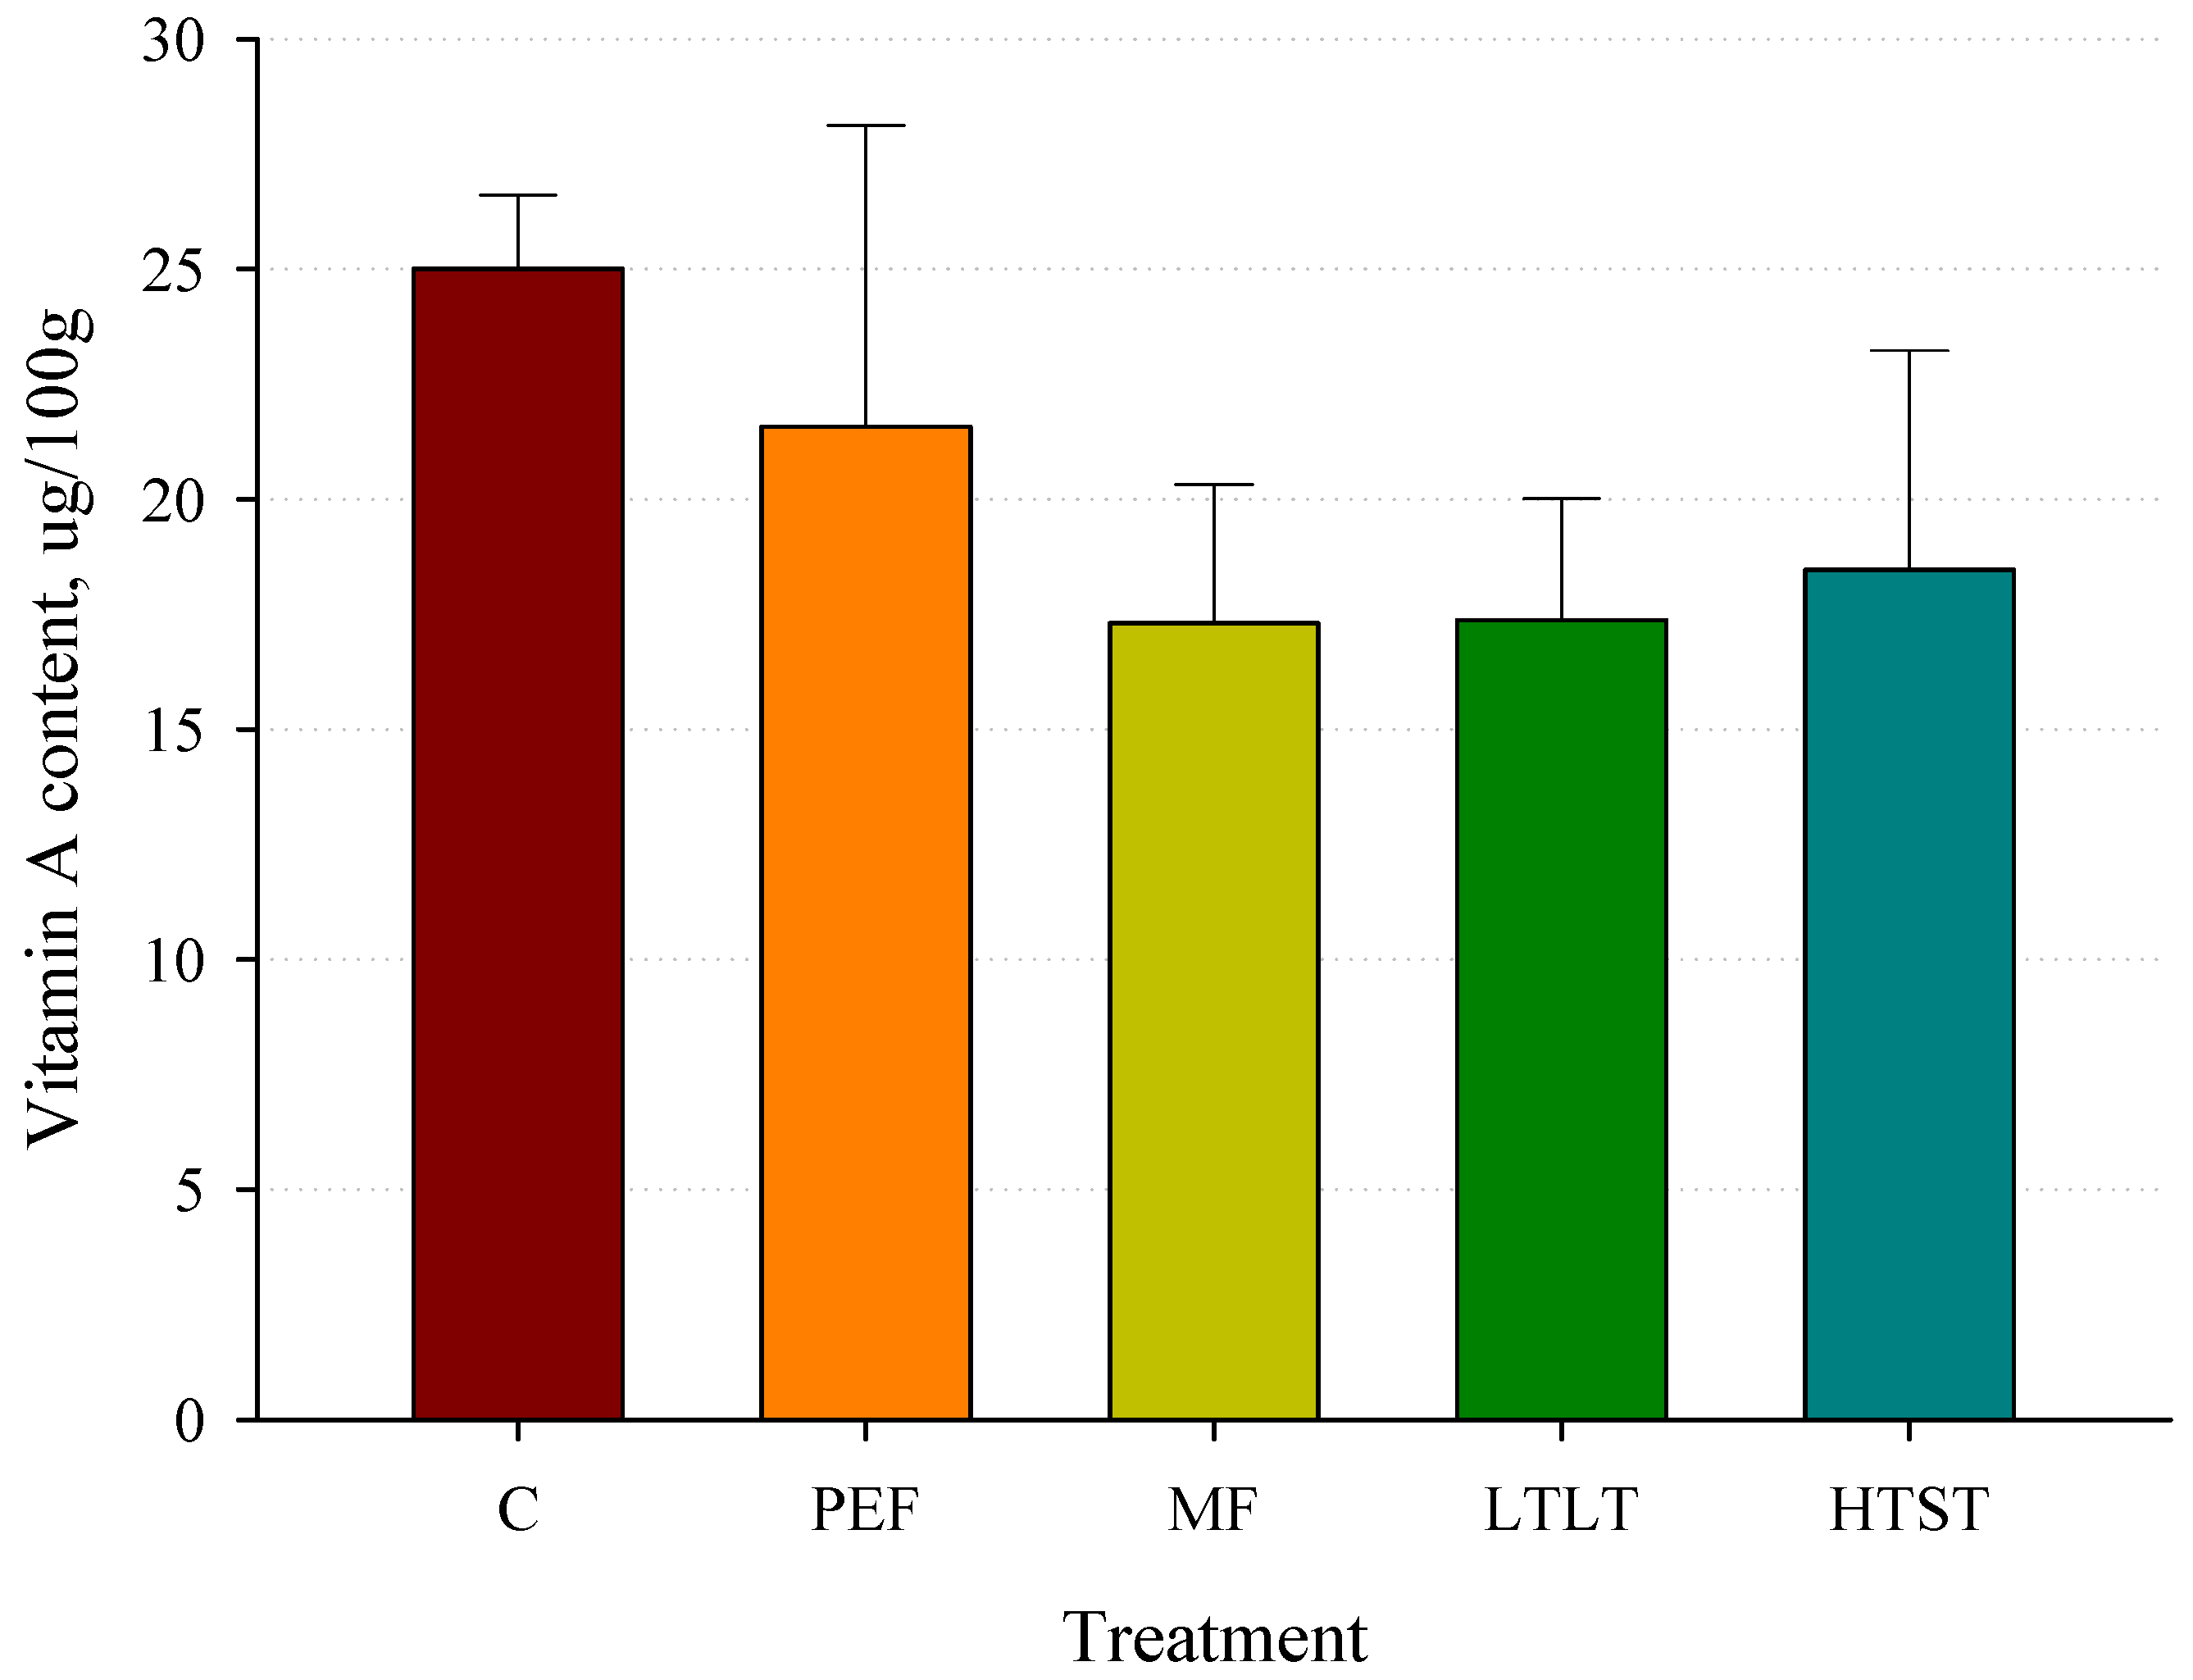
In Figure 10, we illustrate the effect of various treatment methods on vitamin A concentration in milk samples, expressed in micrograms per 100 g of milk. No significant differences were observed in the vitamin A concentrations among the control and treated samples. The control samples exhibited a vitamin A concentration of 25 µg/100 g. PEF treated samples displayed an average vitamin A concentration of 22 µg/100 g. MF-treated samples yielded a vitamin A concentration of 17 µg/100 g. LTLT- and HTST-treated samples demonstrated similar average vitamin A concentrations of 17 µg/100 g and 18 µg/100 g, respectively.

3.10. Vitamin D Concentrations after Pasteurization

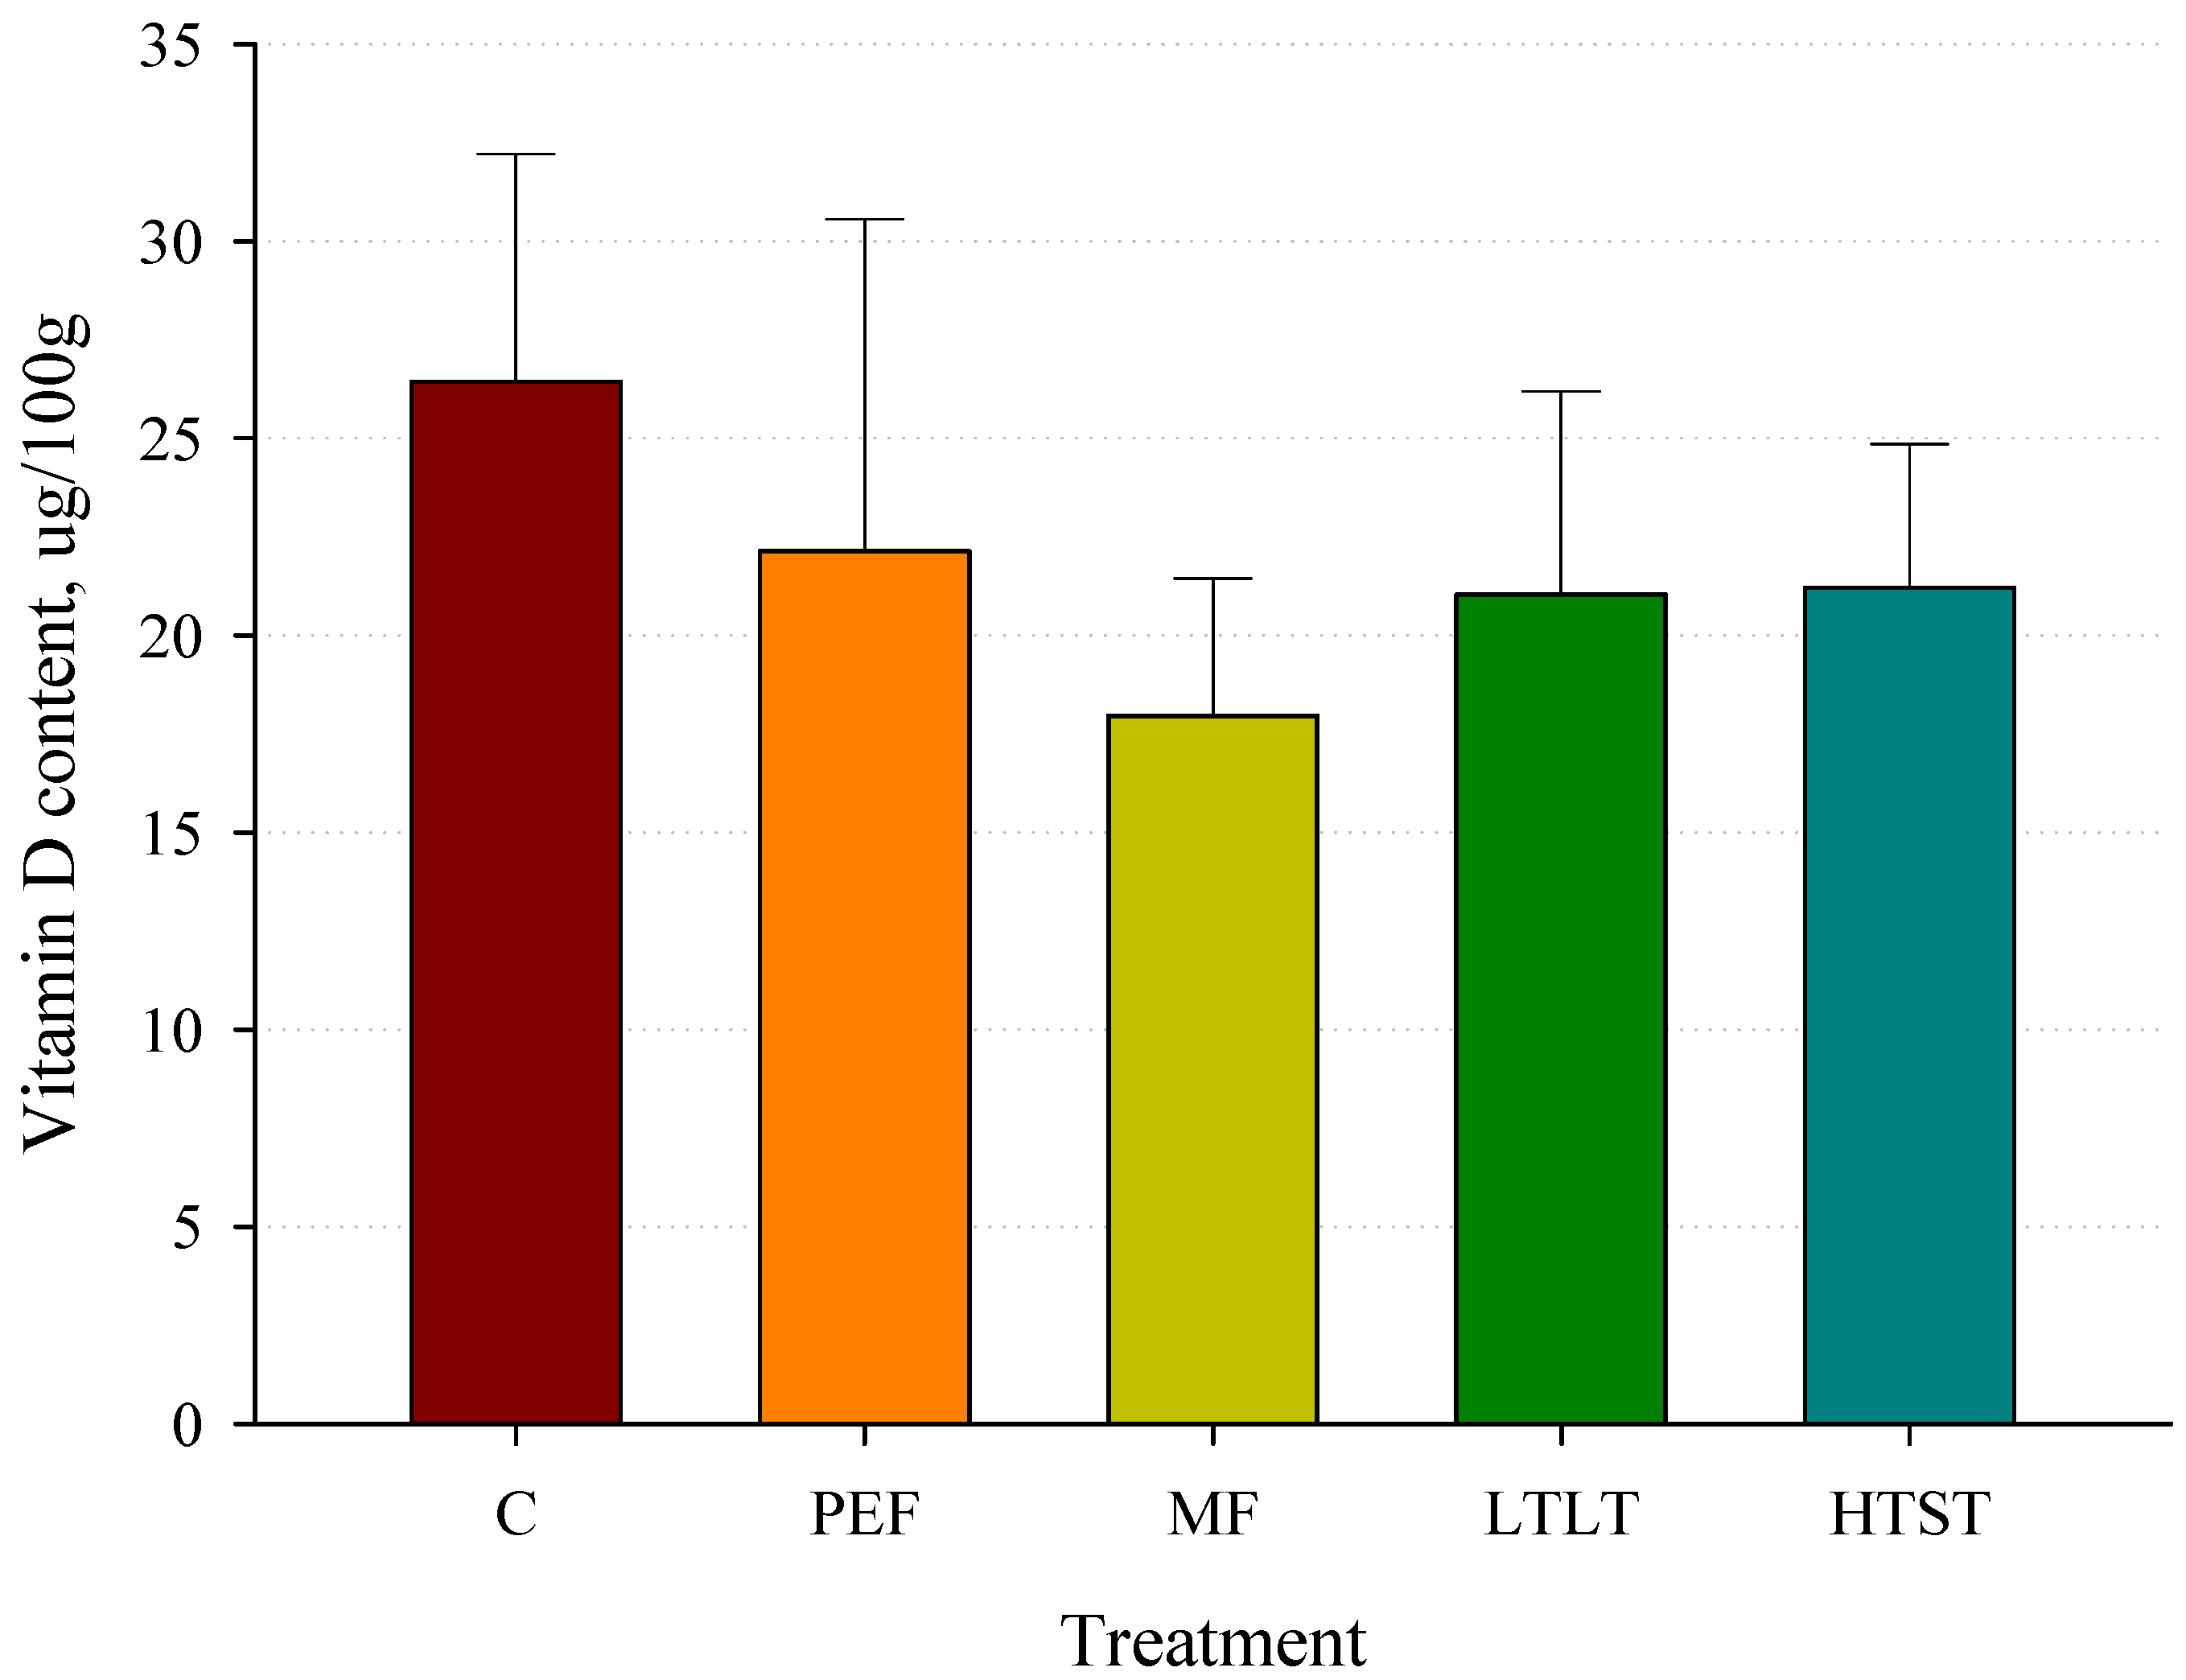
In Figure 11, we illustrate the impact of various treatments on the vitamin D content of milk samples. The vitamin D concentrations were measured in micrograms per 100 g of milk. The control samples exhibited a vitamin D concentration of 26 µg/100 g. In comparison, PEF-treated samples had an average vitamin D concentration of 22 µg/100 g. MF-treated samples demonstrated a vitamin D concentration of 18 µg/100 g, while LTLT-treated samples showed a concentration of 21 µg/100 g. Lastly, HTS-treated samples exhibited a vitamin D concentration of 21 µg/100 g. No statistically significant differences in vitamin D concentrations were observed across the various treatment groups.

3.11. Vitamin E Concentrations after Pasteurization

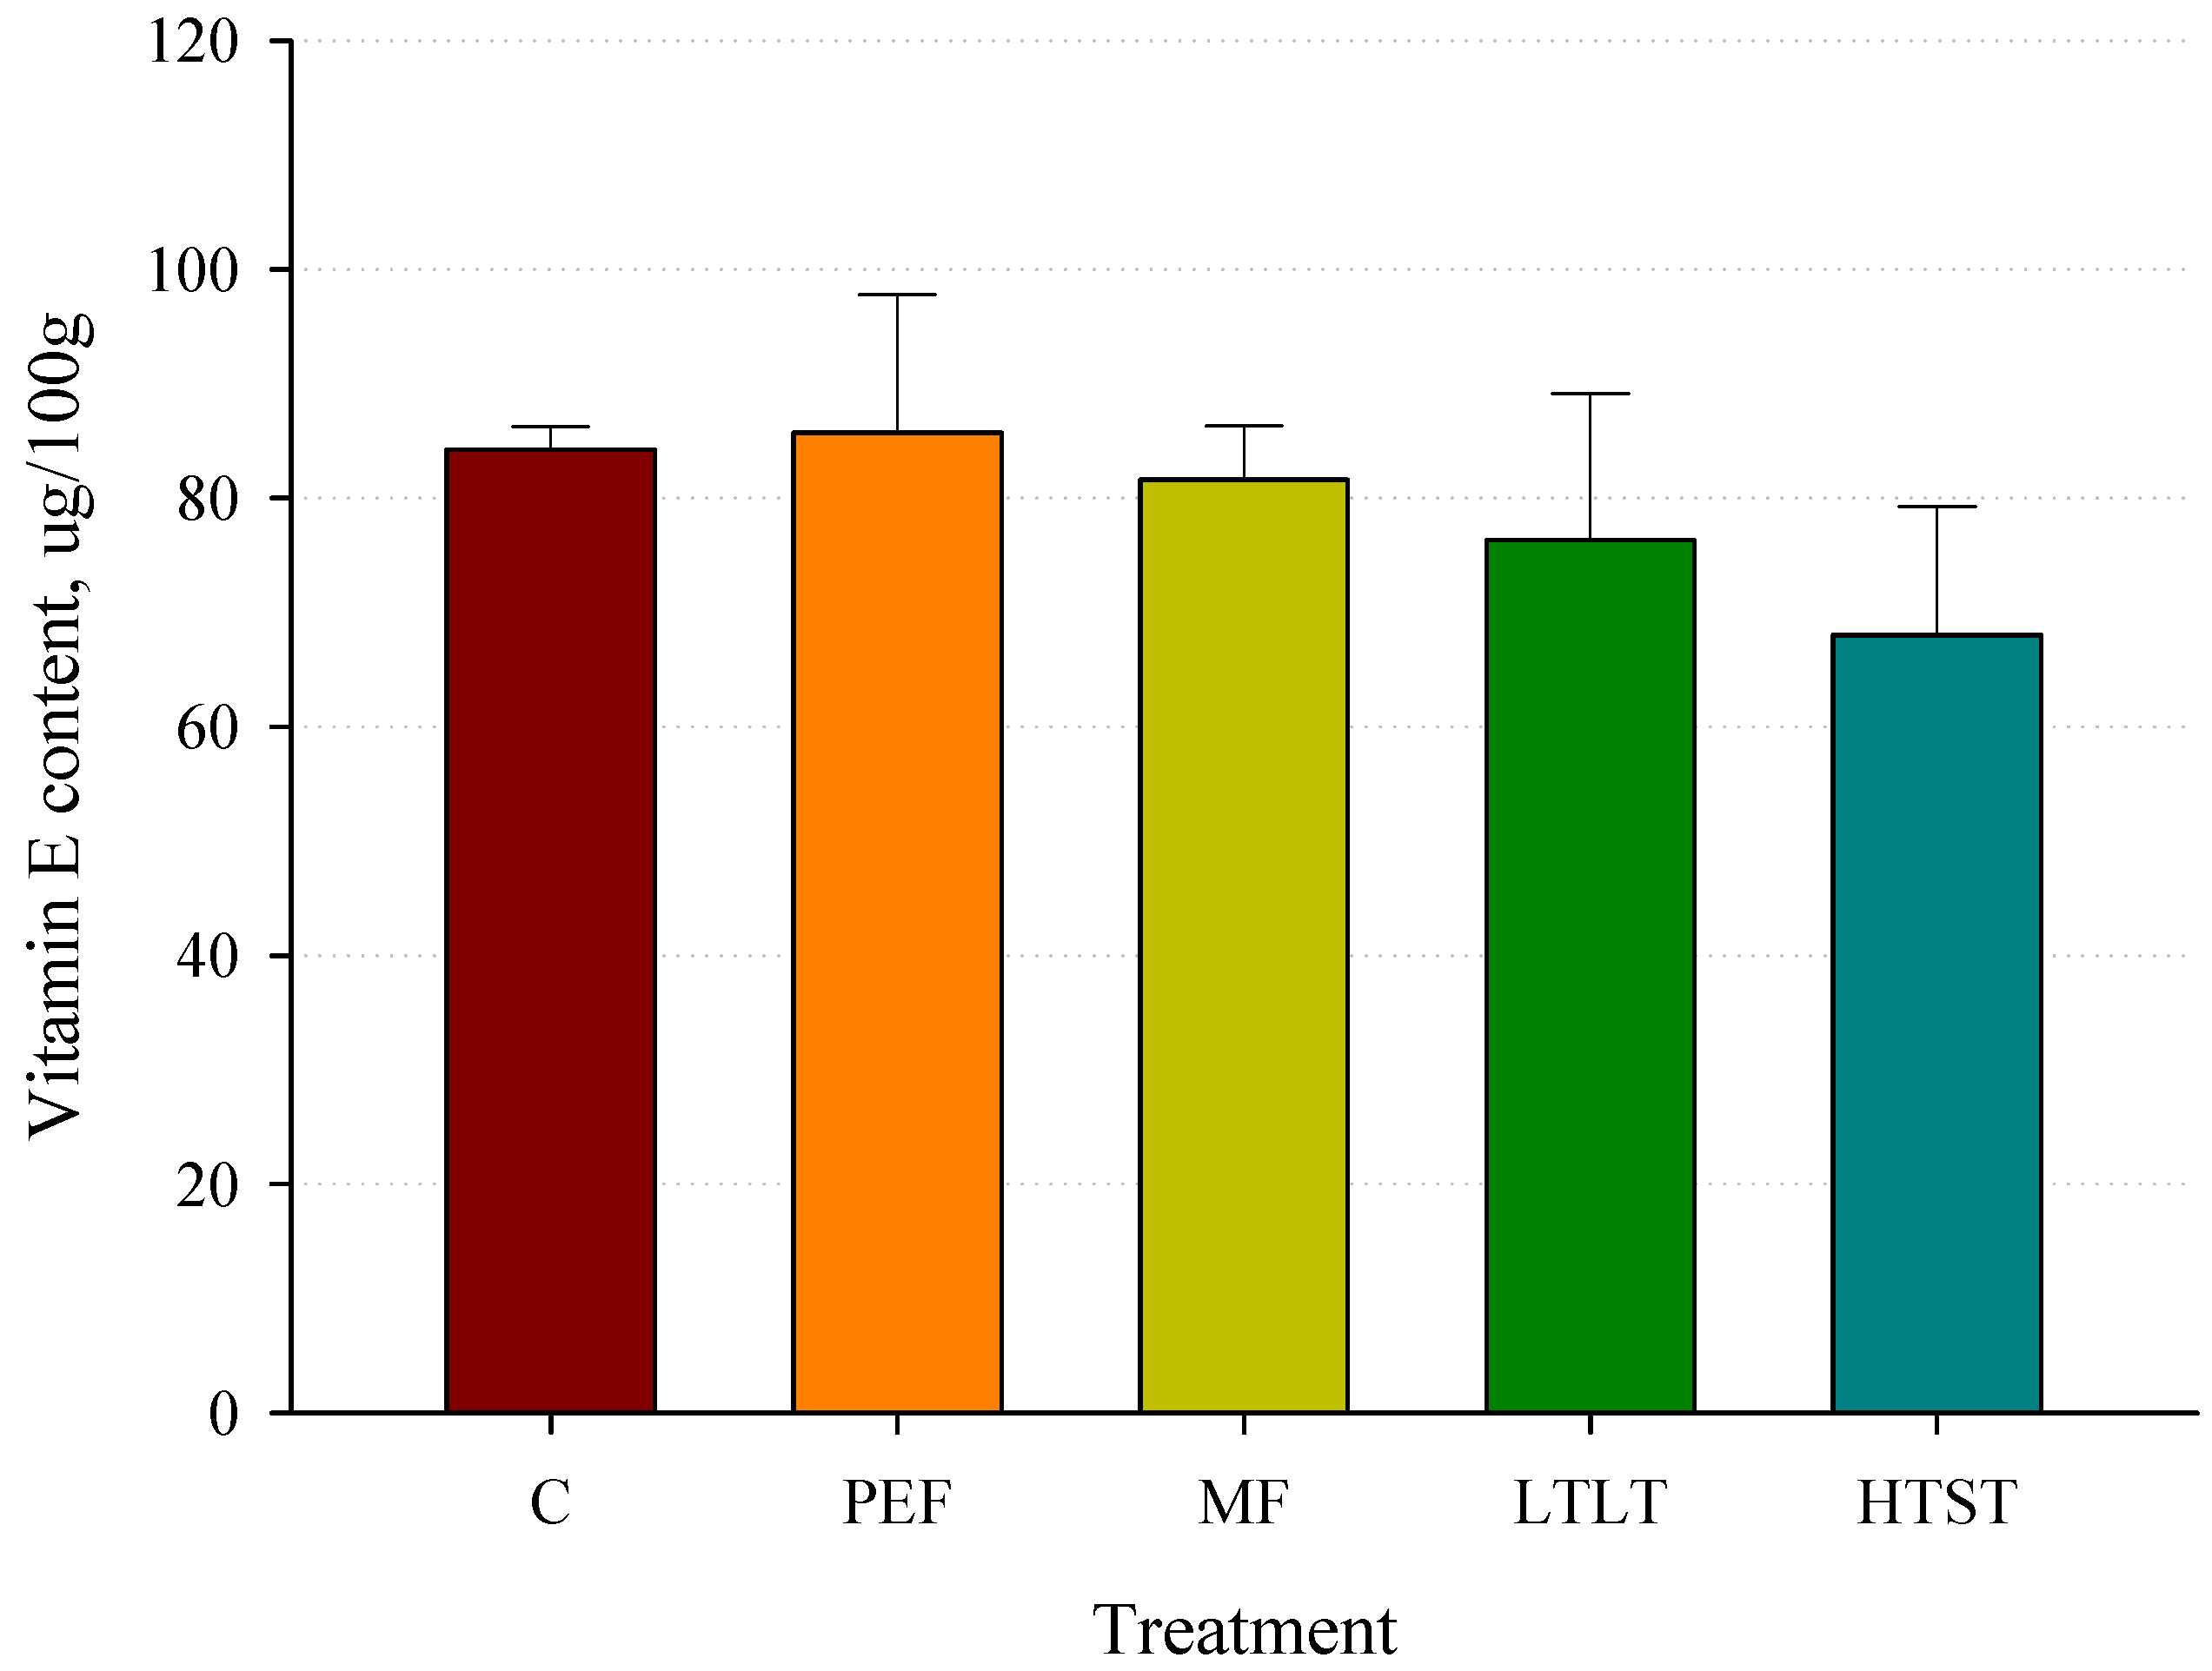
In Figure 12, we illustrate the impact of various treatments on the vitamin E content of milk samples, with concentrations measured in micrograms per 100 g of milk. The control samples exhibited a vitamin E concentration of 84 µg/100 g. In comparison, PEF-treated samples had an average vitamin E concentration of 86 µg/100 g. MF-treated samples demonstrated a vitamin E concentration of 82 µg/100 g, while LTLT-treated samples showed a concentration of 76 µg/100 g. Lastly, HTST-treated samples exhibited a vitamin E concentration of 68 µg/100 g. No statistically significant differences in vitamin E concentrations were observed across the various treatment groups.

3.12. β-Lactoglobulin Content in Liquid Whey after Curd Removal and Pasteurization

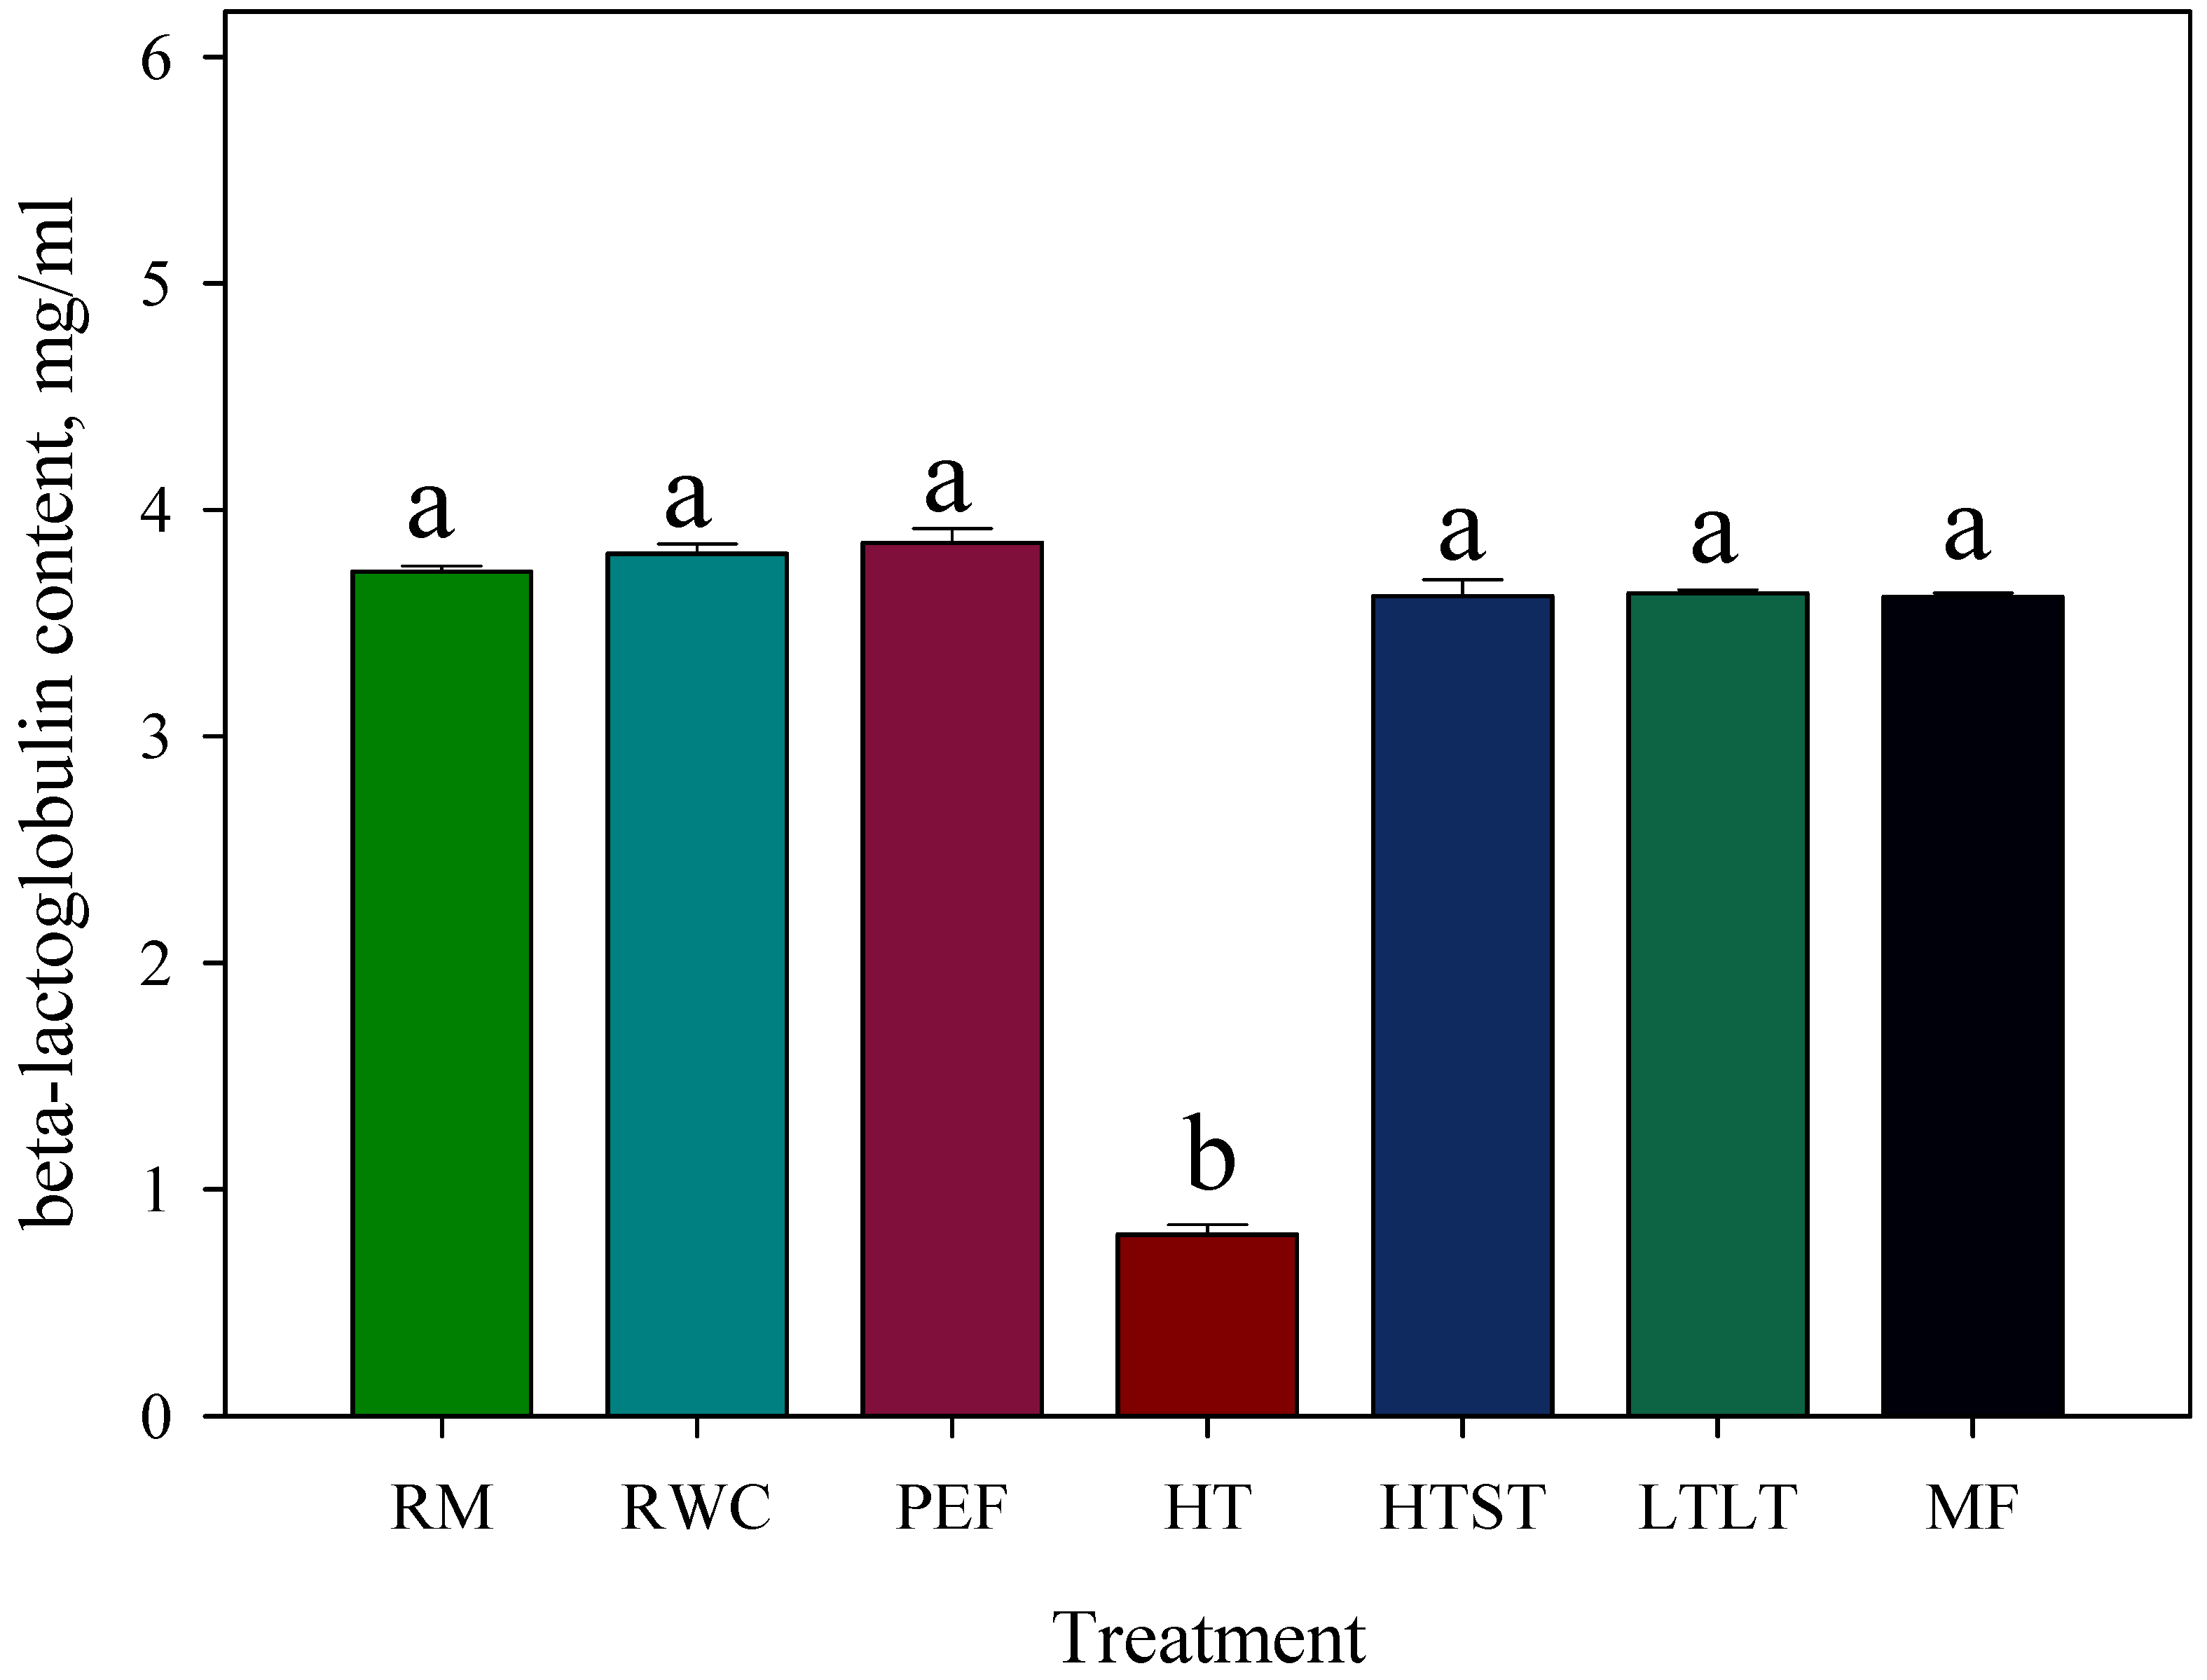
Figure 13 presents an evaluation of the β-lactoglobulin content in milk samples. Raw milk (RM) was used as control, with a β-lactoglobulin concentration of 3.71 mg/mL. This way, we wanted to demonstrate that β-lactoglobulin content was not reduced after curd removal in raw whey control (RWC) samples. No significant difference in β-lactoglobulin content was observed among liquid whey samples treated with PEF, HTST, LTLT, or MF concentrations, which were comparable to RWC at 3.81 mg/mL. PEF-treated samples yielded 3.85 mg/mL, while HTST, LTLT, and MF-treated samples had β-lactoglobulin content of 3.62 mg/mL, 3.63 mg/mL, and 3.62 mg/mL. However, liquid whey samples subjected to HT pasteurization at 95 °C for 4 s exhibited a significant reduction in β-lactoglobulin content. Compared to the RWC samples, the β-lactoglobulin content in HT-treated samples was reduced 4.8-fold, with a concentration of 0.80 mg/mL.

3.13. Bacterial Load in Milk Samples: A Comparison between Raw, Curd-Reduced, and Pasteurized Samples

The highest contamination levels were observed in RM samples, with total bacteria of 9.6 × 10² CFU/mL and coliforms of 160 CFU/mL (Table 1). Following curd reduction in raw whey control (RWC) samples, the total bacteria decreased by 1.03 log to 8.3 × 10³ CFU/mL and coliforms decreased by 1.13 log to 12 CFU/mL. Subsequently, RWC samples were pasteurized using various thermal pasteurization techniques and PEF treatment. In PEF-treated samples, the total bacteria reduced by 0.13 log to 6.2 × 10³ CFU/mL, and coliforms decreased by 0.48 log to <4 CFU/mL compared to RWC. No bacterial activity was detected in samples treated with HT. In HTST-treated samples, the total bacteria decreased by 1.54 log to 2.4 × 10² CFU/mL. In LTLT-treated samples, the total bacteria decreased by 1.07 log to 7 × 10² CFU/mL. In MF-treated samples, the total bacteria decreased by 2.36 log to 36 CFU/mL. Coliform bacteria activity was not detected in samples subjected to thermal pasteurization. Mesophilic lactic acid bacteria were not detected in RWC samples treated with thermal pasteurization techniques. In PEF-treated samples, mesophilic lactic acid bacteria activity was observed at 1.6 × 10² CFU/mL, with a bacterial reduction of 1.54 log compared to RWC.

4. Discussion

4.1. Nutritional Properties of Milk Subjected to Thermal Pasteurization Techniques and PEFs

In this investigation, unlike our previous study [27], we have placed a greater emphasis on assessing the nutritional properties of milk subjected to thermal pasteurization techniques compared to PEF treatment. UHT pasteurization, however, was not included within the scope of this research, as its impact on whey protein content was discussed previously [27]. We applied HT pasteurization at 95 °C for 4 s on liquid whey samples for comparative purposes.
In contrast to our initial hypotheses, we discerned no substantial difference in the amino acid content amongst samples subjected to microfiltration (MF), low-temperature, long-time (LTLT), high-temperature, short-time (HTST), and pulsed electric field (PEF) treatments (Figure 2). This observation is congruent with extant literature that posits mild heat treatment does not significantly modify the amino acid content of milk in relation to raw milk [28], demonstrating the parity of PEF treatment with traditional thermal pasteurization techniques. Nevertheless, it bears mentioning that ultrahigh-temperature (UHT) pasteurization has been documented to markedly impact the amino acid content, with an average decrement of 34% noted in the levels of cysteine, cystine, and methionine in skim milk samples treated using the UHT steam injection technique [29].
β-Lactoglobulin content in milk samples remained consistent across all thermal pasteurization techniques and PEF treatment relative to the control. Interestingly, a 75% reduction in β-lactoglobulin content was observed in our previous study, where samples were treated with an industrial-scale LTLT pasteurization line [27]. This variance may be attributed to the multistage processing of raw milk, including creaming, pasteurization and homogenization [30], which were not accounted for in the current study. We caution against directly comparing the results from our previous research [27], as all thermal pasteurization, apart from PEF treatment, was conducted using industrial-scale pasteurization lines. The thermal pasteurization in this research was performed on whole milk according to industry-standard heat treatment procedures.
An intriguing observation from our study was the increased β-casein and κ-casein content in samples treated with LTLT pasteurization relative to PEFs and control (Figure 4). The level of casein content increased across all samples subjected to thermal pasteurization. However, statistical significance was only observed in samples treated with LTLT. The mechanisms underlying the thermal pasteurization-induced increase in casein content are not fully understood. Potential explanations may include protein aggregation and clumping due to denaturation during pasteurization, changes in casein micelle leading to the release of casein molecules, and an increase in the solubility of casein in milk due to thermal pasteurization [31,32,33,34]. Further research is warranted to elucidate the effects of thermal pasteurization on casein content.
No significant difference was observed in the DPPH radical scavenging activity across all the samples, which aligns with previous findings [35,36]. DPPH radical scavenging activity is dependent on the milk composition and the concentration of antioxidants present in milk.
Fatty acid content, specifically omega-3, omega-6, and omega-9, was unaffected by thermal pasteurization and PEF methods relative to the control (Figure 7). These fatty acids are relatively stable and resistant to heat [37,38] Likewise, the cholesterol content was not affected by thermal pasteurization or PEF methods relative to the control. This can be attributed to the relative stability of cholesterol under heat treatment [39,40].
Glycomacropeptide (GMP), recognized for its probiotic, anti-inflammatory, immunomodulatory, and antimicrobial effects, as well as appetite regulation, is widely utilized in diverse nutritional and therapeutic applications [41,42,43,44,45,46,47,48,49,50,51,52,53,54,55,56]. In this research, we observed no discernible effects on GMP content in samples treated with thermal pasteurization and PEF relative to the control group. GMP typically exhibits thermal stability under standard thermal pasteurization conditions [57,58].
Histamine is typically found in trace amounts in raw milk, primarily due to the release from mast cells. Additionally, certain bacteria can produce this biogenic amine. Thermal pasteurization serves to eliminate histamine-producing bacteria, thus preventing an elevation in histamine levels that could potentially trigger intoxication [59,60,61,62,63]. Our research did not reveal a significant difference in histamine content (Figure 9) between thermally pasteurized, PEF-treated, and control samples. Interestingly, PEF treatment was found to maintain histamine levels on par with those in thermally treated milk.
We observed no significant differences in the content of fat-soluble vitamins A, D, and E across all treated samples compared to the control group. These vitamins generally exhibit stability under traditional pasteurization techniques. However, it is important to note that levels of water-soluble vitamins such as B1, B2, B12, and C have been reported to decrease following pasteurization [64,65,66].
In our previous article, we proposed the potential adoption of PEF in the manufacture of whey protein powder. To further investigate this, we tested the effects of various pasteurization techniques on raw liquid whey samples (Figure 13), including an additional thermal pasteurization method at 95 °C for 4 s for comparative purposes. PEF, HTST, LTLT, and MF treatments did not appear to affect β-lactoglobulin content compared to the control. However, heating samples at 95 °C resulted in a 4.8-fold reduction in β-lactoglobulin content. It has been shown that high temperatures used during spray-drying, a common method in whey protein powder production, reduce whey protein content including β-lactoglobulin concentration and diminishes the quality of whey protein powder by affecting its solubility, emulsification, and foaming properties. The temperatures employed in the spray-drying process of liquid whey often exceed those of LTLT, HTST and MF pasteurization, ranging from air inlet temperature of 150 °C to 260 °C and air outlet temperature of 60 °C to 120 °C [67,68,69,70].

4.2. Differences in Bacterial Inactivation

Successful inactivation of total coliform bacteria was achieved in all samples subjected to thermal pasteurization, with a recorded decrease in total bacteria colony forming units from 1.54 log to 2.36 log. In the case of samples treated with pulsed electric fields (PEFs), we observed a reduction in total bacteria by 0.13 log, with a more significant reduction of coliforms by 0.48 log when compared to the control liquid whey. The removal of curds from raw milk contributed significantly to the reduction in bacterial load, accounting for a decrease of up to 1.03 log in total bacteria and 1.13 log in coliforms. This effect can be linked to several processes that occur following the removal of curd from raw milk with rennet. No additional lactic acid bacteria were introduced to the liquid whey. Nevertheless, mesophilic lactic acid bacteria were detected in both the liquid whey samples and those treated with PEFs. A notable reduction of 1.54 log in mesophilic lactic acid bacteria was observed after treatment compared to the liquid whey control. Mesophilic lactic acid bacteria, naturally present in raw milk, have been identified as beneficial to human health due to their roles in nutrient absorption, immune function, and digestive processes. They have also been associated with effects on mental health [71,72,73,74,75,76]. The raw milk was not subjected to pasteurization prior to curd removal; only the liquid whey protein underwent pasteurization using various techniques. The PEF treatment may have effectively inactivated the majority of coliform bacteria, leading to the dominance of mesophilic lactic acid bacteria, which further contributed to the acidity of the liquid whey [77,78,79,80]. Given that coliforms tends to proliferate optimally at a pH range of 6 to 7.5 [81,82], the lower pH could potentially have inhibited bacterial growth [83,84]. Physical separation of whey from curds might also contribute to the reduction of coliform bacteria, as the curd, due to its retention of more moisture and nutrients compared to whey, is likely to harbor more bacteria.

4.3. PEF in Production of Liquid Whey Foods

In the context of whey protein product manufacture, the conventional methodology (Figure 14a) and a proposed method utilizing pulsed electric fields (PEFs) for liquid whey production (Figure 14b) were juxtaposed. The incorporation of a dual-stage PEF pasteurization process presents a potentially innovative and effective approach in the production line of liquid whey protein products. The initial stage necessitates PEF pasteurization of raw milk prior to the addition of rennet and inoculation. Given the non-thermal nature of PEF technology, there exists no requirement to cool the pasteurized milk before inoculation, as is custom in traditional whey protein powder production. This could feasibly facilitate a reduction in energy expenditure due to the elimination of the cooling process for lactic acid bacterial survivability. The secondary stage of PEF is suggested to be implemented subsequently to the ultrafiltration and diafiltration processes, thereby providing an additional layer of pasteurization and enhancing both the shelf life and safety of the product. In contrast, the traditional methodology involves several additional stages that are energy-intensive, such as evaporation and spray-drying. In the proposed PEF-based production of liquid whey, the principal energy-consuming stage post-ultrafiltration and diafiltration would be refrigeration, hence potentially offering substantial energy savings.

4.4. Potential Limitations of the Study

Several limitations are to be acknowledged in the present study. The content of whey protein in milk samples may exhibit variability due to factors such as seasonality and the nutritional composition of the cows’ feed. The BTX electroporator utilized in this study is constrained to a maximum voltage of 3 kV. By using cuvettes with a 0.1 cm-gap treatment chamber, we managed to increase the voltage to 24 kV/cm; however, this was the threshold beyond which electrical discharges started to occur. Consequently, the impact of higher voltages on bacterial inactivation was not investigated.
The bacterial load of the raw milk could also differ depending on the refrigeration and storage conditions, introducing another potential source of variability. Furthermore, the UHT pasteurization technique could not be reproduced in our laboratory setting. As a result, we were unable to replicate all the pasteurization techniques commonly employed in the dairy industry, limiting our capacity to assess their respective impacts on the nutritional properties of raw milk.
Additionally, only the thermal pasteurization techniques used in this study were based on parameters used in the dairy industry. We did not take into account the potential effects of other processing stages such as creaming, homogenization, and refrigeration that are typically part of an industrial-scale processing line. This could potentially limit the generalizability of our findings to real-world industrial processes.

5. Conclusions

This study has demonstrated that a significant reduction in coliforms, specifically by 1.6 log, can be achieved by employing curd reduction and PEF treatments compared to raw milk. It was observed that thermal pasteurization completely inactivated all coliform bacteria as well as mesophilic lactic acid bacteria. In contrast, PEF treatment resulted in a significant decrease in coliform bacteria, while mesophilic lactic acid bacteria were affected to a much less extent. Interestingly, β-lactoglobulin content in samples subjected to PEF, LTLT, HTST, and MF treatments remained comparable to those found in raw milk and the liquid whey control. However, heating to 95 °C for 4 s resulted in a substantial decrease in β-lactoglobulin content in liquid whey samples. Notably, the content of amino acids, cholesterol, omega 3, 6, and 9 fatty acids, glycomacropeptide (GMP), and vitamins A, D, and E after PEF treatment remained consistent with control levels across all samples treated with LTLT, HTST, and MF. Similarly, PEF treatment did not affect the DPPH radical scavenging activity or histamine content, and these remained at similar levels as found in thermally treated milk.

Author Contributions

Conceptualization, A.Š. and S.Š.; methodology, P.R.; software, D.U.; validation, A.Š., P.R. and S.Š.; formal analysis, D.U.; investigation, A.Š.; resources, A.Š.; data curation, M.V.; writing—original draft preparation, A.Š.; writing—review and editing, A.Š.; visualization, M.V.; supervision, S.Š.; project administration, A.Š.; funding acquisition, S.Š. All authors have read and agreed to the published version of the manuscript.

Funding

This project has received funding from the Research Council of Lithuania (LMTLT), agreement No. S-PD-22-41.

Institutional Review Board Statement

Not applicable.

Informed Consent Statement

Not applicable.

Data Availability Statement

Data is contained within the article.

Acknowledgments

The authors thank the Food Institute of the Kaunas University of Technology for technological support.

Conflicts of Interest

The authors declare no conflict of interest.

References

  1. Trung, N.D.; Hoang, N.N.; Hieu, D.M. Pulsed Electric Field for Pasteurization of Fresh Sugarcane Juice. ASEAN Eng. J. 2018, 8, 27–35. [Google Scholar] [CrossRef]
  2. Aguilar-Rosas, S.; Ballinas-Casarrubias, M.; Nevarez-Moorillon, G.; Martin-Belloso, O.; Ortega-Rivas, E. Thermal and pulsed electric fields pasteurization of apple juice: Effects on physicochemical properties and flavour compounds. J. Food Eng. 2007, 83, 41–46. [Google Scholar] [CrossRef]
  3. Saldaña, G.; Puértolas, E.; Monfort, S.; Raso, J.; Álvarez, I. Defining treatment conditions for pulsed electric field pasteurization of apple juice. Int. J. Food Microbiol. 2011, 151, 29–35. [Google Scholar] [CrossRef] [PubMed]
  4. Alami Milani, E.; Alkhafaji, S.; Silva, F. Pulsed Electric Field continuous pasteurization of different types of beers. Food Control 2015, 50, 223–229. [Google Scholar] [CrossRef]
  5. Charles-Rodríguez, A.; Nevárez-Moorillón, G.; Zhang, Q.; Ortega-Rivas, E. Comparison of Thermal Processing and Pulsed Electric Fields Treatment in Pasteurization of Apple Juice. Food Bioprod. Process. 2007, 85, 93–97. [Google Scholar] [CrossRef]
  6. Lee, S.J.; Choi, H.J.; Min, S.C. Pulsed electric field pasteurization of Mandarin and carrot juices. Korean J. Food Sci. Technol. 2017, 49, 408–414. [Google Scholar] [CrossRef]
  7. Hariono, B.; Brilliantina, A.; Sari, E.K.N.; Kurnianto, M.; Erawantini, F.; Supriyono; Kautsar, S. Pulsed electric field application on pasteurization of orange milk from low grade orange: Study on nutritional, physical, chemical properties, and total microorganism. IOP Conf. Ser. Earth Environ. Sci. 2022, 980, 012041. [Google Scholar] [CrossRef]
  8. Rios-Corripio, G.; la Peña, M.M.-D.; Welti-Chanes, J.; Guerrero-Beltrán, J. Pulsed electric field processing of a pomegranate (Punica granatum L.) fermented beverage. Innov. Food Sci. Emerg. Technol. 2022, 79, 103045. [Google Scholar] [CrossRef]
  9. Eshtiaghi, M.N.; Nakthong, N. Application of Pulsed Electric Field for Inactivation of Yeast S. cerevisiae in Apple Juice. J. Phys. Conf. Ser. 2021, 1893, 012008. [Google Scholar] [CrossRef]
  10. Preeti, B.; Ravindra, M.R.; Nath, B.S.; Panditrao, D.G. Impact of pulsed electric field treated milk on quality of paneer and khoa. Food Sci. Technol. Int. 2022, 29, 598–609. [Google Scholar] [CrossRef]
  11. Yiğit, A.; Bielska, P.; Cais-Sokolińska, D.; Samur, G. Whey proteins as a functional food: Health effects, functional properties, and applications in food. J. Am. Nutr. Assoc. 2023, 42, 758–768. [Google Scholar] [CrossRef] [PubMed]
  12. Dissanayake, M.; Vasiljevic, T. Functional properties of whey proteins affected by heat treatment and hydrodynamic high-pressure shearing. J. Dairy Sci. 2009, 92, 1387–1397. [Google Scholar] [CrossRef] [PubMed]
  13. Mezzenga, R.; Fischer, P. The self-assembly, aggregation and phase transitions of food protein systems in one, two and three dimensions. Rep. Prog. Phys. 2013, 76, 046601. [Google Scholar] [CrossRef] [PubMed]
  14. Wijayanti, H.B.; Bansal, N.; Deeth, H.C. Stability of Whey Proteins during Thermal Processing: A Review. Compr. Rev. Food Sci. Food Saf. 2014, 13, 1235–1251. [Google Scholar] [CrossRef]
  15. Anema, S.G. The whey proteins in milk: Thermal denaturation, physical interactions and effects on the functional properties of milk. In Milk Proteins: From Expression to Food; Academic Press: Cambridge, MA, USA, 2008. [Google Scholar]
  16. Bull, S.P.; Hong, Y.; Khutoryanskiy, V.V.; Parker, J.K.; Faka, M.; Methven, L. Whey protein mouth drying influenced by thermal denaturation. Food Qual. Prefer. 2016, 56, 233–240. [Google Scholar] [CrossRef]
  17. Zhao, X.; Guo, Y.; Zhang, Y.; Pang, X.; Wang, Y.; Lv, J.; Zhang, S. Effects of different heat treatments on Maillard reaction products and volatile substances of camel milk. Front. Nutr. 2023, 10, 1072261. [Google Scholar] [CrossRef]
  18. Luis, R.D.; Arias, O.; Puertolas, E.; Benede, S.; Sanchez, L.; Calvo, M.; Perez, M.D. Effect of high—Intensity pulse electric fields on denaturation of bovine whey proteins. Milchwissenschaft 2009, 64, 422–426. [Google Scholar]
  19. Shamsi, K.; Sherkat, F. Application of pulsed electric field in non-thermal processing of milk. Asian J. Food Agro-Ind. 2011, 2, 216–244. [Google Scholar]
  20. Griffiths, M.W.; Walkling-Ribeiro, M. Pulsed Electric Field Processing of Liquid Foods and Beverages, 2nd ed.; Elsevier Ltd.: Amsterdam, The Netherlands, 2014. [Google Scholar]
  21. Toepfl, S.; Mathys, A.; Heinz, V.; Knorr, D. Review: Potential of High Hydrostatic Pressure and Pulsed Electric Fields for Energy Efficient and Environmentally Friendly Food Processing. Food Rev. Int. 2006, 22, 405–423. [Google Scholar] [CrossRef]
  22. Raso, J.; Frey, W.; Ferrari, G.; Pataro, G.; Knorr, D.; Teissie, J.; Miklavčič, D. Recommendations guidelines on the key information to be reported in studies of application of PEF technology in food and biotechnological processes. Innov. Food Sci. Emerg. Technol. 2016, 37, 312–321. [Google Scholar] [CrossRef]
  23. Marino, R.; Iammarino, M.; Santillo, A.; Muscarella, M.; Caroprese, M.; Albenzio, M. Technical note: Rapid method for determination of amino acids in milk. J. Dairy Sci. 2010, 93, 2367–2370. [Google Scholar] [CrossRef] [PubMed]
  24. Brand-Williams, W.; Cuvelier, M.E.; Berset, C. Use of a free radical method to evaluate antioxidant activity. LWT Food Sci. Technol. 1995, 28, 25–30. [Google Scholar] [CrossRef]
  25. Liang, M.; Chen, V.Y.; Chen, H.-L.; Chen, W. A simple and direct isolation of whey components from raw milk by gel filtration chromatography and structural characterization by Fourier transform Raman spectroscopy. Talanta 2006, 69, 1269–1277. [Google Scholar] [CrossRef] [PubMed]
  26. Hong, P.; Koza, S.; Bouvier, E.S.P. A review size-exclusion chromatography for the analysis of protein biotherapeutics and their aggregates. J. Liq. Chromatogr. Relat. Technol. 2012, 35, 2923–2950. [Google Scholar] [CrossRef] [PubMed]
  27. Šalaševičius, A.; Uždavinytė, D.; Visockis, M.; Ruzgys, P.; Šatkauskas, S. Effect of pulsed electric field (Pef) on bacterial viability and whey protein in the processing of raw milk. Appl. Sci. 2021, 11, 11281. [Google Scholar] [CrossRef]
  28. Fox, P.F.; Uniacke-Lowe, T.; McSweeney, P.L.H.; O’Mahony, J.A. Heat-induced changes in milk. In Dairy Chemistry and Biochemistry; Springer: Cham, Switzerland, 2015; pp. 345–375. [Google Scholar]
  29. Aboshama, K.; Hansen, A. Effect of ultra-high-temperature steam injection processing on sulfur-containing amino acids in milk. J. Dairy Sci. 1977, 60, 1374–1378. [Google Scholar] [CrossRef]
  30. Broersen, K. Milk Processing Affects Structure, Bioavailability and Immunogenicity of β-lactoglobulin. Foods 2020, 9, 874. [Google Scholar] [CrossRef]
  31. Krishna, T.C.; Najda, A.; Bains, A.; Tosif, M.M.; Papliński, R.; Kapłan, M.; Chawla, P. Influence of ultra-heat treatment on properties of milk proteins. Polymers 2021, 13, 3164. [Google Scholar] [CrossRef]
  32. Čurlej, J.; Zajác, P.; Čapla, J.; Golian, J.; Benešová, L.; Partika, A.; Fehér, A.; Jakabová, S. The Effect of Heat Treatment on Cow’s Milk Protein Profiles. Foods 2022, 11, 1023. [Google Scholar] [CrossRef]
  33. Walstra, P. On the Stability of Casein Micelles. J. Dairy Sci. 1990, 73, 1965–1979. [Google Scholar] [CrossRef]
  34. Anema, S.G. Heat-induced changes in caseins and casein micelles, including interactions with denatured whey proteins. Int. Dairy J. 2021, 122, 105136. [Google Scholar] [CrossRef]
  35. El-Fattah, A.A.; Azzam, M.; Elkashef, H.; Elhadydy, A. Antioxidant properties of milk: Effect of milk species, milk fractions and heat treatments. Int. J. Dairy Sci. 2019, 15, 1–9. [Google Scholar] [CrossRef]
  36. Khan, I.T.; Nadeem, M.; Imran, M.; Ayaz, M.; Ajmal, M.; Ellahi, M.Y.; Khalique, A. Antioxidant capacity and fatty acids characterization of heat treated cow and buffalo milk. Lipids Heal. Dis. 2017, 16, 163. [Google Scholar] [CrossRef] [PubMed]
  37. Dias, F.F.G.; Augusto-Obara, T.R.; Hennebelle, M.; Chantieng, S.; Ozturk, G.; Taha, A.Y.; Vieira, T.M.F.d.S.; Bell, J.M.L.N.d.M. Effects of industrial heat treatments on bovine milk oxylipins and conventional markers of lipid oxidation. Prostaglandins, Leukot. Essent. Fat. Acids 2020, 152, 102040. [Google Scholar] [CrossRef]
  38. Pestana, J.M.; Gennari, A.; Monteiro, B.W.; Lehn, D.N.; Souza, C.F.V. Effects of pasteurization and ultra-high temperature processes on proximate composition and fatty acid profile in bovine milk. Am. J. Food Technol. 2015, 10, 265–272. [Google Scholar] [CrossRef]
  39. Paniangvait, P.; King, A.; Jones, A.; German, B. Cholesterol Oxides in Foods of Animal Origin. J. Food Sci. 1995, 60, 1159–1174. [Google Scholar] [CrossRef]
  40. Sieber, R. Oxidised cholesterol in milk and dairy products. Int. Dairy J. 2005, 15, 191–206. [Google Scholar] [CrossRef]
  41. Kawasaki, Y.; Isoda, H.; Tanimoto, M.; Dosako, S.I.; Idota, T.; Ahiko, K. Inhibition by lactoferrin and κ-casein glycomacropeptide of binding of cholera toxin to its receptor. Biosci. Biotechnol. Biochem. 1992, 56, 195–198. [Google Scholar] [CrossRef]
  42. Aimutis, W.R. Bioactive properties of milk proteins with particular focus on anticariogenesis. J. Nutr. 2004, 134, 989S–995S. [Google Scholar] [CrossRef]
  43. Sawin, E.A.; Murali, S.G.; Ney, D.M. Differential effects of low-phenylalanine protein sources on brain neurotransmitters and behavior in C57Bl/6-Pahenu2 mice. Mol. Genet. Metab. 2014, 111, 452–461. [Google Scholar] [CrossRef]
  44. Requena, P.; Daddaoua, A.; Martínez-Plata, E.; González, M.; Zarzuelo, A.; Suárez, M.D.; Sánchez de Medina, F.; Martínez-Augustin, O. Bovine glycomacropeptide ameliorates experimental rat ileitis by mechanisms involving downregu-lation of interleukin 17. Br. J. Pharmacol. 2008, 154, 825–832. [Google Scholar] [CrossRef] [PubMed]
  45. Requena, P.; Daddaoua, A.; Guadix, E.; Zarzuelo, A.; Suárez, M.D.; de Medina, F.S.; Martínez-Augustin, O. Bovine glycomacropeptide induces cytokine production in human monocytes through the stimulation of the MAPK and the NF-κB signal transduction pathways. Br. J. Pharmacol. 2009, 157, 1232–1240. [Google Scholar] [CrossRef] [PubMed]
  46. Ortega-González, M.; Capitán-Cañadas, F.; Requena, P.; Ocón, B.; Romero-Calvo, I.; Aranda, C.; Suárez, M.D.; Zarzuelo, A.; De Medina, F.S.; Martínez-Augustin, O. Validation of bovine glycomacropeptide as an intestinal anti-inflammatory nutraceutical in the lymphocyte-transfer model of colitis. Br. J. Nutr. 2014, 111, 1202–1212. [Google Scholar] [CrossRef]
  47. Ney, D.M.; Blank, R.D.; Hansen, K.E. Advances in the nutritional and pharmacological management of phenylketonuria. Curr. Opin. Clin. Nutr. Metab. Care 2014, 17, 61. [Google Scholar] [CrossRef] [PubMed]
  48. Poppitt, S.D.; Strik, C.M.; McArdle, B.H.; McGill, A.-T.; Hall, R.S. Evidence of enhanced serum amino acid profile but not appetite suppression by dietary glycomacropeptide (GMP): A comparison of dairy whey proteins. J. Am. Coll. Nutr. 2013, 32, 177–186. [Google Scholar] [CrossRef]
  49. Daddaoua, A.; Puerta, V.; Zarzuelo, A.; Suárez, M.D.; Sánchez de Medina, F.; Martínez-Augustin, O. Bovine glycomacropeptide is anti-inflammatory in rats with hapten-induced colitis. J. Nutr. 2005, 135, 1164–1170. [Google Scholar] [CrossRef] [PubMed]
  50. Beucher, S.; Levenez, F.; Yvon, M.; Corring, T. Effects of gastric digestive products from casein on CCK release by intestinal cells in rat. J. Nutr. Biochem. 1994, 5, 578–584. [Google Scholar] [CrossRef]
  51. de Medina, F.S.; Daddaoua, A.; Requena, P.; Capitán-Cañadas, F.; Zarzuelo, A.; Suárez, M.D.; Martínez-Augustin, O. New insights into the immunological effects of food bioactive peptides in animal models of intestinal inflammation. Proc. Nutr. Soc. 2010, 69, 454–462. [Google Scholar] [CrossRef]
  52. Brody, E.P. Biological activities of bovine glycomacropeptide. Br. J. Nutr. 2000, 84 (Suppl. S1), 39–46. [Google Scholar] [CrossRef]
  53. Veldhorst, M.A.; Nieuwenhuizen, A.G.; Hochstenbach-Waelen, A.; Westerterp, K.R.; Engelen, M.P.; Brummer, R.-J.M.; Deutz, N.E.; Westerterp-Plantenga, M.S. Effects of complete whey-protein breakfasts versus whey without GMP-breakfasts on energy intake and satiety. Appetite 2009, 52, 388–395. [Google Scholar] [CrossRef]
  54. Van Calcar, S.C.; Ney, D.M. Food products made with glycomacropeptide, a low-phenylalanine whey protein, provide a new alternative to amino acid–based medical foods for nutrition management of phenylketonuria. J. Acad. Nutr. Diet. 2012, 112, 1201–1210. [Google Scholar] [CrossRef] [PubMed]
  55. Solverson, P.; Murali, S.G.; Litscher, S.J.; Blank, R.D.; Ney, D.M. Low bone strength is a manifestation of phenylketonuria in mice and is attenuated by a glycomacropeptide diet. PLoS ONE 2012, 7, e45165. [Google Scholar] [CrossRef] [PubMed]
  56. Solverson, P.; Murali, S.G.; Brinkman, A.S.; Nelson, D.W.; Clayton, M.K.; Yen, C.-L.E.; Ney, D.M. Glycomacropeptide, a low-phenylalanine protein isolated from cheese whey, supports growth and attenuates metabolic stress in the murine model of phenylketonuria. Am. J. Physiol. Metab. 2012, 302, E885–E895. [Google Scholar] [CrossRef] [PubMed]
  57. Wagoner, T.B.; Ward, L.; Foegeding, E.A. Using state diagrams for predicting colloidal stability of whey protein beverages. J. Agric. Food Chem. 2015, 63, 4335–4344. [Google Scholar] [CrossRef] [PubMed]
  58. Neelima; Sharma, R.; Rajput, Y.S.; Mann, B. Chemical and functional properties of glycomacropeptide (GMP) and its role in the detection of cheese whey adulteration in milk: A review. Dairy Sci. Technol. 2013, 93, 21–43. [Google Scholar] [CrossRef]
  59. Linares, D.M.; Del Río, B.; Ladero, V.; Martínez, N.; Fernández, M.; Martín, M.C.; Álvarez, M.A. Factors influencing biogenic amines accumulation in dairy products. Front. Microbiol. 2012, 3, 180. [Google Scholar] [CrossRef]
  60. Barbieri, F.; Montanari, C.; Gardini, F.; Tabanelli, G. Biogenic amine production by lactic acid bacteria: A review. Foods 2019, 8, 17. [Google Scholar] [CrossRef]
  61. Abbring, S.; Blokhuis, B.R.J.; Miltenburg, J.L.; Olmedo, K.G.J.R.; Garssen, J.; Redegeld, F.A.; van Esch, B.C.A.M. Direct Inhibition of the Allergic Effector Response by Raw Cow’s Milk—An Extensive In Vitro Assessment. Cells 2020, 9, 1258. [Google Scholar] [CrossRef]
  62. Moniente, M.; García-Gonzalo, D.; Ontañón, I.; Pagán, R.; Botello-Morte, L. Histamine accumulation in dairy products: Microbial causes, techniques for the detection of histamine-producing microbiota, and potential solutions. Compr. Rev. Food Sci. Food Saf. 2021, 20, 1481–1523. [Google Scholar] [CrossRef]
  63. Chang, G.; Wang, L.; Ma, N.; Zhang, W.; Zhang, H.; Dai, H.; Shen, X. Histamine activates inflammatory response and depresses casein synthesis in mammary gland of dairy cows during SARA. BMC Vet. Res. 2018, 14, 168. [Google Scholar] [CrossRef]
  64. Claeys, W.L.; Cardoen, S.; Daube, G.; De Block, J.; Dewettinck, K.; Dierick, K.; De Zutter, L.; Huyghebaert, A.; Imberechts, H.; Thiange, P.; et al. Raw or heated cow milk consumption: Review of risks and benefits. Food Control. 2013, 31, 251–262. [Google Scholar] [CrossRef]
  65. Asadullah; Nisa, K.U.; Tarar, O.M.; Ali, S.A.; Jamil, K.; Begum, A. Study to evaluate the impact of heat treatment on water soluble vitamins in milk. J. Pak. Med. Assoc. 2010, 60, 909–912. [Google Scholar] [PubMed]
  66. Melini, F.; Melini, V.; Luziatelli, F.; Ruzzi, M. Raw and Heat-Treated Milk: From Public Health Risks to Nutritional Quality. Beverages 2017, 3, 54. [Google Scholar] [CrossRef]
  67. Anandharamakrishnan, C.; Rielly, C.; Stapley, A. Loss of solubility of α-lactalbumin and β-lactoglobulin during the spray drying of whey proteins. LWT 2008, 41, 270–277. [Google Scholar] [CrossRef]
  68. Bernard, C.; Regnault, S.; Gendreau, S.; Charbonneau, S.; Relkin, P. Enhancement of emulsifying properties of whey proteins by controlling spray-drying parameters. Food Hydrocoll. 2011, 25, 758–763. [Google Scholar] [CrossRef]
  69. Chegini, G.; HamidiSepehr, A.; Dizaji, M.F.; Mirnezami, S.V. Study of physical and chemical properties of spray drying whey powder. Int. J. Recycl. Org. Waste Agric. 2014, 3, 62. [Google Scholar] [CrossRef]
  70. Haque, M.A.; Adhikari, B. Proteins in Spray Drying Process. Handb. Ind. Dry. 2015, 2015, 971–983. [Google Scholar]
  71. Perdigón, G.; Fuller, R.; Raya, R. Lactic acid bacteria and their effect on the immune system. Curr. Issues Intest. Microbiol. 2001, 2, 27–42. [Google Scholar]
  72. Saeed, A.H.; Salam, A.I. Current limitations and challenges with lactic acid bacteria: A review. Food Nutr. Sci. 2013, 2013, 73–87. Available online: http://file.scirp.org/Html/10-2700895_40133.htm (accessed on 5 March 2023).
  73. Gilliland, S.E. Health and nutritional benefits from lactic acid bacteria. FEMS Microbiol. Lett. 1990, 87, 175–188. [Google Scholar] [CrossRef]
  74. Wei, F.; Zhou, L.; Wang, Q.; Zheng, G.; Su, S. Effect of Compound Lactic Acid Bacteria Capsules on the Small Intestinal Bacterial Overgrowth in Patients with Depression and Diabetes: A Blinded Randomized Controlled Clinical Trial. Dis. Markers 2022, 2022, 1–6. [Google Scholar] [CrossRef]
  75. Kato, Y.; Shimomura, Y.; Takada, Y.; Furuyashiki, T. Correlation Between Lactic Acid Bacteria Beverage Intake and Stress Resilience. Kobe J. Med. Sci. 2021, 67, E1–E6. [Google Scholar]
  76. Naidu, A.S.; Bidlack, W.R.; Clemens, R.A. Critical Reviews in Food Science and Nutrition Probiotic Spectra of Lactic Acid Bacteria (LAB). Crit. Rev. Food Sci. Nutr. 2010, 38, 37–41. [Google Scholar]
  77. Charlier, C.; Cretenet, M.; Even, S.; Le Loir, Y. Interactions between Staphylococcus aureus and lactic acid bacteria: An old story with new perspectives. Int. J. Food Microbiol. 2009, 131, 30–39. [Google Scholar] [CrossRef] [PubMed]
  78. Medved’ová, A.; Koňuchová, M.; Kvočiková, K.; Hatalová, I.; Valík, L. Effect of Lactic Acid Bacteria Addition on the Microbiological Safety of Pasta-Filata Types of Cheeses. Front. Microbiol. 2020, 11, 612528. [Google Scholar] [CrossRef] [PubMed]
  79. Wouters, J.T.M.; Ayad, E.H.E.; Hugenholtz, J.; Smit, G. Microbes from raw milk for fermented dairy products. Int. Dairy J. 2001, 12, 91–109. [Google Scholar] [CrossRef]
  80. Adegbehingbe, K.T.; Bello, M. Antibacterial activities of fermented whey on some selected enteropathogenic bacteria. Int. J. Curr. Microbiol. Appl. Sci. 2014, 3, 152–161. [Google Scholar]
  81. Tuttle, A.R.; Trahan, N.D.; Son, M.S. Growth and Maintenance of Escherichia coli Laboratory Strains. Curr. Protoc. 2021, 1, e20. [Google Scholar] [CrossRef] [PubMed]
  82. Elbing, K.L.; Brent, R. Recipes and Tools for Culture of Escherichia coli. Curr. Protoc. Mol. Biol. 2019, 125, e83. [Google Scholar] [CrossRef]
  83. Kim, C.; Wilkins, K.; Bowers, M.; Wynn, C.; Ndegwa, E. Influence of PH and Temperature on Growth Characteristics of Leading Foodborne Pathogens in a Laboratory Medium and Select Food Beverages. Austin Food Sci. 2018, 3, 1–8. Available online: https://vtechworks.lib.vt.edu/bitstream/handle/10919/81940/afs-v3-id1031_Bacterial%20growth%20curve.pdf (accessed on 15 March 2023).
  84. Hervert, C.; Martin, N.; Boor, K.; Wiedmann, M. Survival and detection of coliforms, Enterobacteriaceae, and gram-negative bacteria in Greek yogurt. J. Dairy Sci. 2017, 100, 950–960. [Google Scholar] [CrossRef] [PubMed]
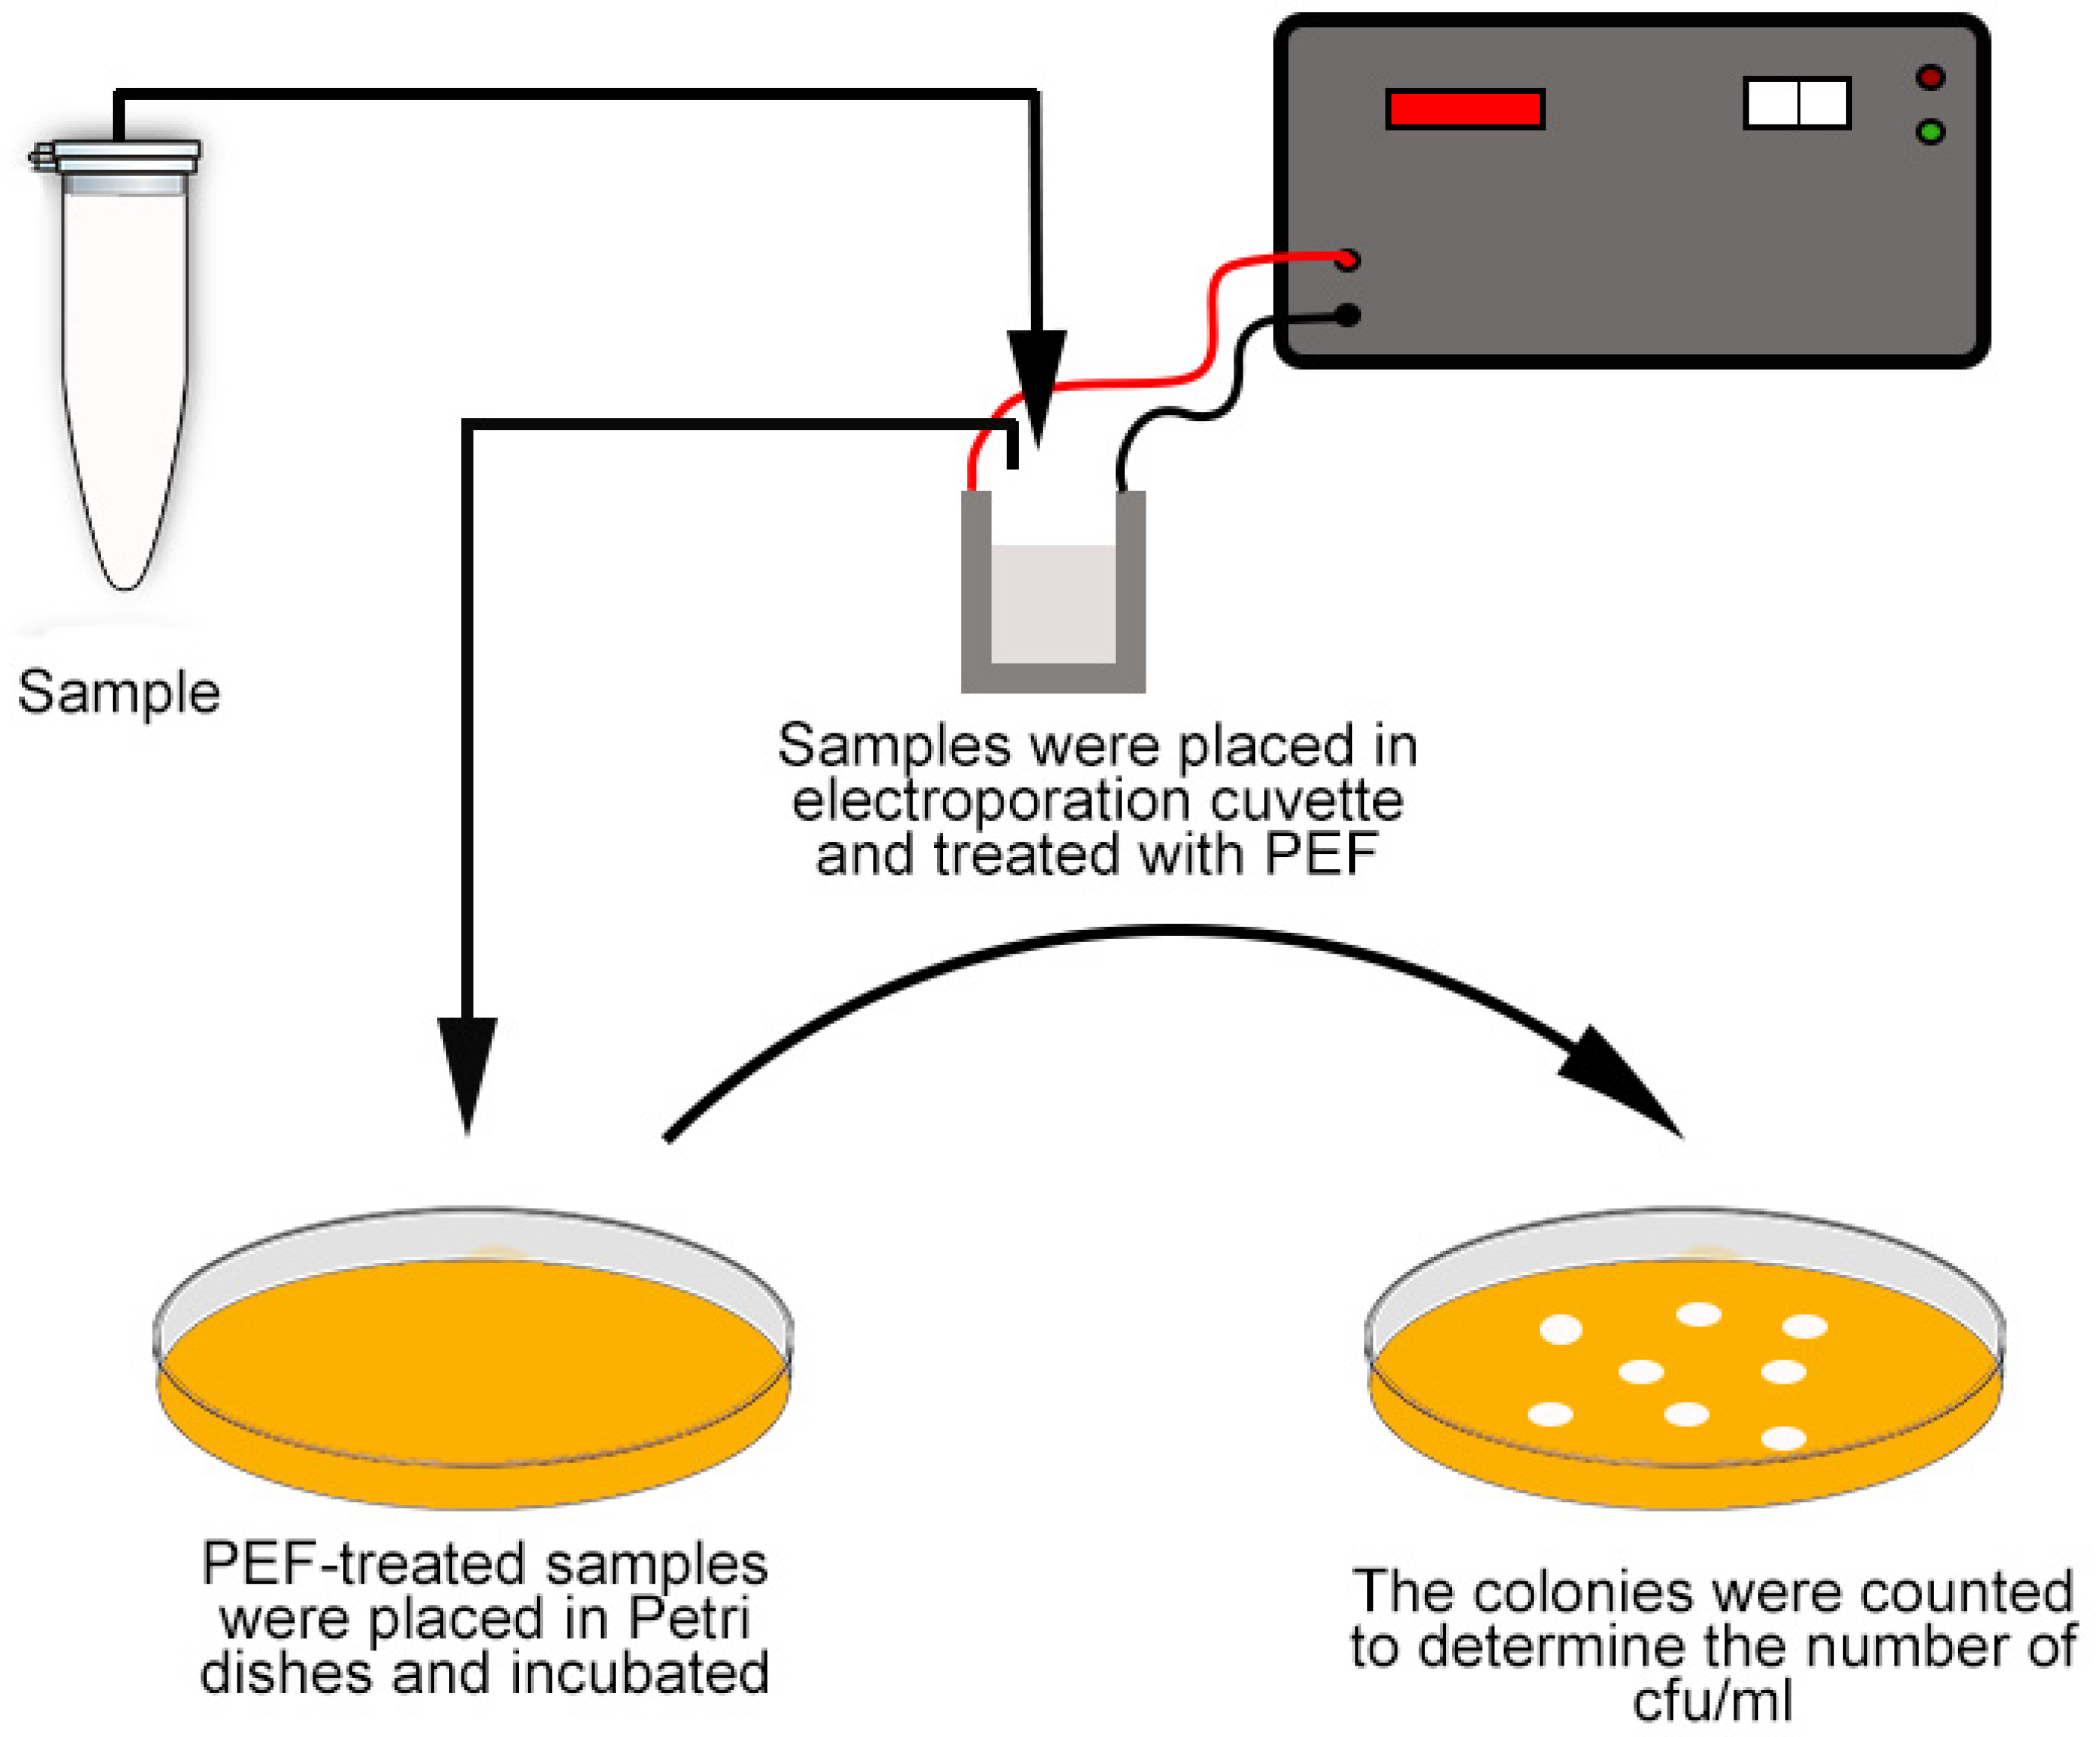
Figure 1. Schematic representation of the experimental setup employed to assess the impact of PEF treatment on bacterial viability in liquid whey samples.
Applsci 13 12127 g001
Figure 2. Amino acid content in milk samples treated with different pasteurization techniques: control (raw milk); PEF—pulsed electric field; MF—microfiltration; LTLT—low temperature, long time; HTST—high temperature, short time.
Applsci 13 12127 g002
Figure 3. β-lactoglobulin content in milk samples subjected to various pasteurization methods: C—raw milk (control); PEF—pulsed electric field; MF—microfiltration; LTLT—low temperature, long time; HTST—high temperature, short time.
Applsci 13 12127 g003
Figure 4. α-Casein, β-casein, and κ-casein content in milk samples subjected to various pasteurization methods: Control (raw milk); PEF—pulsed electric field; MF—microfiltration; LTLT—low temperature, long time; HTST—high temperature, short time. Statistically significant differences between samples are denoted by distinct lowercase letters, with a significance level of p < 0.05.
Applsci 13 12127 g004
Figure 5. Cholesterol content in milk samples subjected to various pasteurization methods: RM—raw milk (control); PEF—pulsed electric field; MF—microfiltration; LTLT—low temperature, long time; HTST—high temperature, short time.
Applsci 13 12127 g005
Figure 6. DPPH radical scavenging activity, expressed as a percentage, across various pasteurization methods: RM—raw milk (control); PEF—pulsed electric field; MF—microfiltration; LTLT—low temperature, long time; HTST—high temperature, short time.
Applsci 13 12127 g006
Figure 7. Fatty acid content (% of total fatty acid) in milk samples subjected to various pasteurization methods: Control (raw milk); PEF—pulsed electric field; MF—microfiltration; LTLT—low temperature, long time; HTST—high temperature, short time.
Applsci 13 12127 g007
Figure 8. Glycomacropeptide (GMP) content in milk samples subjected to various pasteurization methods: C—raw milk (control); PEF—pulsed electric field; MF—microfiltration; LTLT—low temperature, long time; HTST—high temperature, short time.
Applsci 13 12127 g008
Figure 9. Histamine content in milk samples subjected to various pasteurization methods: C—raw milk (control); PEF—pulsed electric field; MF—microfiltration; LTLT—low temperature, long time; HTST—high temperature, short time.
Applsci 13 12127 g009
Figure 10. Vitamin A content in milk samples subjected to various pasteurization methods: C—raw milk (control); PEF—pulsed electric field; MF—microfiltration; LTLT—low- temperature, long time; HTST—high temperature, short time.
Applsci 13 12127 g010
Figure 11. Vitamin D content in milk samples subjected to various pasteurization methods: C—raw milk (control); PEF—pulsed electric field; MF—microfiltration; LTLT—low temperature, long time; HTST—high temperature, short time.
Applsci 13 12127 g011
Figure 12. Vitamin E content in milk samples subjected to various pasteurization methods: C—raw milk (control); PEF—pulsed electric field; MF—microfiltration; LTLT—low temperature, long time; HTST—high temperature, short time.
Applsci 13 12127 g012
Figure 13. β-lactoglobulin content in whey samples subjected to various pasteurization methods: RM—raw milk (control); RWC—raw whey control; PEF—pulsed electric field; HT—high temperature; HTST—high temperature, short-time; LTLT—low temperature, long time; MF—microfiltration. Statistically significant differences between samples are denoted by distinct lowercase letters, with a significance level of p < 0.05.
Applsci 13 12127 g013
Figure 14. Standard production method of whey protein powder (a) and a novel method for producing liquid whey protein using PEFs (b).
Applsci 13 12127 g014
Table 1. Comparison of colony forming units (CFUs) of total bacteria and mesophilic lactic acid bacteria in samples subjected to different pasteurization techniques.
No.Milk SamplesTotal Number of Bacteria Found in Samples, CFU/mL Coliform Bacteria, CFU/mL Mesophilic Lactic Acid Bacteria CFU/mL
MeanSDMeanSDMeanSD
1.RM9 × 104 a1.5 × 1031.6 × 102 a21--
2.RWC8.3 × 103 b3.6 × 10212 b25.5 × 103 a1.5 × 10 2
3.PEF6.2 × 103 c1 × 102<4-1.6 × 10² b17
4.HT<1-<1-<1-
5.HTST2.4 × 102 d34<1-<1-
6.LTLT7 × 102 d92<1-<1-
7.MF36 d8<1-<1-
RM (raw milk, control), RWC (raw liquid whey, control), PEF (pulsed electric field), HT (high temperature), LTLT (low temperature, long time), HTST (high temperature, short time), MF (microfiltration). Samples were incubated on agar plates for 24 h at 37 °C. Data are presented as mean ± standard deviation (SD). The experiments were performed in three independent replicates (n = 3). Statistically significant differences between samples are denoted by distinct lowercase letters in the same column, with a significance level of p < 0.05.
Disclaimer/Publisher’s Note: The statements, opinions and data contained in all publications are solely those of the individual author(s) and contributor(s) and not of MDPI and/or the editor(s). MDPI and/or the editor(s) disclaim responsibility for any injury to people or property resulting from any ideas, methods, instructions or products referred to in the content.