Abstract
Due to their flexible deployment and movement capability, unmanned aerial vehicles (UAVs) are being utilized as flying mobile edge computing (MEC) platforms, offering real-time computational resources and low-latency data processing for a wide range of applications. This article aims to explore a UAV-assisted MEC system where multiple UAVs provide MEC services to mobile devices (MDs) using an ellipsoidal trajectory. Depending on the position, size, and orientation of the ellipsoidal trajectories, the coverage area of the UAV, the energy consumption, and the task transmission latency of MDs change. This has rarely been investigated in the existing works. Furthermore, unlike other studies, we consider that each MD has varying task offloading rates, which, together with varying user densities, makes the problem more challenging. Therefore, we formulate an optimization problem that finds the center position, major radius, minor radius, and rotation angle of the ellipsoidal trajectory of UAV-assisted MEC servers, to minimize the total transmission latency and energy consumption of mobile devices while taking into account the required data transmission rate, task transmission time, and energy consumption constraints. Then, we transform this optimization problem into a Markov decision process and propose a deep Q-learning-based ellipsoidal trajectory optimization (DETO) algorithm, to resolve it. The results from our simulations demonstrate that DETO efficiently computes the optimal position and trajectory for each UAV, and can achieve better performance compared to other baselines, leading to the reduced data transmission latency and energy consumption of mobile devices across a range of simulation scenarios.
1. Introduction
Recent technological advancements and the widespread adoption of smart devices have given rise to a plethora of innovative applications, including augmented reality (AR) [1], virtual reality (VR) [2], automatic driving [3], real-time video analytics [4], and mobile online gaming [5], which are complex, computationally intensive, and highly energy demanding [6]. Despite being equipped with advanced computation and communication technology, smart devices or mobile devices (MDs) have limitations, in terms of energy resources, computational power, and memory [7]. These constraints constitute a significant challenge for processing computation-intensive and time-sensitive applications in MDs [8].
An effective strategy is to transfer computation-intensive tasks from these resource-constrained devices to devices with a more powerful computational capacity, i.e., mobile edge computing (MEC) servers that are situated at the network’s edge [9,10,11]. This strategy enables faster processing of data. By transferring the computation-intensive tasks to MEC servers, MDs can reduce the burden of handling resource-intensive computations. They can instead concentrate on carrying out lightweight operations. As a result, this strategy not only increases overall system capability while consuming less energy but also extends the battery life of the MDs [12].
Even though MEC offers several advantages, it is imperative to consider the delay introduced by the physical distance between MDs and MEC servers [13,14], especially in time-sensitive applications (e.g., AR and VR). In the context of AR and VR applications, even minor delays can impede the seamless integration of the virtual and physical worlds, ultimately affecting user engagement and overall experience. Moreover, during crowded events or festivals, offloading tasks to MEC servers becomes challenging, due to increased network congestion and reduced resource capacity. It is also difficult to establish a connection that is reliable between MDs and MEC servers because of the increased user activity. Therefore, unmanned aerial vehicles (UAVs) equipped with MEC (UAV–MEC) servers can be employed as a potential solution, to provide communication and computation services to the MDs [15,16,17,18]. Deploying UAVs near MDs significantly reduces data processing time, making them suitable for time-sensitive applications that require real-time analysis. UAVs can adapt their position and coverage based on user density and location, ensuring better service quality. Moreover, they establish direct communication links with MDs. The performance of the MEC system is, therefore, expected to be significantly enhanced by the deployment of UAVs.
A lot of research has been conducted on UAV location optimization, focusing on two types of deployment scenarios: static deployment [19,20,21,22] and mobile deployment [23,24,25,26,27] in 2D or 3D environments. UAVs serve fixed or predefined areas for specific purposes, using static deployment. Mobile UAV deployment involves UAVs with the ability to change locations and relocate as necessary.
However, existing research problems have not explored the potential advantages of using UAVs with ellipsoidal movement, which allows dynamic adjustments in position, trajectory, and shape within a predefined area. This adaptability is essential for scenarios with varying user densities, allowing UAVs to increase coverage, serve more MDs, reduce data transmission distances, and expedite task execution. In contrast to task-offloading studies [28,29,30], which often simplify user scenarios by assigning a single task per user, our research addresses the task offloading request rate, considering scenarios where MDs may have multiple tasks or no tasks. When MDs offload tasks, task transmission consumes their energy resources, which is further influenced by the relative positions of the UAVs and MDs. The increased energy consumption can significantly reduce the MD’s battery life, potentially impacting the network’s overall longevity. Hence, the strategic deployment of UAVs becomes imperative, to minimize energy consumption during data transmission. However, an exclusive focus on energy efficiency may slow down data transmission, potentially impeding rapid communication and increasing total task transmission latency. Conversely, prioritizing only latency minimization can lead to elevated energy consumption and draining device batteries. Therefore, in this paper, we aimed to achieve a balance by optimizing both the transmission latency and the energy consumption of MDs. Moreover, a single UAV’s constrained computing and energy capacities can limit its performance in task offloading scenarios. Employing multiple UAVs may be more advantageous and suitable when the number of users is high, or the coverage area is large. However, it can be difficult to choose a globally optimal strategy in multi-UAV systems without exact and comprehensive environmental knowledge.
Recently, deep reinforcement learning (DRL) [31,32], which is a combination of reinforcement learning (RL) [33] and deep learning (DL), has gained attention, in solving complex optimization problems. These problems include optimizing UAV locations for maximizing spectral efficiency or quality of experience (QoE) [26,27], trajectory planning for UAV–MEC systems, to achieve energy efficiency during task execution [28,29], energy management, and energy efficiency enhancements in network performance [34,35,36,37], as well as optimizing UAV trajectories, to minimize energy consumption during data collection [38]. In DRL, the agent tries out various actions within each state, observes the resulting rewards, and selects the action that maximizes the cumulative reward. At each step, the expected reward of the next state is combined with the immediate reward of the current state and guides the agent’s decision making process toward potential actions [39]. As a result, through continuous learning and adaptation, DRL demonstrates its capacity to effectively solve complex optimization problems with better solutions.
Therefore, in this article, we propose a DRL model named the deep-Q-network-(DQN)-based ellipsoidal trajectory optimization (DETO) algorithm for UAVs in a UAV-assisted MEC system. The key contributions of this article are summarized as follows:
- A UAV–MEC system is investigated, where multiple UAVs are used as flying MEC servers to provide computing services to the associated MDs. Each MD has computation-intensive tasks to offload to the UAV–MEC server. The primary objective is to reduce the weighted sum of the total data transmission latency and energy consumption of MDs by optimizing the position, size, and shape of ellipsoidal trajectories for the UAV–MEC servers.
- A Markov decision process (MDP) is formulated for this optimization problem. Then, a DQN-based ellipsoidal trajectory optimization (DETO) is proposed, to optimize the center position, major radius, minor radius, and rotation angle of the ellipsoidal trajectories for the UAV–MEC servers. Additionally, DETO also optimizes the associations between MDs and UAV–MEC servers.
- The Geolife dataset [40], providing user position data, is used for conducting extensive simulations. According to the simulation findings, the proposed model performs better than other baseline approaches, including the greedy algorithm and genetic algorithm (GA), in terms of different numbers of MDs, different numbers of task request rates, and different numbers of UAVs.
The remaining content is arranged as follows. Related works are discussed in Section 2. In Section 3 and Section 4, the details of the system model and problem formulation are explained, respectively. Section 5 describes the proposed algorithm. Section 6 presents a performance evaluation of the simulations, and Section 7 concludes our work.
2. Related Work
There has been a lot of research on the difficulties that come with deploying UAVs while taking into account a number of factors. Examples include optimizing response time and bandwidth efficiency [19], maximizing the number of high-priority ground nodes (GNs) [20], minimizing the number of mobile base stations (MBSs) to provide coverage to a group of ground terminals (GTs) [21], maximizing system throughput [22], improving spectral efficiency [26], and optimizing quality of experience (QoE) [27]. Next, we provide a brief introduction to these aspects.
2.1. Optimal Placement of Static UAVs
Earlier studies focused on the deployment of fixed-position UAVs in a number of scenarios, including both single-UAV and multi-UAV configurations. In [19], the authors introduced an evolutionary algorithm for disaster areas, optimizing the terrestrial and UAV base station positions to reduce their count, enhance response times, and ensure sufficient bandwidth. In [20], an optimal UAV deployment strategy was suggested for high-speed wireless networks, to increase the number of served high-priority GNs. The main objective of these studies was to address the problem of developing a single UAV, in order to increase its coverage. However, as the need for wireless connectivity grows, it becomes more and more important to investigate the deployment of multiple UAVs while trying to achieve even wider coverage, improving the efficiency of wireless networks. In [21], the challenge of establishing wireless connectivity in infrastructure-limited terrestrial networks was addressed by using MBSs mounted on UAVs, aiming to ensure communication coverage for distributed GTs by minimizing the number of MBSs through a polynomial-time spiral arrangement algorithm. For high-rate wireless communications systems, an iterative 3D multi-UAV deployment strategy was suggested in [22]. The goal was to maximize system throughput while considering co-channel interference and quality of service (QoS) requirements. However, the abovementioned studies failed to consider multiple UAVs’ high levels of mobility and flexible movement design.
2.2. Optimal Placement of Mobile UAVs
In [23], a novel cyclical multiple access method using a base-station-equipped mobile UAV was proposed, to enhance wireless connectivity and communication quality for distributed GTs through scheduled interactions. In [24], the author presented a mobile relaying technique, using high-speed UAVs to enhance communication between a source and destination by optimizing the trajectory and power allocation of the UAV iteratively. However, the abovementioned studies considered a single UAV and designed a simple trajectory for it. The study in [25] focused on energy-efficient UAV-to-GT communications, proposing a circular trajectory with the center position at the GT, optimizing the UAV’s trajectory to find a balance between communication throughput and energy consumption. However, the paper focused on optimizing the speed and flight radius of a single UAV, to achieve an optimal circular trajectory.
2.3. Optimal Placement of UAVs Using RL Techniques
In recent decades, the application of machine learning, especially reinforcement learning, has gained significant attention, for solving UAV deployment problems by enabling adaptive and optimized operations in dynamic environments. The proposed approach in [26] used BS-equipped UAVs to enhance cellular network capacity in high-traffic scenarios under 5G networks and to optimize 3D UAV–BS locations, based on user requirements, to maximize spectral efficiency. In [27], a novel framework addressing UAV deployment and movement for QoE optimization was introduced, incorporating genetic algorithm-based cell division, Q-learning-based deployment, and movement strategies to enhance cumulative user satisfaction. These papers concentrated on improving the positions of UAVs in a multi-UAV scenario, with a focus on communications-related issues. Additionally, the UAV-assisted MEC system was explored by investigating the flexible movement of UAVs in [28,29]. A cooperative multi-agent DRL framework was used to investigate collaborative task offloading in a multi-UAV-multi-EC MEC system, optimizing trajectories, communications, and computation, to reduce delays and energy consumption during execution [28]. A flying MEC architecture that offloaded tasks to UAVs was introduced, aiming to achieve energy efficiency with DRL-based and convex-optimization-based trajectory control techniques [29].
2.4. Energy Efficiency and Energy Management with the RL Technique
RL has also gained attention in optimizing energy efficiency and energy management in different network environments. The study in [34] addressed the complex challenge of optimizing energy-efficient resource allocation in cognitive radio (CR) networks while maintaining QoS, using model-free RL methods including Q-learning and state–action–reward–state–action (SARSA) with a cooperative framework. In [35], the authors discussed optimizing energy management and time scheduling in the context of radio-frequency-powered CR networks, to improve long-term secondary throughput using a deep deterministic policy gradient (DDPG) approach. The authors in [36] presented a DRL-based framework for optimizing energy efficiency in reconfigurable-intelligent-surface-(RIS)-assisted cellular networks, addressing the joint optimization of base station transmitting power and RIS configuration. An energy-preserving MAC protocol for wireless sensor networks based on Q-learning was presented in [37], optimizing MAC parameters adaptively, to extend network lifetime and reduce energy consumption. The study in [38] introduced a DRL approach for optimizing UAV trajectory planning in wireless sensor networks, focusing on energy consumption minimization during data collection.
In the abovementioned UAV deployment studies, the primary objective was to optimize the horizontal location and altitude of UAVs, while the concept of ellipsoidal movement for UAVs remained unexplored. To address this gap, our research explores the potential of UAVs to dynamically adjust their trajectories in ellipsoidal paths, thereby enhancing the connection between MDs and UAVs. Each MD may have multiple tasks rather than just one because of the variance in task offloading request rates. Furthermore, we have developed a multi-objective framework aimed at minimizing the weighted sum of total transmission latency and energy consumption that differs from a single-objective perspective. We use user positions taken from the Geolife trajectory dataset rather than random user placements. This method offers precise location data, which enhances the optimization of ellipsoidal trajectories for UAVs, bringing them closer to real-world scenarios.
3. System Model
We consider a square region consisting of a set of MDs, represented by , and a set of UAVs, denoted by . Other notations used in the system model are in Table 1.

Table 1.
List of Notations.
We assume the current location of the MDs is known and that each MD has computation-intensive tasks to execute. The MDs themselves, however, are unable to execute these computation-intensive tasks locally because of limited resources in processing power, memory, or energy. To address this, UAVs are utilized to enhance the delivery of MEC services to ground MDs, allowing them to use more powerful computing resources for efficient task execution. Each MD i has a task request rate , and the size of the input data for each task is denoted , where are the minimum and maximum task request values and are the minimum and maximum task data sizes. MDs transfer all their computational task requests to UAV–MEC servers for execution. The UAV–MEC servers hover over a target area in an elliptical pattern while providing services to the connected MDs. In particular, to prevent trajectories from colliding, a careful deployment plan is essential. We choose each UAV–MEC server’s initial center position for the ellipsoidal trajectory from the cluster center. Thus, a specific sub-area within the total coverage region is allocated to each UAV, which helps in providing MEC services to the ground MDs located in that specific sub-area in an efficient manner. Additionally, each MD can establish a connection with one UAV–MEC server at a time, to offload its task request. Then, one can have
where implies the ith MD is associated with the jth UAV; otherwise, .
3.1. Equations of the UAVs Ellipsoidal Movement
On the horizontal plane, an ellipse’s equation, according to [41], can be presented as
where the ellipse’s center is located at ; and , respectively, are the radii of the X and Y axes. If the ellipse rotates at a particular angle, , the equation can be written as
Equation (3) can be written as a parametric equation of a rotated ellipse, as follows:
This parametric equation is used to calculate the UAV’s X and Y location points on the rotated ellipsoidal path, using parameter . Specifically, for any given time t, calculates the UAV’s position along the ellipsoidal path [42], where and T represent the complete circumference of the ellipse and the total time for the UAV to complete one cycle over the ellipse, respectively.
In our considered scenario, we assume the jth UAV–MEC server following an ellipsoidal trajectory on the horizontal plane with major radius and minor radius , as well as rotation angle (Figure 1). The center position of this ellipsoidal trajectory is represented by . The UAV–MEC server maintains a constant altitude h while flying, similar to [25,43]. Within cycle period T, the UAV–MEC server completes one cycle of this ellipsoidal trajectory, in order to assist the associated MDs. We partition cycle period T into P equally sized time intervals. Thus, in each time slot t, the coordinates of the jth UAV–MEC server are denoted , where , and h represent the and Z coordinates, respectively, of UAV–MEC server j in time slot t along the ellipsoidal path. By using Equation (4), the location of the jth UAV–MEC server in time slot t can be written as
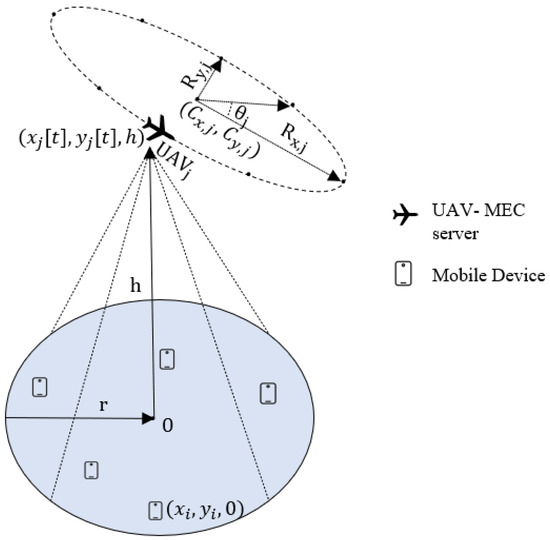
Figure 1.
The XY-plane positions of MDs and a UAV with an ellipsoidal trajectory.
3.2. Air-to-Ground Path Loss Model
Now, if the ith MD wants to offload its task to the jth UAV–MEC server, where the position of MD i is denoted in the 3D coordinate system, then the ground distance between MD i and UAV–MEC server j in time slot t is denoted . While the UAV–MEC server moves along the ellipsoidal path, the 3D distance between MD i and UAV–MEC server j in time slot t is expressed as
The wireless communications model between the UAV–MEC server and the ground MDs is constructed based on line-of-sight (LoS) and non-line-of-sight (NLoS) link propagation modes, from which the air-to-ground path loss model is derived. From [44,45], the mathematical equations for the path loss of the LoS and NLoS propagation modes can be expressed as follows
where c represents the light’s propagation speed and f represents the carrier frequency; and are the environment factors specific to average the additional path losses for the LoS and NLoS propagation modes, respectively. However, according to the International Telecommunication Union (ITU) guidelines for radio transmissions, the following parameters are essential for figuring out the geometric probability of LoS transmission in an urban setting:
- represents the portion of the total land area occupied by buildings.
- quantifies the average density of buildings per unit area, measured in terms of the number of buildings per square kilometer.
- is a scale parameter that illustrates the distribution of building heights, using the Rayleigh probability density function.
Using these parameters, the LoS probability equation between MD i and UAV–MEC server j can be represented as
with
where the height of the transmitter (the UAV–MEC server) and the receiver (the MD) are denoted and , respectively. It is important to mention that the system’s frequency has no effect on the geometric LoS formula, and this formula can be represented by using the simple modified sigmoid function (S-curve), which significantly simplifies the calculation of the LoS probability.
Moreover, the probability function for the LoS link using the S-curve can be represented as
where the propagation environment determines constants a and b, which represent various scenarios, including suburban, urban, dense urban, and high-rise urban zones; is the elevation angle between MD i and UAV–MEC server j in time slot t along the ellipsoidal trajectory. The probability function for establishing the NLoS link is then
Therefore, the probabilistic mean path loss of the system in time slot t can be expressed as
Now, using Equations (7), (10), and (11) in (12) and by applying basic algebraic operations, we have the following [44,46]:
where . In our scenario, we assume the transmit power of each MD is the same. Thus, the signal-to-noise ratio between MD i and UAV–MEC server j in time slot t is
where is the transmit power of MD i, and is the noise power. The ground-to-air (G2A) data transmission rate between MD i and UAV–MEC server j in time slot t is
The average data transmission rate for MD i throughout cycle period T is then defined as
Assume that all task requests coming from MD i, which is connected to UAV–MEC server j based on maximum throughput, are offloaded through the G2A channel. Thus, the G2A data transmission latency, , between MD i and UAV–MEC server j is determined by the task’s data size, , and the rate at which the data are transmitted, . Then, can be stated as
Therefore, the total data transmission latency experienced by the MDs connected to UAV–MEC server j for offloading task requests per second can be obtained as follows:
where is the task offload request rate of MD i.
The energy consumption for task transmission between MD i and UAV–MEC server j can be obtained as follows:
The total transmission energy consumption of all MDs connected to UAV–MEC server j for offloading task requests per second is
4. Problem Formulation
The aim of this article is to minimize the total transmission latency and the total transmission energy consumption of MDs. Thus, the function can be written as
where is a coefficient that is used to define the relative weight of transmission latency and transmission energy consumption based on the nature of the application. A higher value prioritizes reducing transmission latency, while a lower value emphasizes lowering energy consumption. Additionally, can be assigned to different values to align with various objectives and can be easily modified through the application settings, as needed. Next, the optimization problem can be expressed as follows:
where Equation (23) indicates one MD can connect to one UAV–MEC server at a time, to offload its task. Equations (24) and (25) indicate the horizontal and vertical center position deployment constraints for the UAV–MEC server’s ellipsoidal trajectory. Equations (26)–(28) are the constraints for the major radius, minor radius, and rotation angle, respectively, which define the size and shape of the ellipsoidal trajectory. Constraint (29) indicates that the data transmission rate should be higher than the predefined threshold value, to ensure the QoS for each MD. Equation (30) is the constraint for the transmission latency, and (31) is the constraint for the transmission energy consumption of each MD, which has to be less than the threshold value.
To address the problem formulated above, we propose a DQN-based solution in the next section, to obtain nearly optimal results utilizing environmental knowledge.
5. Proposed Algorithm
In this section, the proposed DQN-based ellipsoidal trajectory optimization (DETO) algorithm is discussed in detail, with a focus on the formulation of the state, action, and reward design aimed at addressing the optimization problem presented in Equation (22).
5.1. Markov Decision Process Formulation
Generally, RL problems can be represented as instances of MDP [47], in which the actions taken in the present state determine the future state. Therefore, the process of optimizing the center position, major radius, minor radius, and rotation angle of the ellipsoidal trajectories of UAV–MEC servers to minimize the total transmission latency and total transmission energy consumption of MDs can be formulated as an MDP with tuple . At each time step t, the agent observes a state , selects an action , transitions to the future state , and obtains a reward . The design of state, action, and reward are presented as follows.
State: Consists of positional parameters of each UAV’s ellipsoidal trajectory:
where and denote the x-coordinate center, the y-coordinate center, the x-coordinate radius or major radius, the y-coordinate radius or minor radius, and the rotation angle of the ellipsoidal trajectory of UAV–MEC server j, respectively.
Action: An action involves one of the following: moving the center position horizontally or vertically in a positive or negative direction, incrementing or decrementing the major or minor radius, changing the rotation angle to either clockwise or anticlockwise, or keeping the current state unchanged.
Reward: An effective reward design acts as a map, directing the learning agent in the direction of the desired result. It gives the agent important feedback on the effectiveness of its actions. Thus, to effectively solve the center position, size, and shape of the ellipsoidal trajectories of the UAV–MEC servers, we have designed our reward function with the help of our objective function, which is defined as
where are constants. The values of are both within the range (0, 1) and , and represents the system objective in Equation (22).
5.2. DQN-Based Ellipsoidal Trajectory Optimization
RL has gained significant attention in recent times for solving complex optimization problems. Instead of using static data, an agent interacts with the environment, explores its surroundings, and learns through trial and error to develop a policy that maximizes the total reward:
where denotes the discount factor, reducing the influence of future rewards on the agent’s decision making. In RL, particularly in traditional Q-learning [48], the Q-value function serves as a tool to evaluate the effectiveness of selecting a specific action in a particular state. It is updated iteratively, using the Bellman equation:
However, Q-learning records each combination of state s and action a in a Q-table, which is impractical for many real-world scenarios. The dimensions of the Q-table rise dramatically as the sizes of the state and action spaces grow, and Q-learning needs a huge memory space to save them. Deep-Mind [49] introduced the DQN to overcome this issue by utilizing function approximation through an NN, to estimate the Q-values for individual state–action combinations.
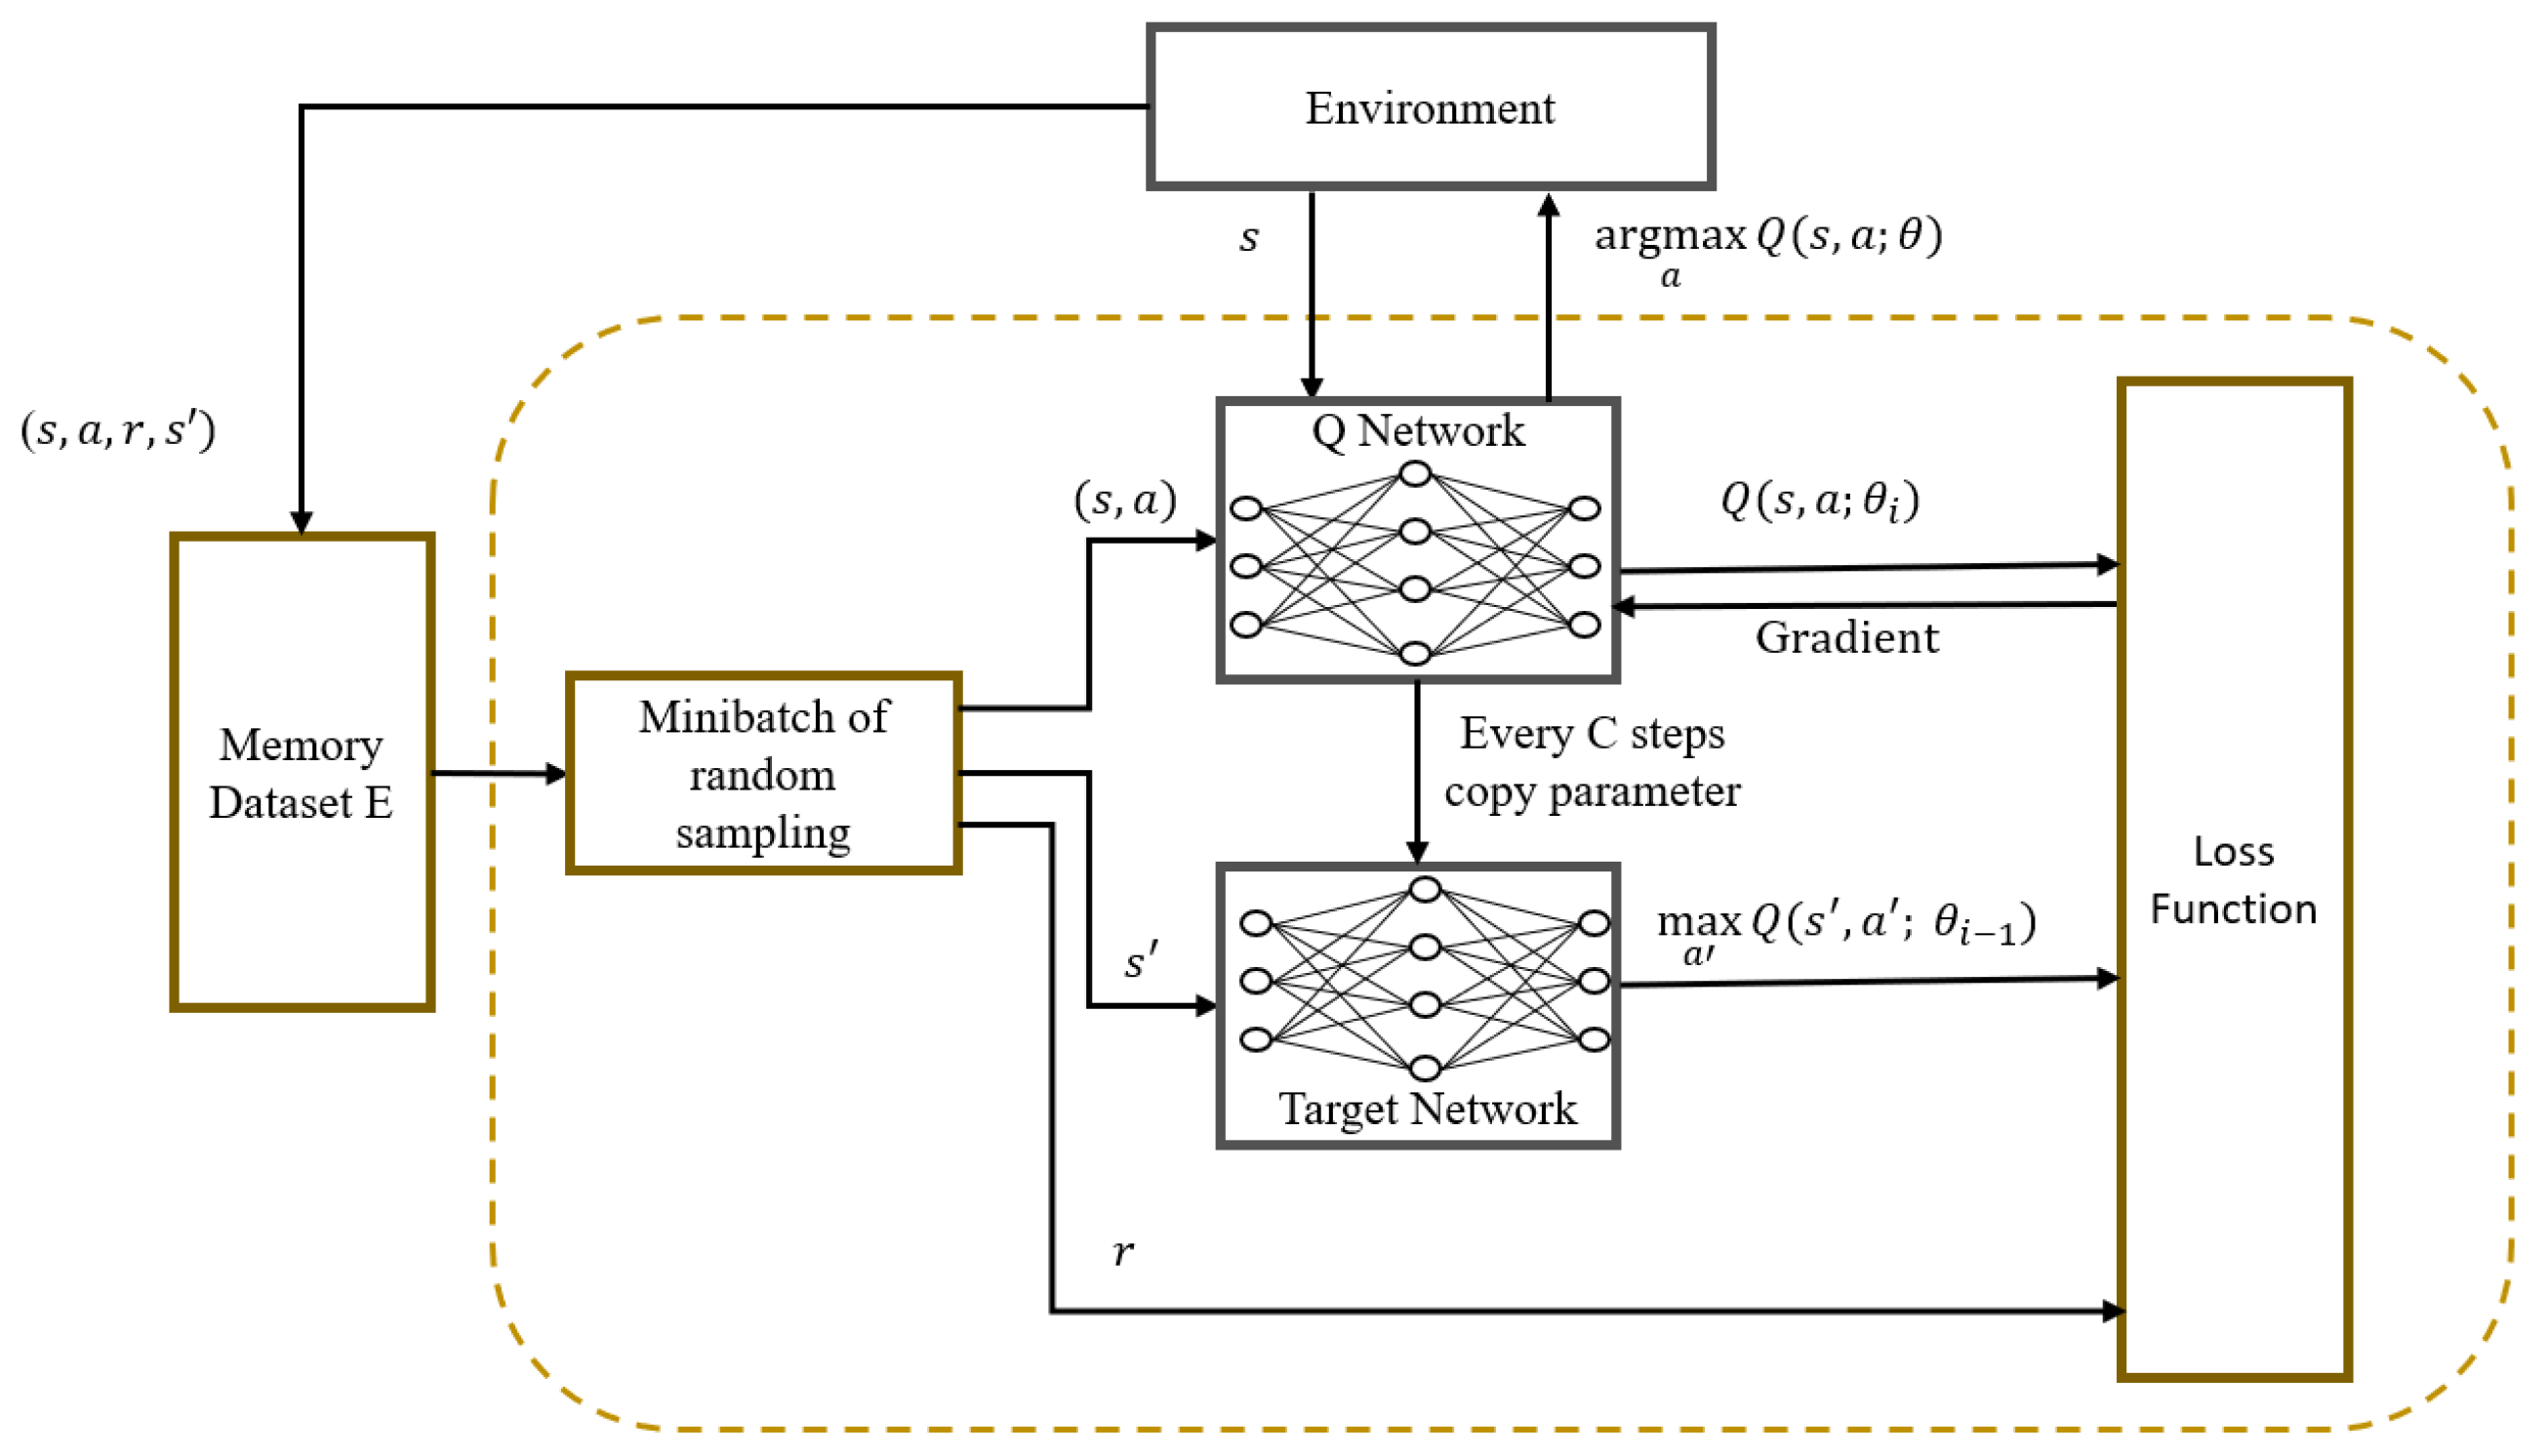
Considering the large state space and high-dimensional action space in our UAV-assisted MEC system, we employ the DQN framework to address the MDP problem discussed earlier, called DQN-based ellipsoidal trajectory optimization (DETO). The framework is depicted in Figure 2 and consists of two NNs (the Q-network and the target Q-network) and a memory dataset to store the experiences. Each network has multiple layers that are connected to one other, to correlate the state and action. The input of the NN is used to represent the current state of the environment and the probability assigned to each possible action is represented by the output of the networks. The memory dataset is depicted as a queue-like data structure. The agent creates new transitions by interacting with the environment and stores them in memory. When the memory reaches its limit, it begins to remove the earliest transitions, to make way for the newest ones. Therefore, the most recent transitions are kept in memory while removing the oldest ones, which primarily helps in tracking the agent’s most recent interactions with the environment.
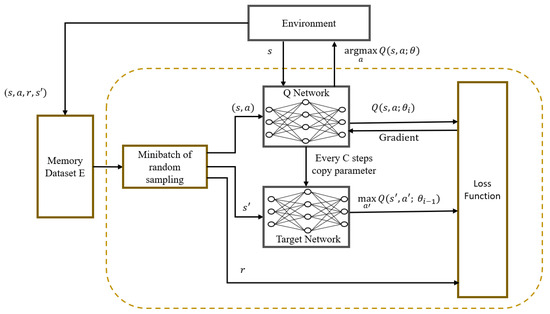
Figure 2.
The DETO framework.
The DETO training steps are presented in Algorithm 1. At the beginning of each simulation during the learning process, a number of elements, including the capacity of the memory dataset and the parameters of both the Q-network and the target network, are initialized. For the NN learning process, these parameter values serve as starting points. This initialization is performed through lines 2, 3, and 4 of the algorithm. Note that the DQN uses a dual-network strategy to estimate the current Q-value and target Q-value, where both the Q-network and the target Q-network have the same neural architecture. However, these networks have a different set of parameter values to make these estimations.
Each training episode begins with the agent starting from an initial state, and each episode runs for a given number of steps (lines 5, 6, and 7). The initial deployment positions for each UAV–MEC server are determined using the K-means clustering technique and are integrated into the initial state information. In each step of the training episode, the NN receives the current state (line 8) as an input value, and it returns the Q-values of every action. The agent then selects an action using an epsilon greedy algorithm (line 9).
Due to the lack of background knowledge about the environment, the agent emphasizes exploration at first. To do this, it occasionally selects random actions under the guidance of a probability parameter, . With the aid of this exploratory strategy, the agent discovers the dynamics of the environment, gathers important data, and stays away from locally optimal solutions. The agent eventually reduces the use of random actions as it becomes more familiar with the environment. This reduction acts as a switch towards exploitation, forcing the agent to choose the actions that work best. This adjustment aids the agent in finding the ideal balance between utilizing what it has already determined as best and attempting new things, enabling it to get the best results over time by combining both previously successful strategies and new information.
The agent takes action to change the center position, length of a radius, or rotation angle of the ellipsoidal path, to determine the position, size, and shape of the ellipse. By performing the above actions, it observes the next state (line 10). This state transition leads to a change in the UAV–MEC server’s position. Consequently, the associations between MDs and UAV–MEC servers also change. The association between each MD and UAV–MEC server is determined based on throughput. In particular, for each MD, the UAV–MEC server that yields the highest throughput is selected. Subsequently, after computing the association between MDs and the UAV–MEC server, the agent obtains the reward (lines 11, 12).
| Algorithm 1 DQN-based ellipsoidal trajectory optimization (DETO) |
Input: Initial center position, radius, rotation angle of the ellipsoidal trajectory of each UAV–MEC server Output: Optimal center position, radius, rotation angle of the ellipsoidal trajectory to minimize the system objective
|
To make the learning process stable and to enhance sample effectiveness, the agent stores each transition that includes state, action, reward, and the next state in memory dataset E (line 13). When training Q-network parameters, a batch of transitions from the memory dataset is randomly chosen by the agent (line 14). This sampling process is used to break the correlation between consecutive transitions, ensuring the training data are sufficiently diverse, which aids the network’s ability to acquire useful weights that can effectively handle a variety of data values.
During training, the aim is to reduce the gap between the target Q-network’s output, , and the Q-network’s output, , which is achieved by utilizing the mean squared error (MSE) loss function (lines 15, 16):
The parameter values of the Q-network are updated using the Adam optimizer with an initial learning rate of 0.001. Then, the parameter values from the Q-network are copied periodically to the target Q-network (line 17). At the end of the training, we test the model and save the results with optimized parameters for the ellipsoidal trajectory (lines 20, 21). Finally, from the outcomes of multiple simulations, we select the best result (lines 22, 23).
6. Performance Evaluation
For this segment, we analyzed the efficiency of our suggested DETO approach in a UAV-enabled MEC network by conducting simulations. A suburban area was considered, to simulate the deployment of UAV–MEC servers for 300 MDs distributed within three distinct hotspots. The K-means clustering technique was used to determine the initial center position for each UAV–MEC server, based on the user distribution provided and the number of deployed UAV–MEC servers. The initial values of the major radius, the minor radius, and the rotation angle for the ellipsoidal movement of each UAV were randomly chosen within the ranges [60, 200] m and [, ], respectively. The value of was set to 0.5, meaning that both transmission latency and transmission energy consumption were equally important. Table 2 summarizes the rest of the simulation parameters utilized in our experiments, with default values denoted in bold.
Table 2.
Experimental settings.
The Geolife mobility dataset [40] was used to determine the MDs’ locations. The dataset contains GPS traces of 182 users in Beijing, China, which were collected during a five-year period by Microsoft Research Asia from April 2007 to August 2012. Our simulation covered a crowded region of area in the city. The MD locations were then chosen from the users’ GPS points within the specified area by considering the time frame 12 p.m. to 1 p.m. during the year 2008.
For the DETO framework’s neural network structures, we used two hidden layers, each with 64 neurons. These hidden layers had ReLU activation functions, whereas the output layer had a linear activation function. Table 3 represents the DETO framework’s main hyperparameter representation, which was used to train the model.
Table 3.
Hyperparameters of the DETO Model.
The experiments were performed using a system with an Intel Xeon E3-1245 v5 processor running at 3.50 GHz, an NVIDIA GeForce GTX 1050 Ti graphics card, and 16 GB of RAM. Implementation of the DETO framework was carried out using Python 3.8.0 and a GPU-enabled version of TensorFlow 2.9.2.
6.1. Training Efficiency of the DETO Scheme
In this subsection, we examine the effectiveness of the DETO optimization method’s training. DETO’s training progress is shown in Figure 3. As the number of training episodes increased, we can see that the total number of rewards continues to rise progressively from the beginning. With a total of 100 episodes, total rewards experience a notably significant increase after the 40th episode. This occurs because the agent initially explores new positions at random using the probability, and these new positions may not yield optimal performance. Moreover, experience replay memory initially has fewer feasible solutions. However, as the neural networks begin training, experience replay memory gathers more useful solutions. Thus, UAVs are able to execute actions iteratively and can learn from mistakes, to increase the reward, which ultimately leads to a better system objective. Even though the curve shows fluctuations and lacks convergence, it continually moves upward.
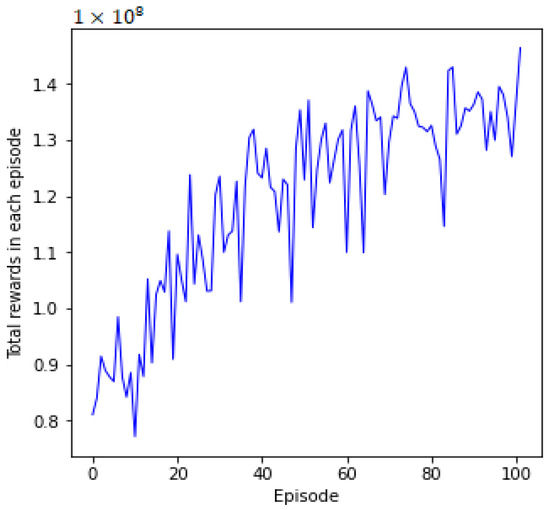
Figure 3.
Training curve of DETO.
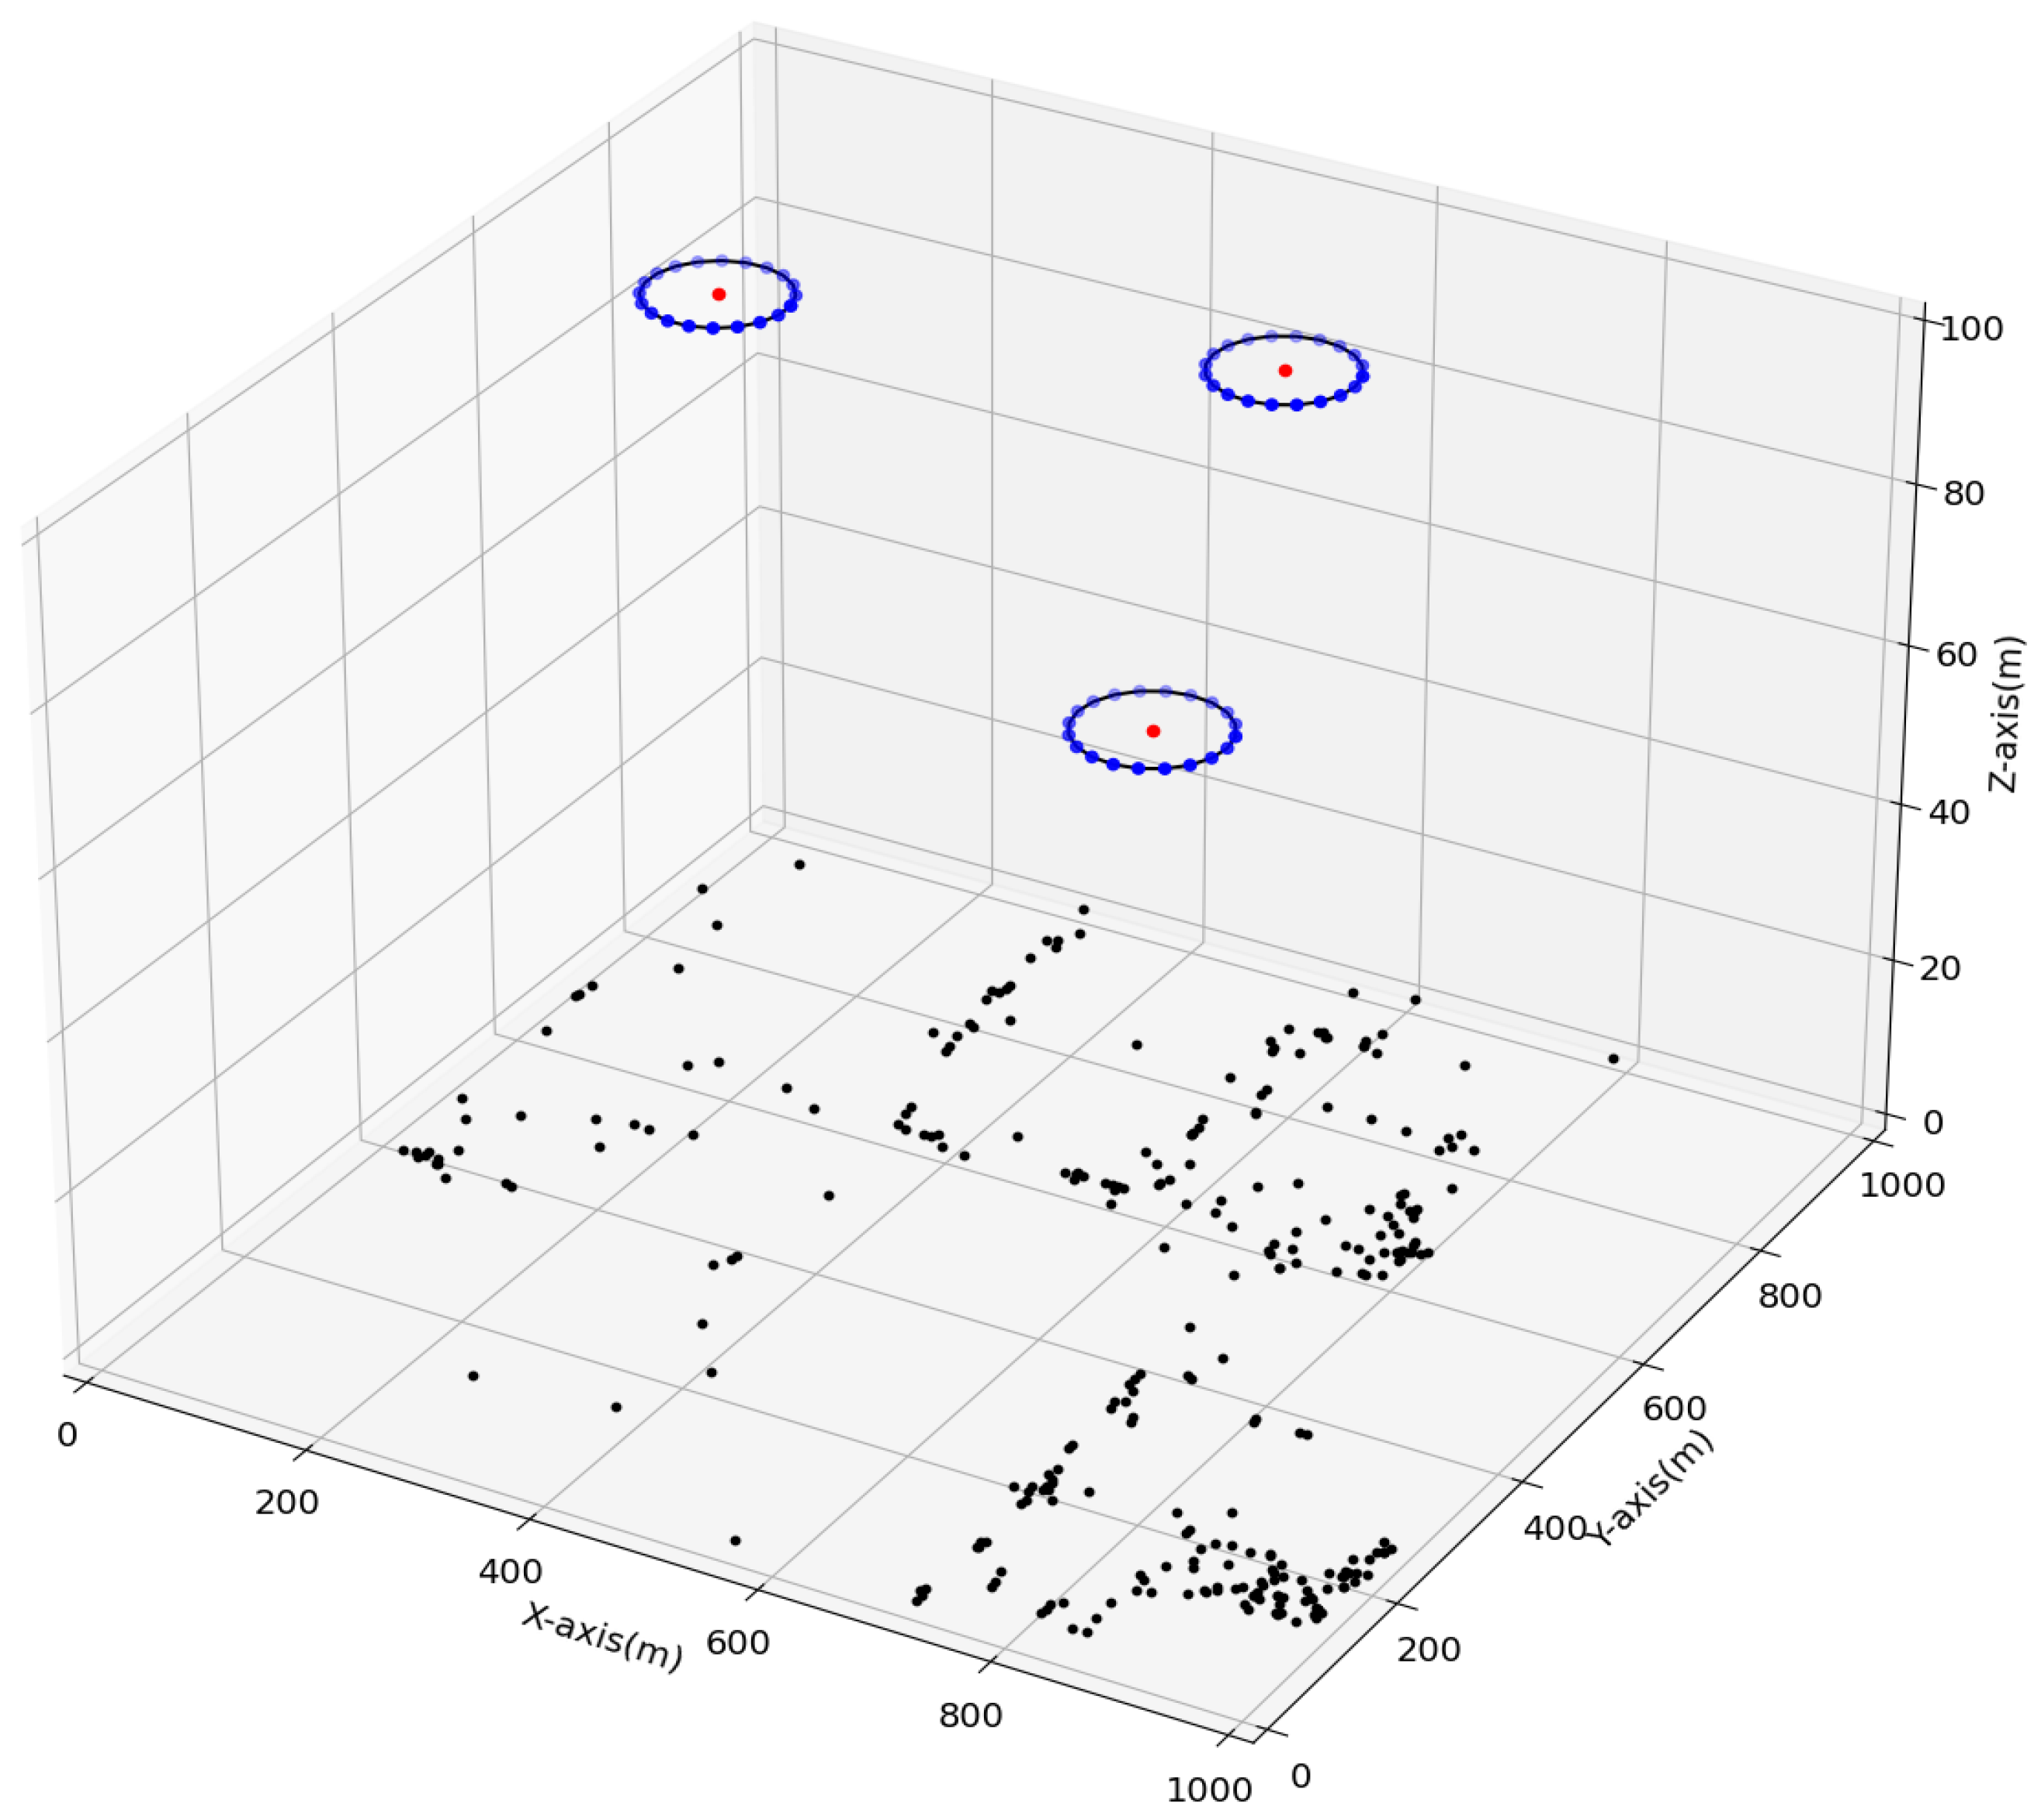
In Figure 4 and Figure 5, we plot the UAVs’ ellipsoidal trajectories and the corresponding rewards, respectively, during the algorithm’s iterative operations after the end of the DETO model’s training. With the advancement of the learning process, the UAVs gradually optimize their ellipsoidal movements, minimizing transmission latency and energy consumption. The distribution of MDs and the deployment positions for UAV ellipsoidal movements are shown in Figure 4. Figure 5 illustrates the system’s improvement over time, as the reward increases in each step. Remarkably, within the first 25 steps, the reward stabilizes and stays relatively constant. This implies that after an adequate number of steps, the system achieves a balanced state, to reduce the system’s overall transmission delay and energy consumption in providing MEC services to the MDs with maximum throughput.
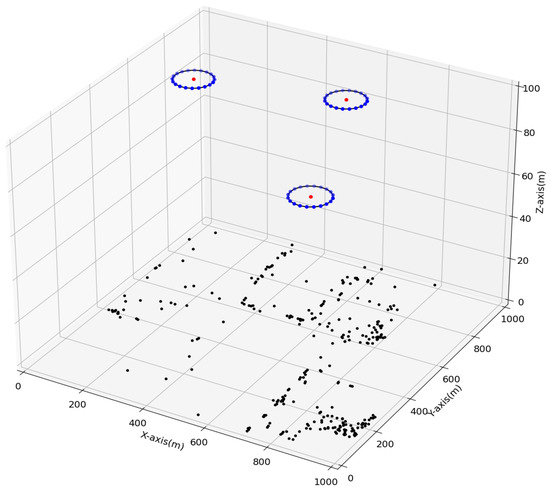
Figure 4.
Deployment positions of UAVs’ ellipsoidal movement.
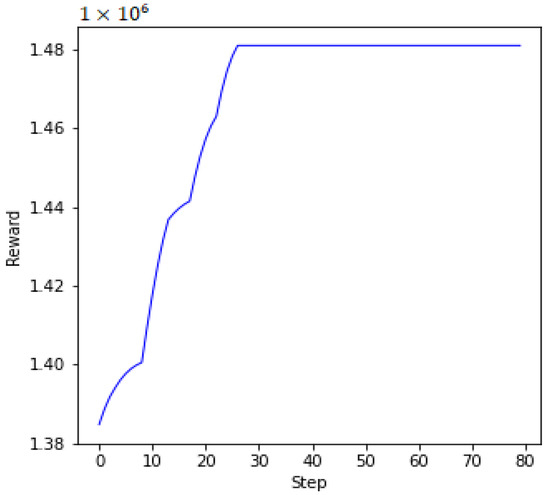
Figure 5.
Reward during the algorithm’s iterative operations.
6.2. Performance Comparison between DETO and Other Baselines
In this section, the performance of the DETO method is compared to a GA solution and a greedy solution under various conditions, including different numbers of MDs, different numbers of task request rates, and different numbers of UAVs. The GA and greedy approaches are described as follows:
- GA-based ellipsoidal trajectory optimization (GAETO): A rank-based genetic algorithm is employed to find a solution for ellipsoidal trajectory optimization, where each solution is a vector representation of real numbers. The initial population is generated randomly, and the fitness function is calculated using the reciprocal value of the system objective for each individual solution. Lower fitness values are given to higher ranks and have a higher chance of being selected as parents. Then, new solutions are generated by applying crossover and mutation, and the best solution is recorded. This procedure repeats for a given number of generations.
- Greedy: In this setup, each UAV’s center position is chosen from the cluster center. The major radius of each UAV is equal to one half of the distance along the x-axis between its center and its farthest associated user, while the minor radius is equal to one half of the distance along the y-axis between its center and its farthest associated user. The rotation angle is set to .
6.2.1. Effects of Different Numbers of MDs
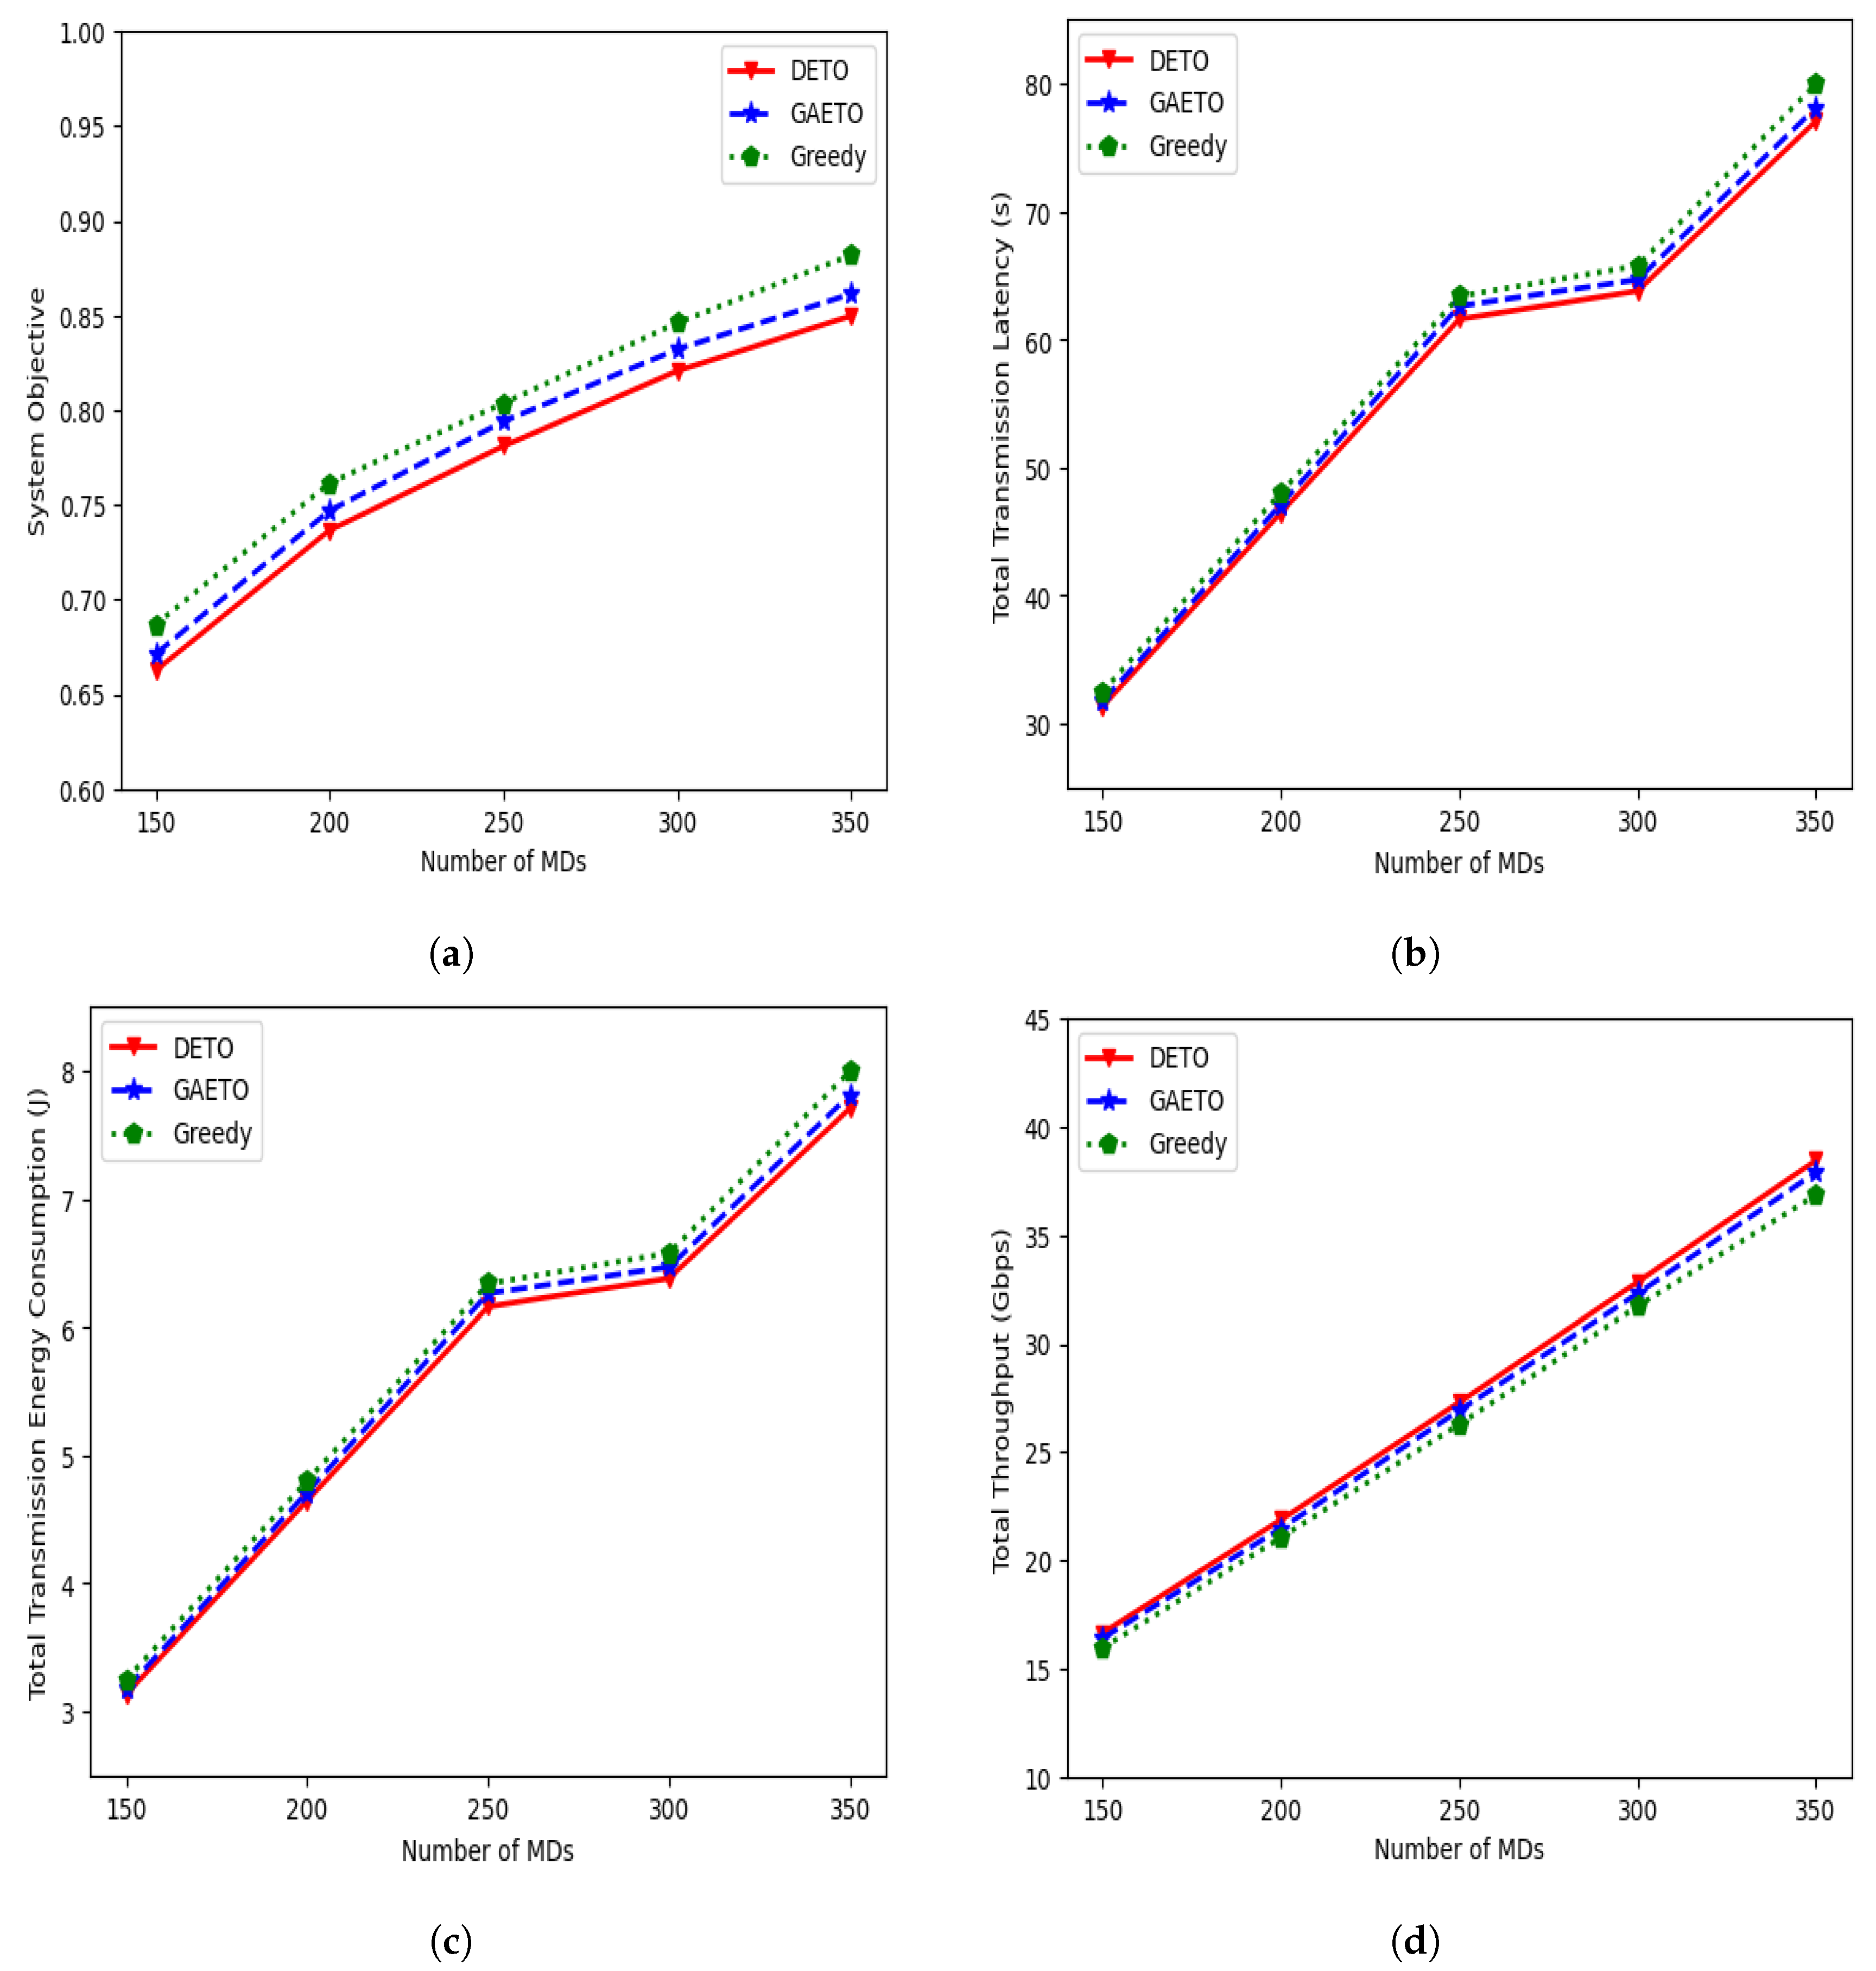
Figure 6 shows the system objective, total transmission latency, total transmission energy consumption, and total throughput of the three methods. With an increase in the number of MDs, all four figures show an increasing trend. This occurs because when the MDs increase in number, the tasks that need to be offloaded also increase, which results in higher system objectives. Additionally, as the number of MDs increases, there is a change in their distribution. This can cause the distance between MDs and the UAV–MEC servers to increase, which leads to longer latency and more energy consumption during transmissions, further contributing to the rise in the system objective.
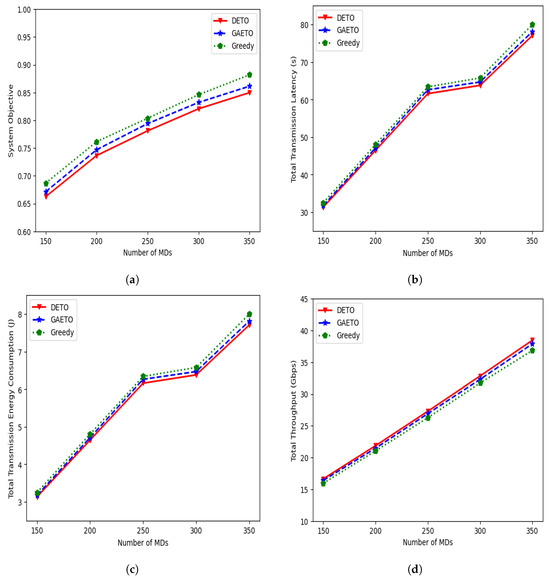
Figure 6.
Effects of different numbers of MDs: (a) effects on the system objective; (b) effects on the total transmission latency; (c) effects on total transmission energy consumption; (d) effects on total throughput.
From Figure 6a, we see that the system objective increases gradually when the MDs increase in number from 150 to 200, from 200 to 250, from 250 to 300, and from 300 to 350, respectively, and that DETO performs better than the other two algorithms, achieving a lower system objective. For example, the value of the system objective with DETO is 0.82 when the number of MDs is 300. On the other hand, the objective values from GAETO and the greedy approach are 0.83 and 0.84, respectively. Moreover, the gap between the system objectives increases with the increase in MDs, and the gap is especially wider when MDs number 350 because more tasks need to be offloaded, and GAETO and greedy provide suboptimal solutions.
From Figure 6b,c, it can be observed that both total transmission latency and total transmission energy consumption for all three algorithms experience a relatively sharp increase as the number of MDs increases from 150 to 200 and from 200 to 250. This increase occurs due to the increased task requests associated with the growing number of MDs, resulting in longer transmission latency and greater transmission energy consumption. However, the rise is slightly slower when MDs increase from 250 to 300. This is because when the number of MDs is 300, the majority of the users have a task request rate in the 0.1 to 0.5 range. Having lower task requests results in lower transmission latency and transmission energy consumption. It again follows a sharp increase with higher task requests when MDs increase from 300 to 350. DETO’s performance is always better than GAETO and the greedy algorithm. For example, when the number of MDs is 300, total transmission latency with DETO is 63.76 s, which is 1.37% and 2.99% lower than GAETO and the greedy algorithms, respectively.
Figure 6d illustrates the effect of the different numbers of MDs on the total throughput of the system. With an increase in the number of MDs, the total throughput experiences a sharp rise. This occurs because the channel bandwidth for each MD is assumed to be fixed. Therefore, when the number of MDs increases, the system’s total throughput also increases. In terms of DETO, the total throughput increases by 31.39%, 24.80%, 20.27%, and 17.09% when the MDs increase in number from 150 to 200, from 200 to 250, from 250 to 300, and from 300 to 350, respectively. Moreover, the performance of DETO is 4.33%, 3.92%, 3.87%, 3.51%, and 4.33% higher than the greedy approach for all numbers of MDs.
6.2.2. Effects of Different Numbers of Task Requests
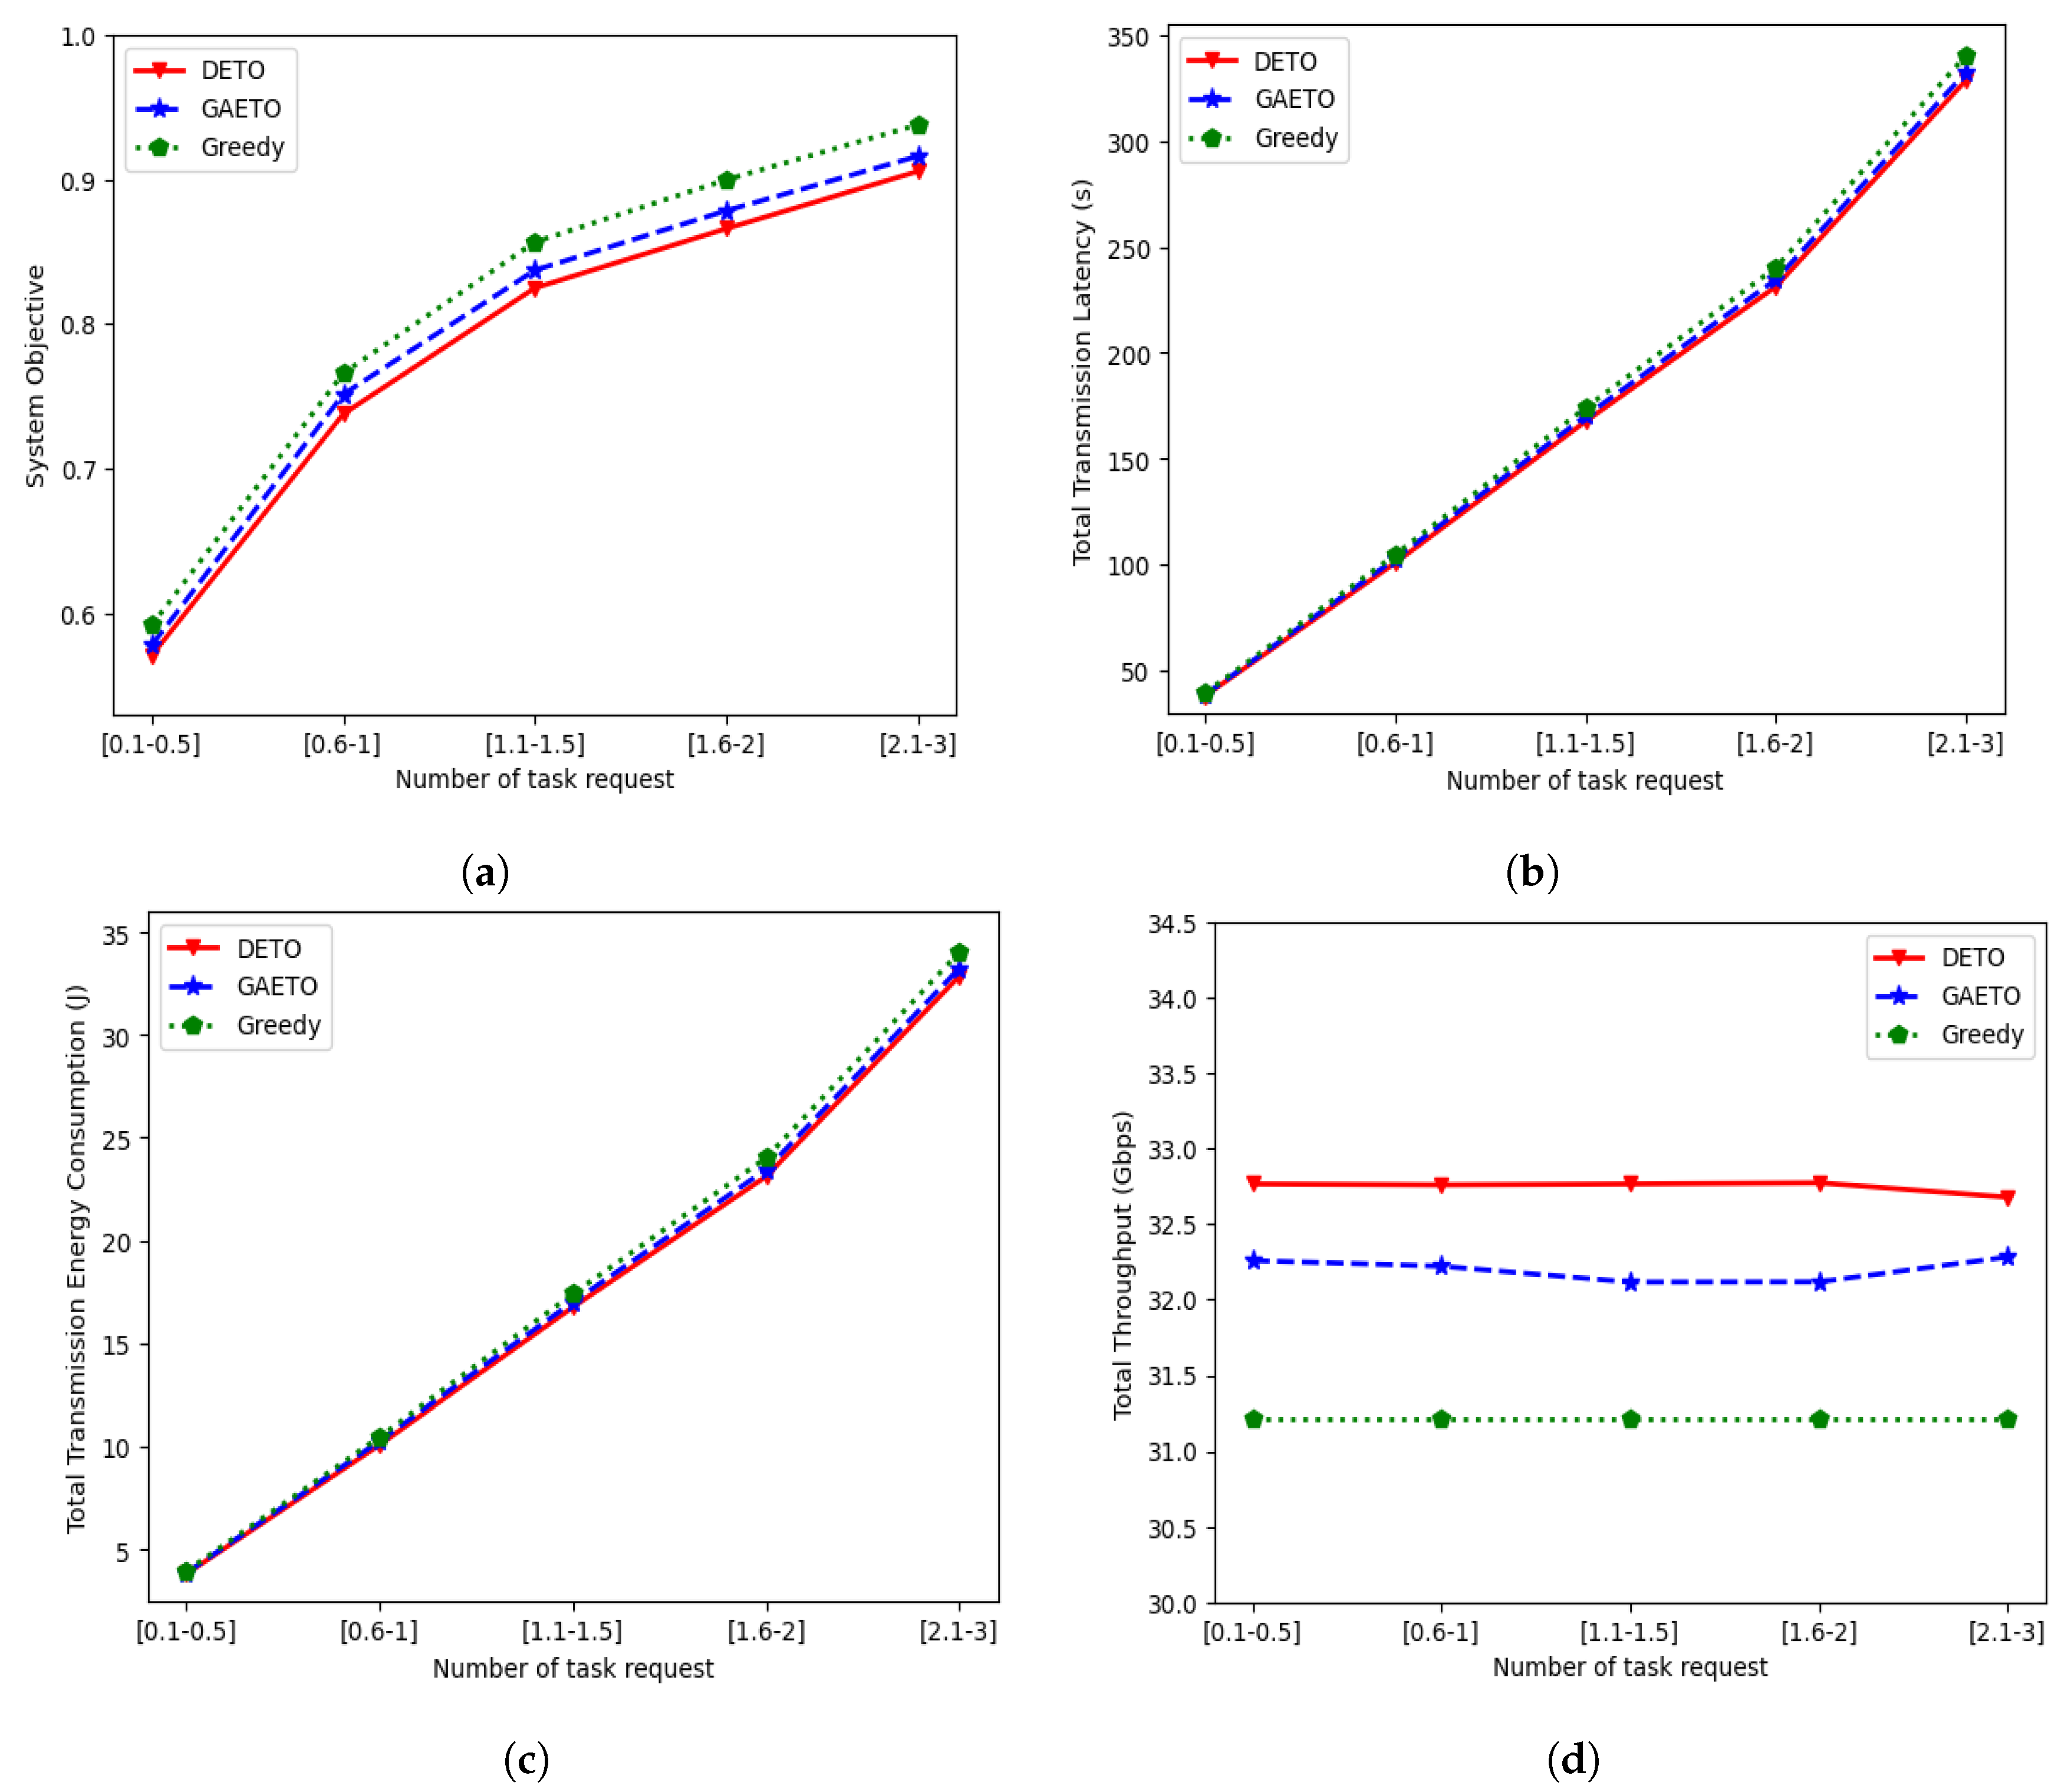
Figure 7 shows the effects of varying numbers of task requests. With the increasing number of task requests, the total task size concurrently expands. Consequently, more data bits need to be offloaded to UAV–MEC servers from the MDs. When MDs transmit a large volume of data bits to the UAV–MEC servers, it leads to higher transmission latency and increased energy consumption. Therefore, the system objective, total transmission latency, and total transmission energy consumption shown in Figure 7a, Figure 7b, and Figure 7c, respectively, demonstrate an increase consistent with the growth in task requests. In Figure 7a, it is observed that DETO always performs better than the GA and greedy approaches, obtaining a lower system objective across different task request ranges, whereas the system objective obtained by the greedy algorithm is the highest among them. For example, when the number of task requests is in the range of 0.6 to 1, the system objectives obtained by DETO and GAETO are 0.737 and 0.751, respectively, while the system objective for the greedy approach is 0.765.
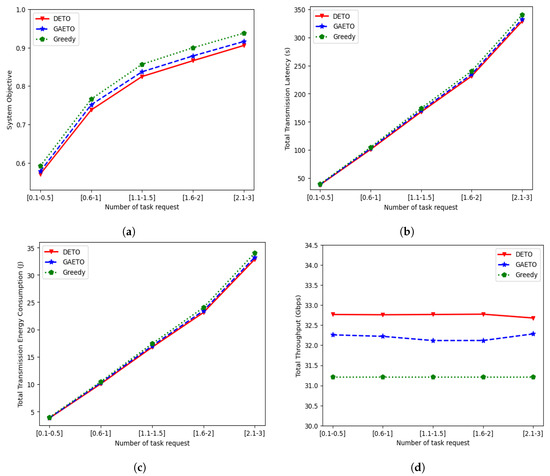
Figure 7.
Effects of different numbers of task requests: (a) effects on the system objective; (b) effects on the total transmission latency; (c) effects on total transmission energy consumption; and (d) effects on total throughput.
The displayed curves in Figure 7b,c show a steady and gradual increase as the number of task requests increase. This is a result of the growing need to offload more tasks, which requires more time and energy for transmission. For example, in Figure 7b, the transmission latency obtained by DETO increases from 231.17 s to 328.66 s when the task request changes from the [1.6–2] range to the [2–3] range. By comparison, GAETO increases from 234.49 s to 332.45 s, and the greedy approach increases from 240.19 s to 340.33 s, respectively. Similarly, in Figure 7c, transmission energy consumption increases for DETO, GAETO, and the greedy approach, ranging from 23.11 J to 32.86 J, 23.44 J to 33.24 J, and 24.01 J to 34.03 J, respectively.
Figure 7d illustrates the system’s total throughput, with DETO and GA showing a slight up-and-down trend, while greedy remains unchanged. This is because the throughput is influenced by the positions of the MDs and the positions of the UAVs along the ellipsoidal paths. The throughput follows an increasing or decreasing trend when the number of MDs increases or decreases. However, in this scenario, the positions remain unchanged for a fixed number of MDs, even though the number of task requests varies. Thus, the solutions obtained by DETO and GAETO show slight fluctuations in total throughput. Notably, the DETO-based approach consistently shows higher throughput than GAETO and greedy. Moreover, the results imply that using the NN to approximate the Q-values enables the DQN-based solution to achieve better results for the considered problem. By maximizing the total reward and locally optimizing the DQN result, the agent can learn a strategy to identify the ellipsoidal trajectory’s parameters that provide a lower system objective. On the other hand, GA-based solutions partially depend on random processes, which may result in early convergence if genetic diversity is lost, resulting in suboptimal solutions. Moreover, because of the large solution space, the GA produces a considerable number of infeasible solutions in each iteration, whereas greedy uses fixed parameters to solve the considered problem. Therefore, finding a good solution is hard, using GA and greedy approaches.
6.2.3. Effects of Different Numbers of UAVs
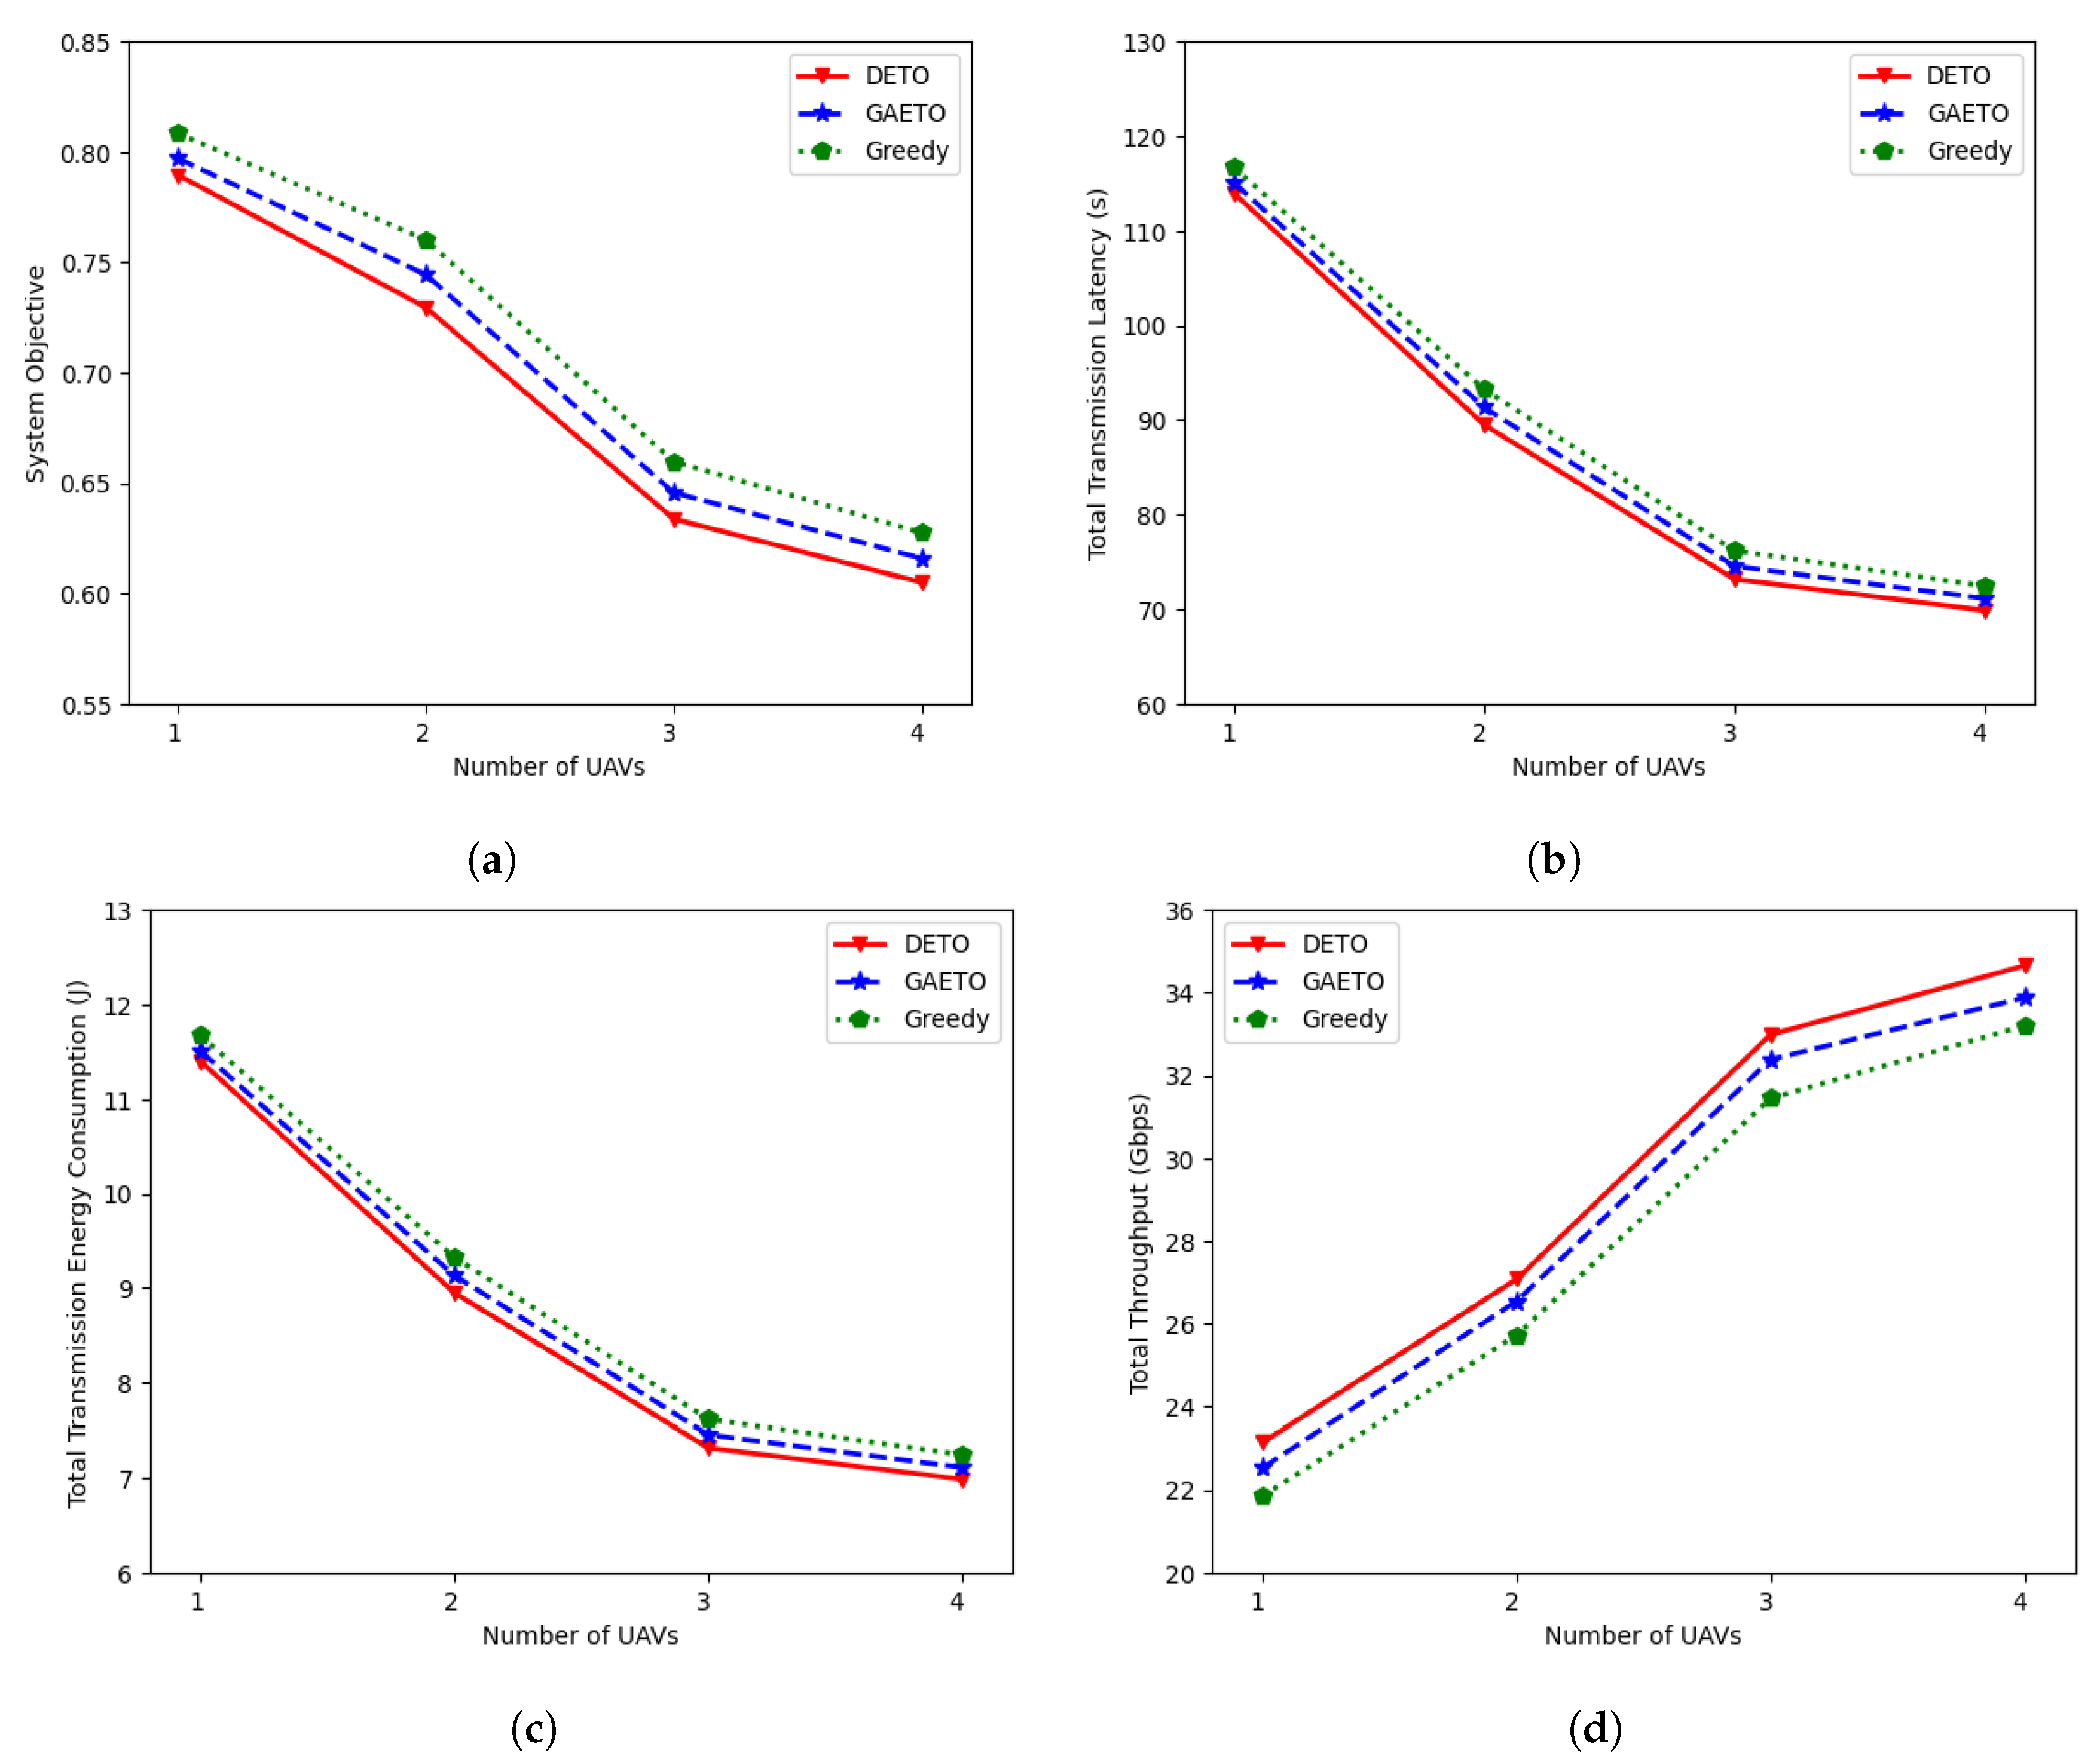
The performance of DETO was evaluated across a range of UAV counts, varying from one to four, by considering the system objective, total latency, total transmission energy consumption, and total throughput. Figure 8a illustrates a decrease in the system objective as the number of UAVs rises. As the UAVs increase in number from one to two, then to three, and to four, the system objective of DETO decreases by 7.60%, 13.13%, and 4.53%, respectively. Similarly, GAETO decreases by 6.60%, 13.27%, and 4.60%, respectively, while the greedy approach records reductions of 5.97%, 13.21%, and 4.88%, respectively. Additionally, at the relevant UAV count intervals, DETO consistently outperforms the greedy technique by 2.33%, 4.03%, 3.94%, and 3.58%, respectively.
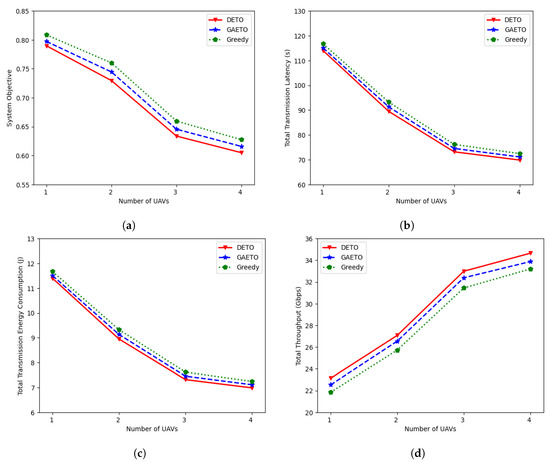
Figure 8.
Effects of different numbers of UAVs: (a) effects on the system objective; (b) effects on the total transmission latency; (c) effects on total transmission energy consumption; (d) effects on total throughput.
For different numbers of UAVs, Figure 8b,c compare the total transmission latency and transmission energy consumption for all algorithms; significantly, DETO performs better than the alternatives. The transmission latency and the transmission energy consumption of MDs tend to reduce as the number of UAVs rises because the increased accessibility of UAVs enables more efficient task offloading. The average distance between MDs and UAVs reduces as the number of UAVs rises. Due to the shorter travel distance, data transfer takes less time and energy, resulting in reduced latency and lower energy consumption for MDs. For example, when the number of UAVs increases from three to four, the transmission latency of DETO, GAETO, and greedy decreases from 73.16 s to 69.84 s, from 74.53 s to 71.09 s, and from 76.16 s to 72.44 s, respectively. Similarly, the transmission energy consumption of DETO, GAETO, and greedy decreases from 7.31 J to 6.98 J, from 7.45 J to 7.10 J, and from 7.61 J to 7.24 J, respectively.
As the number of UAVs increases, Figure 8d illustrates the corresponding growth in total throughput. This increase is because data transmission speeds can be boosted by reducing the distance between sending and receiving points with more UAVs. With the rise of UAVs, the performance of DETO improves by 17.02%, 21.84%, and 5.03%, respectively. Notably, the degree of improvement is slightly lower when the number of UAVs changes from three to four. This happens because the distances between MDs and UAVs do not change noticeably when there are three UAVs in the environment compared to when there are four UAVs. The DETO solution achieves higher throughput compared to GAETO and the greedy approach with the increasing number of UAVs. For example, the total throughput of DETO is 2.27% and 4.36% higher than that of the GAETO and greedy approaches, respectively, with four UAVs.
7. Conclusions
In this study, we focused on a multi-UAV-assisted MEC system deployed in a festival area. The UAVs followed ellipsoidal trajectories, to provide MEC services to MDs that had latency-sensitive and computation-intensive applications, each with diverse task offloading requests. To enhance the system’s efficiency, we formulated an optimization problem aimed at minimizing the weighted sum that encompassed both the total transmission latency and the total transmission energy consumption experienced by the MDs. This optimization approach involved the optimization of the key parameters that defined the UAVs’ ellipsoidal trajectories: specifically, the center position, the major radius, the minor radius, and the rotation angle. These trajectory adjustments precisely dictated the UAVs’ position and size and the shape of their elliptical movements. Furthermore, the problem accounted for constraints related to required throughput, transmission time, and energy consumption. We developed a DRL framework called DETO to effectively address the challenges posed by a vast state space and a high-dimensional action space. To determine the effectiveness of our proposed DETO method, we conducted comparative evaluations against two alternative approaches. These evaluations were carried out across diverse scenarios, encompassing varying numbers of MDs, distinct task request rates, and different numbers of UAVs. The results illustrated the efficiency of DETO in optimizing the ellipsoidal trajectory for each UAV, resulting in reductions in both the transmission latency and the transmission energy consumption of the MDs. Furthermore, when the number of users and task request rates increased, we observed an accompanying rise in both the transmission latency and the transmission energy consumption of the MDs. This phenomenon was attributed to the increased task requests, which naturally led to higher demands on the system. Conversely, when the number of UAVs was increased, both the transmission latency and the transmission energy consumption decreased, owing to the reduced distance between the MDs and the UAVs. Overall, the simulation results demonstrated that the DETO framework outperformed the baselines, due to its ability to learn from experiences and iteratively enhance solutions, establishing a significant advantage in various scenarios.
For future work, we aim to enhance the existing framework by considering additional optimizing variables, including the height of the UAV, taking into account the dynamic mobility of MDs within the festival area. In addition to optimizing task transmission latency and energy consumption, we will extend our objectives, to include the minimization of the total task completion time (including task transmission and processing time when offloaded to the UAV) and the overall system’s energy consumption. We plan to apply a more advanced RL method and to investigate the effect of varying on the system’s objective.
Author Contributions
Conceptualization, R.S., S.A. and S.Y.; methodology, R.S., S.A. and S.Y.; software, R.S.; validation, R.S.; formal analysis, R.S., S.A. and S.Y.; investigation, R.S., S.A. and S.Y.; resources, R.S., S.A. and S.Y.; data curation, R.S., S.A. and S.Y.; writing—original draft preparation, R.S., S.A. and S.Y.; writing—review and editing, R.S., S.A. and S.Y.; visualization, R.S., S.A. and S.Y.; supervision, S.Y.; project administration, S.Y.; funding acquisition, S.Y. All authors have read and agreed to the published version of the manuscript.
Funding
This work was supported by the Basic Science Research Program through the National Research Foundation of Korea (NRF) funded by the Ministry of Education under Grant 2021R1I1A3051364.
Institutional Review Board Statement
Not applicable.
Informed Consent Statement
Not applicable.
Data Availability Statement
Data are contained within the article.
Conflicts of Interest
The authors declare no conflict of interest.
References
- Grubert, J.; Langlotz, T.; Zollmann, S.; Regenbrecht, H. Towards pervasive augmented reality: Context-awareness in augmented reality. IEEE Trans. Vis. Comput. Graph. 2016, 23, 1706–1724. [Google Scholar] [CrossRef] [PubMed]
- Chen, M.; Saad, W.; Yin, C.; Debbah, M. Data correlation-aware resource management in wireless virtual reality (VR): An echo state transfer learning approach. IEEE Trans. Commun. 2019, 67, 4267–4280. [Google Scholar] [CrossRef]
- Zhang, Y.; Wang, J.; Wang, X.; Dolan, J.M. Road-segmentation-based curb detection method for self-driving via a 3D-LiDAR sensor. IEEE Trans. Intell. Transp. Syst. 2018, 19, 3981–3991. [Google Scholar] [CrossRef]
- Ananthanarayanan, G.; Bahl, P.; Bodík, P.; Chintalapudi, K.; Philipose, M.; Ravindranath, L.; Sinha, S. Real-time video analytics: The killer app for edge computing. Computer 2017, 50, 58–67. [Google Scholar] [CrossRef]
- Soh, J.O.; Tan, B.C. Mobile gaming. Commun. ACM 2008, 51, 35–39. [Google Scholar] [CrossRef]
- Elgendy, I.A.; Meshoul, S.; Hammad, M. Joint Task Offloading, Resource Allocation, and Load-Balancing Optimization in Multi-UAV-Aided MEC Systems. Appl. Sci. 2023, 13, 2625. [Google Scholar] [CrossRef]
- Kim, Y.G.; Kong, J.; Chung, S.W. A survey on recent OS-level energy management techniques for mobile processing units. IEEE Trans. Parallel Distrib. Syst. 2018, 29, 2388–2401. [Google Scholar] [CrossRef]
- Han, W.; Su, J.; Lv, S.; Zhang, P.; Li, X. Task Offloading Strategies for Cloud-Side Cooperation in Compute-Intensive Scenarios Based on Edge Computing. In Proceedings of the 2022 21st International Symposium on Communications and Information Technologies (ISCIT), Xi’an, China, 27–30 September 2022; pp. 148–153. [Google Scholar]
- Mao, Y.; You, C.; Zhang, J.; Huang, K.; Letaief, K.B. A survey on mobile edge computing: The communication perspective. IEEE Commun. Surv. Tutorials 2017, 19, 2322–2358. [Google Scholar] [CrossRef]
- Abbas, N.; Zhang, Y.; Taherkordi, A.; Skeie, T. Mobile edge computing: A survey. IEEE Internet Things J. 2018, 5, 450–465. [Google Scholar] [CrossRef]
- Djigal, H.; Xu, J.; Liu, L.; Zhang, Y. Machine and deep learning for resource allocation in multi-access edge computing: A survey. IEEE Commun. Surv. Tutorials 2022, 24, 2449–2494. [Google Scholar] [CrossRef]
- Yang, J.; Yuan, Q.; Chen, S.; He, H.; Jiang, X.; Tan, X. Cooperative Task Offloading for Mobile Edge Computing Based on Multi-Agent Deep Reinforcement Learning. IEEE Trans. Netw. Serv. Manag. 2023, 20, 3205–3219. [Google Scholar] [CrossRef]
- Zhang, K.; Gui, X.; Ren, D.; Li, D. Energy–latency tradeoff for computation offloading in UAV-assisted multiaccess edge computing system. IEEE Internet Things J. 2020, 8, 6709–6719. [Google Scholar] [CrossRef]
- Kar, B.; Yahya, W.; Lin, Y.D.; Ali, A. Offloading using traditional optimization and machine learning in federated cloud-edge-fog systems: A survey. IEEE Commun. Surv. Tutorials 2023, 25, 1199–1226. [Google Scholar] [CrossRef]
- Yu, Z.; Gong, Y.; Gong, S.; Guo, Y. Joint task offloading and resource allocation in UAV-enabled mobile edge computing. IEEE Internet Things J. 2020, 7, 3147–3159. [Google Scholar] [CrossRef]
- Zhou, Y.; Pan, C.; Yeoh, P.L.; Wang, K.; Elkashlan, M.; Vucetic, B.; Li, Y. Secure communications for UAV-enabled mobile edge computing systems. IEEE Trans. Commun. 2019, 68, 376–388. [Google Scholar] [CrossRef]
- Yang, Z.; Pan, C.; Wang, K.; Shikh-Bahaei, M. Energy efficient resource allocation in UAV-enabled mobile edge computing networks. IEEE Trans. Wirel. Commun. 2019, 18, 4576–4589. [Google Scholar] [CrossRef]
- Zhan, C.; Hu, H.; Liu, Z.; Wang, Z.; Mao, S. Multi-UAV-enabled mobile-edge computing for time-constrained IoT applications. IEEE Internet Things J. 2021, 8, 15553–15567. [Google Scholar] [CrossRef]
- Košmerl, J.; Vilhar, A. Base stations placement optimization in wireless networks for emergency communications. In Proceedings of the 2014 IEEE International Conference on Communications Workshops (ICC), Sydney, NSW, Australia, 10–14 June 2014; pp. 200–205. [Google Scholar]
- Moon, I.; Dung, L.T.; Kim, T. Optimal 3D placement of UAV-BS for maximum coverage subject to user priorities and distributions. Electronics 2022, 11, 1036. [Google Scholar] [CrossRef]
- Lyu, J.; Zeng, Y.; Zhang, R.; Lim, T.J. Placement optimization of UAV-mounted mobile base stations. IEEE Commun. Lett. 2016, 21, 604–607. [Google Scholar] [CrossRef]
- Valiulahi, I.; Masouros, C. Multi-UAV deployment for throughput maximization in the presence of co-channel interference. IEEE Internet Things J. 2020, 8, 3605–3618. [Google Scholar] [CrossRef]
- Lyu, J.; Zeng, Y.; Zhang, R. Cyclical multiple access in UAV-aided communications: A throughput-delay tradeoff. IEEE Wirel. Commun. Lett. 2016, 5, 600–603. [Google Scholar] [CrossRef]
- Zeng, Y.; Zhang, R.; Lim, T.J. Throughput maximization for UAV-enabled mobile relaying systems. IEEE Trans. Commun. 2016, 64, 4983–4996. [Google Scholar] [CrossRef]
- Zeng, Y.; Zhang, R. Energy-efficient UAV communication with trajectory optimization. IEEE Trans. Wirel. Commun. 2017, 16, 3747–3760. [Google Scholar] [CrossRef]
- Yu, P.; Guo, J.; Huo, Y.; Shi, X.; Wu, J.; Ding, Y. Three-dimensional aerial base station location for sudden traffic with deep reinforcement learning in 5G mmWave networks. Int. J. Distrib. Sens. Networks 2020, 16, 1550147720926374. [Google Scholar] [CrossRef]
- Liu, X.; Liu, Y.; Chen, Y. Reinforcement learning in multiple-UAV networks: Deployment and movement design. IEEE Trans. Veh. Technol. 2019, 68, 8036–8049. [Google Scholar] [CrossRef]
- Zhao, N.; Ye, Z.; Pei, Y.; Liang, Y.C.; Niyato, D. Multi-agent deep reinforcement learning for task offloading in UAV-assisted mobile edge computing. IEEE Trans. Wirel. Commun. 2022, 21, 6949–6960. [Google Scholar] [CrossRef]
- Wang, L.; Wang, K.; Pan, C.; Xu, W.; Aslam, N.; Nallanathan, A. Deep reinforcement learning based dynamic trajectory control for UAV-assisted mobile edge computing. IEEE Trans. Mob. Comput. 2021, 21, 3536–3550. [Google Scholar] [CrossRef]
- Wang, Y.; Ru, Z.-Y.; Wang, K.; Huang, P.-Q. Joint Deployment and Task Scheduling Optimization for Large-Scale Mobile Users in Multi-UAV-Enabled Mobile Edge Computing. IEEE Trans. Cybern. 2020, 50, 3984–3997. [Google Scholar] [CrossRef]
- Kelleher, J.D. Deep Learning; MIT Press: Cambridge, MA, USA, 2019. [Google Scholar]
- Arulkumaran, K.; Deisenroth, M.P.; Brundage, M.; Bharath, A.A. Deep reinforcement learning: A brief survey. IEEE Signal Process. Mag. 2017, 34, 26–38. [Google Scholar] [CrossRef]
- Sutton, R.S.; Barto, A.G. Reinforcement Learning: An Introduction; MIT Press: Cambridge, MA, USA, 2018. [Google Scholar]
- Kaur, A.; Kumar, K. Energy-efficient resource allocation in cognitive radio networks under cooperative multi-agent model-free reinforcement learning schemes. IEEE Trans. Netw. Serv. Manag. 2020, 17, 1337–1348. [Google Scholar] [CrossRef]
- Zheng, K.; Jia, X.; Chi, K.; Liu, X. DDPG-based joint time and energy management in ambient backscatter-assisted hybrid underlay CRNs. IEEE Trans. Commun. 2022, 71, 441–456. [Google Scholar] [CrossRef]
- Lee, G.; Jung, M.; Kasgari, A.T.Z.; Saad, W.; Bennis, M. Deep reinforcement learning for energy-efficient networking with reconfigurable intelligent surfaces. In Proceedings of the ICC 2020—2020 IEEE International Conference on Communications (ICC), Dublin, Ireland, 7–11 June 2020; pp. 1–6. [Google Scholar]
- Savaglio, C.; Pace, P.; Aloi, G.; Liotta, A.; Fortino, G. Lightweight reinforcement learning for energy efficient communications in wireless sensor networks. IEEE Access 2019, 7, 29355–29364. [Google Scholar] [CrossRef]
- Zhu, B.; Bedeer, E.; Nguyen, H.H.; Barton, R.; Henry, J. UAV trajectory planning in wireless sensor networks for energy consumption minimization by deep reinforcement learning. IEEE Trans. Veh. Technol. 2021, 70, 9540–9554. [Google Scholar] [CrossRef]
- Akter, S.; Dao, T.N.; Yoon, S. Time-constrained task allocation and worker routing in mobile crowd-sensing using a decomposition technique and deep Q-learning. IEEE Access 2021, 9, 95808–95822. [Google Scholar] [CrossRef]
- Zheng, Y.; Xie, X.; Ma, W. Geolife: A collaborative social networking service among user, location and trajectory. IEEE Data Eng. Bull. 2010, 33, 32–39. [Google Scholar]
- Belmonte, L.M.; García, A.S.; Morales, R.; de la Vara, J.L.; López de la Rosa, F.; Fernández-Caballero, A. Feeling of safety and comfort towards a socially assistive unmanned aerial vehicle that monitors people in a virtual home. Sensors 2021, 21, 908. [Google Scholar] [CrossRef]
- Chen, Y.; Li, N.; Zhong, X.; Xie, W. Joint trajectory and scheduling optimization for the mobile UAV aerial base station: A fairness version. Appl. Sci. 2019, 9, 3101. [Google Scholar] [CrossRef]
- Chen, X.; Yang, Z.; Zhao, N.; Chen, Y.; Wang, J.; Ding, Z.; Yu, F.R. Secure transmission via power allocation in NOMA-UAV networks with circular trajectory. IEEE Trans. Veh. Technol. 2020, 69, 10033–10045. [Google Scholar] [CrossRef]
- Al-Hourani, A.; Kandeepan, S.; Lardner, S. Optimal LAP altitude for maximum coverage. IEEE Wirel. Commun. Lett. 2014, 3, 569–572. [Google Scholar] [CrossRef]
- Al-Hourani, A.; Kandeepan, S.; Jamalipour, A. Modeling air-to-ground path loss for low altitude platforms in urban environments. In Proceedings of the 2014 IEEE Global Communications Conference, Austin, TX, USA, 8–12 December 2014; pp. 2898–2904. [Google Scholar]
- Li, X.; Zhou, L.; Sun, Y.; Ulziinyam, B. Multi-task offloading scheme for UAV-enabled fog computing networks. Eurasip J. Wirel. Commun. Netw. 2020, 2020, 230. [Google Scholar] [CrossRef]
- Puterman, M.L. Markov Decision Processes: Discrete Stochastic Dynamic Programming; John Wiley & Sons: Hoboken, NJ, USA, 2014. [Google Scholar]
- Watkins, C.J.C.H.; Dayan, P. Q-learning. Mach. Learn. 1992, 8, 279–292. [Google Scholar] [CrossRef]
- Mnih, V.; Kavukcuoglu, K.; Silver, D.; Rusu, A.A.; Veness, J.; Bellemare, M.G.; Graves, A.; Riedmiller, M.; Fidjeland, A.K.; Ostrovski, G.; et al. Human-level control through deep reinforcement learning. Nature 2015, 518, 529–533. [Google Scholar] [CrossRef] [PubMed]
- Lyu, L.; Zeng, F.; Xiao, Z.; Zhang, C.; Jiang, H.; Havyarimana, V. Computation bits maximization in uav-enabled mobile-edge computing system. IEEE Internet Things J. 2021, 9, 10640–10651. [Google Scholar] [CrossRef]
- Zhang, J.; Zeng, Y.; Zhang, R. Spectrum and energy efficiency maximization in UAV-enabled mobile relaying. In Proceedings of the 2017 IEEE International Conference on Communications (ICC), Paris, France, 21–25 May 2017; pp. 1–6. [Google Scholar]


Disclaimer/Publisher’s Note: The statements, opinions and data contained in all publications are solely those of the individual author(s) and contributor(s) and not of MDPI and/or the editor(s). MDPI and/or the editor(s) disclaim responsibility for any injury to people or property resulting from any ideas, methods, instructions or products referred to in the content. |
© 2023 by the authors. Licensee MDPI, Basel, Switzerland. This article is an open access article distributed under the terms and conditions of the Creative Commons Attribution (CC BY) license (https://creativecommons.org/licenses/by/4.0/).