Article

Investigation of the Application of Complex Function Theory in Underground Mine Design: A Case Study

1
School of Resource Environment and Safety Engineering, University of South China, Hengyang 412001, China
2
School of Civil, Mining and Environmental Engineering, University of Wollongong, Wollongong, NSW 2522, Australia
*
Author to whom correspondence should be addressed.
Appl. Sci. 2023, 13(22), 12142; https://doi.org/10.3390/app132212142
Submission received: 12 October 2023 / Revised: 26 October 2023 / Accepted: 27 October 2023 / Published: 8 November 2023

Abstract

:
This study, with the engineering background of the design of a stope involving a sublevel mining method in a certain underground metal mine, explored the application of stress-solving methods based on the complex variable function theory in actual engineering. Three mathematical calculation models based on the functions of a complex variable were established. Through triangle interpolation, mapping functions of a plane with a roadway section and a plane with the stope section were determined. An improved Schwarz alternating method was adopted to study the stability of the roadway and the influence of an adjacent roadway from the perspective of the stress field. In addition, in light of the distribution characteristics of a gangue in the stope, the design parameters of a pillar were optimized, with the pillar’s optimal dimensions determined. The results showed that when the magnitudes of two far-field principal stresses in the rock mass are relatively close, the distribution of the surrounding rock stress around the roadway is more uniform, and tensile stress is less likely to occur. The excavation of a neighboring roadway exacerbates to some extent the side stress of the other roadway, especially the compressive stress concentration on the side closer to the neighboring roadway. However, when the distance between the two roadways is significantly larger than the roadway size, this effect is not pronounced. In the engineering case studied in this research, the thickness of the pillar is approximately linearly positively correlated with the safety factor of the pillar approximately linearly negatively correlated with the recovery rate. Overall, this research explored the application of the complex variable function theory in an underground mine design, demonstrating its accuracy and practicality.

1. Introduction

In recent years, the demand for efficient and safe underground excavations and mining operations has significantly increased. Ensuring the stability of these subterranean structures is crucial to preventing accidents and maintaining operational efficacy. One of the challenging aspects of underground engineering is understanding and managing the stress distribution within the surrounding rock masses, especially when there are natural or man-made openings.
The complex function theory, particularly the concepts of conformal mapping and the functions of a complex variable, has become a critical tool in the analysis of stress distribution around excavations in rock masses. The theory allows for a more accurate analytical solution for rock stress, especially around structures like tunnels in a homogeneous, isotropic elastic rock mass. The complex function theory has been utilized in a more sophisticated manner to study the stability of tunnel-surrounding rock in underground rock engineering. Cai et al. [1] presented an analytical stress solution for a circular tunnel in a half-plane subjected to a concentrated force. The complex variable function method is employed to derive the closed-form solutions for the stress field, displacement field the support pressure of the tunnel. The solutions are validated using numerical analysis and are found to be accurate. Cao et al. [2] focused on deriving an analytical solution for stress around a shallow buried lined circular tunnel under the deformation of the surrounding rock’s inner edge by combining the complex potential functions with the conformal mapping method, which can be useful in the design and analysis of tunnel structures in the rock engineering field. Wang et al. [3] delved into the deformation and stress theory concerning the surrounding rock of a shallow circular tunnel, setting up a bipotential stress potential complex function to explore the relationship between stress components, strain components stress potential functions, employing the complex variable function method for the analysis.
The existing research largely focuses on the stress issues of underground circular tunnels explores them through the lens of the complex variable theory. Through these works, expressions for relevant stress components around such tunnel structures are derived, contributing to the understanding and analysis of stress and deformation in circular tunnels under various conditions. Generally, circular tunnels, with their simplistic shape, can easily be analyzed by linear mapping functions, linking them to the corresponding unit circle on the plane, thus simplifying the solving process. Whether dealing with a single circular tunnel or double circular tunnels, the related research has matured significantly [4]. However, in reality, underground rock formations encompass a variety of tunnel shapes, not limited to simple forms like circles or ellipses but also including rectangles, trapezoids, straight-wall arch shapes various other geometric configurations of underground spatial structures. Although the basic principles of solving stress problems of circular tunnels using complex variables remain consistent, the complex shapes of these other forms make the stress equilibrium conditions at the tunnel boundaries significantly more complicated, thereby increasing the difficulty of solving such problems. A considerable amount of research has been conducted on rock engineering issues of a single opening, employing the conformal mapping method in conjunction with the complex variable theory for the analysis [5,6]. Tan et al. [7,8] introduced the use of the Box composite method and triangular interpolation method for solving the mapping functions of planes with tunnels of complex shapes. Xiao et al. [9] conducted a tunnel construction and surrounding rock stability analysis by focusing on the rock fracture evolution during the construction and operation of straight-walled arched tunnels. Using a complex function, a stress distribution function was established, and the distribution characteristics of the surrounding rock stress field were determined, which could be instrumental in improving tunnel design and construction practices. Tu, S et al. [10] explored the design of a flat-top U-shaped section for mining roadways in three-soft coal seams based on the complex function method, presenting the geometric parameters of such design. This work helps in addressing the challenges faced in roadway support in such coal seams, making a contribution toward safer and more efficient mining operations.
In addition to the aforementioned research, there are studies that have bridged the gap between rock mechanics and other fields such as seepage and thermodynamics, thereby broadening the application scope of the complex variable theory in rock engineering. Antonio [11] elaborated on the stress and deformation analysis for a deep tunnel situated in transversely anisotropic elastic rock when subjected to groundwater seepage, providing closed-form solutions for the stresses and deformations induced both in the ground and the tunnel liner by using the complex variable theory and conformal mapping. The study contributed to the understanding of the complex interplay between geological conditions, groundwater flow the structural integrity of deep tunnels, which is crucial for ensuring the safety and stability of such underground structures. Cheng et al. [12] delved into the challenges posed by temperature variations in the stress analysis of deep buried circular tunnels and presented a method to address the stress field of a deep buried circular-lining tunnel under the combined effects of an unsteady temperature field and in situ stress. Their study contributed to the understanding of and methodological advancement in addressing temperature-induced stress variations in tunnel engineering, which is crucial for ensuring the safety and longevity of tunnel structures under varying thermal conditions.
The research introduced above is all targeted towards addressing the issues of a single opening in underground engineering. Utilizing the complex variable functions to compute the stress around complex openings can yield high-precision analytical solutions. With its application in the underground geotechnical field continually increasing, the related theory of solving single complex opening issues using the complex variable functions has become relatively mature. However, when there are two or more openings on the plane, the situation becomes significantly more complex compared to a single opening, due to the mutual interactions between the neighboring openings. The stress functions also become exceedingly complicated. Currently, the Schwarz alternating method is an important method for solving multi-connected domain problems with multiple openings [13,14]. But early research, limited by the computational conditions at the time, generally only completed one iteration, and the solution accuracy needs further enhancement [14,15,16,17]. Later, Lv et al. [18] employed the Schwarz alternating method to analytically solve the area stress field of a double circular opening system. Through two iterations, the solution accuracy was significantly improved. Tan et al. [19] proposed a modified Schwarz alternating method that disregards the inverse mapping function, further enhancing the accuracy of stress function solutions for planes with multiple openings, especially the planes with irregular non-arch-shaped openings.
The studies mentioned above are instrumental in studying stress distribution around a tunnel and understanding the mechanical behavior of both the tunnel and the surrounding rock. The findings can be useful in the design and analysis of tunnel structures in the rock engineering field.
This study, set against the backdrop of a specific underground metal mine, established stress solution models for planes with single and double openings of complex shapes, exploring the application of the complex variable function theory in underground mine stope design. It aimed to shed light on the critical role of the complex function theory in the stress analysis of rock masses with openings, and its broader applications in underground rock engineering and mining design. Through a deeper understanding of the complex function theory, engineers and researchers can better address the challenges faced in these domains, contributing to the advancement of safer and more efficient underground engineering practices.

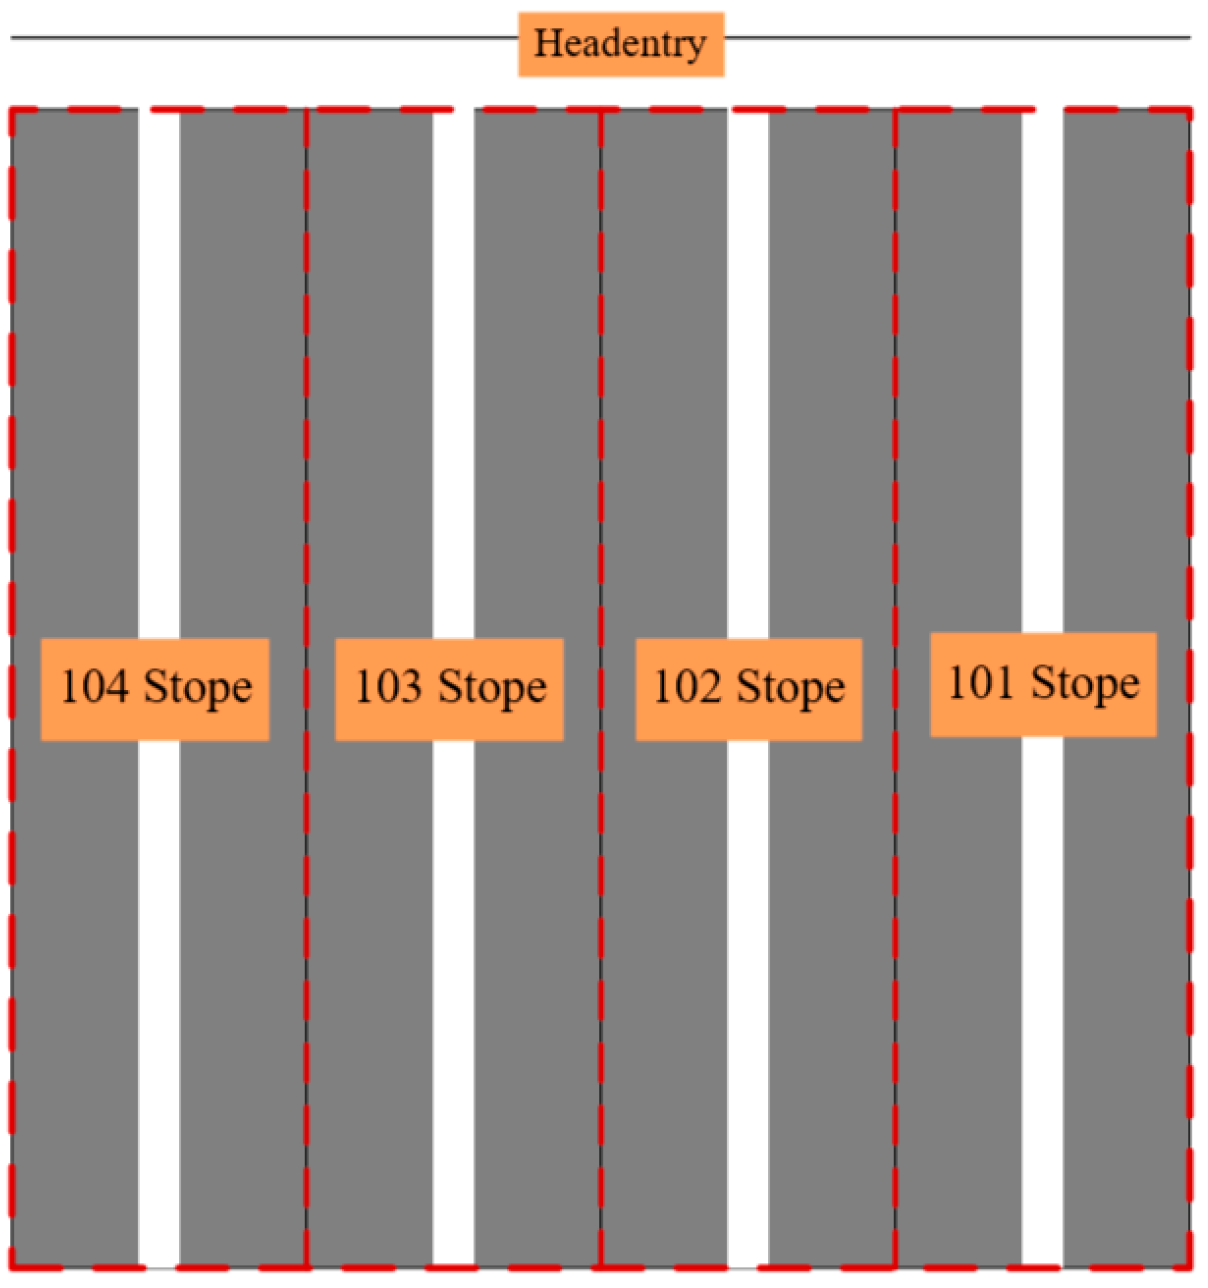
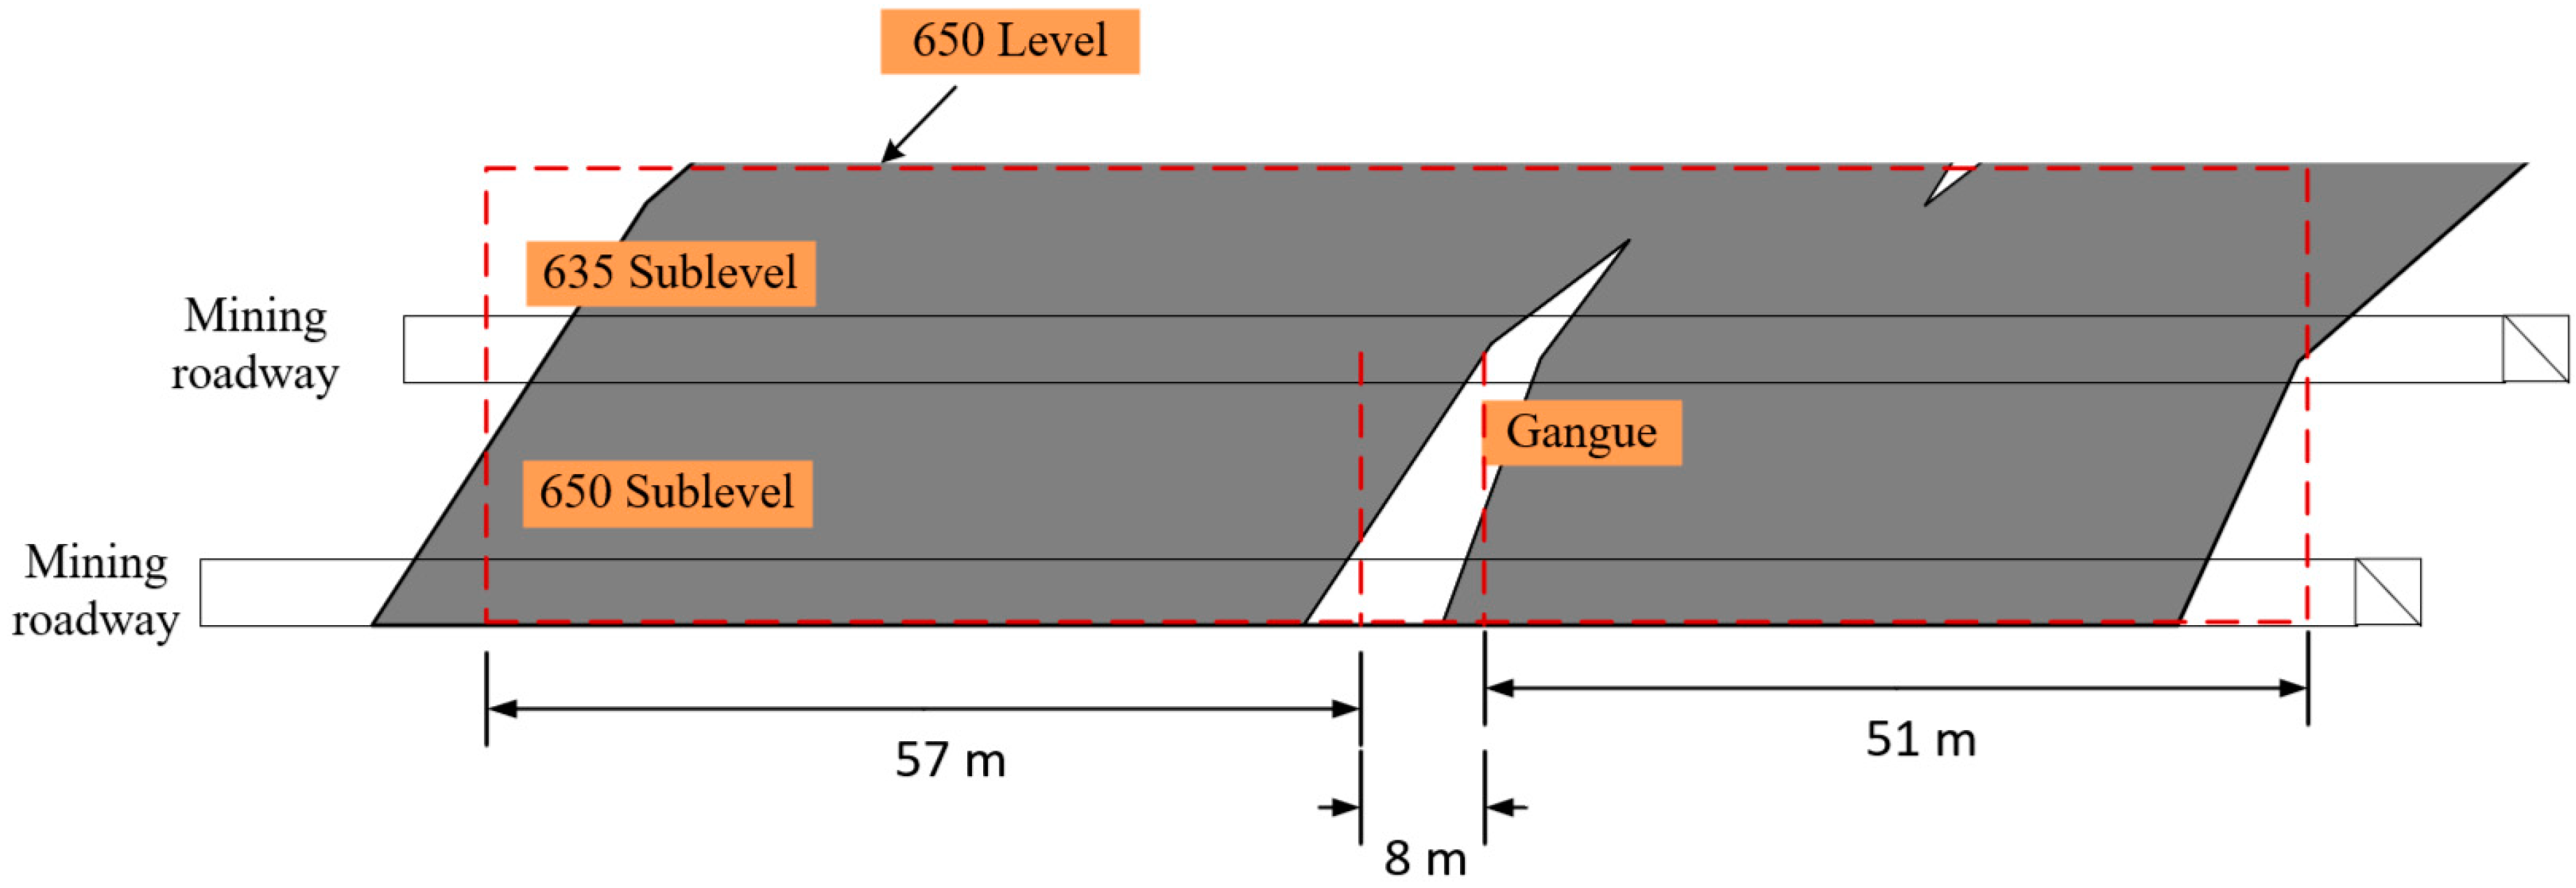
2. Engineering Background

This study used a stope in an underground hard rock metal mine as the engineering background, utilizing theoretical analytical methods to study its surrounding stress field and the mine pillar parameter design. The mining area consists of multiple ore belts, among which, the northern ore belt has reached detailed exploration, with a significant amount of controlled level ore. Both the hanging wall and footwall of the ore body in this belt are made of conglomerate, sandstone silty sandstone, with fine- to medium-grain dense blocky structure, exhibiting hard and stable characteristics without the need for support. Fractures within the ore body are not well-developed and have poor penetration; the ore is of sedimentary metamorphic type relatively hard. To improve the initial economic benefits of the mine and shorten the investment payback period, the mine initially aims to recover ore bodies with greater thickness and higher grades, adhering to a bottom-up mining sequence. The design of the first mining section includes a substantial part of the ore body in the northern ore belt at Level 650 and involves sublevel open stoping followed by backfilling.
Figure 1 and Figure 2 show a schematic diagram of Level 650 stope layout and cross-section of Stope 101 at Level 650 in the northern ore belt, respectively, where the red dashed lines denote the boundaries of the stopes. The designed length of Stope 101 is 116 m. At 51 m from the headentry, there is a gangue with a thickness of about 8 m. To improve the recovery rate and reduce mining standards, it is planned to reserve the gangue area as a mine pillar. In this study, we used Stope 101 as the research object, employing theoretical analytical solutions for the surrounding stress field of the stope to analyze the mine pillar’s design parameters and stope stability. As the mechanical properties of the ore body and surrounding rock in the study area are very similar and exhibit good integrity, they can be analyzed as homogeneous materials. The uniaxial compressive strength of the rock mass in this section is 157.0 MPa. The original stress field of Level 650 was taken as the external stress field in the model, with three principal stresses of 12.3 MPa, 11.6 MPa 9.8 MPa. The direction of the maximum principal stress is essentially consistent with the direction of gravity; hence, in the two-dimensional mathematical model, the rotation of the opening or shear stress need not be considered. The horizontal stress was taken as the average value, the vertical stress was 12.3 MPa, and the lateral pressure coefficient λ was 0.86. According to the actual engineering needs, three sets totaling 27 models were established. The first set of the models was used to study the characteristics of surrounding rock stress around the roadways of a single stope. The second set of the models was used to study the influence of the adjacent roadway on the existing roadway. The third set of the models, based on the distribution characteristics of the gangue in the studied stope, was used for the pillar’s parameter optimization design. The above three sets of mathematical calculation models were analyzed from the stress field perspective for the stope stability and pillar parameter design in accordance with the actual operational sequence. These mathematical calculation models were solved using self-developed Python 3.11 and MATLAB 2021 programs.

3. Results and Analysis

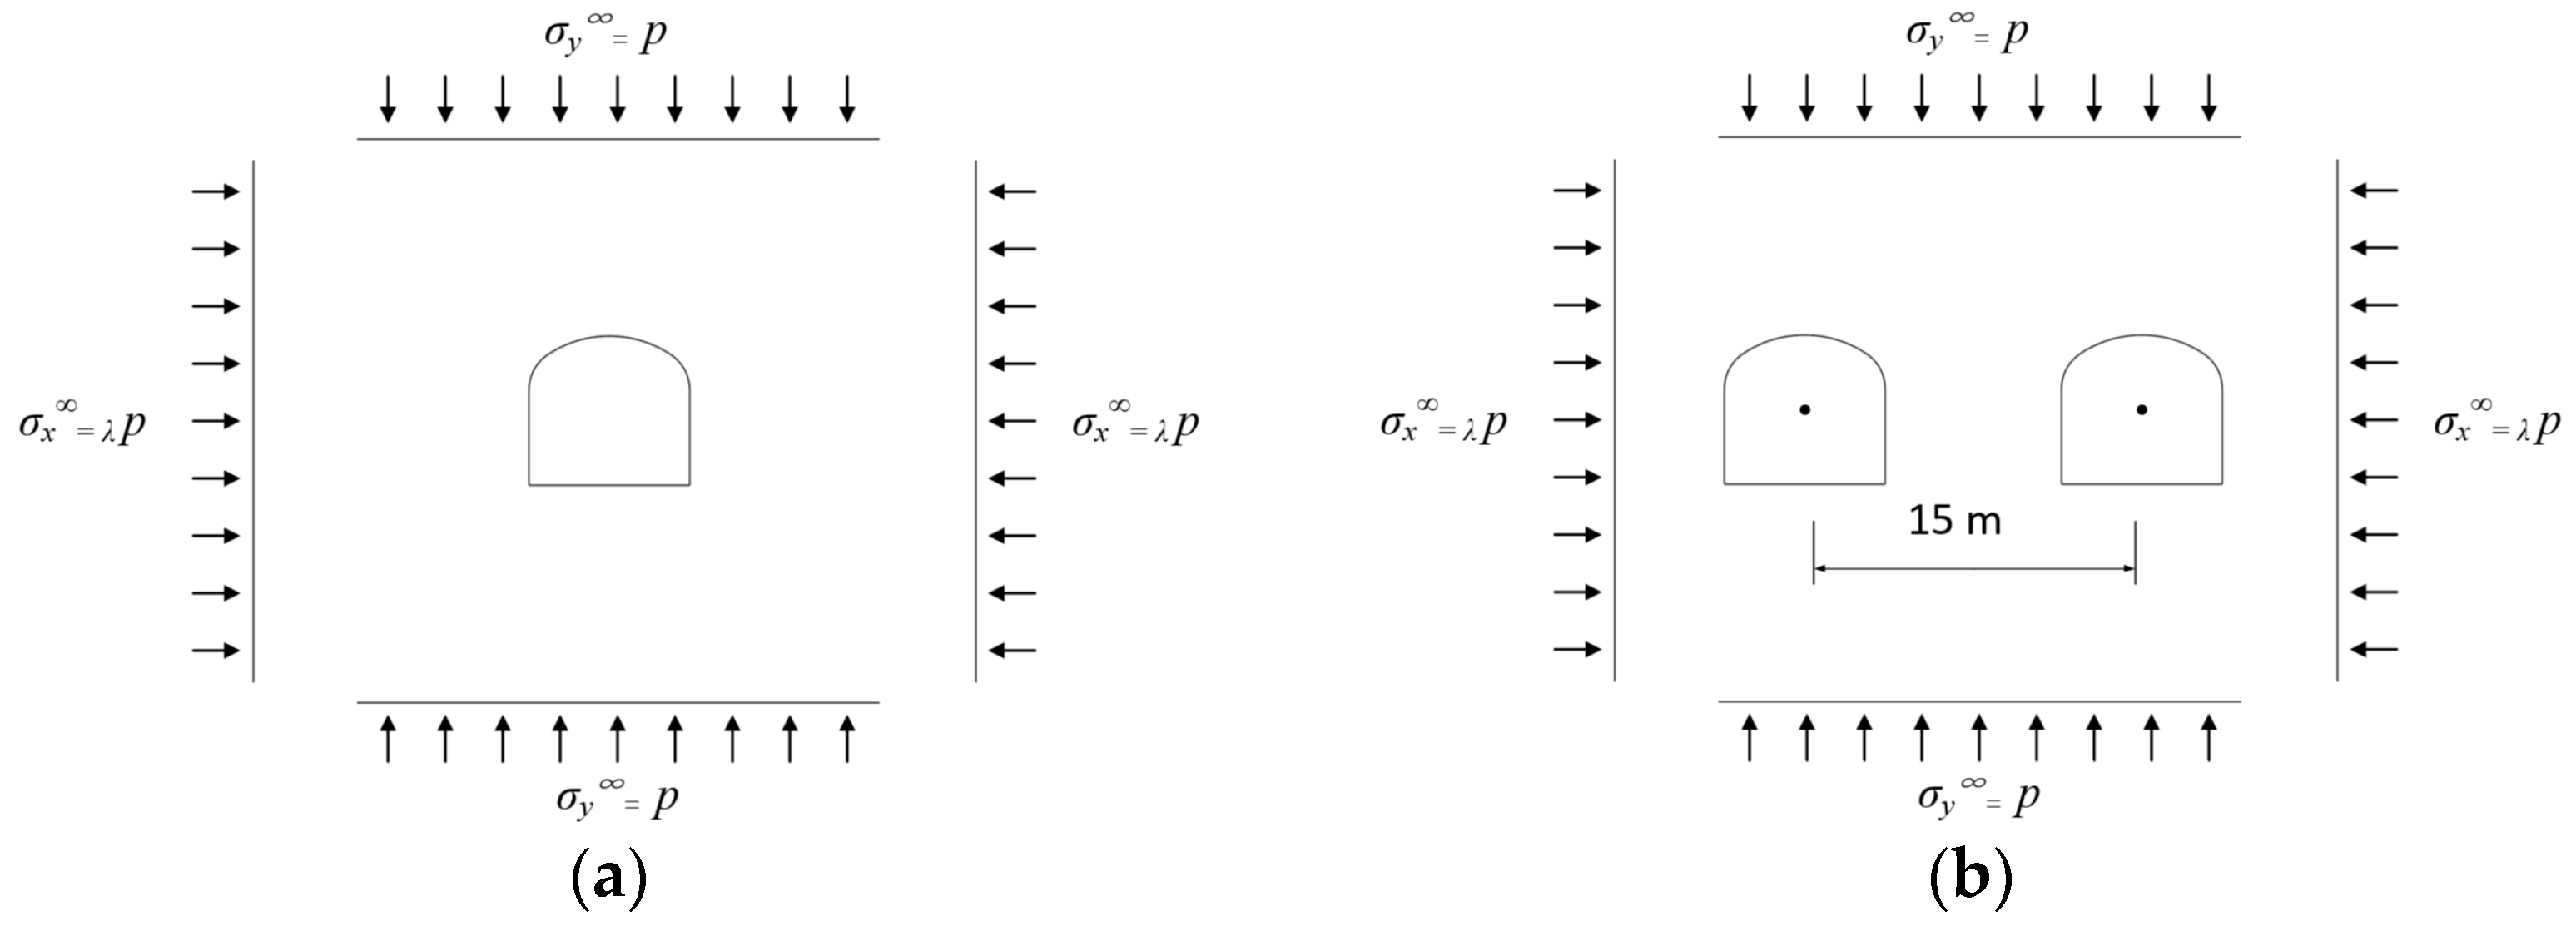
3.1. Calculation Models

This research includes three sets of calculation models: the calculation model for a plane containing a single roadway, the calculation model for a plane containing two roadways and the calculation model for a plane containing two rectangular openings. Following the sequence of the actual mining operations, the stress characteristics of a single roadway, the influence of the adjacent roadway on the existing roadway, and the optimal size parameters of the reserved pillars in Stope 101 were analyzed successively based on these calculation models.
After the completion of the development of Level 650, according to the mining sequence, the design of Stope 101 as shown in Figure 1 was carried out first. All the recovery roadways in this level are tri-center arch roadways, with a cross-sectional dimension of 4.2 m × 3.9 m and a span-to-rise ratio of 0.36. The calculation model of the surrounding rock mass of the roadway is shown in Figure 3a, where σ x represents the far-field horizontal stress, and σ y represents the far-field vertical stress.
Upon the excavation of the adjacent roadway, there may be an impact on the stress state of the surrounding rock of the existing roadway. Therefore, in stope design, when two roadways are relatively close to each other, it is necessary to evaluate the mutual influence on the stress field between them. In the case studied in this research, the distance between the recovery roadways of two adjacent stopes is 15 m. Taking the recovery roadway of Stope 101 as the subject of study, the impact on the stress field around the recovery roadway of Stope 101 after the excavation of the recovery roadway in stope 102 was investigated. The stress field calculation model of the dual-roadway system is illustrated in Figure 3b.
As seen in the stope’s cross-sectional diagram (Figure 2), there is a gangue (waste rock) located at the position of 51 m into the stope, with a thickness of about 8 m. To improve the recovery rate, it was proposed to reserve the area where the gangue is located as a reserved pillar. To determine the optimal size of the pillar, the calculation model as shown in Figure 4 was established in this study, where w represents the width of the pillar. The ore body on both sides of the pillar is recovered through medium deep-hole blasting, forming rectangularly shaped openings. This calculation model aimed to determine the optimal size of the pillar by establishing the relationship between the pillar width and the safety coefficient of the pillar as well as the recovery rate.

3.2. Characteristics of Stress Distribution around a Single Roadway

For deep roadways, chambers other cavities in underground rock masses, the surrounding rock stress can be analyzed as the plane strain problems. According to the theory of elasticity, for openings with circular shapes, the analytic solutions of the surrounding stress field can be directly obtained through real-variable functions. On the other hand, for other non-circular openings of complex shapes like tri-center arche roadways, the unit circle can be obtained through the conformal mapping combined with the complex variable method to determine their external stress fields. The process of solving the functions of the external stress field of non-circular openings includes two core issues: one is to determine the mapping function for the conformal mapping, and the other is to determine the stress function of the external stress field of the opening.

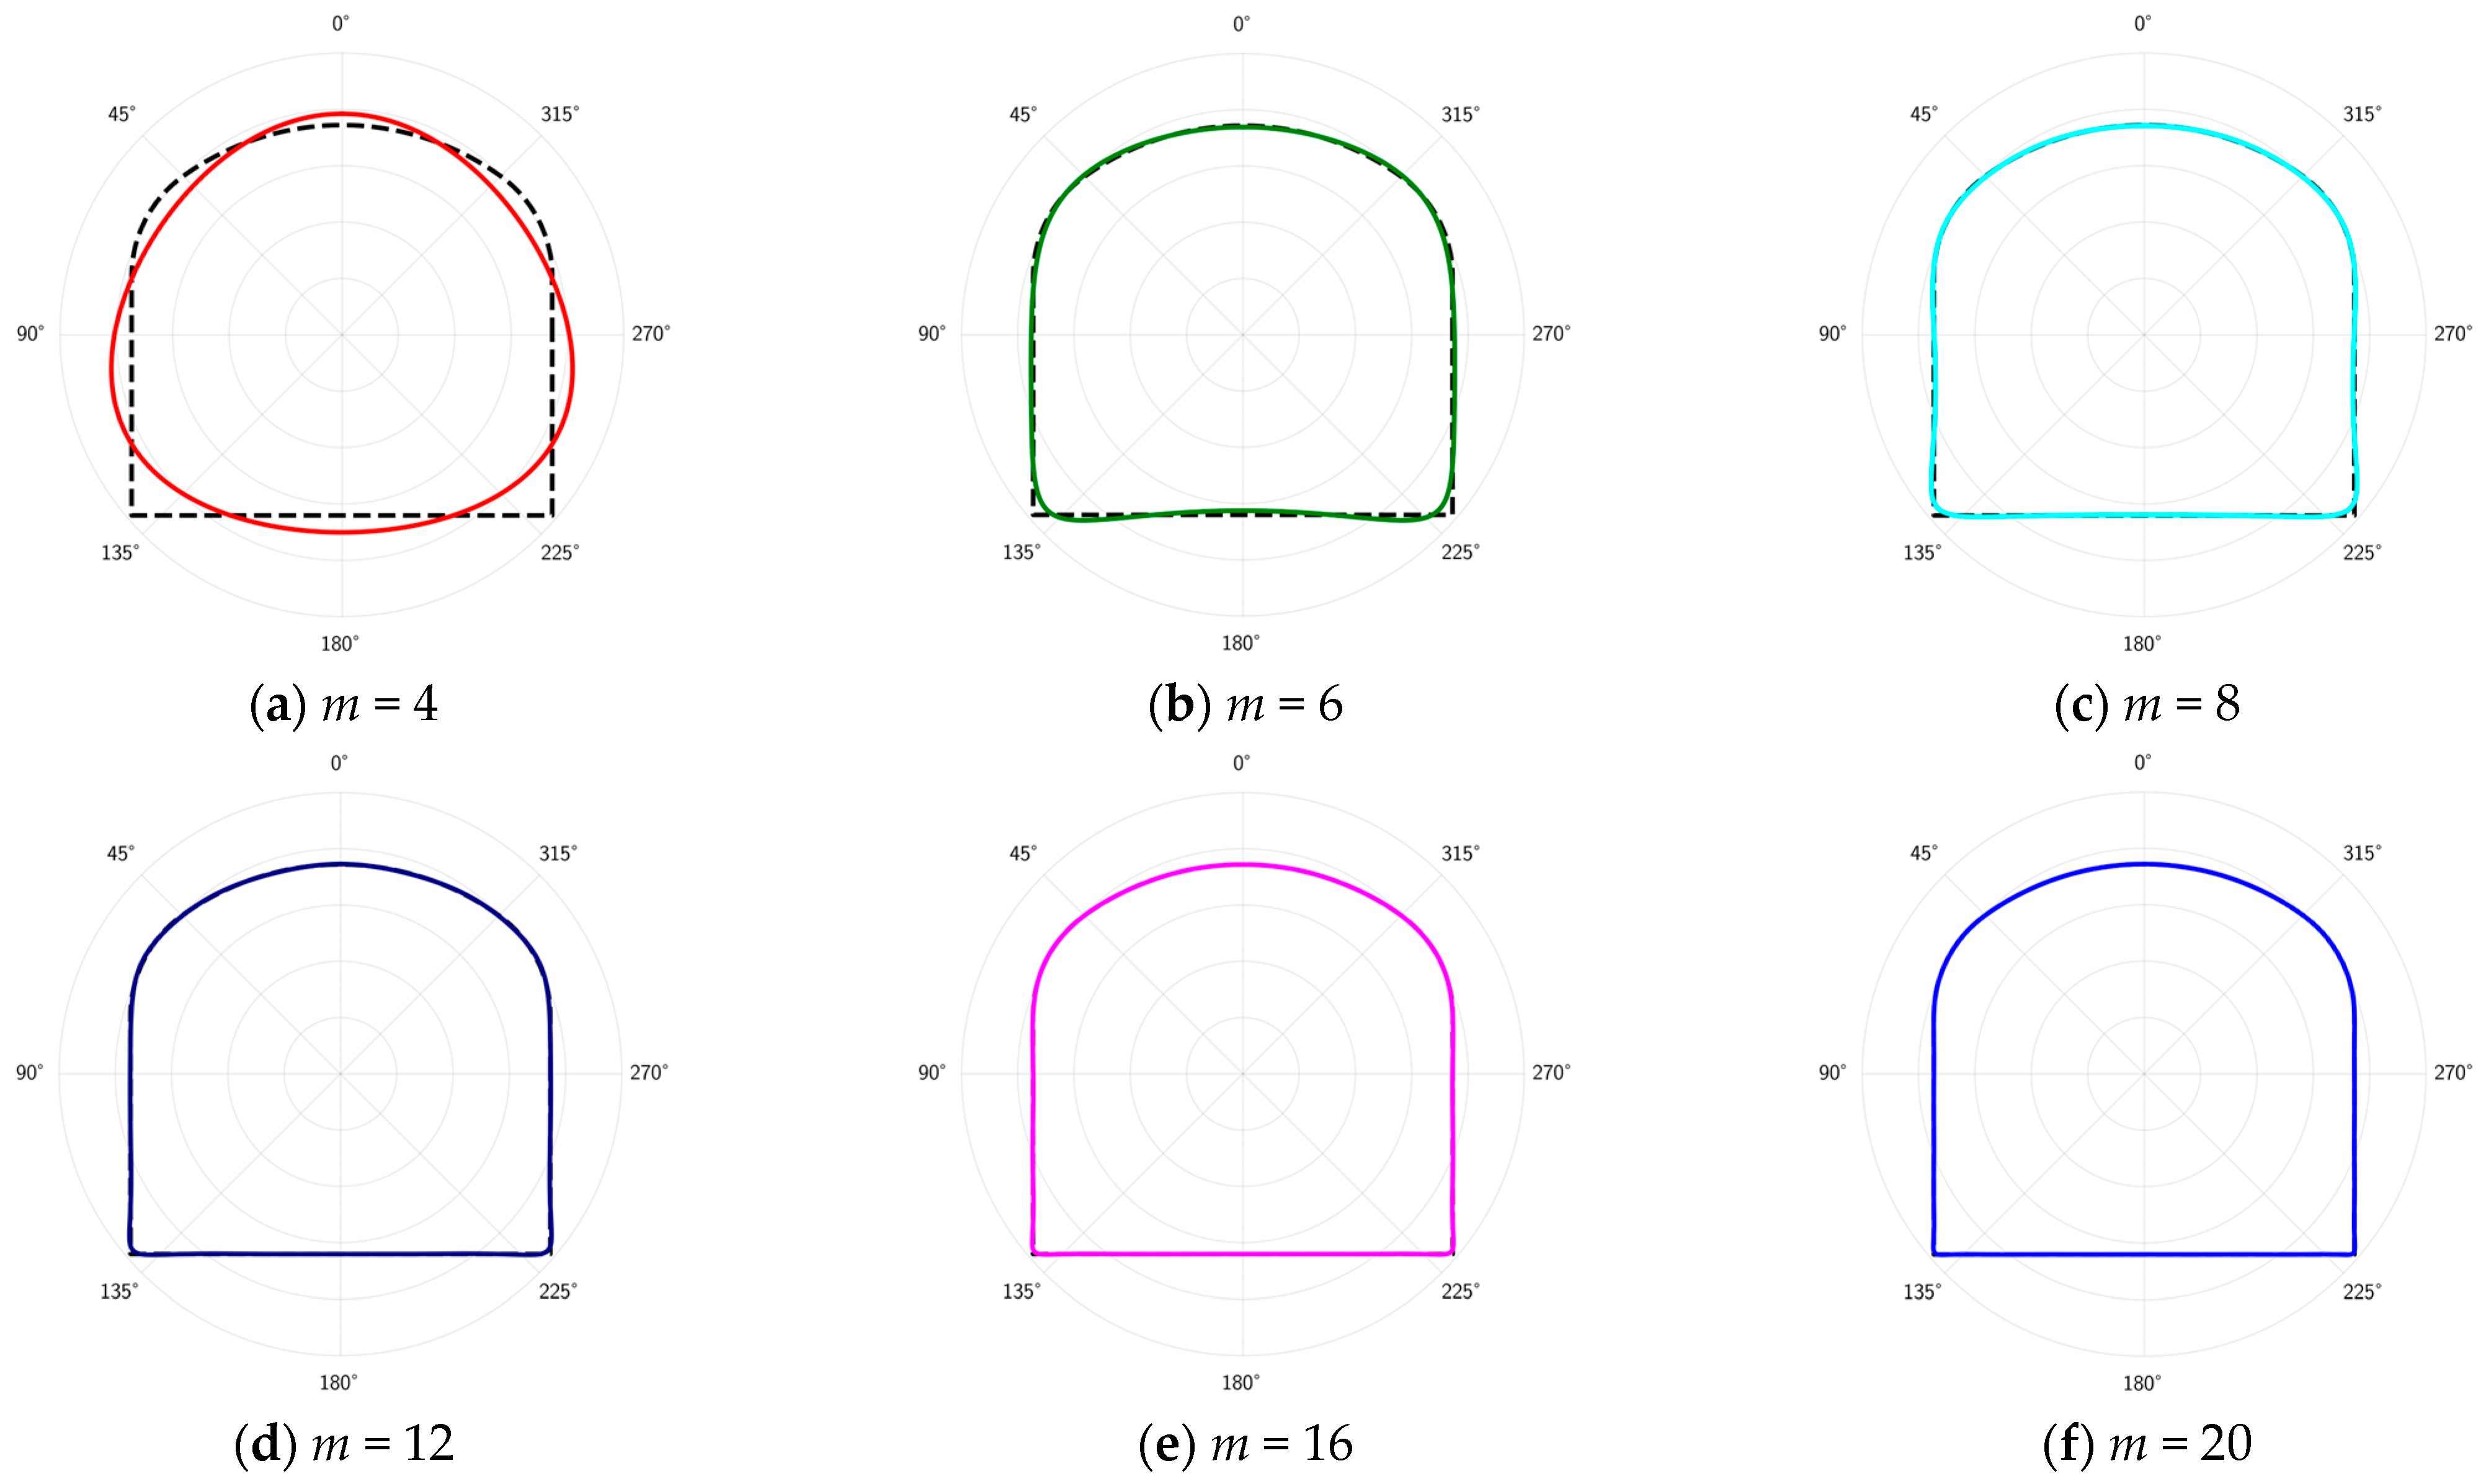
3.2.1. Solution of the Mapping Function for a Plane Containing a Single Tri-Center Arch Roadway

Utilizing the method of conformal mapping, the plane with an opening (Z-plane) can be mapped onto the plane with a unit circle (ζ-plane), achieved through the following mapping function:
Z = ω ζ = k = 1 C k ζ 2 k
Under general circumstances, Ck is a complex number. Therefore, taken with the first m terms, Ck can be expressed as follows:
C k = A k + i B k k = 1 ,   2 ,   3 ,   ,   m
where both Ak and Bk are the real-valued constants.
For l points located on the unit circle on the ζ-plane with coordinates of (1, θj), their corresponding mapped points on the Z-plane are denoted as (rj, αj). Leveraging the orthogonality of trigonometric functions, the expressions for Ak and Bk can be derived as follows:
A k = 1 l j = 1 l r j cos α j cos ( k 2 ) θ j r j sin α j sin ( k 2 ) θ j B k = 1 l j = 1 l r j cos α j sin ( k 2 ) θ j + r j sin α j cos ( k 2 ) θ j
According to the research by Tan et al. [8], triangle interpolation can be utilized to solve the problem for the parameters Ak and Bk of a given mapping function for the plane with a single opening, using a specific solving process not detailed in this study. Notably, since the roadway shape in this study is axisymmetric, it was assumed that the roadway itself is symmetric about the x-axis. In such a case, Ck is the real number, meaning Bk = 0 to improve the solving efficiency.
Based on the triangle interpolation method, the planar mapping function for a section with a tri-center arch roadway was solved. Here, the function fabre is incorporated to assess the accuracy of the mapping function, whose expression is provided below:
f e b r e = 1 n j = 1 n r σ r σ ( 0 ) r σ ( 0 )
where (rσ, ασ) are the coordinates of the opening boundary mapped points corresponding to n sample points on the unit circle, which are obtained based on the mapping function; ( r σ ( 0 ) , ασ) are the coordinates of their actual corresponding points; fabre represents the average absolute relative error (average ARE) of the n points; the closer it is to 0, the higher is the accuracy of the mapping function.
Figure 5 presents the variation curve of fabre as the number of terms Ck, denoted by m, increases. It is observed that as m increases from 4 to 9, fabre rapidly decreases, indicating that the accuracy of the mapping function significantly improves. When m is greater than 9, fabre essentially stabilizes within a range close to 0, signifying that the mapping function has achieved a high level of accuracy at this point. Figure 6 further illustrates the comparison between the mapped shapes and the original shapes under different m values. It is noticeable that at m = 4, the discrepancy between the mapped shape and the original shape is very pronounced. When m reaches 8, the difference between the two becomes minimal. For cases where m > 8 in the figure, there is virtually no difference between the mapped shape and the original shape, showcasing a high degree of congruence. In such cases, the mapped and original shapes are nearly overlapping entirely as seen in Figure 6d–f. Therefore, combining Figure 2 and Figure 3, in this study, for the calculation model of the planar section containing a tri-center arch roadway as shown in Figure 1, the number of terms m for the mapping function Ck was chosen to be 9. Since the term C2 does not affect the shape and size of the mapping, it implies that it does not impact the stress solution for the external surrounding rock of the opening, and hence C2 was taken as 0. The final expression of the mapping function for the plane containing a single tri-center arch opening is as follows:
ω ζ = 2.246 ζ 0.099 ζ 1 + 0.123 ζ 2 0.222 ζ 3 0.074 ζ 4 + 0.027 ζ 5 0.014 ζ 6 + 0.004 ζ 7

3.2.2. Solution of the Complex Stress Function

According to the theory of Muskhelishvili [3], in the Cartesian coordinate system, the stress components (σx, σy, τxy) on the Z-plane are expressed as follows:
σ x + σ y = 4 Re φ 1 z σ y σ x + 2 i τ x y = 2 z ¯ φ 1 z + ψ 1 z
where ψ z = θ 1 z .
In polar coordinates, the stress components (σρ, σθ, τ) can be transformed according to the following formula:
σ ρ + σ θ = σ x + σ y σ θ σ ρ + 2 i τ r θ = σ y σ x + 2 i τ x y e 2 i θ
Let the mapping function from the external area of the opening on the Z-plane to the external area of the unit circle on the ζ-plane be w, by substituting Equation (6) into Equation (5), the following expression is obtained:
σ ρ + σ θ = 4 Re Φ ζ σ θ σ ρ + 2 i τ ρ θ = 2 ζ 2 ρ 2 ω ζ ¯ ω ¯ ζ Φ ζ + ω ζ Ψ ζ
In the equation, σρ, σθ τ represent the radial stress, hoop stress shear stress, respectively, at a certain point outside the opening on the Z-plane. Measures (ρ, θ) denote the coordinates of the mapped point on the ζ-plane. Φ and Ψ are the stress-related complex potential functions with the expressions as follows:
Φ ζ = φ ζ ω ζ Ψ ζ = ψ ζ ω ζ
where:
φ ζ = B ω ζ + φ 0 ζ ψ ζ = ( B + i C ) ω ζ + ψ 0 ζ
The constants B, B′ C′ reflect the situation of the far-field surrounding rock stress can be determined by the following formula:
B = σ x + σ y 4 B = σ y σ x 2 C = τ x y
Let σ x = p , lateral pressure coefficient λ = σ x / σ y . For the case in this study, τ x = 0 ; therefore:
B = 1 + λ 4 p B = 1 λ 2 p C = 0
The unknown analytic functions φ 0 ζ and ψ 0 ζ can be represented by Laurent series:
φ 0 ζ = n = 1 a n ζ n ψ 0 ζ = n = 1 b n ζ n
By substituting the coordinate points σ on the unit circle circumference of the ζ-plane into the above relevant formulas and rearranging them, the stress boundary conditions on the unit circle circumference can be obtained as follows:
φ 0 ζ + ω ζ ω ¯ ζ φ 0 ¯ ζ + ψ 0 ¯ ζ = 2 B ω ζ B i C ω ¯ ζ , ζ = σ
The analytic solutions for φ ζ and ψ ζ can be determined using the Cauchy integral method or power series method.

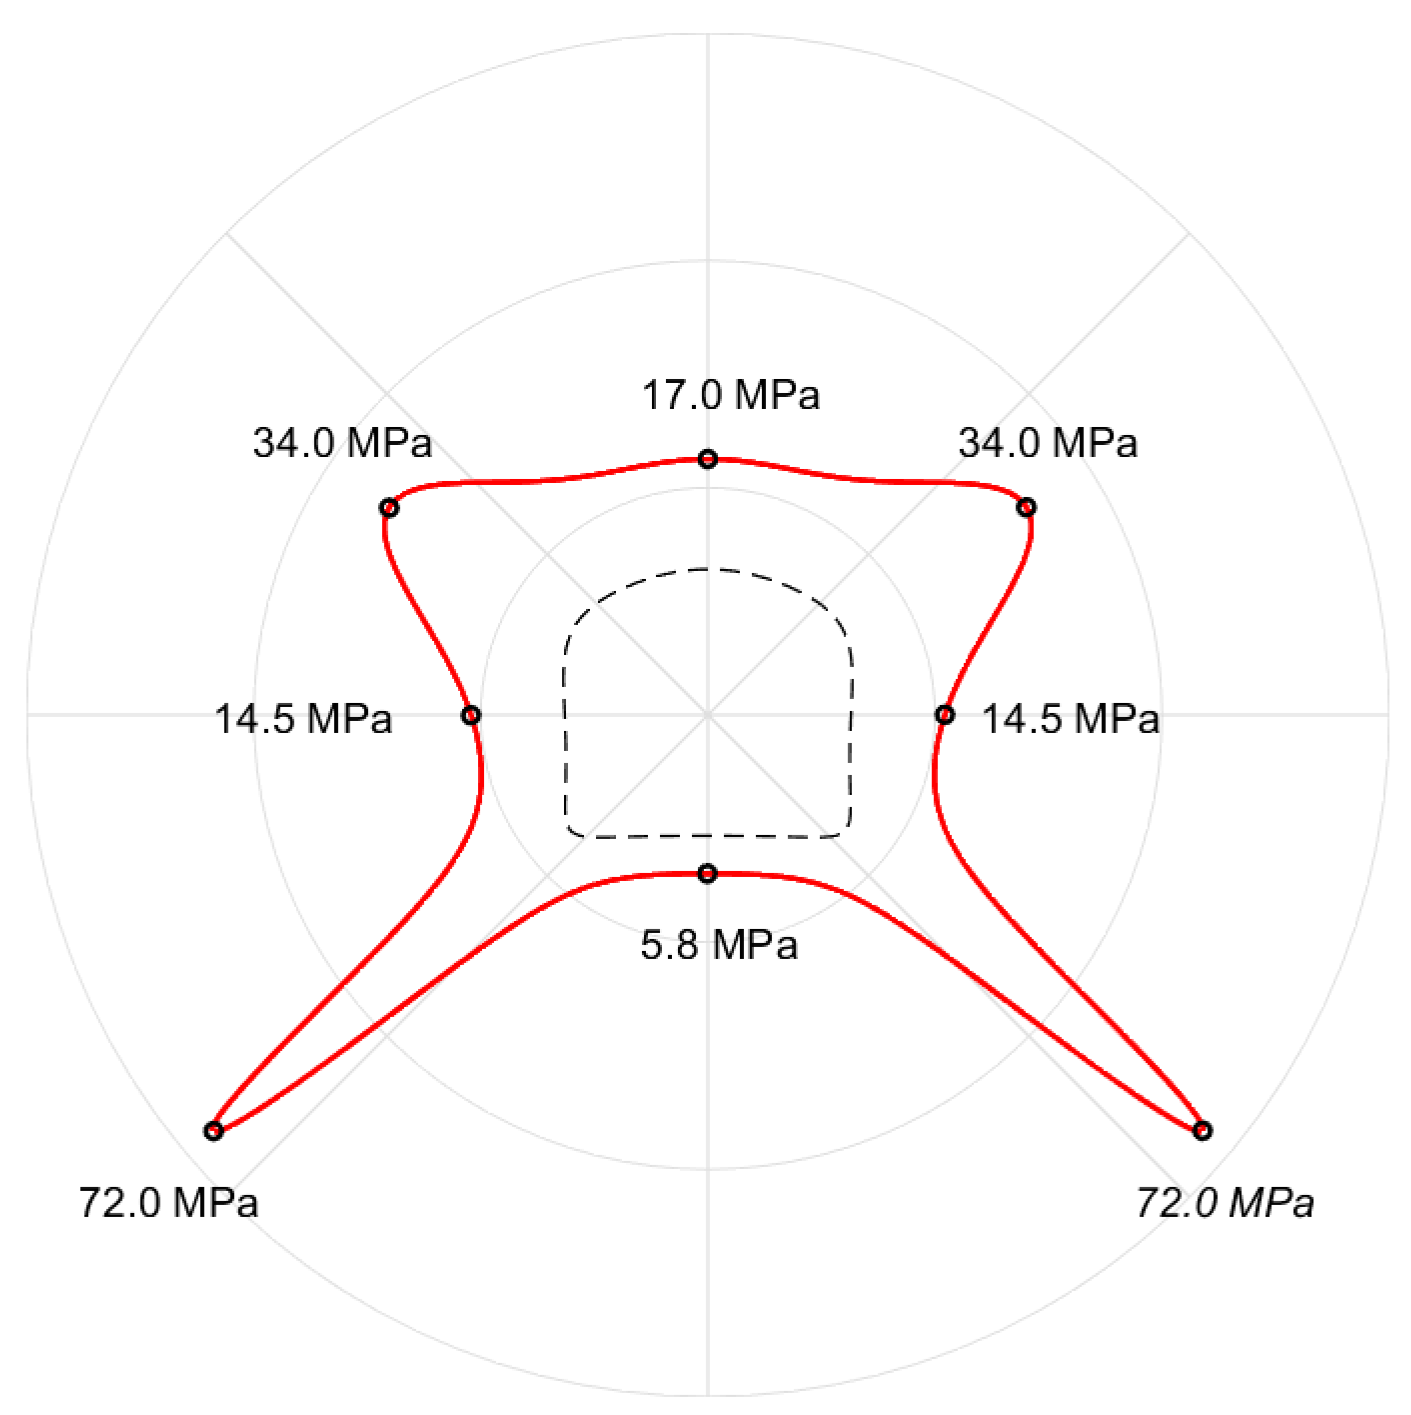
3.2.3. Characteristics of Stress Distribution around a Single Roadway

Figure 7 illustrates the distribution curve of hoop stress at the cross-section boundary of the roadway, derived from the calculation model depicted in Figure 3, in scenarios where no adjacent roadway exists. The stress curves within the roadway cross-section represent the tensile stress, while those outside represent the compressive stress. In this case, given the closeness in magnitude between the vertical and horizontal stresses, no tensile stress is observed around the roadway. The straight-wall corners of the roadway are identified as areas of stress concentration, with the peak stress reaching 72.0 MPa, whereas the stress values in other regions do not exceed 35 MPa. The monitoring points on both sides of the roadway indicate a hoop stress of 14.5 MPa, and the hoop stress at the middle monitoring points of the top and bottom plates is measured at 17.0 MPa and 5.8 MPa, respectively. Stress concentration areas are observed at the two straight-wall corners at the bottom of the roadway and at the two arch shoulder areas. Due to the axisymmetrical nature of the roadway shape, the stress distribution also exhibits symmetric characteristics. An important point to note is that, as per the stress function derived, the position of the maximum hoop stress is located at the straight-wall corners at the bottom of the roadway, registering at 72.0 MPa. Although these data effectively highlight the degree of stress concentration in this region, they may lead to the underestimation in the real elastic solution. This underestimation primarily stems from the slight rounding at the turning angle of the opening in the mapped shape, despite the mapped shape being very close to the ideal original shape, resulting in a slight deviation from that of the original shape. However, in practical engineering scenarios, even if straight-wall corners exist at the opening boundary, they may become rounded due to excessive stress; hence, the stress solution at this part retains its engineering reference value.

3.3. Mutual Influence between Adjacent Roadways

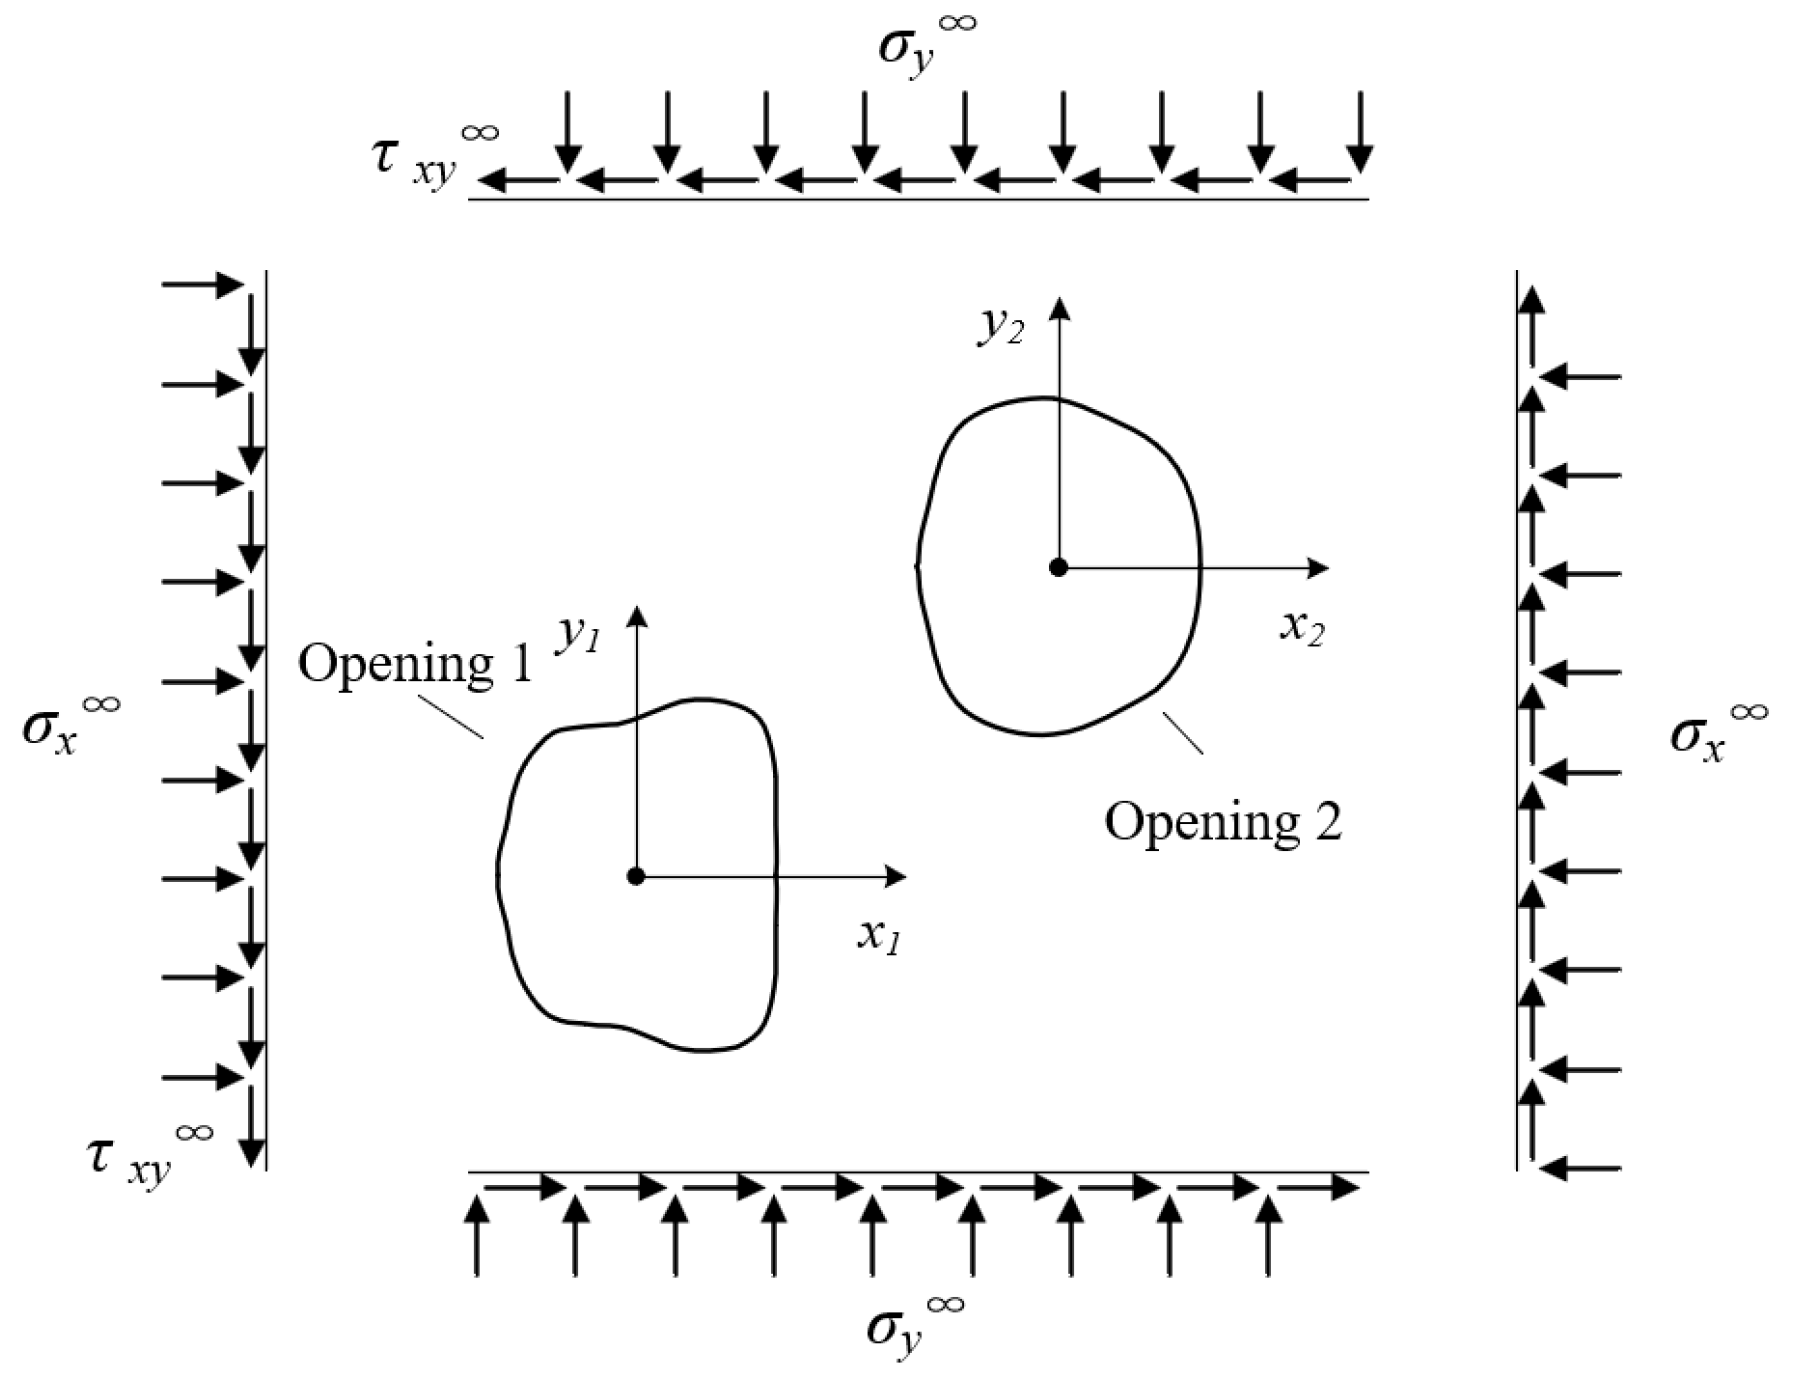
3.3.1. Solution of Stress Function for a Plane Containing Two Openings

In practical underground mining engineering, the layout of underground spatial structures tends to be complex, and adjacent spatial structures may affect the stability of existing structures. Therefore, in the design of underground mining stopes, the impact of the adjacent roadway on an existing roadway is considered through the double-opening calculation model shown in Figure 3b.
The Schwarz alternating method is a common technique for solving the plane stress problems in systems with double openings. The essence of the Schwarz Alternating Method is to transform a multi-opening problem into a series of single-opening problems, each of which can be solved using the method introduced in the previous chapter. As shown in Figure 8, there are two openings (Opening 1 and Opening 2) on the plane. Coordinate system Z1 is centered at the centroid of Opening 1, while coordinate system Z2 is centered at the centroid of Opening 2. Coordinate systems ζ1 and ζ2 are the planes containing unit circle openings corresponding to the relevant coordinate systems. Upon the completion of the excavation of Opening 1, assuming that Opening 2 has not yet been excavated, the stress at the hypothetical boundary of Opening 2 after the excavation of Opening 1 can be calculated in the coordinate system Z1. When proceeding to excavate Opening 2, it is essential to apply external forces to the boundary of Opening 2 to balance the surplus surface forces generated by Opening 1 at the boundary of Opening 2. Assuming that Opening 1 has not been excavated and switching the coordinate system to Z2, the stress function corresponding to the stress balancing conditions at the boundary of Opening 2 can be calculated using the method discussed earlier. At this point, Opening 2 would generate surplus surface forces at the boundary of Opening 1, necessitating a switch back to coordinate system Z1 to calculate the stress function for Opening 1 under new boundary balancing conditions. As the number of iterations increases, the surplus surface forces of a particular opening generated at the boundary of the adjacent opening would diminish, and the solution would increasingly approximate the true solution. Since the number of iterations is finite, once the solution accuracy meets the engineering requirements, the iterative calculations can be halted, thereby concluding the stress solution process.
The early application of the Schwarz alternating method was confined to systems comprising circular or elliptical openings. Even for such simplistic shapes forming a dual-opening system, the complex stress functions derived from iterative calculations using the Schwarz alternating method were highly complex, allowing for only one or two iterations, which hardly met the accuracy requirements. For planes with openings of complex shapes, the highly complex stress functions precluded direct transformations between different coordinate systems, making the calculation of excess surface forces on the opening boundaries during iterations significantly challenging. Zhang et al. [18] addressed this issue by introducing inverse mapping functions to transform the coordinates of the opening boundaries, representing the excess surface forces on the boundaries using complex series functions, and effectively solving the mentioned problems to a certain extent. However, when the deviation of the opening shape from a circle is significant, the inverse mapping functions can introduce certain errors. To enhance the accuracy of the solution, a refined method was introduced, employing the schwarz alternating method to obtain analytical solutions for the external stress around complex dual-opening systems without considering the inverse mapping functions. The detailed solution process is introduced below.
Let the mapping functions of the plane containing Opening 1 in the x1O1y1 coordinate system and the plane containing Opening 2 in the x2O2y2 coordinate system be denoted as z 1 = ω 1 ζ 1 and z 2 = ω 2 ζ 2 , respectively. ζ1 and ζ2 are the coordinates of the planes containing Opening 1 and Opening 2 on the plane of the unit circle mapping, respectively.
Starting from Opening 1, in the absence of any opening, the stress state at any point within the plane remains the same. The excess surface force f 1 0 t 1 on the virtual boundary of the yet-to-be excavated Opening 1 is expressed by the following:
f 1 0 t 1 = φ 0 t 1 + t 1 φ 0 ¯ t 1 + ψ 0 ¯ t 1 = 2 B t 1 B i C t 1 ¯
where t1 represents the point on the boundary of Opening 1.
Upon substituting the mapping function of Opening 1 into the above equation, the corresponding excess surface force on the unit circle can be obtained as follows:
f 1 0 σ 1 = 2 B ω 1 σ 1 + B i C ω 1 ¯ σ 1
where σ1 represents the point on the mapped unit circle corresponding to Opening 1.
Therefore, after the excavation of Opening 1, the stress boundary condition on the unit circle line on the ζ1 plane is expressed as follows:
φ 1 0 ζ 1 + ω 1 ζ 1 ω 1 ¯ ζ 1 φ 1 0 ¯ ζ 1 + ψ 1 0 ¯ ζ 1 = f 1 0 ζ 1 , ζ 1 = σ 1
where φ 1 0 ζ 1 and ψ 1 0 ζ 1 are the relevant analytic functions corresponding to Opening 1 on the plane. This equation represents the stress boundary condition on the unit circle line for a single opening consistent with Equation (13). The superposition of φ 0 ζ 1 and φ 1 0 ζ 1 as well as ψ 0 ζ 1 and ψ 1 0 ζ 1 results in the analytic solutions φ 10 ζ 1 and ψ 10 ζ 1 for the stress functions and for the plane with only Opening 1 present.
After obtaining the analytic functions for the ζ1 plane when only a single opening (Opening 1) is present, it is necessary to eliminate the excess surface force on the unit circle boundary corresponding to Opening 2. The core issue is to utilize φ 10 ζ 1 and ψ 10 ζ 1 to obtain the desired excess surface force distribution function. During this process, three coordinate transformations need to be performed on the point σ2 on the unit circle corresponding to Opening 2.
Let the excess surface force on the boundary of the unit circle on the ζ2 plane corresponding to Opening 2 be denoted as f 12 1 σ 2 , then it can be obtained as follows:
f 12 1 σ 2 = φ 10 γ 1 + ω 1 σ ω 1 ¯ σ φ 10 ¯ γ 1 + ψ 10 ¯ γ 1
where γ1 represents the point on the unit circle corresponding to Opening 2 in the x1O1y1 coordinate system after undergoing a series of transformations to obtain its position in the x2O2y2 coordinate system.
Taking Equation (17) as an example, let the inverse mapping function of the plane where Opening 1 is located be denoted as ζ 1 = w 1 1 z 1 . The process of determining point γ1 corresponding to point σ2 in the expression is as follows: firstly, according to the mapping function, point t2 on the boundary of Opening 2 in the x2O2y2 coordinate system is determined, namely t2 = w22); then, the corresponding point η1 of point t2 in the x1O1y1 coordinate system is calculated by η1 = t2 + c; finally, mapped point γ1 corresponding to point η1 is obtained using the inverse mapping function γ 1 = w 1 1 ( η 1 ) .
As seen from the above, by transforming the coordinate points on different planes and in different coordinate systems, the desired surplus force can be calculated, thereby eliminating the need for further transformation of the corresponding stress analytical functions. However, solving the inverse mapping function can only yield an approximate solution, and for a plane containing one opening of an irregular and complex shape, its accuracy might be relatively low, thereby significantly reducing the accuracy of the stress function solution. In light of this, in this study, the technique of low-dimensional variable optimization, which was introduced by Tan et al. [19], was utilized to replace the inverse mapping function for solving the coordinates of point γ1 corresponding to σ2 and the coordinates of point γ2 corresponding to σ1, eventually obtaining the expression of the corresponding surplus force.
After determining the expression for f 12 1 σ 2 , in the first iteration calculation, the stress boundary condition for the unit circle corresponding to Opening 2 can be represented as follows:
φ 2 1 σ 2 + ω 2 σ 2 ω 2 ¯ σ 2 φ 2 1 ¯ σ 2 + ψ 2 1 ¯ σ 2 = f 12 1 σ 2
After the first iteration, the boundary of Opening 2 already satisfies the no-surface-force-stress boundary condition, but at this point, a new surplus surface force f 12 1 σ 2 is be generated on the boundary of Opening 1. Therefore, it is necessary to continue to apply new counter forces on the boundary of Opening 1 for balance, the calculation process is consistent with the previous one. In the following iteration process, it is only required to update the corresponding stress analytical functions based on the solution result from the previous step.

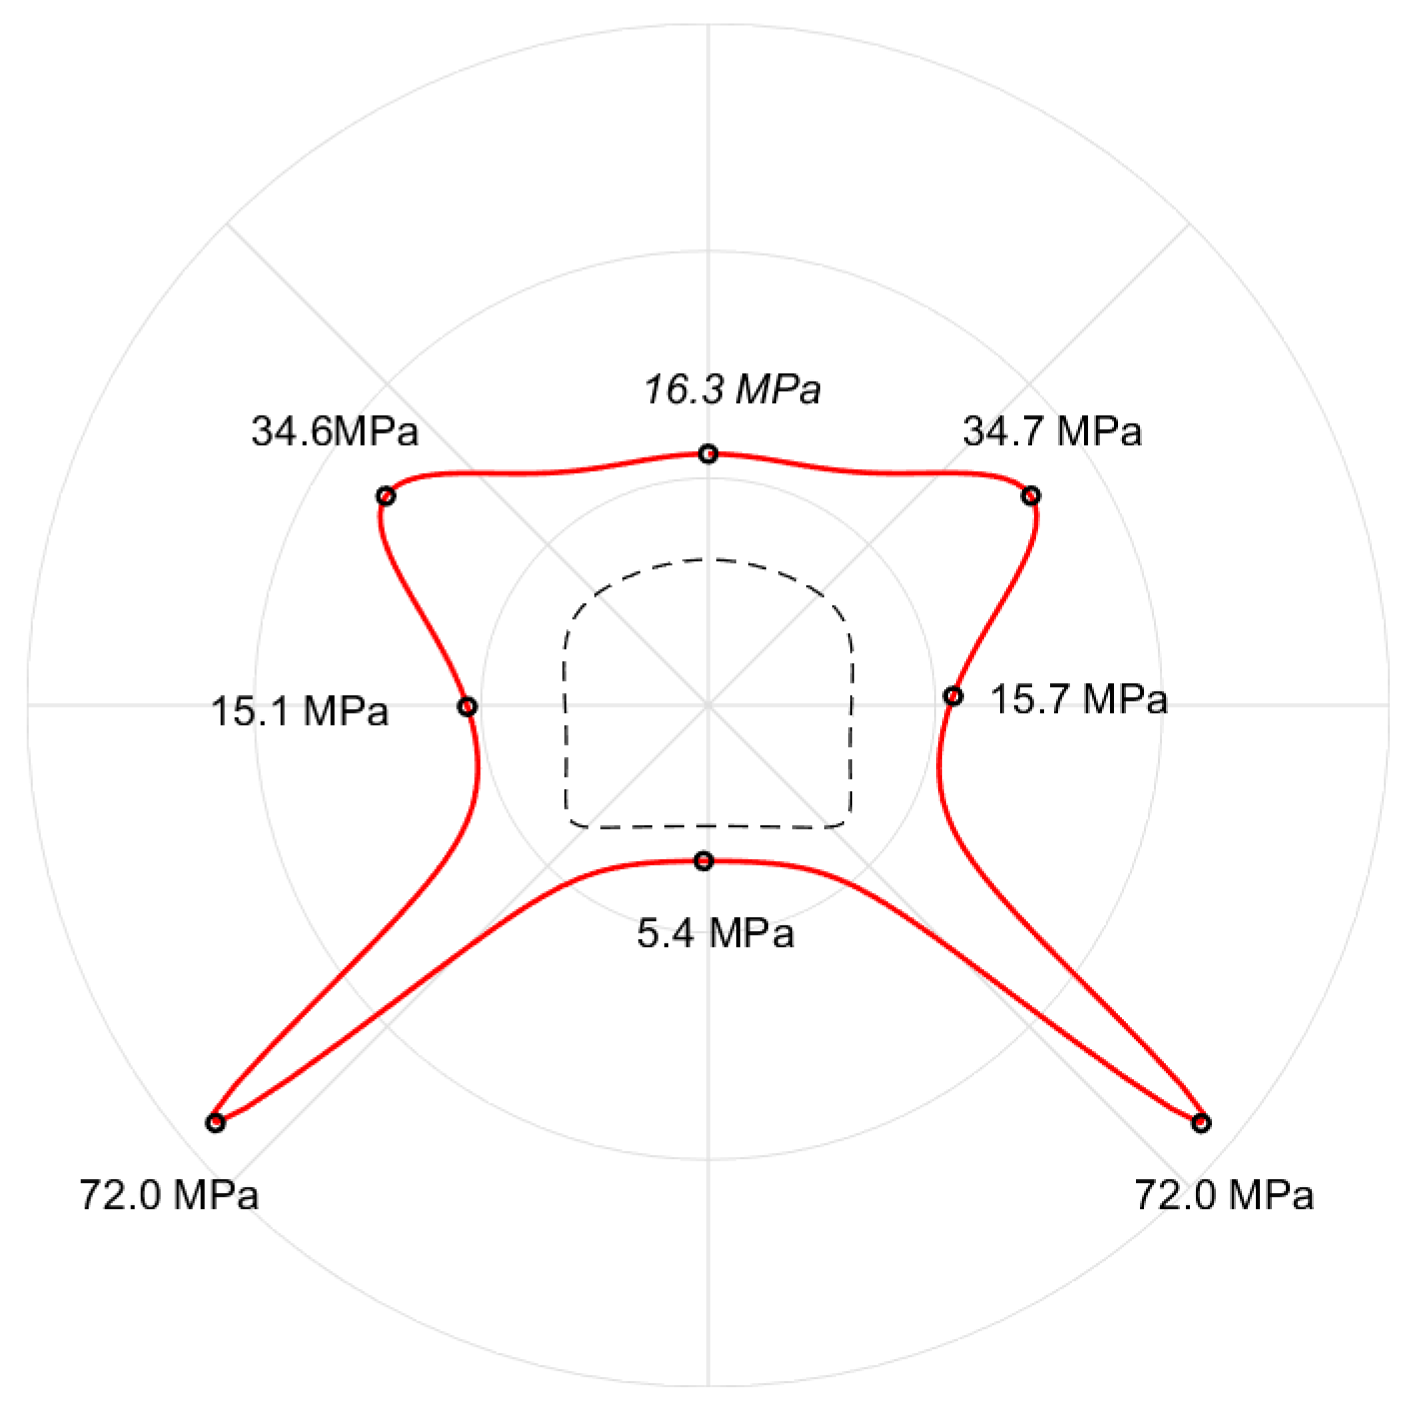
3.3.2. Impact of Adjacent Roadway on the Stress Field around the Existing Roadway

Based on the calculation method introduced above, we further calculated the peripheral hoop stress of the roadway of Stope 101 after the excavation of the adjacent roadway of Stope 102. The distribution curve is shown in Figure 9. Combined with Figure 7, it indicates that when the roadway of the adjacent stope is not excavated, the hoop stress at the sidewall monitoring points on both sides of the roadway is 14.5 MPa. After the excavation of the adjacent roadway, the stress distribution outside the roadway is no longer symmetrical. The hoop stress at the sidewall monitoring point on the side closer to the adjacent roadway increased to 15.7 MPa, an increase of 8.3%, while the hoop stress at the sidewall monitoring point on the side away from the neighboring roadway is 15.1 MPa, an increase of 4.1%. The stress values at the middle monitoring points of the roof and floor decreased by 4.1% and 6.9%, respectively. Figure 10 further presents a comparison of the stress distribution curves of Stope 101 before and after the excavation of the adjacent roadway. Overall, since the distance between the two opening centers is relatively large compared to the size of the roadway itself, the impact of the adjacent stope’s roadway on the stress field around the existing roadway is very limited, and the mutual influence between the two can be essentially ignored.

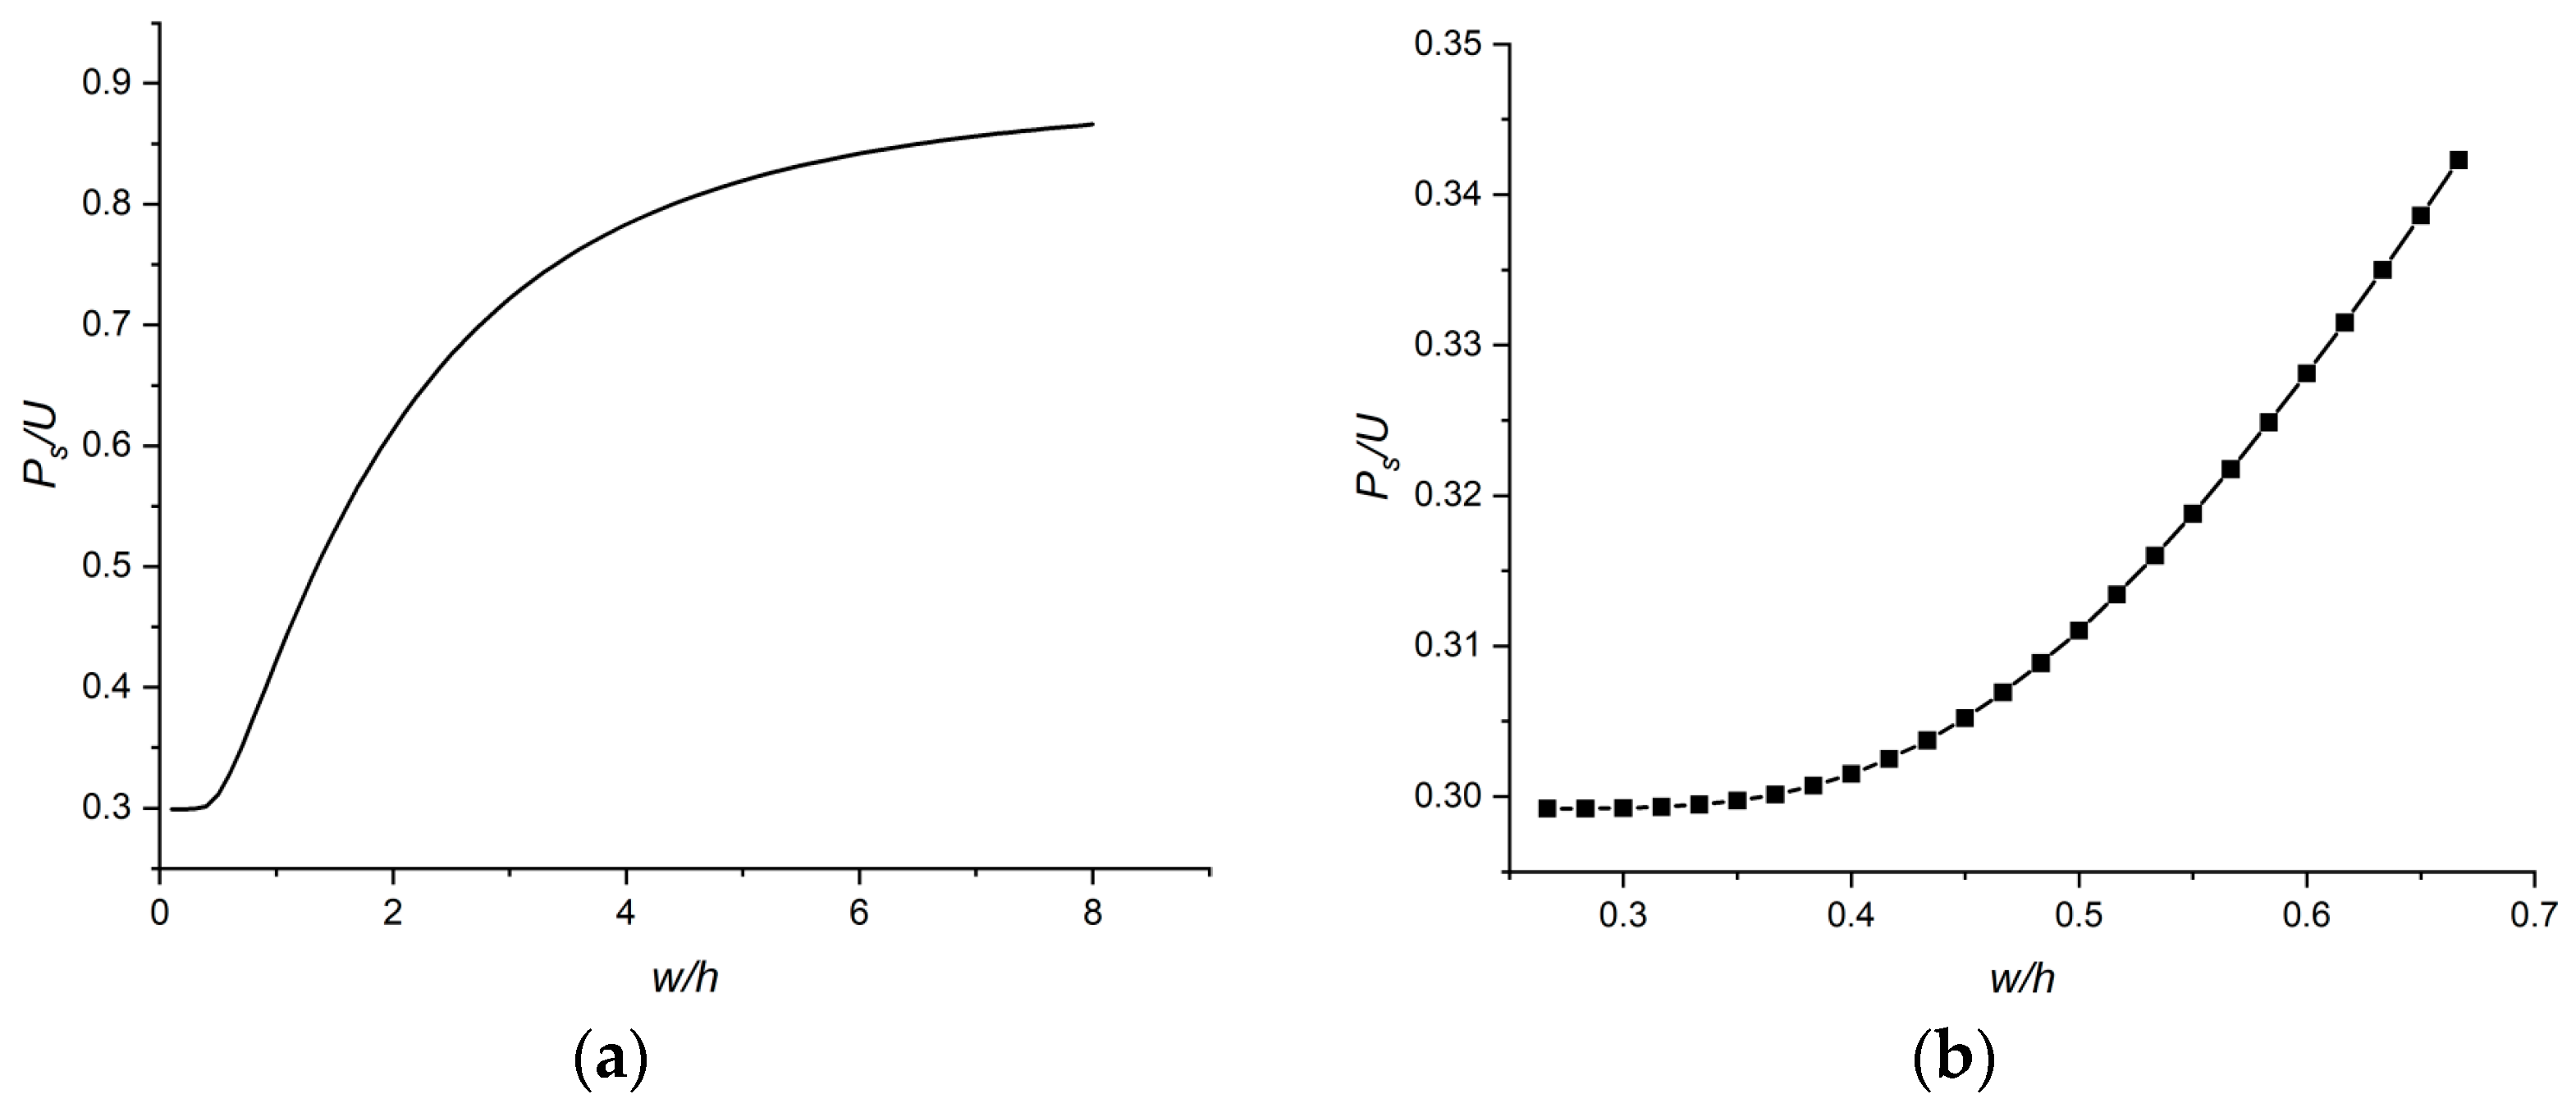
3.4. Optimization Design of Stope Pillar Parameters

In underground mining operations, the design of stope pillar parameters is crucial for ensuring the stability and safety of the mining structures and surrounding rock mass. The stope pillars serve as primary support elements that bear the load of the overlying strata and maintain the stability of the openings. The optimization of stope pillar parameters aims at achieving a balance between maximizing the ore recovery and minimizing the risk of ground failure.
Based on the onsite experience and relevant requirements of the mine, the maximum span of an open area in Level 650 should not exceed 60 m. When the stope length is greater than 60 m, a pillar needs to be reserved in the middle of the stope, with the interval between pillars not exceeding 60 m. The design thickness of the pillars generally ranges between 12 and 20 m. To enhance the recovery rate, the area where the gangue shown in Figure 2 is situated is proposed to be preserved as a pillar. This study combined theoretical analysis with the onsite experience to carry out the parameter optimization design for the pillar, aiming to determine the optimum thickness of the pillar.
In the process of pillar parameter optimization, certain factors are taken into consideration to ensure that the pillar design aligns with the geological conditions, mining requirements safety standards. The optimization process involves evaluating different pillar thicknesses to understand their impact on stope stability, ore recovery overall mining efficiency. The objective is to find a balance between ensuring adequate support and stability in the stope while maximizing the ore recovery rate. Analytical solutions obtained using the complex function theory were employed to arrive at an optimized design for the pillar that meets both safety and operational objectives.
Currently, the calculation of pillar strength in underground mines is mainly based on experimental research and case studies. Specifically for underground hard rock mines, P. J. Lunder and R. Pakalnis [20] combined the pillar stability analysis with a database of measured pillar strengths and, on the basis of classic rock mass strength calculation methods and empirical methods, proposed the formula for calculating the hard rock pillar strength as follows:
P s = 0.44 U ( 0.68 + 0.52 K a )
where U represents the uniaxial compressive strength of the rock mass, Ps is the pillar strength, and Ka is the pillar friction coefficient.
This formula integrates key factors impacting the strength and stability of the pillars in hard rock mining environments. The pillar friction coefficient Ka encapsulates the internal friction and cohesion properties of the rock mass which are crucial for understanding the load-bearing capacity and deformation behavior of the pillars under different mining and geological conditions. This formula provides a more structured and theoretically grounded approach to pillar strength estimation, which can be instrumental in the design and assessment of pillar stability in underground hard rock mines.
The formula for calculating the pillar friction coefficient Ka is as follows:
K a = tan cos 1 1 C p 1 + C p
where Cp is the pillar strength coefficient, which can be obtained by the following:
C p = 0.46 lg ( w h + 0.75 ) 1.4 w / h
Here, w/h is the width-to-height ratio of the pillar.
According to statistics, this formula yields more accurate results in calculating pillar strength compared to previous empirical formulas, and it has higher reliability. It has been applied to the analysis of pillar stability in some domestic hard rock mines. In this study, this formula was used to calculate the strength and safety factor of the pillar under investigation.
Based on the calculation model shown in Figure 4, the relationship between the ratio of the pillar strength to the rock mass uniaxial compressive strength Ps/U and the width-to-height ratio, w/h, of the pillar is shown in Figure 11a. It is observed that, overall, initially, with the increase in width-to-height ratio, the strength of the pillar shows a significant increasing trend then gradually stabilizes. This analysis helps to understand how the geometrical configuration of the pillars impacts their strength, providing a more comprehensive basis for optimizing the design of the pillar to ensure safety and stability during mining operations.
In the stope analyzed in this study, the thickness of the gangue is about 8 m, and the stope height is 30 m. When only the gangue portion is retained as a pillar, the width-to-height ratio of the pillar is approximately 0.27, with a pillar strength of about 46.9 MPa. Based on the on-site experience in the mine, the thickness of the reserved pillar generally does not exceed 20 m. Therefore, the pillar design thickness in this study is between 8 m and 20 m, corresponding to a width-to-height ratio range of 0.27 to 0.67. The relationship between the Ps/U and w/h ratios within this range is shown in Figure 11b.
The total length of the designed stope in this study is 116 m, with the center of the interlayer representing the center of the design pillar. When the thickness of the pillar changes, the span of the openings on both sides and the load borne by the pillar also change accordingly. In the pillar parameter optimization design scheme, 0.5 m is used as the increment of pillar thickness, and a total of 25 pillar parameter design schemes are included in this study. This research solved the mapping functions of the rectangular openings on both sides of the pillar in each scheme and used the improved Schwarz alternating method introduced earlier to analyze the stress state of the designed pillar, obtaining the safety factor of the designed pillar in each scheme. The mapping functions are determined using the polygonal method, with coefficients c2, c4, c6 and c8 being zero. The specific design schemes and solution results are shown in Table 1. The coefficients of the mapping functions for the openings of different design schemes are shown in Table 2.
The relationship curves between the pillar thickness and pillar safety factor as well as between the pillar thickness and recovery rate are shown in Figure 12. It can be seen from Figure 12a that within the range of this study, the safety factor of the pillar is roughly linearly positively correlated with the design thickness. When only the part with the gangue is retained as the pillar, the safety factor of the pillar is only 1.04. As the thickness of the pillar increases, its safety factor also increases linearly; when the pillar thickness reaches 16 m, its safety factor is 1.52; and when the pillar thickness reaches 20 m, the safety factor reaches 1.83. According to field experience, as the strength of this orebody is relatively high with good integrity, the design safety factor range is from 1.2 to 1.5; hence, the corresponding pillar design thickness is from 11 m to 16 m.
Figure 12b further illustrates the trend of the recovery rate of this stope with the increase in pillar design thickness. According to the relevant requirements of the mine, On the precondition of maintaining safety within the stope, the recovery rate of the stope should not be less than 80%, so the pillar design thickness should not exceed 15.5 m. Considering the actual conditions on site, a pillar thickness design of 15 m is relatively reasonable, at which point the safety factor of the pillar is 1.45.

4. Discussion and Conclusions

4.1. Discussion

In conventional large-scale underground mine stope designs, evaluations of surrounding rock stability or optimizations of pillar parameters typically rely on empirical knowledge or numerical simulation techniques. The present study introduced the application of the complex variable theory to the underground stope design, demonstrating that under specific engineering circumstances, the complex variable method emerges as a more efficient and precise strategy. This method facilitates the derivation of exact solutions, ensuring high accuracy, which marks a departure from the empirical or numerical methods. Complex variable methods delve deeper into understanding the behaviors of stress fields by anchoring solutions in foundational theories. They exhibit high efficacy in navigating the complex boundary conditions frequently encountered in underground mining scenarios. By relying on mathematical theories rather than observational data, these methods significantly reduce errors, thereby enhancing the reliability of the results. Collectively, they furnish a comprehensive and dependable toolkit for resolving stress fields and orchestrating underground mine designs.
A crucial aspect of employing the complex variable function method to solve underground rock stress issues is the accurate determination of the mapping function for the plane encompassing openings, as it directly impacts the preciseness of the solution outcomes. The triangle interpolation method employed in this study was corroborated to deliver high solution accuracy. In contrast to other methodologies like the Box composite method and various optimization algorithms, it exhibits rapid solution derivation, maintaining high solution accuracy for both symmetric and asymmetric shapes of the openings. The efficacy of this method is exemplified in the mapping function solution for the plane of the straight-wall arch roadway analyzed in this study, where the mapped shape aligns almost impeccably with the actual shape. This precision enables effective evaluation of stress concentration scenarios in such regions.
While the complex variable function methods present a robust and mathematically rigorous avenue for solving stress fields in underground mining design, they are not devoid of limitations. Primarily, the implementation of the complex variable theory necessitates the creation of computational models and the delineation of boundary conditions, often demanding certain simplifications. In this study, given the superior homogeneity and integrity of the rock mass, it was simplified as a homogeneous elastic material. Nonetheless, in certain underground engineering cases, especially where significant heterogeneity exists or the rock mass contains numerous defects, such simplifications are evidently untenable. The inability to establish a reasonable simplified model hampers the application of theoretical methods to resolve practical engineering challenges.

4.2. Conclusions

This study, set against the backdrop of an underground metal mine, employed the method of complex variable functions to analyze the optimization and stability of the pillar parameters in a specific mine stope. By solving the external stress of roadways and mined-out areas, this study investigated the stress field around the mining roadway in Stope 101 of Level 650 and the influence of the adjacent roadway. According to the on-site conditions, this study also carried out an optimization design for the reserved pillar in Stope 101 by calculating the safety factor of the pillar at different design thicknesses. The results reveal that the impact of the excavation of the jacent roadway on the stress field around the existing roadway is minimal and can essentially be disregarded. There are small areas of a sharp stress increase at the straight-wall corners of the original recovery roadway. The high stress concentration at these corners may lead to localized destruction, without significantly affecting the overall stability of the goaf.
This research demonstrated that by constructing mathematical calculation models based on the theory of complex variable functions, substantial references for real engineering cases like underground mine stope design can be provided. When an underground stope deeply buried and the rock formation is relatively uniform, it can be simplified as an infinite domain for solving the elastic plane problem. With the conformal mapping method employed, the plane issue of the actual opening of a complex shape can be transformed into the plane issue of the unit circle using the mapping function with the subsequent stress field resolution. In this study, based on the mapping functions and the improved stress field resolution methods for double openings, we conducted a computational analysis of the roadway stability and pillar design of a metal mine stope. The analysis results are in line with the on-site monitoring outcomes, further validating the accuracy and feasibility of the improved methods proposed in the text.
Despite the necessity of certain assumptions and simplifications when using theoretical methods to solve engineering problems, analytical solutions are derived and computed based on relevant theoretical formulas, thus ensuring high reliability. Especially when engineering problems involve parameter optimization and multiple scenarios, coupling computer language programming with mathematical modeling allows for rapid problem solving, data processing analysis of relevant issues, enhancing computational efficiency. In practical engineering scenarios, depending on the on-site needs, a flexible selection or combination of theoretical analytical methods and other methods like numerical simulation can be employed to support underground engineering design and stability analysis among other engineering issues.

Author Contributions

Conceptualization, L.T.; methodology, L.T., H.P.; software, L.T., X.S.; validation, Q.L.; writing—original draft preparation, L.T.; writing—review and editing, L.T., H.P.; funding acquisition, L.T., H.P. All authors have read and agreed to the published version of the manuscript.

Funding

This research was funded by National Nature Science Foundation of Hunan Province, grant number 2022JJ40349; National Natural Science Foundation of China, grant number 52304227; and Open Project of State Key Laboratory of Safety Technology of Metal Mines (Changsha Institute of Mining Research Co., Ltd., Changsha, China), grant number fkt2023-03.

Institutional Review Board Statement

Not applicable.

Informed Consent Statement

Not applicable.

Data Availability Statement

All necessary data for this study is available in the main text.

Conflicts of Interest

The authors declare that this study received funding from Changsha Institute of Mining Research Co., Ltd. The funder was not involved in the study design, collection, analysis, interpretation of data, the writing of this article or the decision to submit it for publication.

References

  1. Cai, H.; Lu, A.-Z.; Ma, Y.-C. Analytic stress solution for a circular tunnel in half plane with a concentrated force. Math. Mech. Solids 2019, 24, 3862–3879. [Google Scholar] [CrossRef]
  2. Cao, X.; Gong, W.; Zhou, F.; Dai, G. Stress Analytical Solution for Shallow Buried Lined Circular Tunnel Under the Deformation of Surrounding Rock Inner Edge. Geotech. Geol. Eng. 2019, 37, 3771–3780. [Google Scholar] [CrossRef]
  3. Wang, G.; Zhou, L.; Alotaibi, R.; Hdeib, R. Deformation and stress theory of surrounding rock of shallow circular tunnel based on complex variable function method. Appl. Math. Nonlinear Sci. 2022, 7, 629–640. [Google Scholar] [CrossRef]
  4. Guo, Z.; Wu, B.; Jia, S. An analytical model for predicting the mechanical behavior of a deep lined circular pressure tunnel by using complex variable method. Geomech. Geophys. Geo-Energy Geo-Resour. 2021, 7, 90. [Google Scholar] [CrossRef]
  5. Zhao, G.; Yang, S. Analytical solutions for rock stress around square tunnels using complex variable theory. Int. J. Rock Mech. Min. Sci. 2015, 80, 302–307. [Google Scholar] [CrossRef]
  6. Wu, H.; Zhao, G.Y.; Liang, W.Z. Mechanical properties and fracture characteristics of pre-holed rocks subjected to uniaxial loading: A comparative analysis of five hole shapes. Theor. Appl. Fract. Mech. 2020, 105, 102433. [Google Scholar] [CrossRef]
  7. Tan, L.; Ren, T.; Dou, L.; Yang, X.; Qiao, M.; Peng, H. Analytical stress solution and mechanical properties for rock mass containing a hole with complex shape. Theor. Appl. Fract. Mech. 2021, 114, 103002. [Google Scholar] [CrossRef]
  8. Tan, L.; Ren, T.; Dou, L.; Yang, X.; Wang, G.; Peng, H. Analytical Stress Solution and Numerical Mechanical Behavior of Rock Mass Containing an Opening under Different Confining Stress Conditions. Mathematics 2021, 9, 2462. [Google Scholar] [CrossRef]
  9. Xiao, W.; Zhang, D.; Li, S.; Lu, J. Fracture evolution and fracture mechanism of tunnel surrounding rock: A case study based on laboratory tests and theoretical analysis. Fatigue Fract. Eng. Mater. Struct. 2023, 46, 2617–2638. [Google Scholar] [CrossRef]
  10. Tu, S.; Li, Z.; Ye, Z.; Zhang, C.; Zhang, L. The Complex Function Method Roadway Section Design of the Soft Coal Seam. Math. Probl. Eng. 2016, 2016, 9291412. [Google Scholar] [CrossRef]
  11. Bobet, A. Deep Tunnel in Transversely Anisotropic Rock with Groundwater Flow. Rock Mech. Rock Eng. 2016, 49, 4817–4832. [Google Scholar] [CrossRef]
  12. Cheng, Q.-x.; Lu, A.-z.; Yin, C.-l. Analytical Stress Solutions for a Deep Buried Circular Tunnel Under an Unsteady Temperature Field. Rock Mech. Rock Eng. 2021, 54, 1355–1368. [Google Scholar] [CrossRef]
  13. Yu, I.W.; Sendeckyj, G.P. Multiple Circular Inclusion Problems in Plane Elastostatics. J. Appl. Mech. 1974, 41, 215–221. [Google Scholar] [CrossRef]
  14. Ukadgaonker, V.G. Stress analysis of a plate containing two circular holes having tangential stresses. AIAA J. 1980, 18, 125–128. [Google Scholar] [CrossRef]
  15. Salerno, V.L.; Mahoney, J.B. Stress Solution for an Infinite Plate Containing Two Arbitrary Circular Holes Under Equal Biaxial Stresses. J. Eng. Ind. 1968, 90, 656–665. [Google Scholar] [CrossRef]
  16. Kim, T.J.; Ukadgaonker, V.G. Plane stress analysis of two rigid circular inclusions. Aiaa J. 1971, 9, 2294–2296. [Google Scholar] [CrossRef]
  17. Ukadgaonker, V.G.; Naik, A.P. Interaction effect of two arbitrarily oriented cracks—Part I. Int. J. Fract. 1991, 51, 219–230. [Google Scholar] [CrossRef]
  18. Zhang, L.-Q.; Lu, A.-Z. An Analytic Algorithm of Stresses for Any Double Hole Problem in Plane Elastostatics. J. Appl. Mech. 2000, 68, 350–353. [Google Scholar] [CrossRef]
  19. Tan, L.; Ren, T.; Dou, L.; Yang, X.; Cai, X.; Qiao, M. Analytical stress solution for rock mass containing two holes based on an improved Schwarz alternating method. Theor. Appl. Fract. Mech. 2021, 116, 103092. [Google Scholar] [CrossRef]
  20. Lunder, P.J.; Pakalnis, R.C. Determination of the strength of hard-rock mine pillars. CIM Bull. 1997, 90, 51–55. [Google Scholar]
Figure 1. Schematic diagram of stope layout at Level 650.
Applsci 13 12142 g001
Figure 2. Schematic cross-section of Stope 101 at Level 650.
Applsci 13 12142 g002
Figure 3. Schematic diagram of the stress calculation model for the plane containing roadways. (a) A single roadway. (b) Two roadways.
Applsci 13 12142 g003
Figure 4. Schematic diagram of the stress calculation model for the plane containing a single roadway.
Applsci 13 12142 g004
Figure 5. The relationship curve between the accuracy of the mapping function and m.
Applsci 13 12142 g005
Figure 6. Comparison of mapped shapes and original shapes with different m values. (black dashed lines indicate the original shapes and colored solid lines indicate the mapped shapes).
Applsci 13 12142 g006
Figure 7. Distribution curve of hoop stress around the roadway in Stope 101 before the excavation of the adjacent roadway. (The red solid line indicates the stress curve, and the black dashed line indicates the opening boundary).
Applsci 13 12142 g007
Figure 8. Schematic diagram of a plane system with two irregularly shaped openings arranged arbitrarily.
Applsci 13 12142 g008
Figure 9. Distribution curve of hoop stress around the roadway in Stope 101 after the excavation of the adjacent roadway. (The red solid line indicates the stress curve, and the black dashed line indicates the opening boundary).
Applsci 13 12142 g009
Figure 10. Comparison of hoop stress distribution curves around the roadway in Stope 101 before and after the excavation of the adjacent roadway.
Applsci 13 12142 g010
Figure 11. Relationship curve between Ps/U and pillar’s width-to-height ratio (w/h). (a) Curve within the common range. (b) Curve within the research scope.
Applsci 13 12142 g011
Figure 12. Variation curves of pillar safety factor and stope recovery rate with increasing pillar thickness. (a) Curve for pillar safety factor. (b) Curve for stope recovery rate.
Applsci 13 12142 g012
Table 1. Pillar parameter optimization design schemes and calculation results.
NumberPillar Thickness/mLeft
Opening Span/m
Right Opening Span/mw/hPs/UAxial Stress in Pillar/MPaPillar Safety
Factor
18.0057.0051.000.270.29945.041.04
28.5056.7550.750.280.29943.851.07
39.0056.5050.500.300.29942.771.10
49.5056.2550.250.320.29941.851.12
510.0056.0050.000.330.29940.891.15
610.5055.7549.750.350.30039.961.18
711.0055.5049.500.370.30039.211.20
811.5055.2549.250.380.30138.051.24
912.0055.0049.000.400.30237.661.26
1012.5054.7548.750.420.30336.661.30
1113.0054.5048.500.430.30436.351.31
1213.5054.2548.250.450.30535.571.35
1314.0054.0048.000.470.30734.891.38
1414.5053.7547.750.480.30934.351.41
1515.0053.5047.500.500.31133.781.45
1615.5053.2547.250.520.31333.321.48
1716.0053.0047.000.530.31632.601.52
1816.5052.7546.750.550.31932.311.55
1917.0052.5046.500.570.32231.731.59
2017.5052.2546.250.580.32531.391.62
2118.0052.0046.000.600.32830.911.67
2218.5051.7545.750.620.33230.551.70
2319.0051.5045.500.630.33530.331.73
2419.5051.2545.250.650.33929.751.79
2520.0051.0045.000.670.34229.361.83
Table 2. The coefficients of the mapping function for the mined-out areas on both sides of the pillar.
NumberLeft OpeningRight Opening
c1c3c5c7c9c1c3c5c7c9
12.5380.743−0.387−0.0680.0242.3680.579−0.371−0.0540.028
22.5310.736−0.386−0.0670.0242.3610.573−0.370−0.0540.028
32.5240.729−0.386−0.0670.0242.3540.566−0.370−0.0530.028
42.5170.723−0.385−0.0660.0242.3470.559−0.369−0.0530.028
52.5100.716−0.384−0.0660.0242.3400.552−0.368−0.0520.028
62.5030.709−0.384−0.0650.0252.3330.545−0.368−0.0520.029
72.4960.702−0.383−0.0650.0252.3260.538−0.367−0.0510.029
82.4890.695−0.382−0.0640.0252.3180.532−0.366−0.0500.029
92.4820.689−0.382−0.0640.0252.3110.525−0.365−0.0500.029
102.4750.682−0.381−0.0630.0252.3040.518−0.365−0.0490.029
112.4670.675−0.380−0.0620.0262.2970.511−0.364−0.0490.029
122.4600.668−0.380−0.0620.0262.2900.504−0.363−0.0480.029
132.4530.661−0.379−0.0610.0262.2830.497−0.362−0.0470.030
142.4460.655−0.379−0.0610.0262.2760.491−0.362−0.0470.030
152.4390.648−0.378−0.0600.0262.2690.484−0.361−0.0460.030
162.4320.641−0.377−0.0600.0262.2610.477−0.360−0.0460.030
172.4250.634−0.377−0.0590.0272.2540.470−0.359−0.0450.030
182.4180.627−0.376−0.0590.0272.2470.463−0.359−0.0440.030
192.4110.620−0.375−0.0580.0272.2400.456−0.358−0.0440.030
202.4040.614−0.375−0.0570.0272.2330.449−0.357−0.0430.031
212.3970.607−0.374−0.0570.0272.2260.443−0.356−0.0430.031
222.3900.600−0.373−0.0560.0272.2180.436−0.355−0.0420.031
232.3820.593−0.372−0.0560.0282.2110.429−0.355−0.0410.031
242.3750.586−0.372−0.0550.0282.2040.422−0.354−0.0410.031
252.3680.579−0.371−0.0540.0282.1970.415−0.353−0.0400.031
Disclaimer/Publisher’s Note: The statements, opinions and data contained in all publications are solely those of the individual author(s) and contributor(s) and not of MDPI and/or the editor(s). MDPI and/or the editor(s) disclaim responsibility for any injury to people or property resulting from any ideas, methods, instructions or products referred to in the content.

