Article

A Hybrid Architectural Model for Monitoring Production Performance in the Plastic Injection Molding Process

by
Gerardo Luisi
1,*,
Valentina Di Pasquale
2,
Maria Cristina Pietronudo
1,
Stefano Riemma
2 and
Marco Ferretti
1
1
Department of Management and Quantitative Studies, Parthenope University of Naples, 80133 Napoli, Italy
2
Department of Industrial Engineering, University of Salerno, 84084 Fisciano, Italy
*
Author to whom correspondence should be addressed.
Appl. Sci. 2023, 13(22), 12145; https://doi.org/10.3390/app132212145
Submission received: 24 August 2023 / Revised: 2 November 2023 / Accepted: 3 November 2023 / Published: 8 November 2023

Abstract

:
Monitoring production systems is a key element for identifying waste and production efficiency, and for this purpose, the calculation of the Key Performance Indicator (KPI) Overall Equipment Effectiveness (OEE) is validly recognized in the scientific literature. The collection and analysis of the cause of the interruption of the plants is particularly useful in this sense. The use of Internet of Things (IoT) technology in order to automate data collection for the purpose of calculating the OEE and the causes of interruption is effective. Furthermore, the existing literature lacks research studies that aim to improve the data quality of important process data that cannot be collected automatically. This study proposes the use of IoT technologies to request targeted and intelligent information inputs from the operators directly involved in the process, improving the completeness and accuracy of the information through the real-time and smart combination of manual and automated data. The Business Process Model and Notation (BPMN) methodology was used to analyze and redesign the collection data process and define the architectural model with a deep knowledge of the specific process. The proposed architecture, designed for application to a plastic injection molding production line, comprises several elements: the telemetry of the injection molding machine, an intervention request system, an intervention tracking system, and a human–system interface. Furthermore, a dashboard was developed using the Power BI software, 2.122.746.0 version, to analyze the information collected. Reducing the randomness of manual data makes it possible to direct production efficiency efforts more effectively, helping to reduce waste and production costs. Reducing production costs appears to be strongly linked to reducing environmental impacts, and future studies will be able to quantify the benefits obtained from the solution in terms of environmental impact.

1. Introduction

The recent developments in digital technologies are upsetting the productive economic context; the relationship between new industrial technologies and the productive economic context is called Industry 4.0 (I4.0) [1]. In the literature, the theme of Industry 4.0 has been thoroughly analyzed; in particular, the possible applications of the I4.0 paradigm have been outlined, including smart factories, smart cities, and smart products [2]. Focusing on smart factory applications, the main expected effects are real-time inventory management and control, real-time production flow monitoring, supply chain integration, real-time equipment management, and customer integration [3].
Industry 4.0 is a paradigm that includes various enabling technologies, including Augmented Reality (AR), the Internet of Things, blockchain, cloud computing, Artificial Intelligence (AI), etc. With particular reference to IoT technology, which represents the data input source, the main effects of Industry 4.0 on the improvement of business processes are as follows: dynamic production lines; the interconnection between machinery, information systems, and people; a networked environment, massive data usage; and machine communications to manage system dynamics [4,5]. These elements favor the improvement of operational efficiency and productivity, asset utilization, and reductions in downtime [6].
Various works in the literature have thoroughly described how an IoT network is structured [7,8,9,10]. The authors of [6] described in detail the different possible levels for organizing the stages of collection, transmission, processing, and presentation of information.
The enabling technologies of Industry 4.0 and, in particular, the IoT have turned out to be useful elements for monitoring the performance of production processes [11]. In the context of monitoring the performance of production plants, many publications in the scientific literature mention the Overall Equipment Effectiveness indicator. Corrales et al., 2020 [12] conducted a systematic literature review on the OEE indicator, highlighting that OEE is an emerging topic that can be used as input information for decision making in business; moreover, they underlined that the evolution in the method of calculating the indicators applied to different contexts and the different needs listed in the literature. After analyzing different OEE approaches, they also noted that the OEE indicator is adaptable to different domains by measuring the effectiveness of production equipment and material, economic, and human resources. They underlined that an in-depth study of the process is required to determine the losses, variables, and factors to be included in other OEE approaches.
Iannone and Nenni [13] analyzed different types of data collection strategies and underlined that in calculating OEE, it is important to consider machines operating in a linked and complex environment. Li et al. [14] proposed a revision of the OEE indicator for multi-product production system contexts; they proposed the multiproduct production system effectiveness (MSPE) indicator. Schiraldi and Varisco [15] analyzed the ISO22400 OEE indicators and proposed a classification of equipment states that grant the standard consistency with the established OEE expression.
In monitoring performance through using the OEE indicator, it is essential to pay due attention to the precise analysis of the causes of plant shutdowns [16]. The effectiveness of the investment efforts to improve the efficiency of the production plants is linked to the monitoring of the use of shutdowns of the same; therefore, the collection of precise information relating to the causes of the shutdowns of the plants demonstrates strong potential to maintain business quality within limited expenditure and time periods [17]. Further investigations on this topic are required [18].
For this purpose, Kaya Onur e Bergsjo Dag [19] proposed a human–machine interface for manual data collection based on a form. Li et al. [20] designed a Standardized Supervisory Control and Data Acquisition (SCADA) for real-time OEE indicator calculation and manual plant shutdown data collection.
Breiter et al. [21] designed an application to collect data on disruptions in the manual assembly of complex production and system (CoPS) and investigated the operator’s intention to use this software in a single case study. Furthermore, they [22] suggest that an efficient human–machine interaction design favors effective disruption management.
Tortora et al. [23] highlighted that it is a further research opportunity to develop methodologies and approaches to evaluate and measure the consequences and impacts of human performance on production systems. These impacts should be considered in terms of system availability and reliability (for example, frequency of maintenance interventions or duration of intervention times). The information related to the interventions of the operators also falls within the topic of manual data collection.
Within the sector of plastic manufacturing, injection molding is one of the most important manufacturing methods. About one-third of all thermoplastic materials are injection-molded [24]. The large diffusion of injection molding continuously requires the development and implementation of new solutions to improve efficiency and reduce the economic and environmental costs of this manufacturing process. Calculating the OEE in injection molding production contexts has already been proposed in the literature in the past. Nwanya et al. [25] estimated the total production downtime for each plastic production line per shift and developed an algorithm for uptime maximization; moreover, they used the OEE indicator to highlight the effectiveness of the algorithm but did not study any ways to improve the OEE accuracy estimation.
Despite the widespread use of OEE in the literature to evaluate the performance of production plants in various production sectors, including injection molding production lines, little attention has been paid to the source of the data collected for the calculation of the indicator and therefore to the quality of the data collected, particularly in the case of semi-automated processes for which the collection of data for the calculation of the OEE and for the causes of downtime must be retrieved manually. For these cases, mechanisms to improve the manual data quality would be useful.
The present study aims to follow the recent academic advances discussed so far to propose a solution that improves the quality of important process data that cannot be obtained automatically. The study will focus on an application solution that allows data to be collected in a plastic injection molding process.
The research questions we set out to answer in this research work are as follows: How could manufacturers of plastic injection molding collect manual data on downtime events, ensuring a high level of data quality? How can modern technologies be used to enhance manual data collection?
The software architecture presented herein consists of a component for collecting automatic data from injection molding machines and a component for the intelligent collection of manual data directly from the operators assigned to the various stages of the process. The application solution was defined on the basis of an in-depth knowledge of the process, which made it possible to precisely clarify the data collection phases, allowing for the best adaptation of the characteristics of the application solution.
The remainder of this article is organized as follows: in Section 2, the materials and methods used for the study are listed, Section 3 presents the architectural model, and Section 4 contains a final discussion on our results and the implications of our research.

2. Materials and Methods

To achieve the objectives of the present research work, the application context of a production line for the injection molding of plastic materials was first analyzed. Subsequently, the AS-IS of a case study of a process for the management of production problems was defined. The business process model and notation methodology were used to design the architectural model and then define the new TO-BE processes for managing production issues. The TO-BE processes that allow for the design and the integration of the architectural model were then presented and described.

2.1. Application Field: Injection Molding Production Line

In order to understand the solution provided in this research work, it is essential to describe the main characteristics of a plastic injection molding production line. Despite the different possible technological variants, a plastic injection molding production unit is made up of the following sub-units:
  • Injection molding machine;
  • Picking robot;
  • Station for control–assembly operations.
The injection press automatically carries out the phases of the molding process; the robot, integrated with the press, takes care of picking up the manufactured articles from the press mold and directing them to the subsequent phases. The molding operations are usually followed by necessary control activities and possibly by assembly activities, which, placed synchronously with the molding ones, create a micro-production line that allows for the efficient attainment of finished products. The assembly activities can be carried out manually, semi-automatically, or automatically depending on the economic convenience dictated by the production volumes. The intrinsic characteristic of the plastic injection molding process is its high flexibility, which, from an economic point of view, makes a large production mix on a single production unit feasible. Therefore, the adoption of automatic systems is not always convenient for assembly operations that appear to be mainly manual or semi-automatic.
From the detailed study of the process, a systematic analysis of the possible causes of the stop of the production unit was conducted. First of all, four fundamental states of the production unit were identified, and they are as follows: (a) in production (the unit is working without problems); (b) stop (the unit is stopped due to the presence of problems); (c) no planning (the unit is on but not in production due to a lack of planning); and (d) off.
Then, the stop state was divided into eight sub-states:
  • Intervention required: the intervention of a specific professional figure is required;
  • Intervention: an operator is intervening on the production unit;
  • Management problems: the unit is stopped due to non-technical problems (e.g., lack of a line operator);
  • Raw material plant problems: the unit is stopped due to problems related to the quality or availability of plastic granules;
  • Inspection stops quality control: the unit is stopped due to quality problems on the molded products;
  • Start-up: the unit is in the start-up phase of production;
  • Power on/off: for an injection molding machine, both switching on and off takes some time;
  • Scheduled maintenance: for maintenance activities already foreseen in the maintenance calendar.
Furthermore, as shown in Figure 1, four basic colors were selected to easily identify the various states: green, red, yellow, and gray. Using the four basic colors, it was possible to group the different states by color according to a logic that helps to understand the actions required by the machine. Gray was used for the machine off or not planned states, green for the machine in production status, and red for the stop status. Finally, for the “Intervention Requested” status, a flashing yellow outline was added to the red color, while for the intervention status, the red and yellow colors were reversed to denote that an operator had taken charge of the intervention. The defined production unit states are shown in Figure 1.

2.2. Case Study: AS-IS Downtime Management Process

Through a period of observation at a production company using plastic injection molding, it was possible to define the downtime management process. A very simple and intuitive notation that leads back to the classic notation of a flow chart was used to represent the AS-IS process. The downtime, as shown in Figure 2, can start from different source events: a block of the machine due to an alarm or a block of the machine performed manually. Only some operators are authorized to command the machines; they are called conductors. Conductors could manually shut down a production unit due to malfunction, waste production, or management needs. All information communications from the production department take place via walkie-talkie. Not all operators have these devices, only the so-called indirect production workers (e.g., maintenance workers, technologists, quality control workers, and conductors); line operators do not have walkie-talkies. The latter, in many cases, are the first to notice the problem; they need an intermediary equipped with a walkie-talkie to report the problem to the conductor. In some cases, following the conductor’s intervention, they evaluate the need to request the intervention of a specialized operator (maintenance technician or technologist); also, in this case, communication takes place via walkie-talkie.
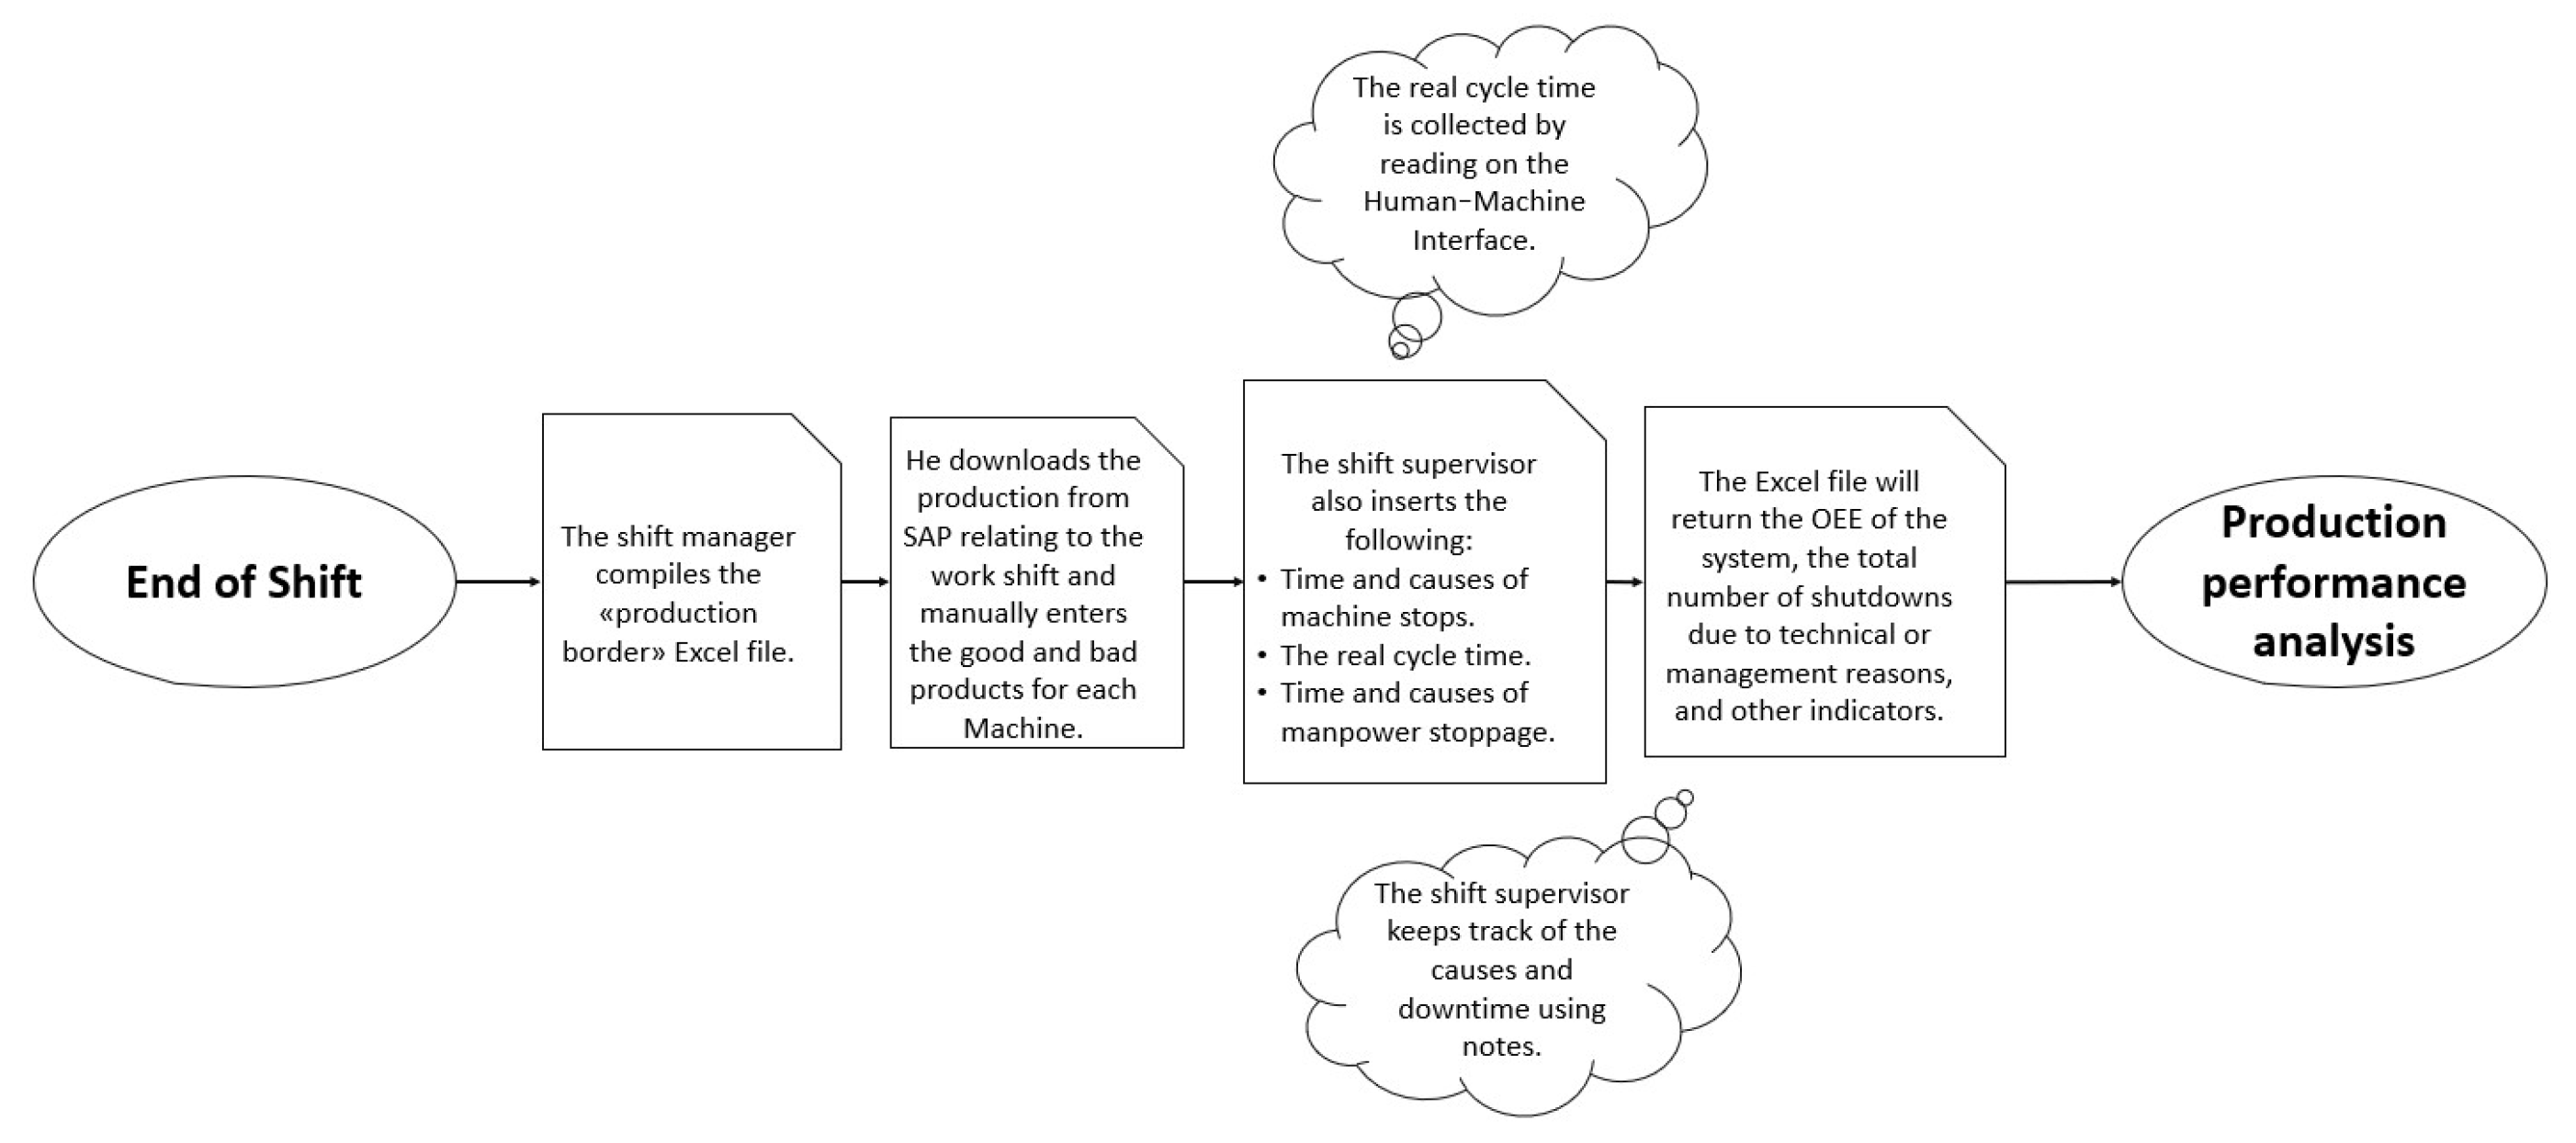
The exchange of information via walkie-talkie allows for fast and effective communication, but at the same time, it does not allow for the tracking of the information exchanged. The collection of information relating to the stoppage time, as shown in Figure 3, is entrusted to the work shift manager, who draws up a special Excel form at the end of the work shift in which they report the duration and cause of the stops that affected the different production units.

2.3. BPMN for Representation of TO-BE Processes

The main goal of the business process model and notation [26] is to provide a notation that is easily understood by all business users, from the enterprise to the analysts who create initial drafts of processes, the technical developers responsible for implementing the technology that will carry out these processes, and, finally, to the managers who will manage and monitor the processes. The notation consists of the basic elements of a simple flow chart (e.g., rectangles for tasks and diamonds for decision points). The BPMN standard allows for representations with different levels of detail and complexity. A set of fundamental graphic elements is envisaged, generally sufficient to model the simplest processes, to which the standard envisages the possibility of adding other elements in order to increase the level of detail of the representation. Abouzid & Saidi [27] analyzed the application of the BPMN to the manufacturing process, whereas Djatna & Munichputranto [28] used the BPMN to design the integration of an OEE data collection application in the manufacturing process.
For this research work, the BPMN notation followed the study phases of an application solution for the collection of manual data in order to better define the characteristics of the application solution and improve integration in injection molding processes.

2.4. TO-BE Downtime Management Process to Improve the Quality of Manually Collected Data

The new processes were obtained by applying the BPMN method. The use of the BPMN methodology for the definition of new processes was carried out to conceive and design a new architectural model that would manually improve the quality of the data collected. The architectural model described in Section 3 is therefore the result of applying the methodology, obtained from evaluating the inefficiencies found in the AS-IS processes for managing the problems of the production units. The TO-BE processes also allow for the full and effective integration of digital architectures into the processes. Compared to the AS-IS processes illustrated in Section 2.2, the substantial innovations lie in the digitization of the individual phases, which allows for the collection of information; the request for intervention; intervention login; and the description of the cause of the unit’s shutdown. In addition, other information will be obtained through the automatic data obtained from the IoT connection with the injection molding machine.
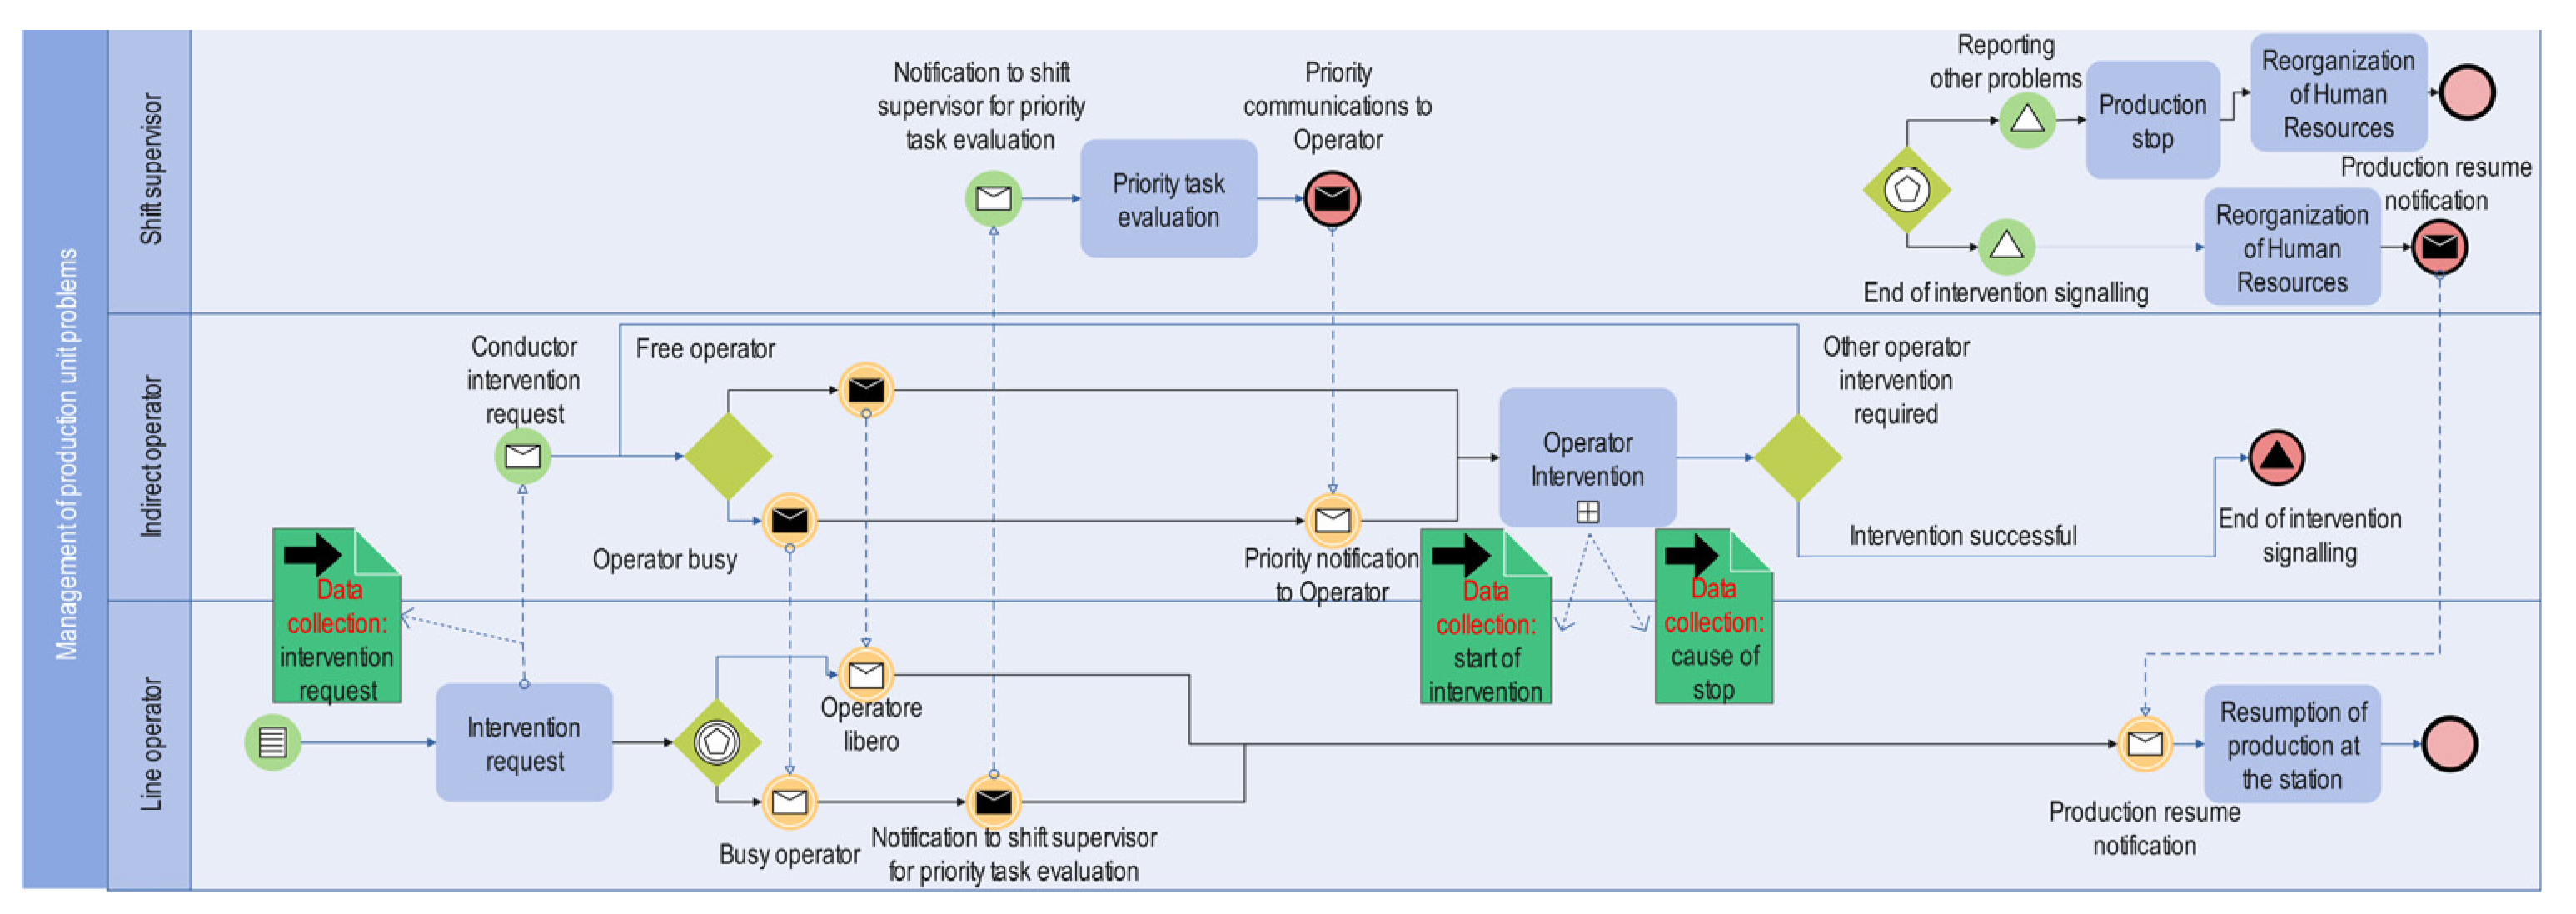
Figure 4 shows the entire interruption management process, which starts with the request for intervention up to the signaling of the end of the intervention. This process can involve different figures depending on the type of problem encountered. The central part of the problem management process is represented by the intervention process, which, regardless of the specific type of operator by which it is carried out, consists of the same sequence of phases described in Figure 5.
In Figure 4 and Figure 5, the three fundamental phases for the collection of manual data are shown. They are as follows:
  • Intervention request;
  • Intervention start;
  • Cause of unit shutdown.
The architectural model presented in the following section was designed to improve the effectiveness of manual data collection by focusing on these three stages of the process.

3. Architectural Model

3.1. Solutions for Monitoring a Plastic Injection Molding Production Line

The architectural model proposed in the following section was obtained starting from an in-depth knowledge of the process described in Section 2. The architectural model calculates the OEE indicator by calculating the sub-indicators from which it is composed: availability, performance, and quality. Moreover, the objective pursued by the model is to in a complete and accurate manner, collect the causes of stoppages of the production unit, and this this information is manually entered by the operators in charge. The architecture consists of the following parts, as shown in Figure 6:
  • Telemetry of the injection molding machine: data collected automatically by the injection molding machine’s programmable logic controller (PLC).
  • Intervention request system: for collecting data relating to an operator’s intervention request.
  • Intervention tracking system: for the digital tracking of the interventions carried out by the operators.
  • Human–system interface: to speed up the manual data collection phase.
  • Real-Time Monitoring Dashboard: allows one to analyze the monitoring information managed by the digital platform in an easy and intuitive way.
Figure 6. Architectural model.
Applsci 13 12145 g006

3.1.1. Telemetry of the Injection Molding Machine

Modern injection molding machines have a large number of sensors and other monitoring elements that allow you to obtain a lot of data. These data can be exchanged by the presses with other information systems using special communication protocols; the most common ones are released by the Euromap organization and by the Open Platform Communications (OPC) standard [29,30].
The data obtainable from the presses makes it possible to monitor the status of the production unit, a fundamental element for the analysis of interruptions. It is possible to precisely obtain the number and duration of individual machine stops, but it is not possible to obtain the cause of the stop because these data often disregard the data available from the press. Furthermore, the number of production cycles, the production parameters (temperature, pressure, etc.), and other quality and process data are available according to the sensor equipment of the single machine and the information entered manually by the operator in the PLC of the machine. The sheets of the data obtainable from the presses are reported in Table 1.
Through the data collected via the injection molding machine’s telemetry, for every machine ( M i ) , it is possible to calculate the OEE [13,15], considering its three fundamental elements.
Availability is defined as follows:
Availability A = Operating   Time Operating   Time + Downtime = S 1 S 1 + S 0
where Operating Time and Downtime are collected from the telemetry. Operating Time is calculated as the sum of the time that the machine is in the “in production” state S 1 . Downtime is calculated as the sum of the time that the machine is in the “stop” state S 0 .
Performance is defined as follows:
Performance P = Actual   Output   units   ×   Theoretical   Cycle   Time   T C T i Operating   Time =     = N i × T C T i S 1
where Actual Output (units) is obtained by the “count output” variable from the telemetry, while Theoretical Cycle Time can be obtained using an article information database.
Quality is defined as follows:
Quality Q = Actual   Output units Defect   Amount   ( units ) Actual   Output   units = N i D i N 1
where Defect Amount (units) is collected from the telemetry, summing the defect units in the chosen time interval. In some cases, for example, for older injection machines that do not have a system for defect recognition, this information will be taken from the Enterprise Resource System (ERP) or manually by operators.
In order to obtain a complete calculation of the OEE indicator, it is also necessary to accurately collect the causes that determine a stop of the production unit and the reasons that lead to a product being deemed non-compliant. The information reported is not obtainable from the telemetry data made available by the PLC of modern plastic injection molding presses. This information, therefore, must be collected manually by the process operators. The architectural model proposed in the following section aims to make the process for collecting the necessary manual information more efficient, accurate, and complete. In particular, the model focuses on the collection of data that allow one to analyze the causes of the production unit shutdowns.

3.1.2. Intervention Request System

The intervention request system aims to digitally manage the execution of requests and the call to the operator. The roles requested could be different based on the skills assigned to the different operators; the system allows the request to be made to the type of operator required, after which it will carry out an assessment of the availability of the required figure and then send a call. The main advantage of the digital and automatic management of this process lies in the possibility of keeping track of all the requests made and of the distribution of the workload among the various operators. In the absence of a digital intervention request system, the most commonly used tool is a walkie-talkie, which allows one to call the appropriate operator. Although this system is particularly effective for communication purposes, it does not automatically keep track of the information exchanged and the requests made.
A digital system for managing requests for intervention has the disadvantage of being more expensive than a simpler system, such as the use of walkie-talkies, and of being less flexible to changes in the process. Furthermore, the system must be designed effectively to ensure the correct sending and receiving of requests for intervention and therefore correct communication between the parties.
In order to achieve this goal, various technological solutions can be implemented. Concerning the application context described in Section 3.1, a simple push-button panel, interconnected with the system, could be used, which allows for a request for the intervention of a specific figure to be made using the various push-buttons. The requests are mainly made from the control and assembly station, which notices any malfunctions, qualitative defects, or other management needs to be overcome. Then, using a simple push-button panel, the line operator can effectively make the necessary request. A more complex digital device could also be prepared, such as a tablet or notebook/personal computer, but for this purpose, a simple push-button panel can suffice. On the other hand, for the operator to receive the call, a tablet or smartphone could be used, which, if interconnected to the system, could guarantee the correct reception of the intervention request. The sheets of the data required from the intervention request system are reported in Table 2.

3.1.3. Intervention Tracking System

Following the call, the operator reaches the production unit for which a request has been made. The intervention tracking system aims to guarantee that no intervention can be carried out without the operator declaring the start of their intervention on the production unit using a login. This condition, in order to be achieved, cannot be left to the common sense of the operator, but it is necessary to provide mechanisms that make it possible. Many presses for plastic injection molding make it possible to block the PLC commands of the machine if the user has not logged in. This option is particularly useful for the purposes of this research because it guarantees that an operator must register in order to adjust the machine parameters or carry out any other operation. Depending on the type of machine, logging in can be completed with a username and password or with a magnetic card associated with the ID of each operator. Furthermore, this type of information would be available via communication protocols (Euromap or OPC) and, in turn, recorded automatically by the system. This constraint does not represent a problem for managing emergency conditions, as the presses are equipped with an emergency button in each corner of the machine. The sheets of the data required from the intervention tracking system are reported in Table 3.
The duration of the intervention is calculated in the following way:
Duration   of   the   intervention   D I = D T i s i D T i e i
Furthermore, a new variable called Machine Stop During Intervention ( M S D I i ), which pertains to the time that the machine is in “stop” state during the intervention, can be created.
The variable date and time intervention end can be manually inserted by the operator when the intervention ends or can be obtained automatically via the interaction of the data of the intervention tracking system with the data from the telemetry; when the machine resumes production, the intervention can be deemed complete. In the automatic collection way of the variable “date and time intervention end,” an approximation is made, but with a view to obtaining the M S D I i variable and not to precisely calculating the duration of the operator’s intervention; this approximation could be accepted because it still allows the desired information to be obtained.
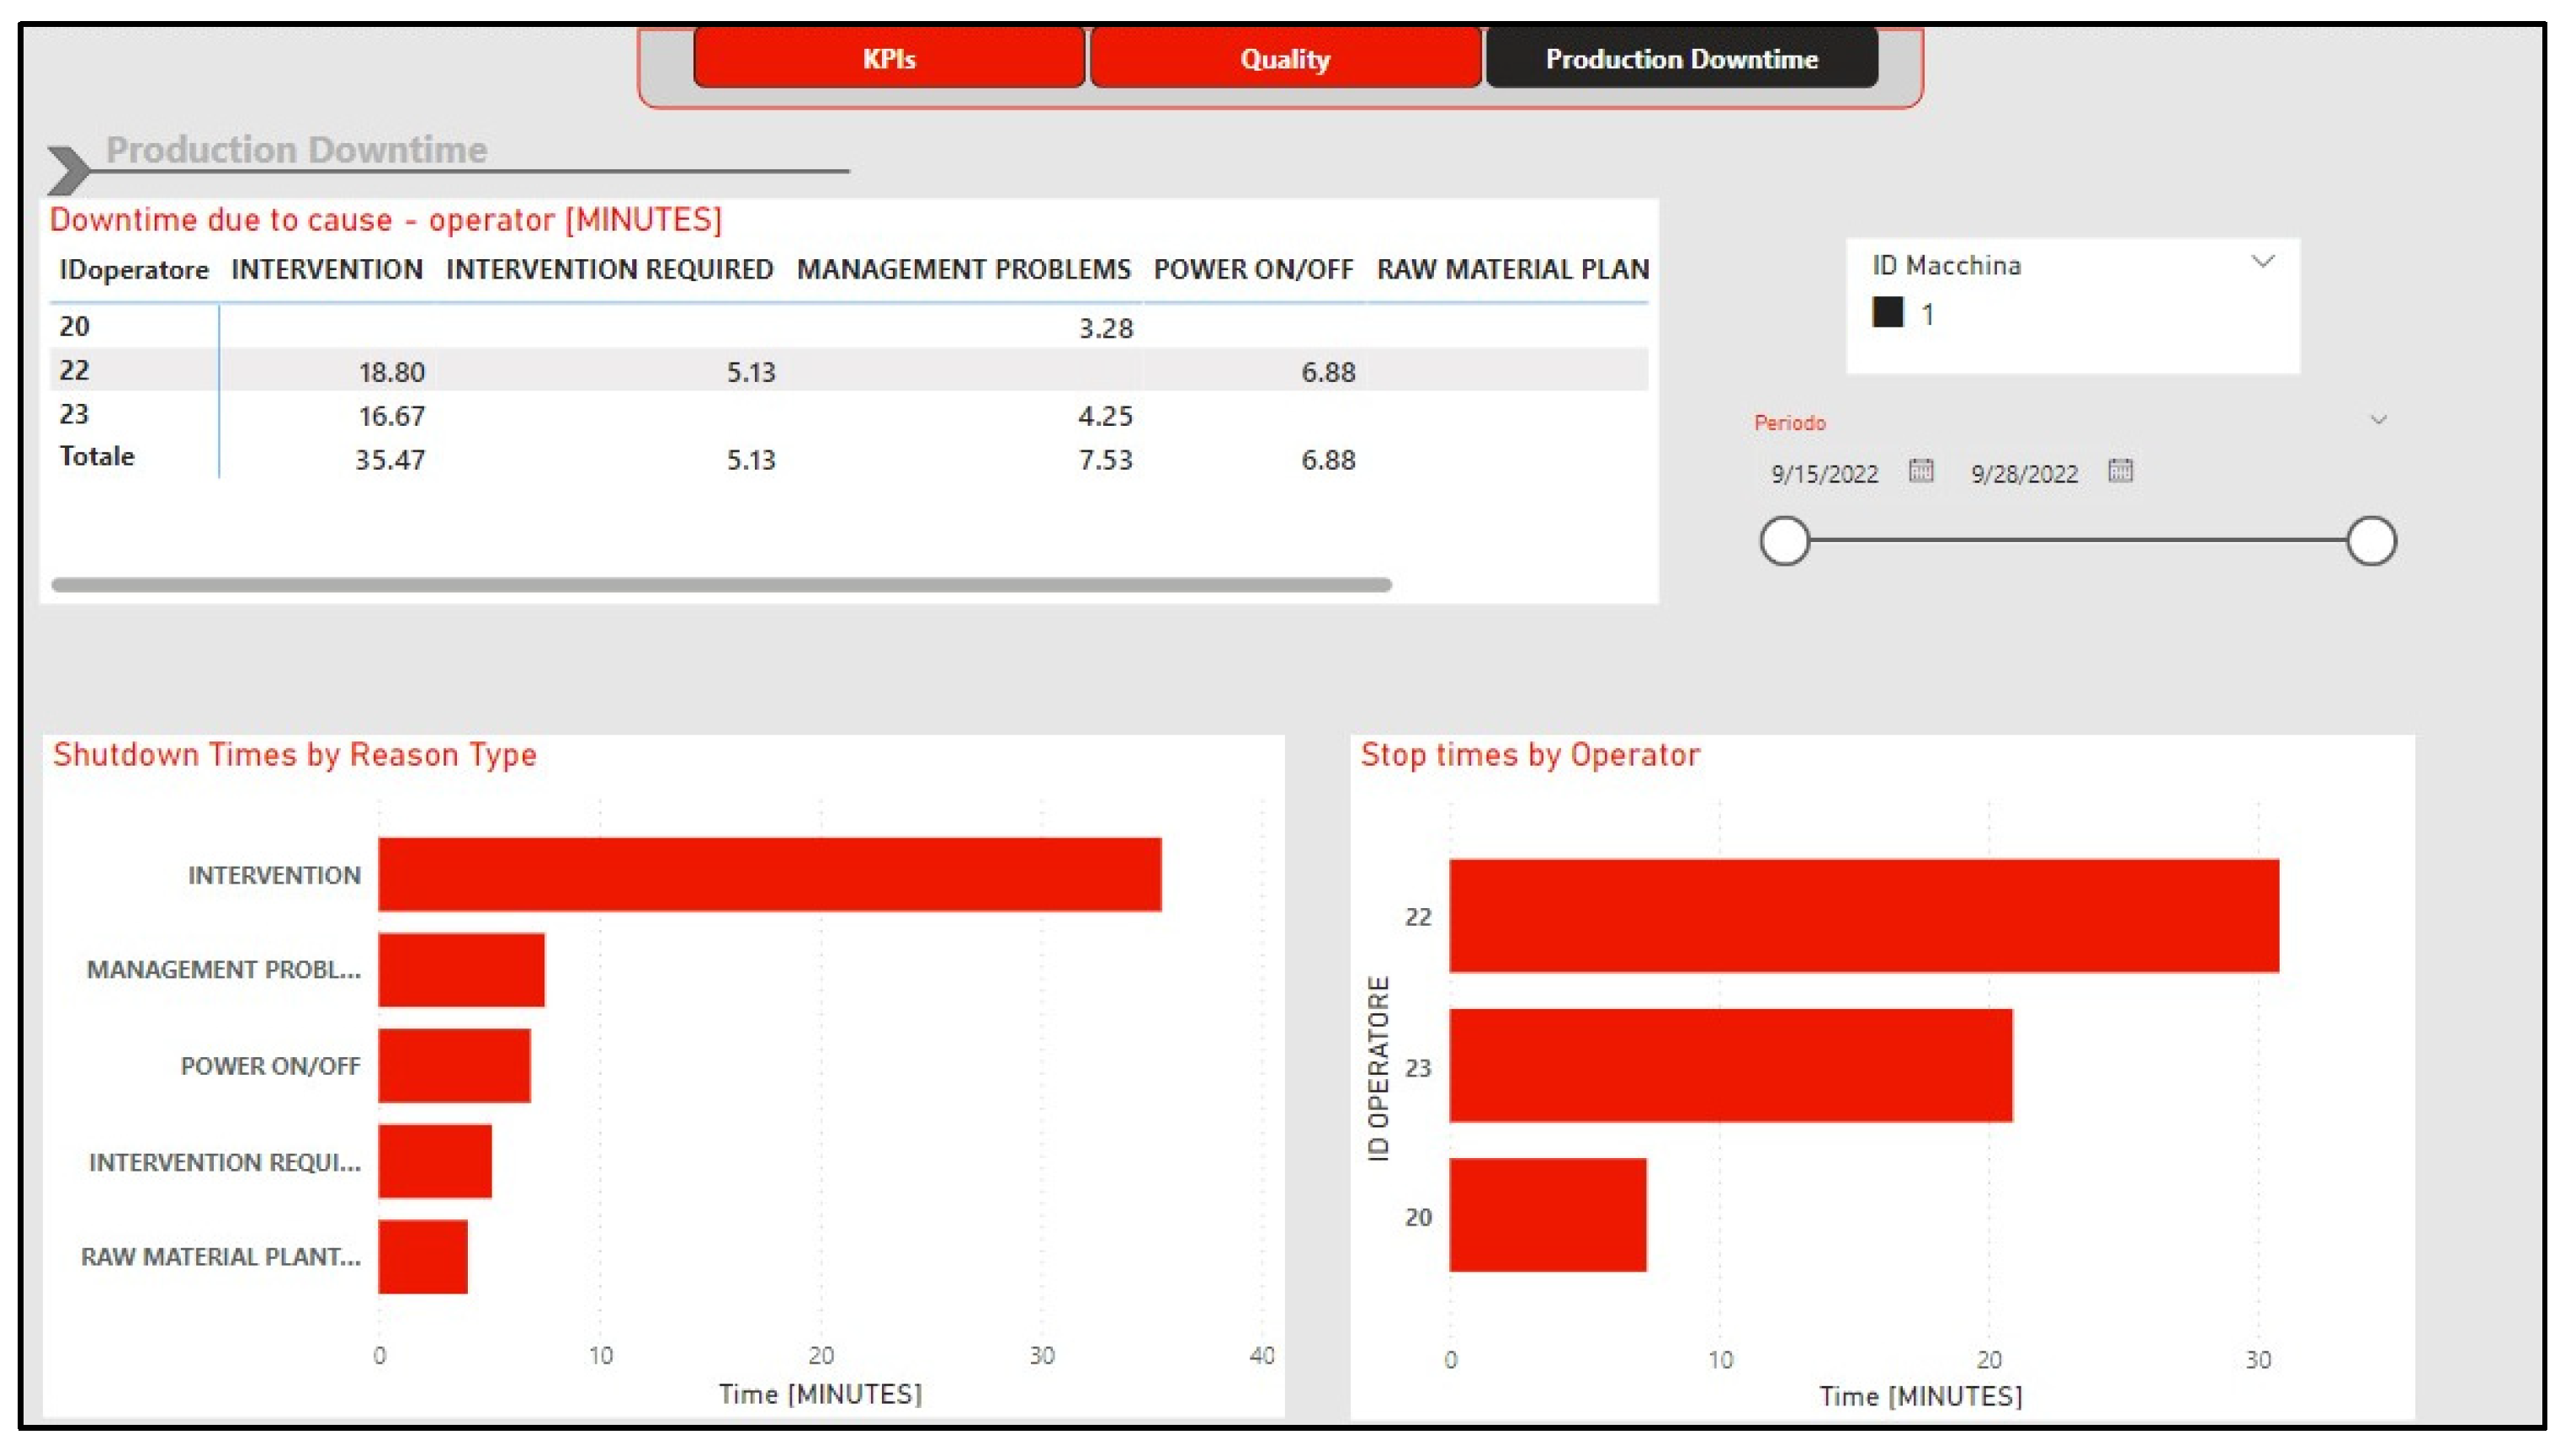
By summing the M S D I i variables observed in a chosen time interval and associated with a specific operator ID, it is possible to construct the Stop Time by Operator (STO) indicator, which expresses the total time (in minutes) that the production unit was in the stop state during the intervention by the operator identified by the specific ID.

3.1.4. Human–System Interface

The collection of the causes of shutdowns represents a fundamental element for analyzing the reasons for production unit interruptions. Thanks to the intervention tracking system, the stop that has affected a production unit is always connected to an operator who has intervened on it. The system then aims to interrogate the operator about the cause of the stop of the production unit. This function could be provided on the device that also allows one to manage calls, for example, a tablet or smartphone, as previously noted. The objective can therefore be achieved using specially created applications that allow the operator to associate a cause with the intervention and, possibly, with the stoppage that has affected the production unit. The interface should include customized screens based on the user who is using the system to provide the cause of the stop suggested based on the study of the process. Furthermore, the interface could be updated in real-time by the information coming from the telemetry from the machine, from the intervention request system, and the intervention tracking system and always provide the operator with the most up-to-date information requests.
For an application developed based on knowledge of the process and which operator does what, the first objective of the interface is to connect a stop event to an operator who is intervening on it in order to make the data collection process more accurate. Due to it having a connection between the stop event and the operator who intervened, the system knows where to look for the desired information. The system allows one to enter the reason for the stop both while the intervention is still in progress and after the intervention has ended. Furthermore, the system makes it possible to speed up the entry of the cause of the stoppage through knowledge of the process; prior to this, an operator–cause of stoppage association study has been carried out; therefore, the system suggests the causes most frequently entered by the operator logged into the system in order to speed up its insertion. The sheets of the data required from the human–system interface are reported in Table 4.
Through associating the type of cause of stoppage with the intervention ID, it is possible to deduce the calculated M S D I i (showed in the previous paragraph). Through summing the M S D I i variables associated with a reason for the type of stoppage, for a chosen time interval, it is possible to obtain the Shutdown Time by Reason Type (STRT).

3.2. The Dashboard for Performance Analysis

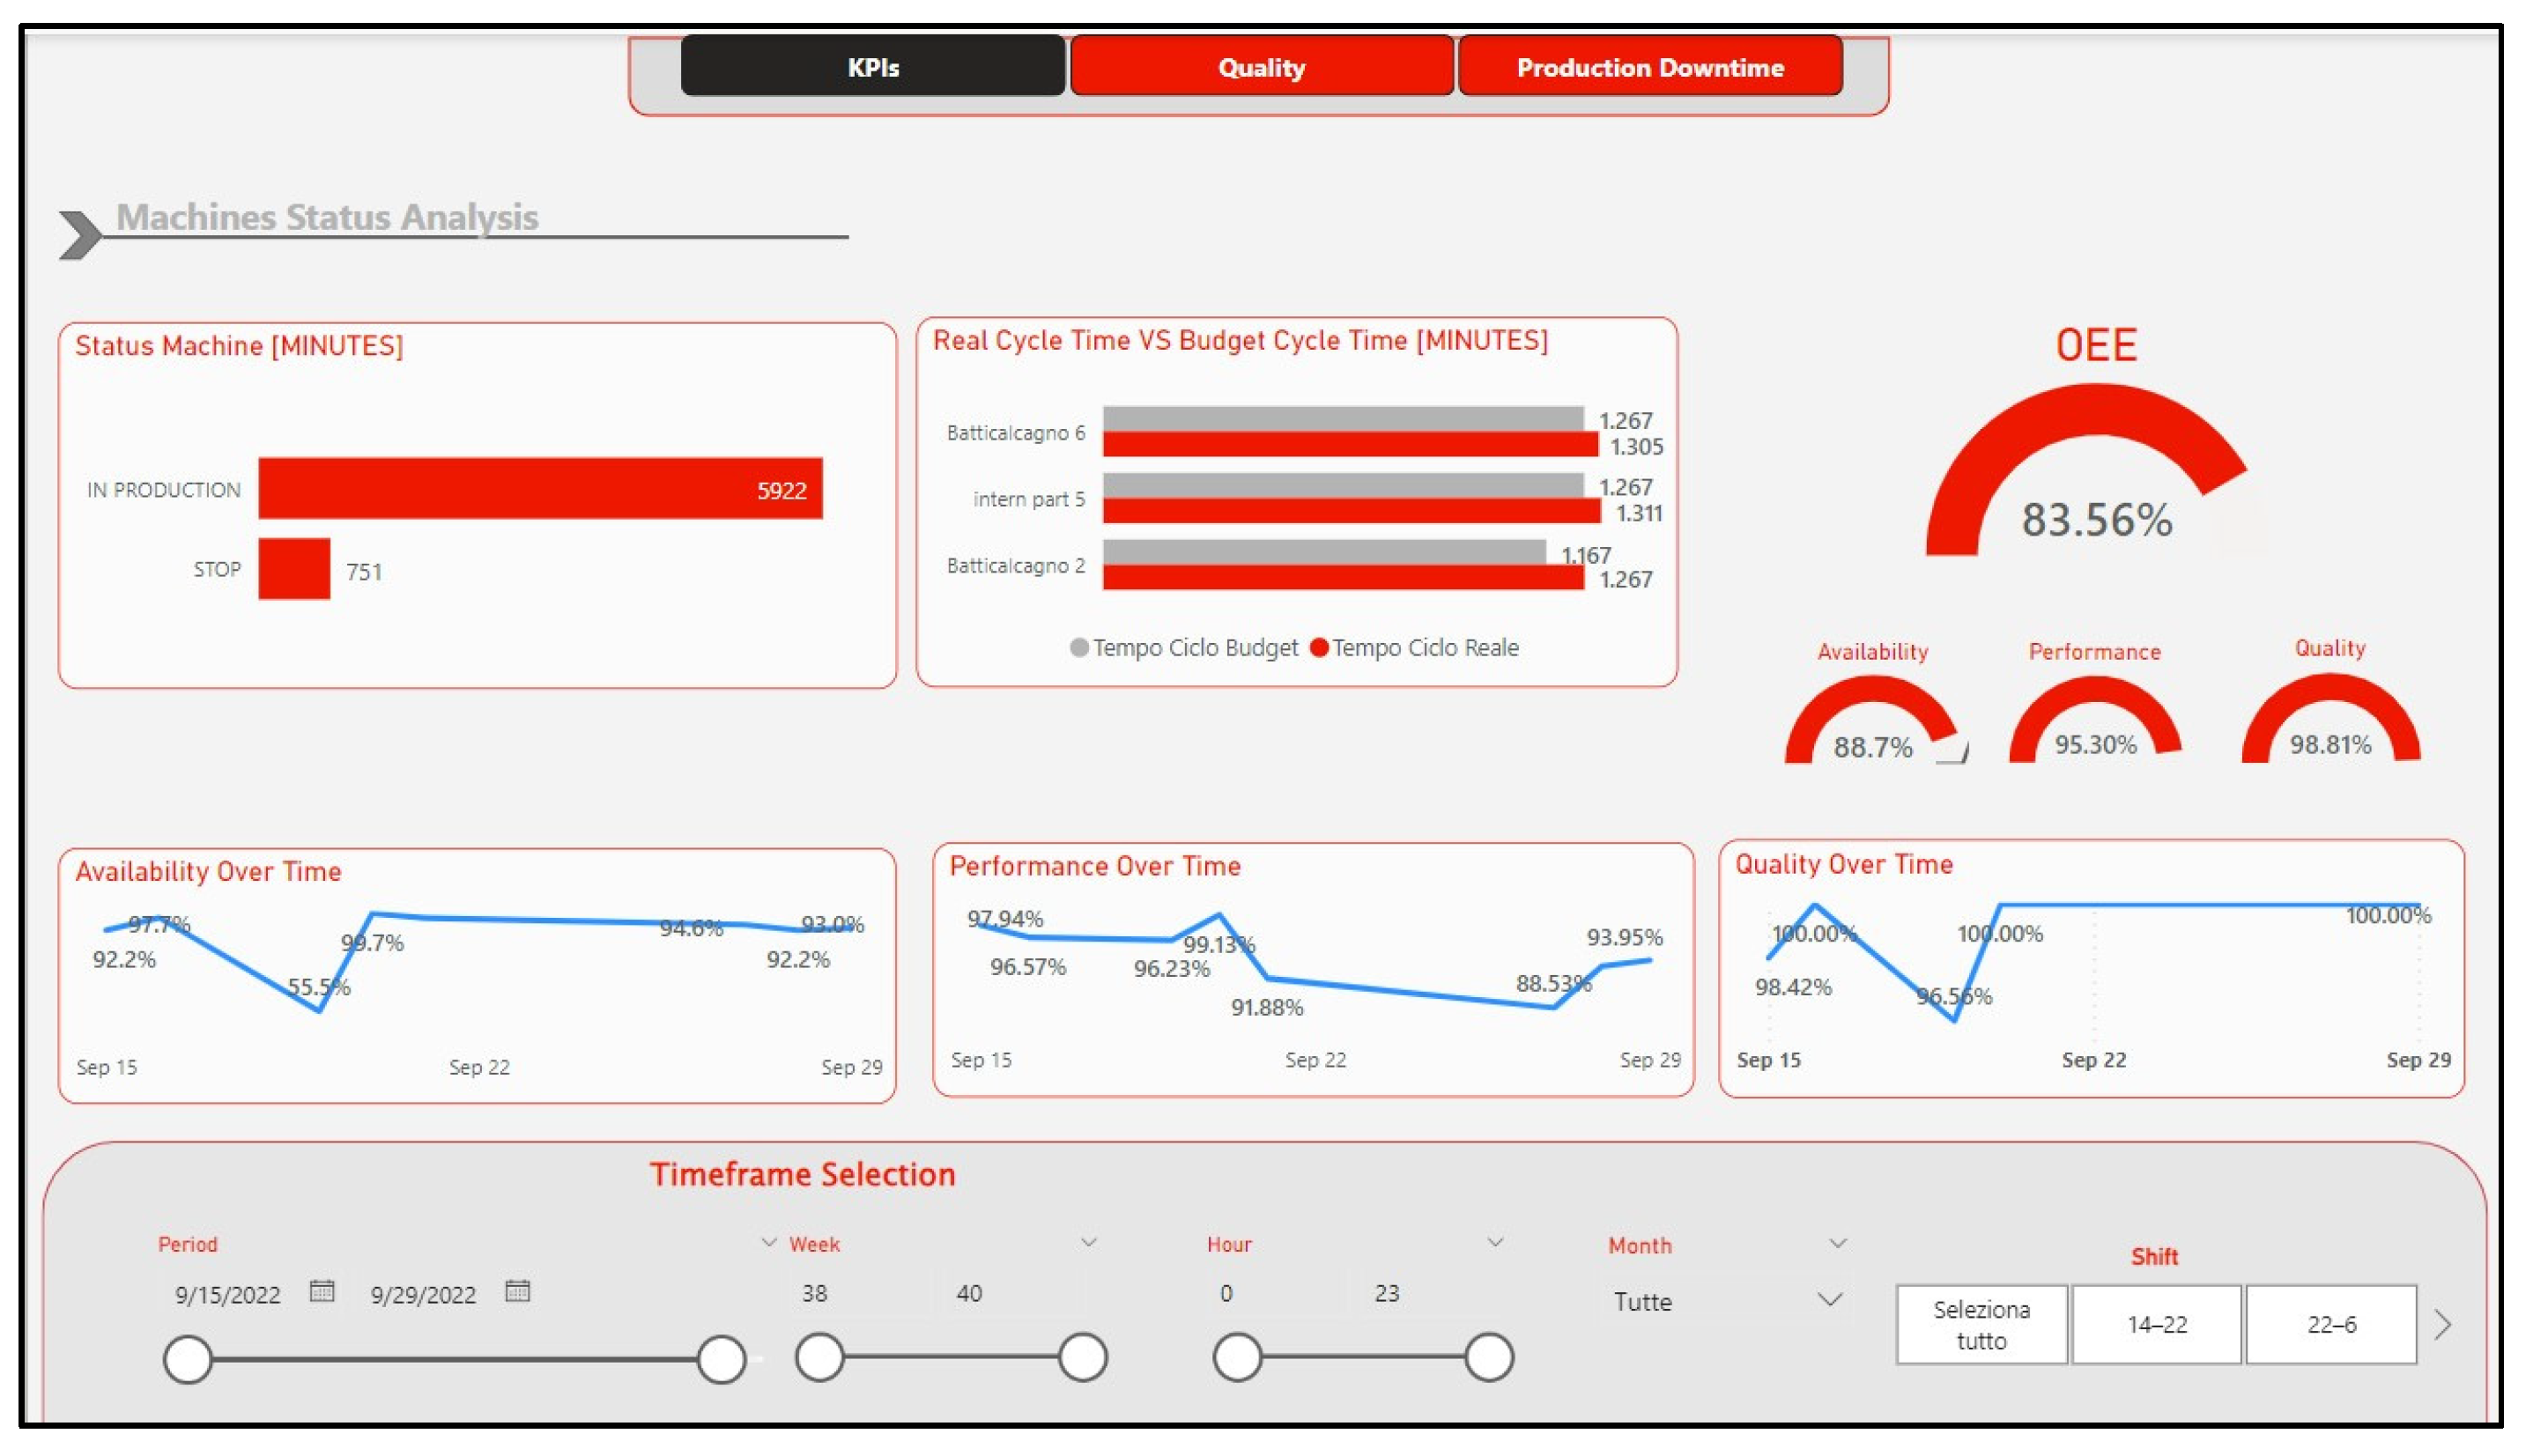
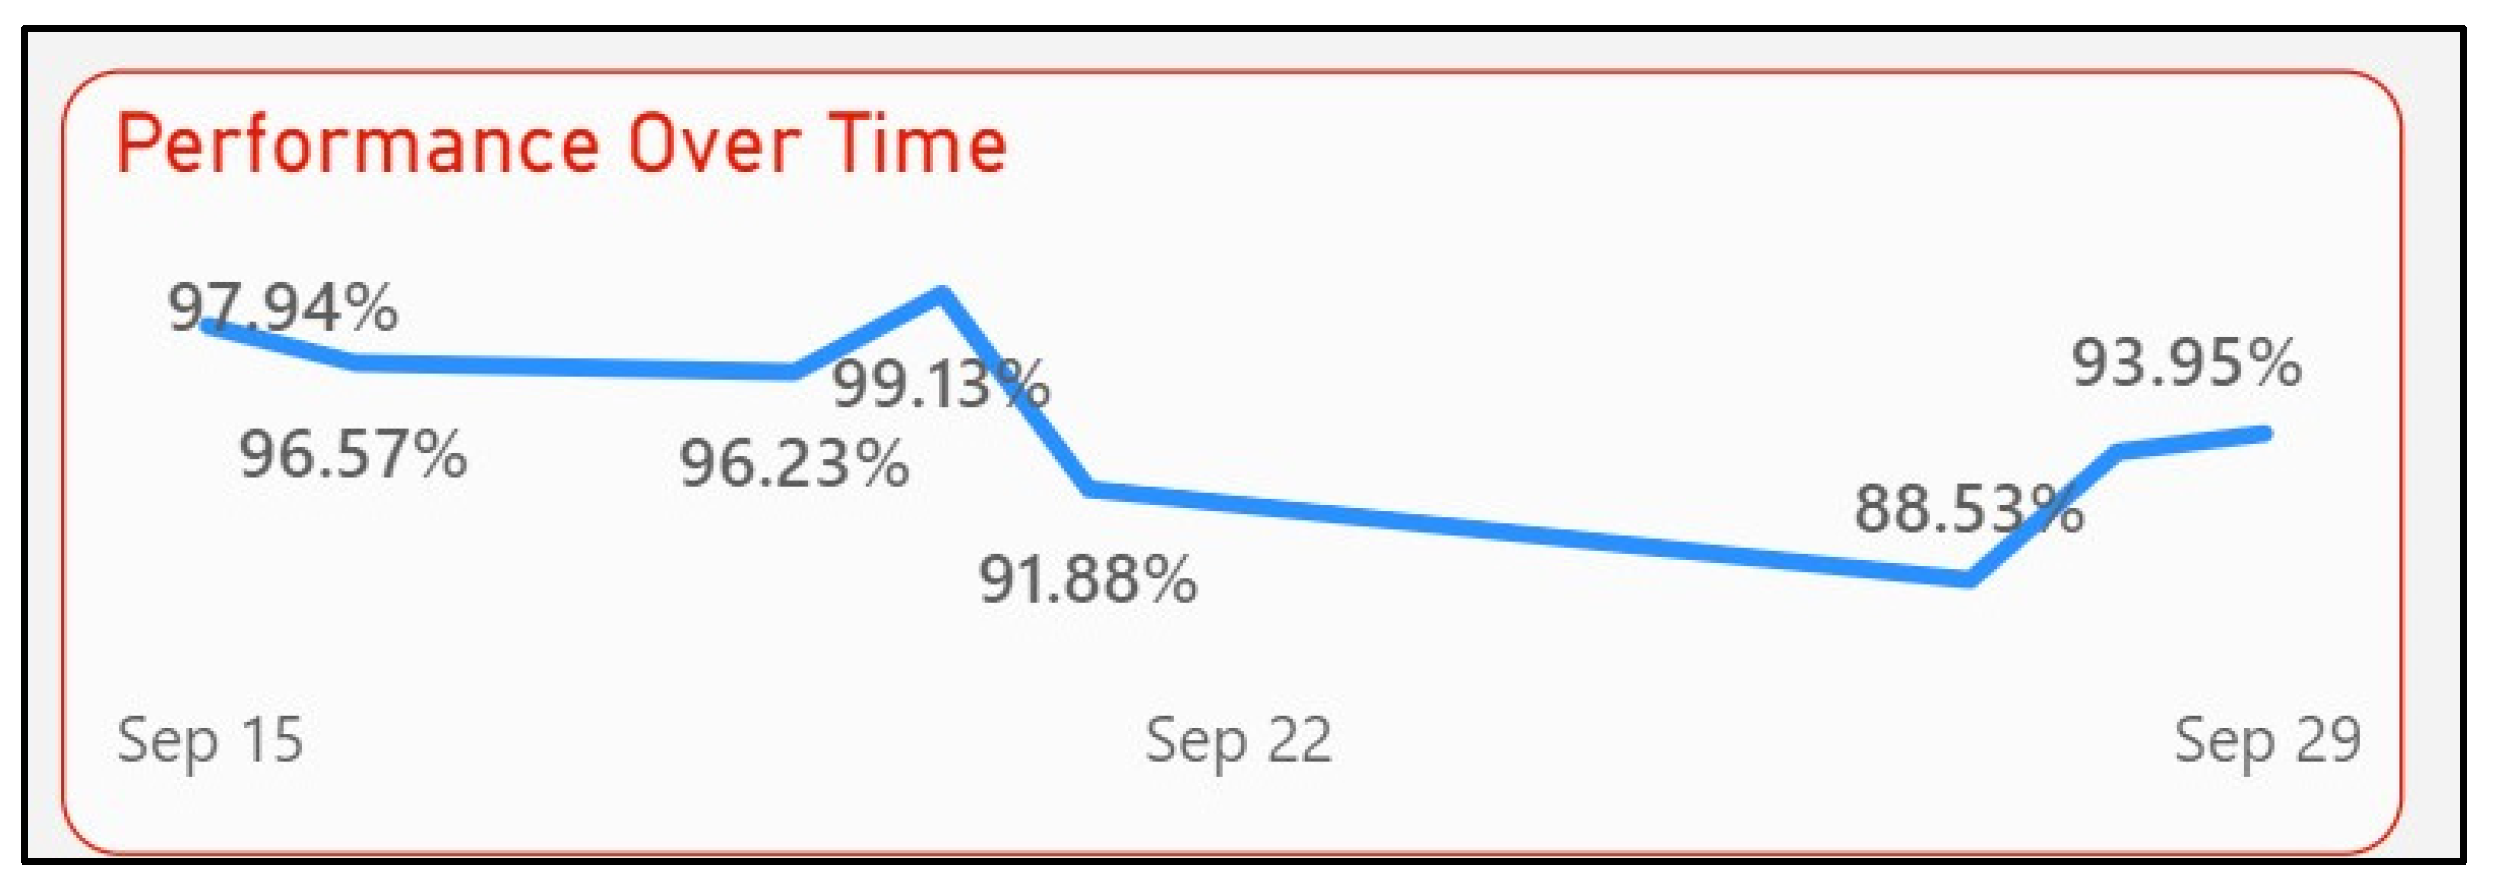
The data collected through the architectural model proposed in Section 3.1 are processed and made viewable in a monitoring dashboard. The dashboard has two objectives: to offer the possibility of monitoring the status of the different production units in real-time and to analyze the performance of the plant. The real-time monitoring takes place through a special screen that allows the status of the single production unit to be viewed using different colors according to the status shown in Section 2.1. For performance analysis, however, the dashboard allows you to calculate the OEE indicator for each production unit in its sub-indicators—availability, performance, and quality [12,13]—as shown in Figure 7. For the sub-indicators, the dashboard also presents the trend over time, as shown in detail in Figure 8. Furthermore, the dashboard shows the Shutdown Time by Reason Type (STRT) and the Stop Time by Operator (STO), as shown in Figure 9. For the analysis of performance, the dashboard allows for the analysis of the trend over time for each piece of information shown; it is also possible to apply filters to analyze the information by type of production unit, time interval, and type of operator.

4. Discussions and Conclusions

In the evolutionary context of Industry 4.0, studies regarding the application of enabling technologies and, in particular, the IoT are useful elements in order to obtain a greater understanding of monitoring the performance of production processes [11]. The OEE indicator is recognized in the scientific literature as a useful KPI to monitor the performance of production processes [13,14]. Not all the information required to calculate OEE is easy to obtain through an automatic IoT data collection system, so the integration of automated collected data and manually collected data is required; furthermore, this field requires more investigation [18].
The objective of this work was to answer the following research questions: How could plastic injection molding manufacturers collect manual data on machine downtime events, ensuring a high level of data quality? How can modern technologies be used to improve manual data collection? Through an in-depth analysis of the downtime management process in an injection molding manufacturing context, the AS-IS downtime management process, which allows for the description of the information flow as a first step for the application of the BPMN method, was identified. Subsequently, through applying the BPMN method, the characteristics required by the architectural model and, in turn, the TO-BE process were defined. The architectural model and the TO-BE process have been described to improve the completeness and accuracy of data that cannot be collected automatically. The IoT system made up of the telemetry collected by the injection molding machine allows for the calculation of the OEE, but it is not possible to obtain information on the causes of machine downtime and information on the operator’s intervention. The architecture for the effective collection of manual data is composed of an intervention request system, an intervention tracking system, a human–system interface, and a monitoring dashboard. Through the intervention request system, it is possible to help the line operator request the intervention of an operator in case of a problem on the production line. In addition, intervention requests are automatically saved from the architectural model, so information about the intervention is not lost. With the traceability system of the interventions, it is possible to identify the operator who intervenes on the machine; in this way, the machine stop time obtained automatically from the telemetry is connected to an operator who perfectly knows the cause of the machine stoppage. It is important to make it mandatory for the operator to log in to the system when they start their intervention (if possible, by locking that machine panel without logging in). The human–system interface is connected with all the data available in the architectural model in real-time; therefore, the system requests an intervention from the operator who is logged in to a unit to enter the cause of the block. The system suggests the most probable cause based on the information available (type of operator, duration of downtime, type of production unit). In this way, the operation was facilitated by inserting the cause, and the outcome of the operation was simple and fast. After manual and automated data collection, the architecture calculates the KPI and displays it in the dashboard, and the dashboard also shows the aggregated time for downtime caused in the selected time range.
Combining the different elements of the proposed architectural model (machine telemetry, intervention request system, intervention tracking system, and human–system interface) can enable more effective data collection. Every element of the platform—the telemetry of the machine (providing high-quality automated data related to the working time of the machine and other information related to the production), the intervention request system (which enables automatic collection, requests the intervention, and collects the information related to the requests), the intervention tracking system (which allows one to accurately collect information associated with the duration of the intervention), and the human–system interface (which facilitates the collection of the reasons of the stoppage, meaning that only the operator can manually collect the relevant data)—is essential for improving data quality. The improvement in the quality of information has had positive effects on the effectiveness of investment efforts to improve the efficiency of production plants. More precise information on downtime monitoring helps to maintain strong business quality potential within a limited time and with limited expense [16,17]. This paper could help improve the power related to the quality of manual data collection, which is often seen by researchers as an acquisition system that can only be substituted by an automatic system. Other research works have set out to improve the quality of manual data [20] but without the use of an IoT architecture that exploits real-time monitoring and in-depth knowledge of the process to obtain information relating to stops, a mandatory task.
As demonstrated by Hermundsdottir et al. [31], cost reduction, as a function of resource reduction, is linked to a positive environmental impact. In the future, more investigations are needed to understand the environmental impact of improving the quality of data on the performance of production units.
The main limitation of the present research study is linked to its absence of reporting on applying the proposed architectural model in a productive context. Future research studies must investigate the application of the architectural model in a real production context. It is important to evaluate the real benefits produced and the problems that could arise from using the system for the process. The architectural model was designed ad hoc for the injection molding production line to improve manual data quality without slowing down the process; the architecture can be applied in different fields, but it must evaluate the fitting between the solution and the process.

Author Contributions

Conceptualization, G.L., V.D.P., M.F. and S.R.; methodology, V.D.P. and M.C.P.; writing—original draft preparation, G.L. and V.D.P.; writing—review and editing, V.D.P. and M.C.P.; supervision, M.F. and S.R.; funding acquisition, M.F. All authors have read and agreed to the published version of the manuscript.

Funding

This research article was funded by the Italian Ministry of Economic Development under the “SIM 4.0” project (grant number F/190172/03/X44), FESR 2014–2020 Italian program (46458), and Horizon 2020 EU program.

Data Availability Statement

Data are contained within the article.

Conflicts of Interest

The authors declare no conflict of interest. The funders had no role in the design of the study; in the collection, analyses, or interpretation of data; in the writing of the manuscript; or in the decision to publish the results.

References

  1. Santos, C.; Mehrsai, A.; Barros, A.; Araújo, M.; Ares, E. Towards Industry 4.0: An overview of European strategic roadmaps. Procedia Manuf. 2017, 13, 972–979. [Google Scholar] [CrossRef]
  2. Lu, Y. Industry 4.0: A survey on technologies, applications and open research issues. J. Ind. Inf. Integr. 2017, 6, 1–10. [Google Scholar] [CrossRef]
  3. Ghobakhloo, M. The future of manufacturing industry: A strategic roadmap toward Industry 4.0. J. Manuf. Technol. Manag. 2018, 29, 910–936. [Google Scholar] [CrossRef]
  4. Reddy, K.S.P.; Roopa, Y.M.; Kovvada Rajeev, L.N.; Nandan, N.S. IoT based smart agriculture using machine learning. In Proceedings of the 2nd International Conference on Inventive Research in Computing Applications (ICIRCA 2020), Coimbatore, India, 15–17 July 2020. [Google Scholar]
  5. Massaro, A.; Mastandrea, G.; D’Oriano, L.; Rana, G.R.; Savino, N.; Galiano, A. Systems for an intelligent application of Automated Processes in industry: A case study from ‘PMI IoT Industry 4.0’project. In Proceedings of the 2020 IEEE International Workshop on Metrology for Industry 4.0 & IoT, Roma, Italy, 3–5 June 2020; IEEE: Piscataway, NJ, USA, 2020. [Google Scholar]
  6. Chakravarthi, V.S. Internet of Things and M2M Communication Technologies: Architecture and Practical Design Approach to IoT in Industry 4.0; Springer International Publishing: Midtown Manhattan, NY, USA, 2021. [Google Scholar] [CrossRef]
  7. Chen, B.; Wan, J.; Shu, L.; Li, P.; Mukherjee, M.; Yin, B. Smart Factory of Industry 4.0: Key Technologies, Application Case, and Challenges. IEEE Access 2017, 6, 6505–6519. [Google Scholar] [CrossRef]
  8. Bu, L.; Zhang, Y.; Liu, H.; Yuan, X.; Guo, J.; Han, S. An IIoT-driven and AI-enabled framework for smart manufacturing system based on three-terminal collaborative platform. Adv. Eng. Inform. 2021, 50, 101370. [Google Scholar] [CrossRef]
  9. Hofmann, E.; Rüsch, M. Industry 4.0 and the current status as well as future prospects on logistics. Comput. Ind. 2017, 89, 23–34. [Google Scholar] [CrossRef]
  10. Pivoto, D.G.S.; de Almeida, L.F.F.; Da Rosa Righi, R.; Rodrigues, J.J.P.C.; Lugli, A.B.; Alberti, A.M. Cyber-physical systems architectures for industrial internet of things applications in Industry 4.0: A literature review. J. Manuf. Syst. 2021, 58, 176–192. [Google Scholar] [CrossRef]
  11. Laghari, R.A.; Mekid, S. Comprehensive approach toward IIoT based condition monitoring of machining processes. Measurement 2023, 217, 113004. [Google Scholar] [CrossRef]
  12. Corrales, L.d.C.N.; Lambán, M.P.; Korner, M.E.H.; Royo, J. Overall Equipment Effectiveness: Systematic Literature Review and Overview of Different Approaches. Appl. Sci. 2020, 10, 6469. [Google Scholar] [CrossRef]
  13. Iannone, R.; Elena, M. Managing OEE to Optimize Factory Performance. In Operations Management; InTech: Pulau Pinang, Malaysia, 2013. [Google Scholar] [CrossRef]
  14. Li, X.; Liu, G.; Hao, X. Research on Improved OEE Measurement Method Based on the Multiproduct Production System. Appl. Sci. 2021, 11, 490. [Google Scholar] [CrossRef]
  15. Schiraldi, M.M.; Varisco, M. Overall Equipment Effectiveness: Consistency of ISO standard with literature. Comput. Ind. Eng. 2020, 145, 106518. [Google Scholar] [CrossRef]
  16. Cheah, C.K.; Prakash, J.; Ong, K.S. Overall equipment effectiveness: A review and development of an integrated improvement framework. Int. J. Prod. Qual. Manag. 2020, 30, 46. [Google Scholar] [CrossRef]
  17. Singh, S.; Khamba, J.S.; Singh, D. Analyzing the Role of Six Big Losses in OEE to Enhance the Performance: Literature Review and Directions. In Lecture Notes in Mechanical Engineering; Springer Science and Business Media Deutschland GmbH: Berlin/Heidelberg, Germany, 2021; pp. 411–421. [Google Scholar] [CrossRef]
  18. Breiter, S.; Arlinghaus, J.C. Disruption data collection in low-volume, complex product assembly. IFAC-PapersOnLine 2021, 54, 80–85. [Google Scholar] [CrossRef]
  19. Kaya, O.; Bergsjö, D.; Kaya, O.; Bergsjö, D. Learning from digital disturbance management in an integrated product development and production flow. Int. J. Prod. Lifecycle Manag. 2018, 11, 295–325. [Google Scholar] [CrossRef]
  20. Li, Y.H.; Inoue, L.C.G.V.; Sinha, R. Real-time OEE visualisation for downtime detection. In Proceedings of the IEEE International Conference on Industrial Informatics (INDIN), Perth, Australia, 25–28 July 2022; Institute of Electrical and Electronics Engineers Inc.: Piscataway, NJ, USA, 2022; pp. 729–734. [Google Scholar] [CrossRef]
  21. Breiter, S.; Gottwald, J.; Arlinghaus, J.C. Recording Data on Production Disruptions: Usability and Data Quality. IFAC-PapersOnLine 2022, 55, 964–969. [Google Scholar] [CrossRef]
  22. Breiter, S.; Gottwald, J.; Arlinghaus, J.C. Manual Collection of Data on Disruptions: Determinants to Increase the Intention to Use. IFAC-PapersOnLine 2022, 55, 952–957. [Google Scholar] [CrossRef]
  23. Tortora, A.M.R.; Di Pasquale, V.; Franciosi, C.; Miranda, S.; Iannone, R. The Role of Maintenance Operator in Industrial Manufacturing Systems: Research Topics and Trends. Appl. Sci. 2021, 11, 3193. [Google Scholar] [CrossRef]
  24. Rosato, D.V.; Rosato, M.G. Injection Molding Handbook; Springer Science & Business Media: Berlin/Heidelberg, Germany, 2012. [Google Scholar]
  25. Nwanya, S.; Udofia, J.; Ajayi, O. Optimization of machine downtime in the plastic manufacturing. Cogent Eng. 2017, 4, 1335444. [Google Scholar] [CrossRef]
  26. BPMN 2.0. Available online: https://www.omg.org/spec/BPMN/2.0 (accessed on 1 August 2023).
  27. Abouzid, I.; Saidi, R. Proposal of BPMN extensions for modelling manufacturing processes. In Proceedings of the 2019 5th International Conference on Optimization and Applications (ICOA), Kenitra, Morocco, 25–26 April 2019; IEEE: Piscataway, NJ, USA, 2019; pp. 1–6. [Google Scholar] [CrossRef]
  28. Djatna, T.; Munichputranto, F. An Analysis and Design of Mobile Business Intelligence System for Productivity Measurement and Evaluation in Tire Curing Production Line. Procedia Manuf. 2015, 4, 438–444. [Google Scholar] [CrossRef]
  29. EUROMAP 67. Electrical Interface between Injection Moulding Machine and Handling Device/Robot This Recommendation was Prepared by the Technical Commission of EUROMAP. Available online: www.euromap.org/technical-issues/technical-recommendations (accessed on 20 July 2023).
  30. OPC Foundation. Unified Architecture. Available online: https://opcfoundation.org/about/opc-technologies/opc-ua/ (accessed on 24 July 2023).
  31. Hermundsdottir, F.; Aspelund, A. Competitive sustainable manufacturing—Sustainability strategies, environmental and social innovations, and their effects on firm performance. J. Clean. Prod. 2022, 370, 133474. [Google Scholar] [CrossRef]
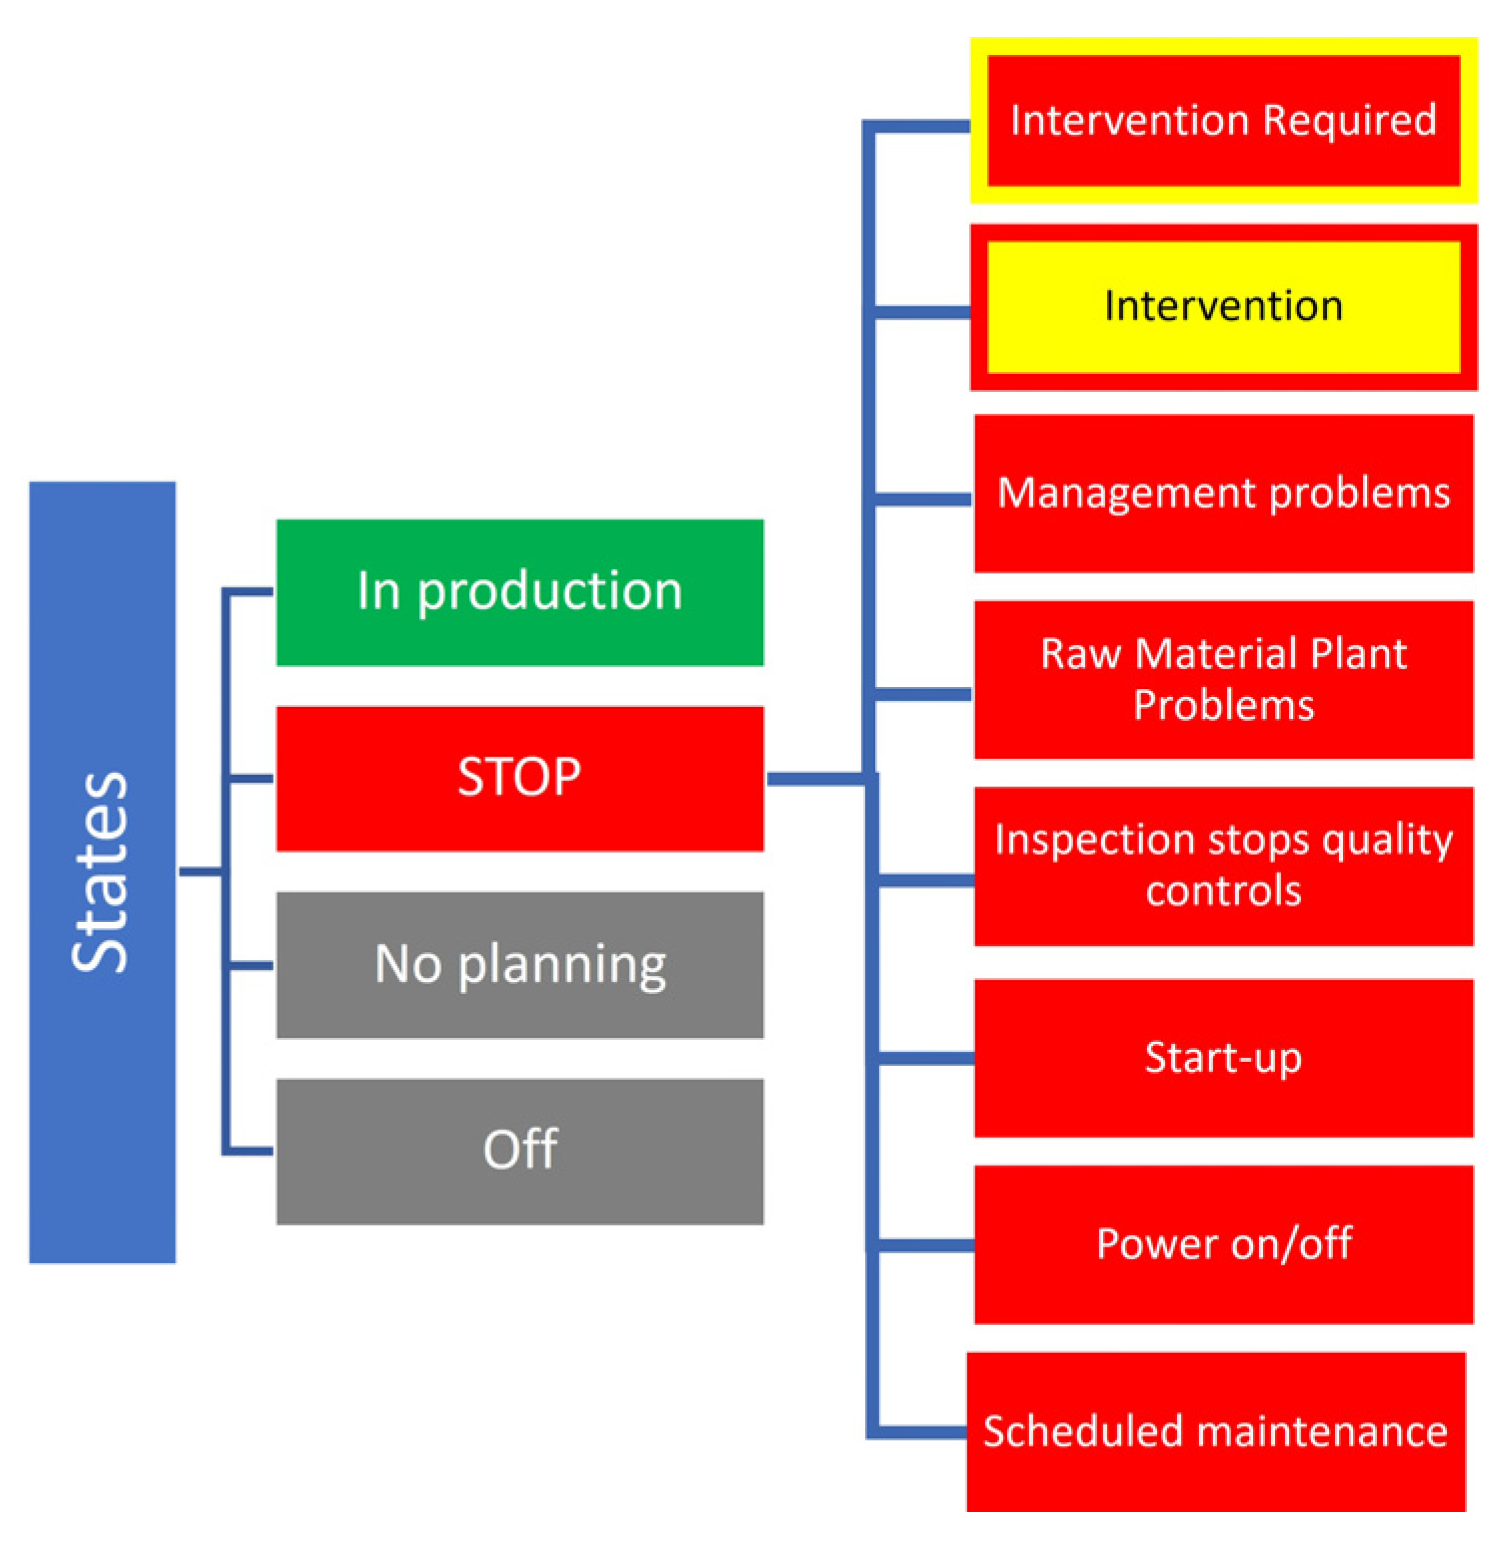
Figure 1. Defined states of unit production.
Applsci 13 12145 g001
Figure 2. AS-IS downtime management process.
Applsci 13 12145 g002
Figure 3. AS-IS downtime event duration collection process.
Applsci 13 12145 g003
Figure 4. BPMN downtime management TO-BE process.
Applsci 13 12145 g004
Figure 5. BPMN intervention TO-BE process.
Applsci 13 12145 g005
Figure 7. Dashboard—analysis panel of the OEE and its sub-indicators.
Applsci 13 12145 g007
Figure 8. Dashboard—zoom on performance over time panel.
Applsci 13 12145 g008
Figure 9. Dashboard—analysis panel of the causes of stoppages regarding the production unit.
Applsci 13 12145 g009
Table 1. Datasheets: telemetry of the injection molding machine.
NameVariableDescription
Date and Time stamp D T s i The variable is reported for each row when the value of any variable changes.
Machine ID M i An ID is associated with each machine.
Status S i Machine status can be either in production or stop.
Count outputs N i The variable is a counter that is incremented by one unit for each print cycle.
Defect D i The variable is a Boolean that is 0 if the unit is good and 1 if it is defective.
Table 2. Datasheets: intervention request system.
NameVariableDescription
Date and Time request D T r i The variable reports when the request is effected.
Machine ID M i ID of the machine where intervention is effected
Request ID R i An ID is associated with each request.
Intervention required I i The types of intervention can be conductor, maintenance, or technologist.
Table 3. Datasheets: intervention tracking system.
NameVariableDescription
Date and Time intervention start D T i s i The variable reports when the intervention starts.
Date and Time intervention end D T i e i The variable reports when the intervention ends.
Machine ID M i Machine’s ID where intervention is effected.
Operator ID O i This variable identifies the operator.
Intervention ID I i An ID is associated with each intervention tracked by the system.
Request ID R i If the intervention is associated with a request.
Table 4. Datasheets: human–system interface.
NameVariableDescription
Date and Time inserting cause of downtime D T i c d i The variable reports when the request is effected.
Machine ID M i Machine’s ID where intervention is effected
Operator ID O i The variable identifies the operator.
Intervention ID I i The variable identifies the intervention.
Reason for type of stoppage R T S i The cause of stoppage is one of those shown in Figure 1.
Disclaimer/Publisher’s Note: The statements, opinions and data contained in all publications are solely those of the individual author(s) and contributor(s) and not of MDPI and/or the editor(s). MDPI and/or the editor(s) disclaim responsibility for any injury to people or property resulting from any ideas, methods, instructions or products referred to in the content.