Article

The Simulation of Dielectric Barrier Discharge for Breakdown Voltage in Starch Modification

by
Pitchasak Chankuson
1,*,
Paramee Chumsri
2 and
Apinun Plodkaew
3
1
Department of Physics, Faculty of Science and Technology, Nakhon Si Thammarat Rajabhat University, Nakhon Si Thammarat 80280, Thailand
2
Department of Culinary Science, Faculty of Science and Technology, Nakhon Si Thammarat Rajabhat University, Nakhon Si Thammarat 80280, Thailand
3
Nakhonsawan Campus, Mahidol University, Nakhonsawan 60130, Thailand
*
Author to whom correspondence should be addressed.
Appl. Sci. 2023, 13(22), 12143; https://doi.org/10.3390/app132212143
Submission received: 23 October 2023 / Revised: 4 November 2023 / Accepted: 7 November 2023 / Published: 8 November 2023

Abstract

:
This paper presents the simulation results for dielectric barrier discharge (DBD) at atmospheric pressure in argon gas for different relative permittivity, granule shape, thickness layer, and granule diameter measurements for starch on the breakdown voltage. DBD is commonly utilized to generate cold plasma for starch modification. The electric field was computed using COMSOL Multiphysics 5.3a software. The breakdown voltage was calculated employing Paschen’s law for this electric field. The voltage was found according to the breakdown criterion for gap distance 0.2–1.0 cm, and then the Paschen curve could be plotted. The results show that the top electrode of the plasma system may be replaced with the parallel plate electrode by a mesh electrode with a bigger mesh size to achieve a lower breakdown voltage. In addition, increasing the relative permittivity and decreasing the thickness layer can reduce the applied voltage for plasma formation. When compared to the sphere and ellipsoid shapes, starch with a polyhedral granule shape requires a significantly lower voltage for breakdown. The starch granule diameter does not affect the breakdown voltage. These findings can be utilized to determine the optimal breakdown voltage for each type of starch modification, contributing to the construction of a high-efficiency plasma production system for starch modification.

1. Introduction

Starch, a polymeric carbohydrate molecule, is used in both food and non-food products. It occurs as semi-crystalline granules and serves as the majority of green plants’ primary energy store. The starch granule is made up of two main polyglucans called amylose and amylopectin. Both are composed of chains of D-glucose units that are -(1,4)-linked and joined together by -(1,6)-glycoside linkages to form polymer branches [1,2,3]. Starch is widely utilized in the food and non-food industries, as well as in the production of biodegradable packaging and in the chemical, pharmaceutical, and biomedical fields [4,5,6]. Starch is treated with various physical, chemical, and biological/enzymatic processes to modify its structure and provide it with functional properties needed for particular usages [7,8,9]. The limitations of starch’s original form prevent its employment in a variety of applications. These shortcomings are mostly brought on by an absence of reactivity, insolubility, a propensity for retrogradation, an inability to endure high temperatures, and shearing during processing [10]. To enhance starch’s specific characteristics, such as water absorption, water solubility, and/or the ability to form stable gels, various kinds of physicochemical techniques have been used [11,12]. For modifying starch, various kinds of techniques and procedures were utilized. Wang et al. [9] and Compart et al. [12] reviewed how physical modifications can be made via annealing [10], heat moisture therapy [13], microwaves [14], ultrasound [15], ozone [16], and other methods. Esterification [17], cross-linking [18], and oxidization [19] are often used for modifying chemicals. In the field of enzymatic modification, hydrolyzing enzymes are primarily used for modifying starch [20].
Additionally, the application of cold plasma is a further method for modifying starch, which can improve and enhance its properties. Due to its physical approach to starch modification, which does not involve chemicals (non-toxicity) and is environmentally friendly (non-residual), cold plasma has also been utilized widely in recent years for transforming biological macromolecules [21]. Usually, the DBD technique is used to produce cold plasma.
Carvalho et al. [11] discussed the effects of cold plasma on the physicochemical, structural, and technological characteristics of Aria (Goeppertia allouia) starch, finding that at 14 kV, the starch chains depolymerized to the greatest extent. In contrast, at 20 kV, oxidized complexes could be produced, enhancing the starch chain’s cross-linking. Thus, it was demonstrated that the cold plasma method increased starch digestibility without altering the concentration of resistant starches. Increasing the applied voltage to 14 kV resulted in a considerable reduction in the amylose concentration. The polymer chains of amylose and amylopectin can interact with several reactive species produced by atmospheric DBD, oxidizing these molecules.
Goiana et al. [22] applied the highest voltage possible from a plasma power source (20 kV) to treat three films (starch, gelatin, and bacterial cellulose films) at various excitation frequencies and treatment times. All three films were enhanced in terms of hydrophobicity, surface morphology, water resistance, and mechanical capabilities after plasma treatment, with the benefit of not requiring more chemical or biological additions. Moreover, they reported that the limitation of the plasma’s impact on the mechanical properties of the films is a drawback, as more changes may be made by adding chemicals or producing composites.
The findings on the atmospheric DBD and radio frequency (RF)-modified potato starch were published by Sifuentes-Nieves et al. [23]. The DBD reactor, driven by an RF power supply, operated at 12 kVpp and 25 kHz to generate plasma. The results show that the amylose chains were primarily transformed in a specific way by active species produced by DBD reactors, preferring the order or stability of starch molecules.
Gupta et al. [24] stated that cold plasma treatments had a significant impact on the shapes of starch granules, reducing aggregations and developing fissures on granule surfaces as a result of plasma species’ etching and making an improvement to the surface topography and roughness of treated starch. Additionally, there were significant modifications in amylose concentration, paste clarity, solubility, freezing thaw stability, color characteristics, whiteness index, molecular weight distribution, and in vitro digestibility, depending on the cold plasma voltage and treatment time. Also, Chauhan et al. [25] investigate the impact of pin-to-plate cold plasma at atmospheric pressure on physicochemical, functional, powder flow, thermal, and structural factors. The study demonstrates that a reduction in the amylose concentration through plasma-induced depolymerization resists the tendency for retrogradation and increasing paste clarity. Depolymerized proso-millet starch that forms a soluble, low-viscous, stable, and clear paste is produced using cold plasma.
Furthermore, several works further discuss topics that are applicable to using cold plasma in medicinal products, functional foods, and food packaging [4,5,26,27,28,29,30]. Cold plasma has seen a significant increase in use in modifying starch.
Basic DBD configurations are constructed using parallel planar electrodes, which have a dielectric covering on at least one of the electrodes. The electric field will be generated when applying the electric voltage between two electrodes. When the electric field in the gap is strong enough, electrons are accelerated between collisions to an increasing rate until their energy exceeds the ionization value of neutral molecules, which causes gas ionization. The electric voltage of this process is called the breakdown voltage. A breakdown can be identified using a Paschen curve of the discharge, described by Paschen’s law, and examined at various pressures and electrode gap distances.
A Paschen curve is one of the essential characteristics for explaining gas discharge behavior, and its use defines plasma production conditions. Designing and fabricating suitable plasma production systems to apply various aspects requires knowing the conditions for each application. This curve, based on Paschen’s law, describes the electrical breakdown of gas or gas discharge, and if the uniform electric field applied is strong enough, then the Townsend avalanche process is started, which leads to the breakdown of the gas and the formation of plasma. Paschen observed that the minimal voltage that must be provided for a breakdown when a distance d separates two electrodes is provided by the following equation:
V b = f p d ,
where p is the gas pressure and d is the electrode separation [31].
In this work, we would like to study factors that affect the breakdown voltage value in plasma caused by DBD discharge. Additionally, this factor discharge is used in various fields, such as ozone generation [32], cold plasma for medicine [33], environmental applications [34], and agriculture [35]. The breakdown voltage value is important for the approach to designing the system used to create the plasma. The system consists of two main parts: the power supply and the discharge chamber. In the discharge chamber part, there are two electrodes and at least one dielectric on the electrode. The initial plasma production mechanism in DBD is determined using the Townsend breakdown mechanism, which obtains the number of electrons from one electrode to the other electrode terminal, leading to an exponential occurrence (avalanche) and breakdown between gap distance d:
N t = N 0 e α d 1 γ e α d 1
where Nt is the electrons from the cathode reaching the anode, N0 is the initial free electrons produced at the cathode, α is the first Townsend ionization coefficient, and γ is the secondary electron emission coefficient.
If γ(eαd − 1) < 1, the discharge current will be non-self-sustaining; that is, if there are no cosmic rays or energy sources that can make the electrons escape from the cathode, the discharge current will stop flowing and will not release secondary electrons. However, if γ(eαd − 1) = 1, the discharging current will be self-sustaining and cause a gas breakdown between electrodes. This condition is called Townsend’s breakdown criterion or the self-sustaining discharge criterion.
α d = l n 1 + 1 γ
In the case of a uniform electric field, Townsend’s experiments showed that
α = A p   e B p E
The results of Equations (3) and (4) demonstrate that
E b = B p l n A p d l n l n 1 γ + 1
and
V b = B p d l n A p d l n l n 1 γ + 1
where A and B are the constant values of each type of gas, p is the pressure of the gas, and d is the gap distance [36].
Moreover, many studies have shown that the electric field in the gap may not be uniform. This electric field non-uniformity has an impact on both the discharge ignition and the gas breakdown criteria [37,38,39,40].
If E(z) is the axial electric field, this field changes according to the position between the electrodes. The ionization coefficient α is altered to
α z = A p   e B p E z
Therefore, from Equation (3), the breaking down condition is
0 L α E z d z = l n 1 + 1 γ
or
0 L A p   e B p E z d z = l n 1 + 1 γ
For argon A = 11.5 cm−1 torr−1, B = 176 V cm−1 torr−1 and γ = 0.07 [41].
In the situation of a non-uniform field, we can identify the intensity of the electric field for the ignition of the discharge via Equation (8), which means that we can find the electrical voltage that causes the breakdown. Generally, various parameters, such as electrode diameter, electrode geometries, dielectric surface, accumulation of surface charge, etc., have an impact on the electric field generated and result in its non-uniformity. As a consequence, it is challenging to develop a usable plasma-generating system. Therefore, one method before building a plasma generator system is to simulate the situation according to the specified conditions. In applying starch modification, if we have conditions for the starch, we can input them into the model to determine the starting voltage used to create plasma and then adjust the conditions for additional studies.
For instance, we can adjust the electrode spacing to obtain the required initial voltage at atmospheric pressure (760 torr). On the other hand, identifying the original voltage of this breakdown can also be utilized as a criterion when the plasma generating system is designed in order to vary the pressure.
Each kind of starch has unique characteristics and applications specific to its type. It is crucial to determine the appropriate DBD conditions for each starch.
The aim of this study is to use COMSOL Multiphysics to simulate the generation of electric fields for the breakdown of the DBD model to determine the breakdown voltage for the starch modification process. The impact of the starch’s relative permittivity, granule shape, thickness, and diameter on the breakdown voltage will be studied. Another factor to consider is the top electrode’s mesh size. The results presented in this work can help to develop a highly efficient plasma production system for the starch modification process in future work.

2. Modeling and Simulation Methods

This study solved electric fields with COMSOL Multiphysics 5.3a software, using models designed based on various situations. COMSOL is used to simulate the distribution of the electric field within the gap between two electrodes using the finite element method (FEM) concept. Recently, complex electric field problems, particularly for non-uniform electric fields, have been simulated using this software. The model consists of two circular electrode plates, each 5 mm thick and with a radius of 4 cm, and quartz as the dielectric placed on the bottom electrode, as shown in Figure 1. The gap spacing changed between 0.01 and 1 cm at 760 torr of pressure.
Before using the model to simulate each condition, it is necessary to identify the optimal mesh type for solving the partial differential equations. Consequently, nine mesh types of COMSOL, from extremely coarse to extremely fine, were examined to ensure that the simulation results were sufficiently mesh-independent. The optimal mesh type is crucial for enhancing the analysis’s accuracy. The optimal mesh type was frequently determined using the grid independence test [42,43].
Voltage was applied to the high-voltage electrode. One of the key findings from the simulation was the electric field between electrodes. If the electric field was not constant, the electric field value on the left-hand side of Equation (9) could be substituted and compared with the value of the right-hand side. This voltage was a breakdown voltage if the value was equal to the value on the right part. After that, the Paschen curves were obtained for various studies by graphing breakdown voltage with the product of pressure and gap distance (pd).

2.1. Method for Grid Independence Test

The analyzed model for this case study was determined, as demonstrated in Figure 1. The study focused on the nine different mesh types available in COMSOL: extremely coarse, extra coarse, coarser, coarse, normal, fine, finer, extra fine, and extremely fine, respectively. A voltage of 1000 V was applied between two electrodes. The electric field in the gap was statistically analyzed by calculating the mean and standard deviation.

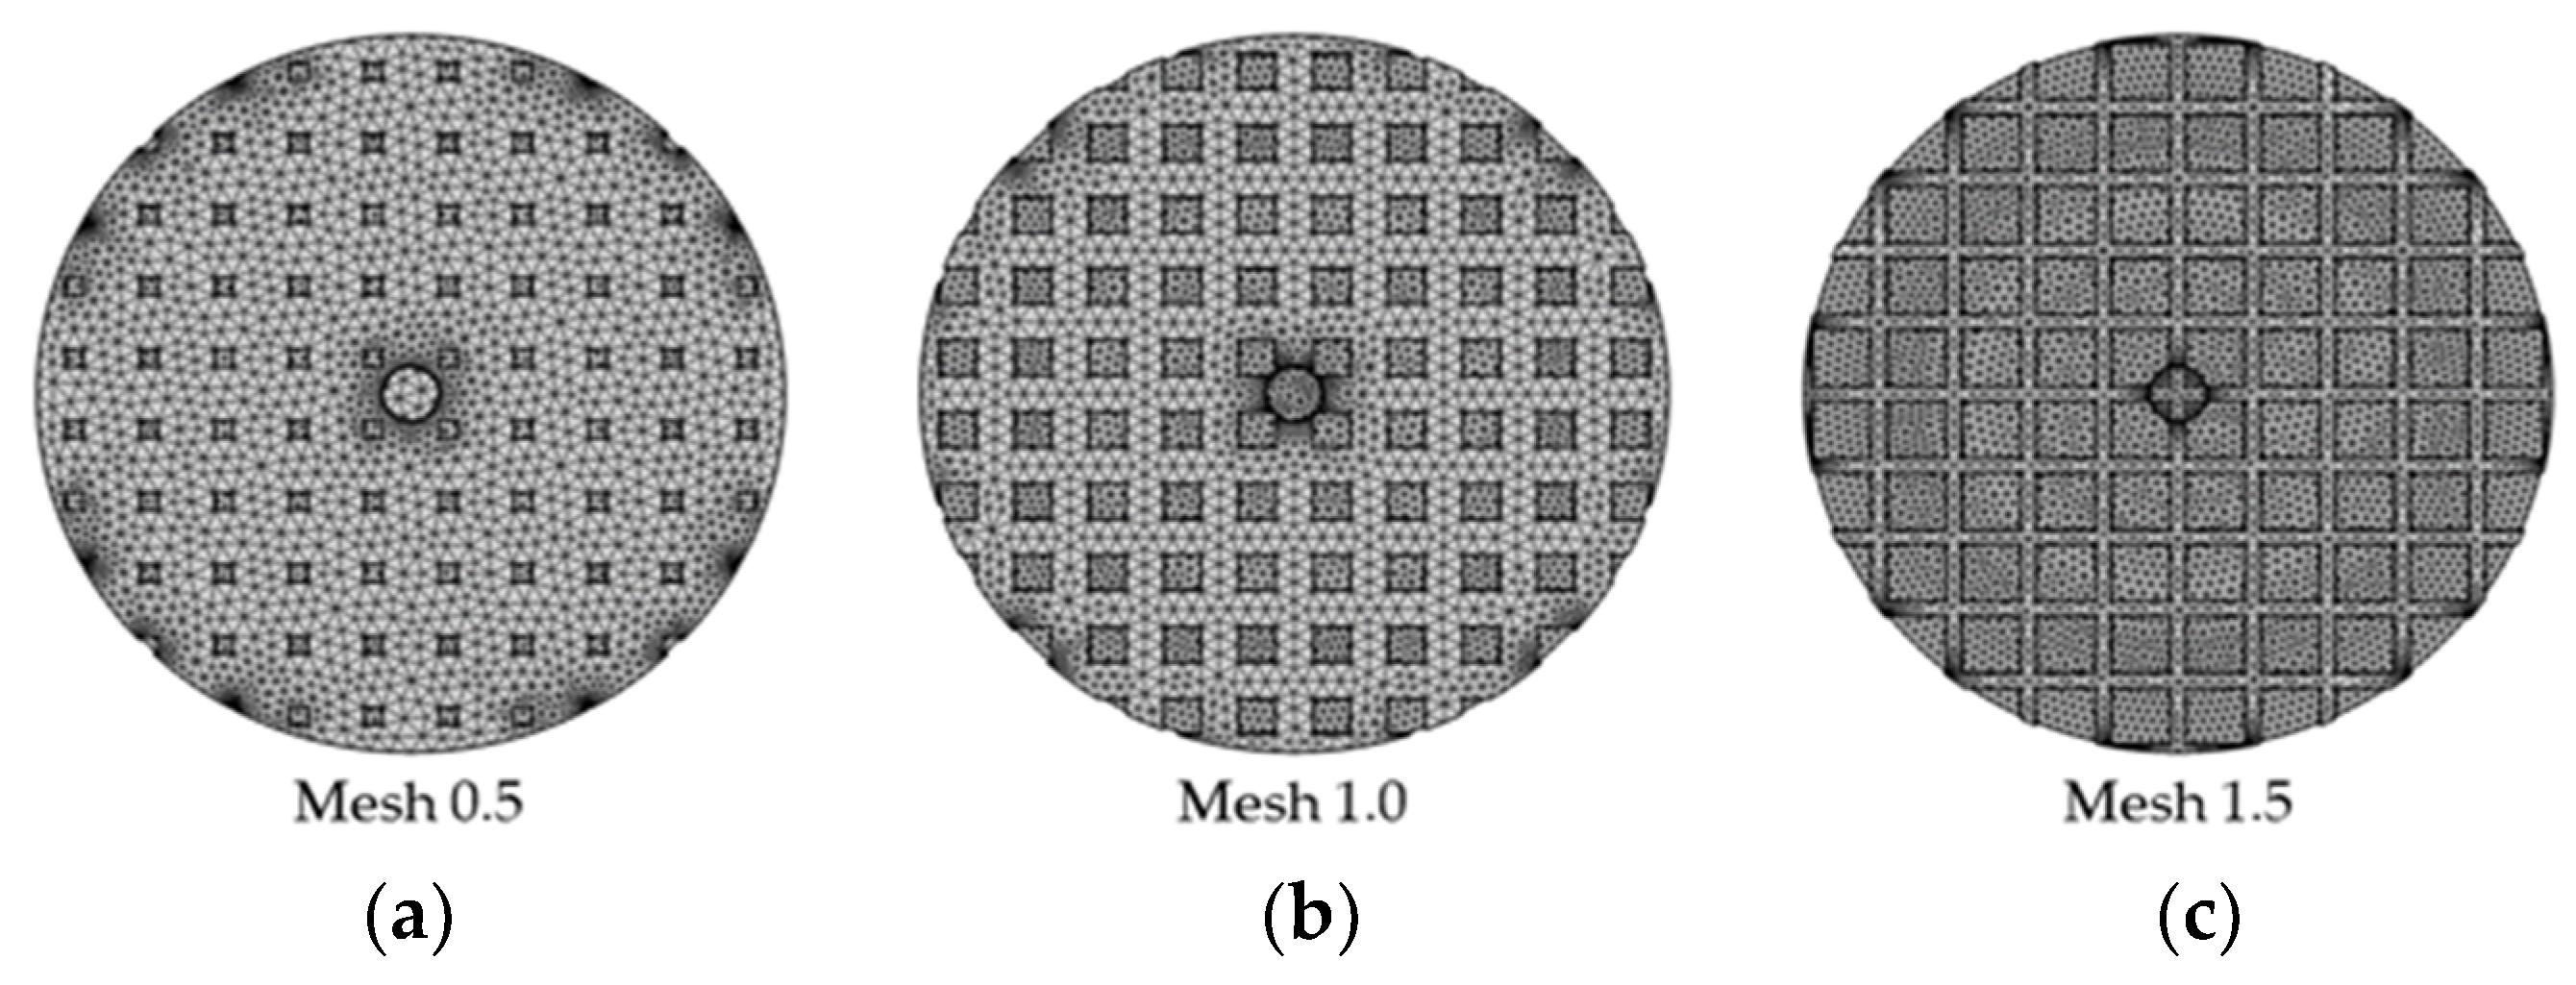
2.2. Effect of the Top Electrode’s Mesh Size

The model in Figure 1’s top electrode was changed from a plate to a mesh electrode with a 0.5 cm2 size. A greater electric field occurred in the space between the two electrodes after providing high voltage to the top electrode. The breakdown voltage was determined and plotted with the product of pd. This procedure was then repeated using a top electrode with mesh sizes of 1.0 and 1.5 cm2, as illustrated in Figure 2.

2.3. Effect of Starch Relative Permittivity

Add the starch module to the surface of the dielectric layer in the model shown in Figure 1. The starch has a 3.1 relative permittivity (εr). The shape of the starch is spherical, with a diameter of 150 microns. The starch layer has a thickness of 0.6 mm. Determine the breakdown voltage following the previously indicated procedure. Repeat the experiment by changing the starch’s relative permittivity from 3.1 to 5.2 and 7.5. Change the top electrode from the plate to the mesh to perform the experiment once again.

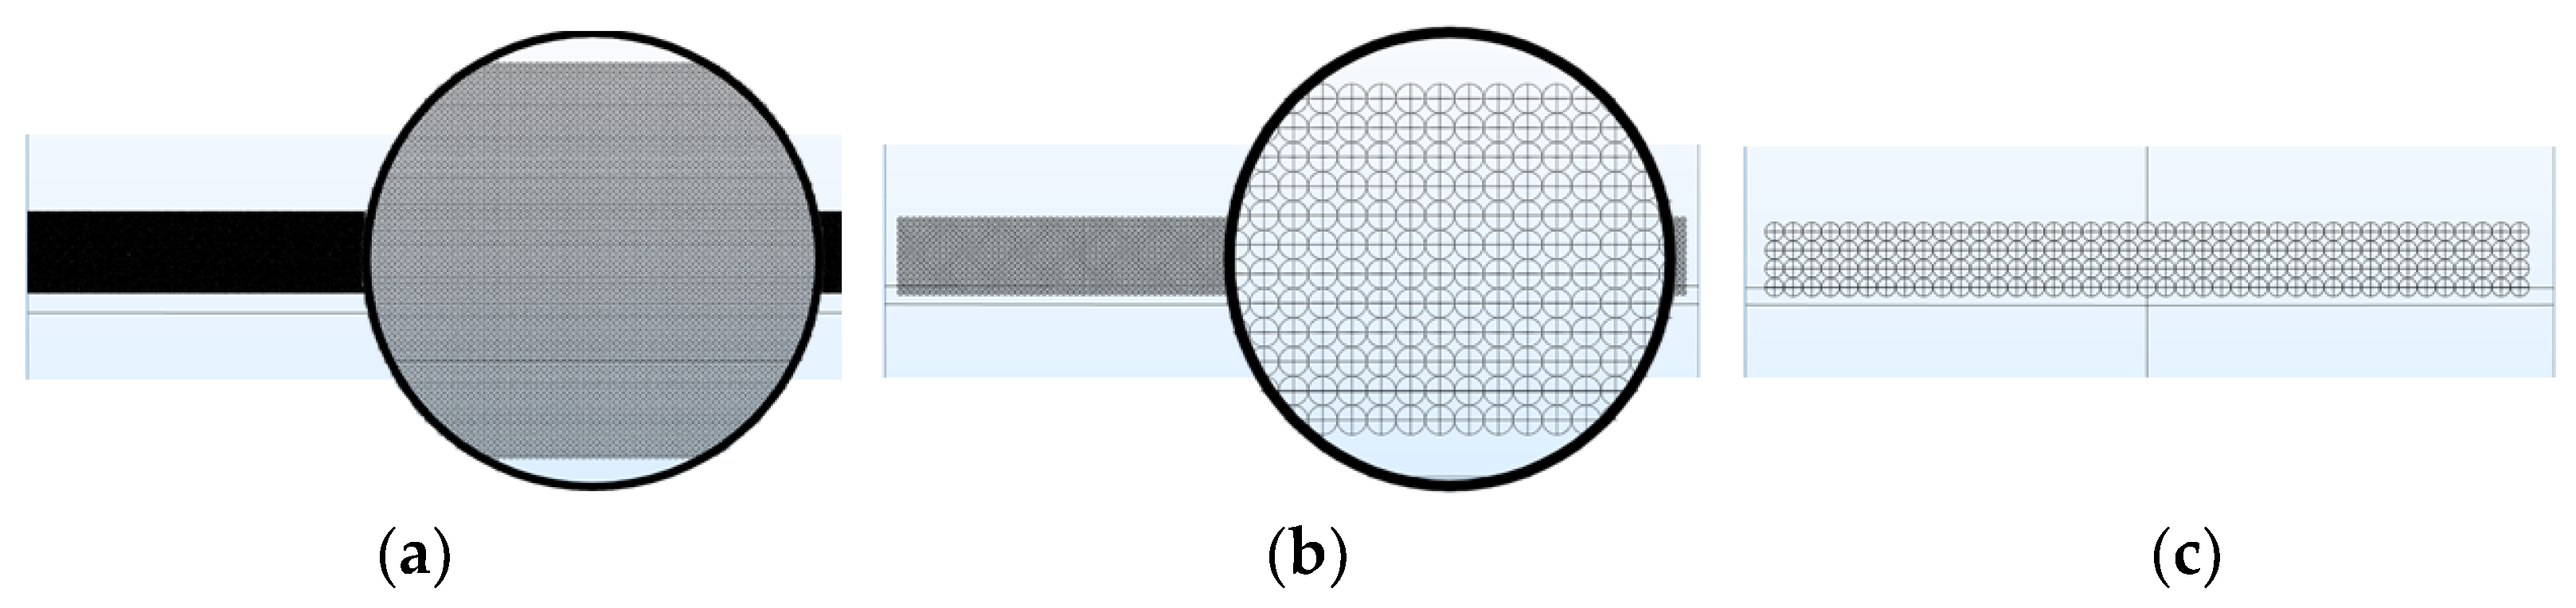
2.4. Effect of Starch Granule Shape

From Figure 1, the starch module had a spherical shape with a diameter of 150 microns, relative permittivity (εr) of 3.1, and thickness of 0.6 mm. The breakdown voltage should be determined according to the process mentioned earlier. Using the details that were previously provided, compute the breakdown voltage and change the starch’s shape from a sphere to an ellipsoid and then to a polyhedral shape, respectively, as depicted in Figure 3.

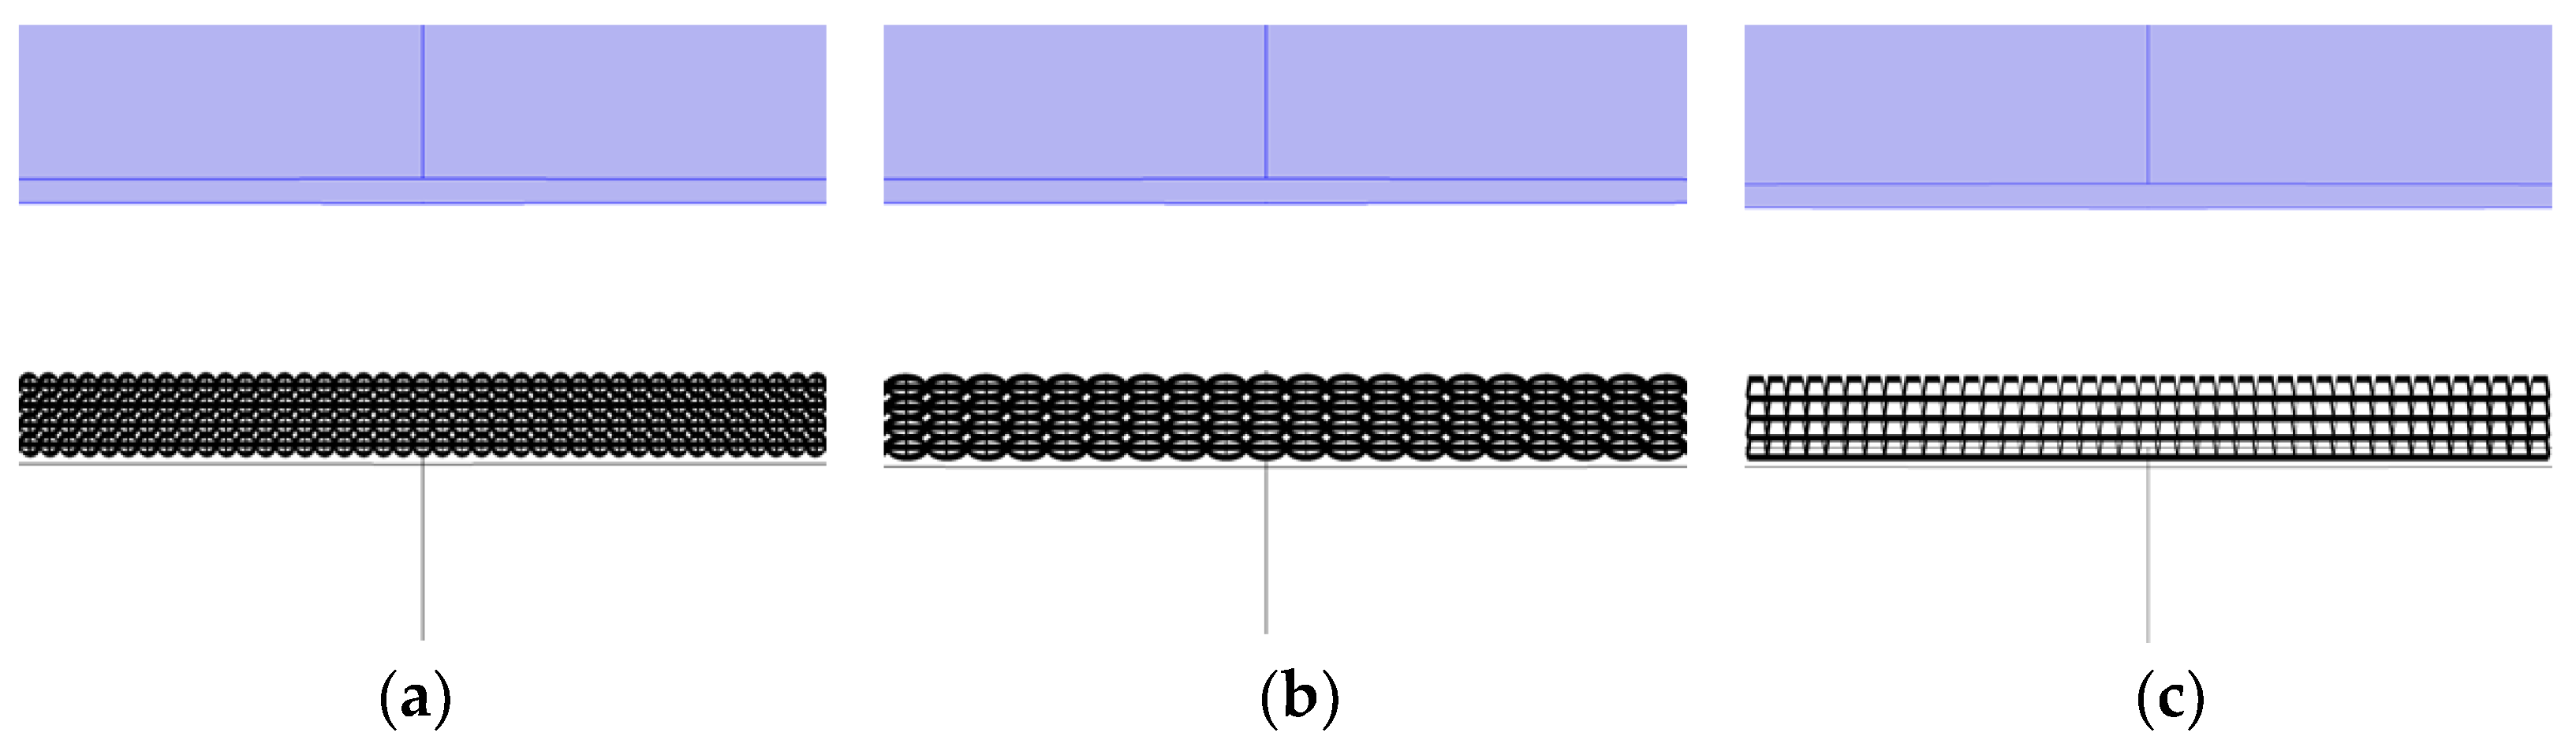
2.5. Effect of Starch Thickness Layer

The starch had a 150-micron diameter, a spherical form, and 3.1 relative permittivity in Figure 1. Adjust the thickness of starch on the surface of the dielectric material to 0.6, 1.0, and 1.5 mm, as shown in Figure 4. The breakdown voltage should be found, as previously mentioned.

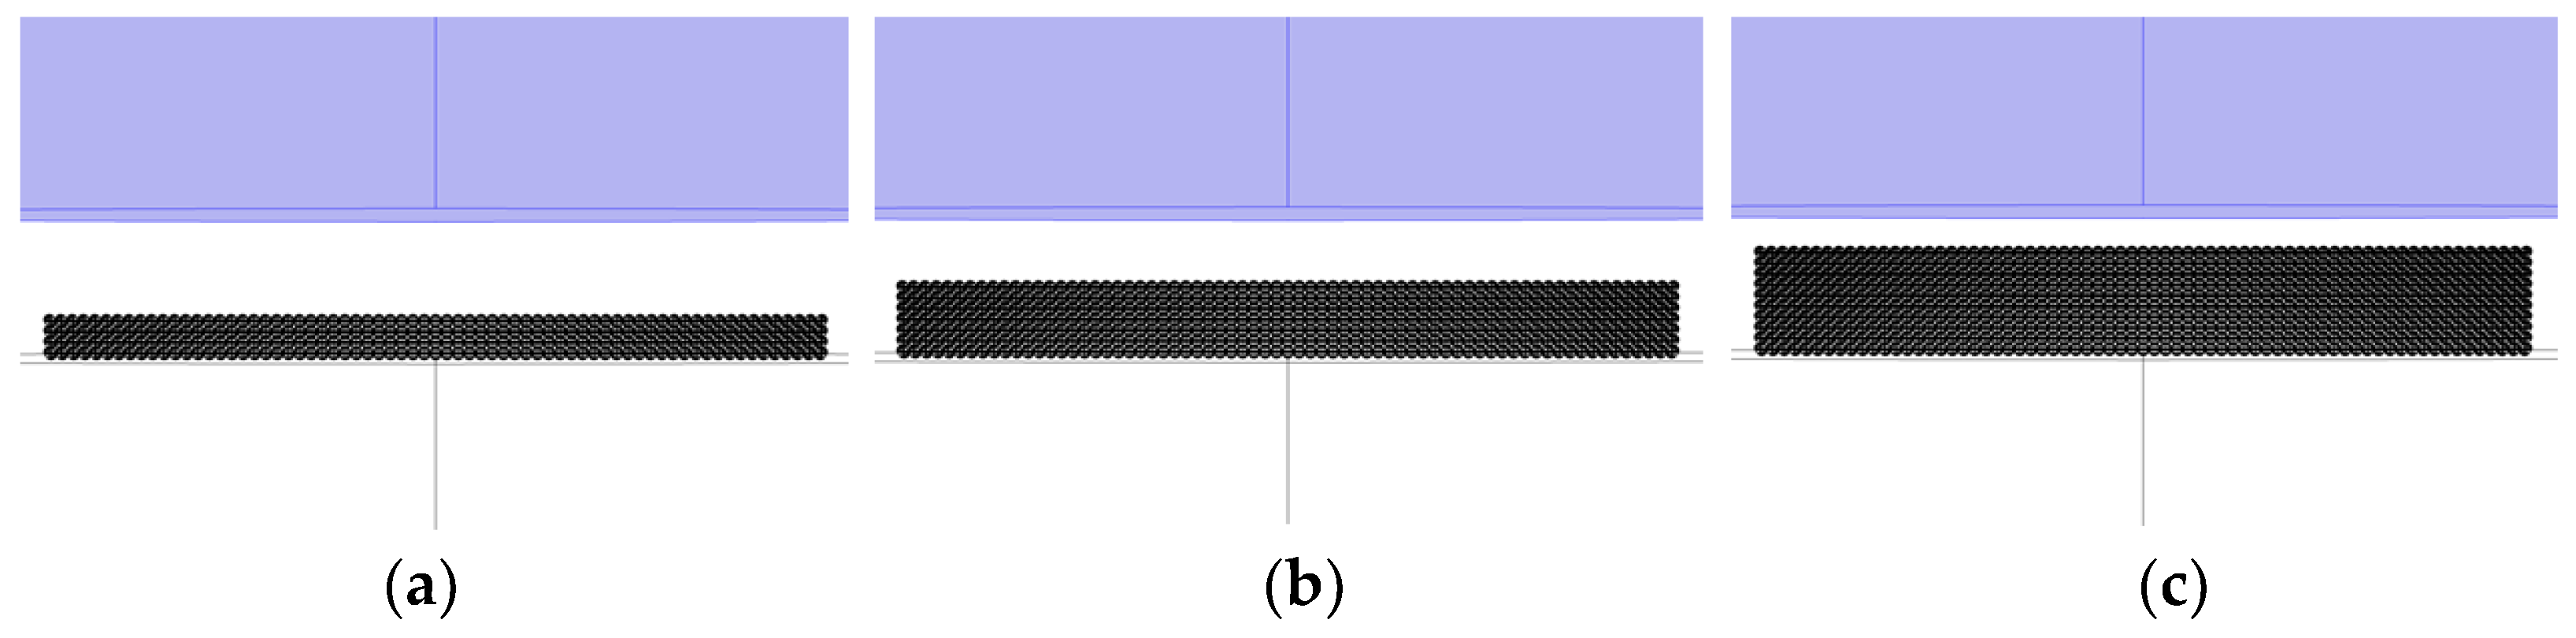
2.6. Effect of Starch Granule Diameter

This study used the same procedures as described in Section 2.3, which changed the starch’s diameter size from 150 microns to 10 and 50 microns, respectively, as represented in Figure 5.

3. Results and Discussion

The simulation results and an explanation of each case studied are presented in this section.
The Paschen law provides a helpful explanation of the breakdown in gases. From Equation (4), it can be seen that the gap distance and gas pressure have a strong correlation with the saturated gap voltage value. Figure 6 shows the theoretical Paschen curves for argon measured at several discharge gaps. These outcomes are achieved by varying the pressure while maintaining fixed inter-electrode spacing.
In this study, we will examine the effect of electrode geometries and characteristics of starch, i.e., relative permittivity, granule shape, thickness, and diameter size, on the electrical breakdown voltage of starch. For every case, figure out the Paschen curve. These graphs are used to guide the design of a suitable plasma system for modified starch.

3.1. Effect of the Model’s Mesh Type on the Electric Field

The total number of mesh from the model for various mesh types was summarized in Table 1.
Based on the simulation findings for various meshes, Figure 7 displays the mean and standard deviation of the electric field in the gap for the different meshes. The simulation results demonstrate that the electric field depends on the number of meshes. The results show that in the fine, normal, coarse, coarser, extra coarse, and extremely coarse mesh types, the mean electric field and standard deviation are increasing, whereas both remain constant for finer, extra fine, and extremely fine meshes. The extremely fine type is the finest mesh, consisting of about 1.114 million cells. When considering following the mesh independence study, the electric field does show convergence for using the finer, extra fine, and extremely fine mesh types. Therefore, the modeling resolution in this work used an extremely fine mesh type for all conditions.

3.2. Effect of the Top Electrode’s Mesh Size

From Figure 1, when V = 1000 V is applied to the top electrode, the electric field between the gap is calculated using different electrode types. The electric field from the dielectric’s surface to the top electrode is depicted in Figure 8. While the electric field distribution in the parallel plate electrode is uniform, it is not uniform between mesh-plate electrodes. After increasing the mesh size from 0.5 to 1.0 and 1.5 cm2, the non-uniform electric field was increased.
As a result, Figure 9 shows the electric field distribution for the plate and mesh electrode case when the voltage is 1000 V along the yz and xy planes. In typical plate electrodes, the field is significantly greater near the edges than in the center of the electrode. In the case of the mesh electrode, it can be seen that a stronger electric field exists not just at the outer edge of the mesh but also across every area or in every small rectangular path. The sharper edge leads to a higher field [44,45]. A stronger electric field impacts better ionization, microdischarges, and ion collisions between atoms to produce plasma [46]. These findings lead to the conclusion that the mesh electrode is the optimum geometrical shape.
Furthermore, according to Equations (4) and (7), the ionization coefficient depends on the electric field and pressure. Consider that plasma forms at atmospheric pressure (760 torr), and its ionization or breakdown of argon gas solely depends on an electric field. The breakdown voltage is determined in Equation (6) for a uniform electric field and Equation (9) for a non-uniform electric field. The value to be used is the voltage that provides the electric field value as equal to the terms on the right side of Equation (9). The breakdown voltage for each gap distance is shown in Table 2.
The plot of the breakdown voltage and product between the pressure and gap distance (pd) of each gap is shown in Figure 10.
Figure 10 demonstrates that the curve follows the features of the Paschen curve. The resulting curve moves upward from the theoretical curve (Figure 6) because the theoretical curve is obtained from corona discharge, which does not include dielectric material between the electrodes.
The size of the mesh electrode has a significant impact on increasing the breakdown voltage. The electric field of the mesh electrode with sizes of 0.5 and 1.0 cm2 was more uniform than that of 1.5 cm2, and breakdown occurred at higher voltages. Following these findings, the mesh electrode with a 1.5 cm2 size is the optimal shape that provides the lowest breakdown voltage. Due to its greater ability to produce non-uniform electric fields compared to a normal electrode, a mesh electrode with a mesh size of 1.5 cm2 has a lower breakdown voltage by between 1 and 2 percentage points. Meanwhile, the breakdown voltage is approximately 1–2% higher for mesh sizes of 0.5 and 1.0 cm2 compared to the plate electrode. After this section, we present the summary of the simulation results for two types of electrodes for four case studies. We studied the effects of relative permittivity, granule shape, thickness layer, and granule diameter of starch on the breakdown voltage.

3.3. Effect of Starch Relative Permittivity

In this section, we studied the impact of the relative permittivity of starch on the breakdown voltage. Table 3 shows the findings of simulations using parallel plate electrodes and mesh-plate electrodes, with gap distances between the electrodes of 0.2 and 1.0 cm at pressure 760 torr. The starch had a spherical shape, 150-micron diameter, and relative permittivity values of 3.1, 5.2, and 7.5, respectively.
The mesh electrode can help to apply a lower voltage than typical electrodes for the same relative permittivity value because mesh electrodes have a stronger electric field than plate electrodes. The breakdown voltage of the mesh electrode is approximately 5–10% less than the breakdown voltage for the typical electrode at a small gap (pd = 152 torr cm), while at a large gap (pd = 760 torr cm), it is about 2–3%. The breakdown voltage increased with an increase in gap distance.
Furthermore, simulation results show that the breakdown voltage decreases as the relative permittivity of starch increases for both electrode types. For instance, the polarization of the mesh electrode was 1.69 × 10⁻⁵ C/m2, whereas the usual electrode is 1.56 × 10⁻⁵ C/m2 at voltage 5000 V, gap 0.2 cm, and relative permittivity 3.1. The plate electrode’s polarization varies depending on the relative permittivity, from 3.1 to 5.2 and 7.5, respectively, and was 1.56 × 10⁻⁵, 1.82 × 10⁻⁵, and 1.95 × 10⁻⁵ C/m2. The polarization of the mesh electrode was 1.69 × 10⁻⁵, 2.14 × 10⁻⁵, and 2.30 × 10⁻⁵ C/m2, and it varied with the relative permittivity from 3.1 to 5.2 and 7.5, respectively.
The increase in polarization was consistent with the increase in the electric field [47]. When an external electric field is applied to a starch molecule, the charges bound in each molecule will respond to the applied field, which will result in the redistribution of charges, leading to a polarization of the starch [48]. The polarization that occurred from simulation in this work is a macroscopic quantity because it involves averaging the dipole moments over a volume containing many dipoles. We assumed that the polarization of the system response to the applied field is linear.
Figure 11 and Figure 12 illustrate the Paschen curve of each relative permittivity result using the information from Table 3.
The simulation results and Figure 11 show that when the starch has a relative permittivity of 3.1, 5.2, and 7.5, the breakdown voltage of the mesh electrode in the case of a small gap (pd = 152 torr cm) is lower than that of the parallel plate electrodes, by about 5.6%. It is less than around 2.0% in the case of a large gap (pd = 760 torr cm).
For different electrodes, the breakdown voltage for initiating the discharge of each starch is demonstrated in Figure 12. The figure shows that in both types of electrode, at a small gap (pd = 152 torr cm), the breakdown voltage of the starch had a relative permittivity of 5.2 and 7.5 smaller than when the starch had a relative permittivity of 3.1, by approximately 2.5 and 4.4%, respectively. On the other hand, at a large gap (pd = 760 torr cm), it was only about 0.5 and 0.9% less, respectively. According to Soloviev et al. [49]’s study results, when data for dielectrics with various relative permittivity are compared, it becomes clear that the breakdown voltage significantly reduces as the permittivity of the material being used increases. Also, corresponding to findings by Elaissi et al. [50], operating plasma discharges at a low applied voltage and a high plasma density were possible using materials with higher relative permittivity values.

3.4. Effect of Starch Granule Shape

The effect of the starch’s granule shape on the breakdown voltage was the focus of our next study. The results of simulations employing mesh-plate electrodes and parallel plate electrodes with gap sizes between the electrodes varying from 0.2 to 1.0 cm at pressure 760 torr are shown in Table 4. The starch had a size of 150 microns, relative permittivity values of 3.1, and a shape that changed from sphere to ellipsoid and polyhedral, respectively.
Using the data from Table 4, Figure 13 and Figure 14 depict the Paschen curves of each granule shape and different electrode types.
According to Figure 13, the mesh electrode can reduce the breakdown voltage of the sphere and ellipsoid shapes compared to a conventional electrode by approximately 5.6% at a small gap (pd = 152 torr cm) and by about 2.0% at a large gap (pd = 760 torr cm). Meanwhile, in polyhedral-shaped starch, the breakdown voltage of the mesh electrode was lower than that of parallel plate electrodes, roughly 1.5% and 1.2% for narrow and large gaps, respectively.
Figure 14 presents the breakdown voltage for each electrode to initiate the discharge for various shapes. In two types of electrodes, a comparison of the results for starch with different shapes showed that the breakdown voltage weakly increased when changing the shape of starch from sphere to ellipsoid. However, the breakdown voltage was clearly lower in the polyhedral shape than in other shapes, especially for short gaps in sphere shapes of lower than 14.3% and 10.7% for plate and mesh electrodes, respectively.
When starch is placed on the dielectric layer, the surface of the starch acts on the surface of discharge between electrodes. Because of the crucial characteristic of the polyhedral shape, each granule has a sharp-edged granule [51]. The effect causes the surface of the dielectric to become rough. As a result, the roughness causes the electric field within the electrode gap to increase [49,52,53]. This means that the initial discharge voltage for polyhedral shapes is lower than the breakdown voltage for sphere and ellipsoid shapes.

3.5. Effect of Starch Thickness Layer

Our further studies worked on examining the impact of starch thickness on the breakdown voltage. The starch layer had a sphere-like form, a 150-micron diameter, 3.1 relative permittivity values, and a 0.6 mm thickness. The thickness was then changed to 1.0 and 1.5 mm, respectively. Table 5 illustrates how the thickness of the starch layer affects the breakdown voltage at atmospheric pressure for a gap distance of 0.2 to 1.0 cm.
Following the data presented in Table 5, Figure 15 compares the breakdown voltage versus the product of pressure and gap distance (pd) between different electrodes for 0.6, 1.0, and 1.5 mm thicknesses.
The effect of varying starch thicknesses at a short gap (pd = 152 torr cm) is depicted in Figure 15 as a sparking potential of the mesh electrode that is lower than that of the parallel plate electrode by 5.8%, 4.2%, and 3.0% for thicknesses of 0.6, 1.0, and 1.5 mm, respectively. On the other hand, for a wide gap (pd = 760 torr cm), it was less than 2.0% for all thicknesses.
A comparison of the results for electrodes with different thicknesses of starch shows that the breakdown voltage increases with increasing thickness of the used starch, as depicted in Figure 16. When the thickness was increased from 0.6 mm to 1.0 and 1.5, respectively, for regular electrodes, the results for the corresponding values were about 1.3 and 2.5% and 3.1 and 5.6% for mesh electrodes.
While the electric field in the gap is stronger than its maximum field strength, discharges happen as the applied voltage increases, which leads to more of these charges building up on the starch surface. They create an electrical field within the gap that is the opposite of the applied field, which causes the total electric field in the gap to decrease rapidly. The breakdown voltage is increased when this electric field is decreased.
This could be happening because, when the starch is very close to the electrode, the electric field produced by the residual surface charges over the barrier is so small that it cannot affect the distribution of the electric field in the gap, changing the breakdown voltage [45]. These results agree with the work reported by Soloviev et al. [49], Hink et al. [54], and Belinger et al. [55].

3.6. Effect of Starch Granule Diameter

The dielectric layer was initially a sphere-shaped starch with a 10-micron diameter, 3.1 relative permittivity values, and a thickness of 0.6 mm. Following that, the diameter was adjusted to 50 and 150 microns, respectively. The same procedures as in the previous investigation to determine the ionization voltage were used. The breakdown voltage from this study is presented in Table 6.
Figure 17 and Figure 18 refer to the breakdown voltage of the product of the pressure and gap distance (pd) between any two electrodes for the dielectric layer as sphere shapes with 10-, 50-, and 150-micron diameters, based on the data shown in Table 6.
The findings from the simulation indicate that the mesh-plate electrode may initiate discharge by utilizing a voltage lower than the parallel plate electrode when considering the effect of the type of electrode. The difference in breakdown voltage is about 5.7% for the small gap, while the large gap is about 2.1% at the same pressure for three diameters. Additionally, the results demonstrate that the breakdown voltages of the mesh electrode and standard electrode for three starch dimensions are very similar, as illustrated in Figure 18. This means that the voltage sufficient to initiate the gas to break down does not impact the diameter factor. This may be due to the electric field quantities in this work, associated with macroscopic averages all over the entire number of starch molecules, and it is not a result that occurs with a single starch grain.

4. Conclusions

In this study, COMSOL Multiphysics 3.5a, a software program based on the finite element method, was used to determine how different factors affected the distribution of the electric field. Because of this electric field, the initial voltage for plasma formation can be determined. We studied the effects of starch’s relative permittivity, granule shape, thickness layer, and granule diameter on the breakdown voltage.
The conclusions obtained from this study can be summarized as follows:
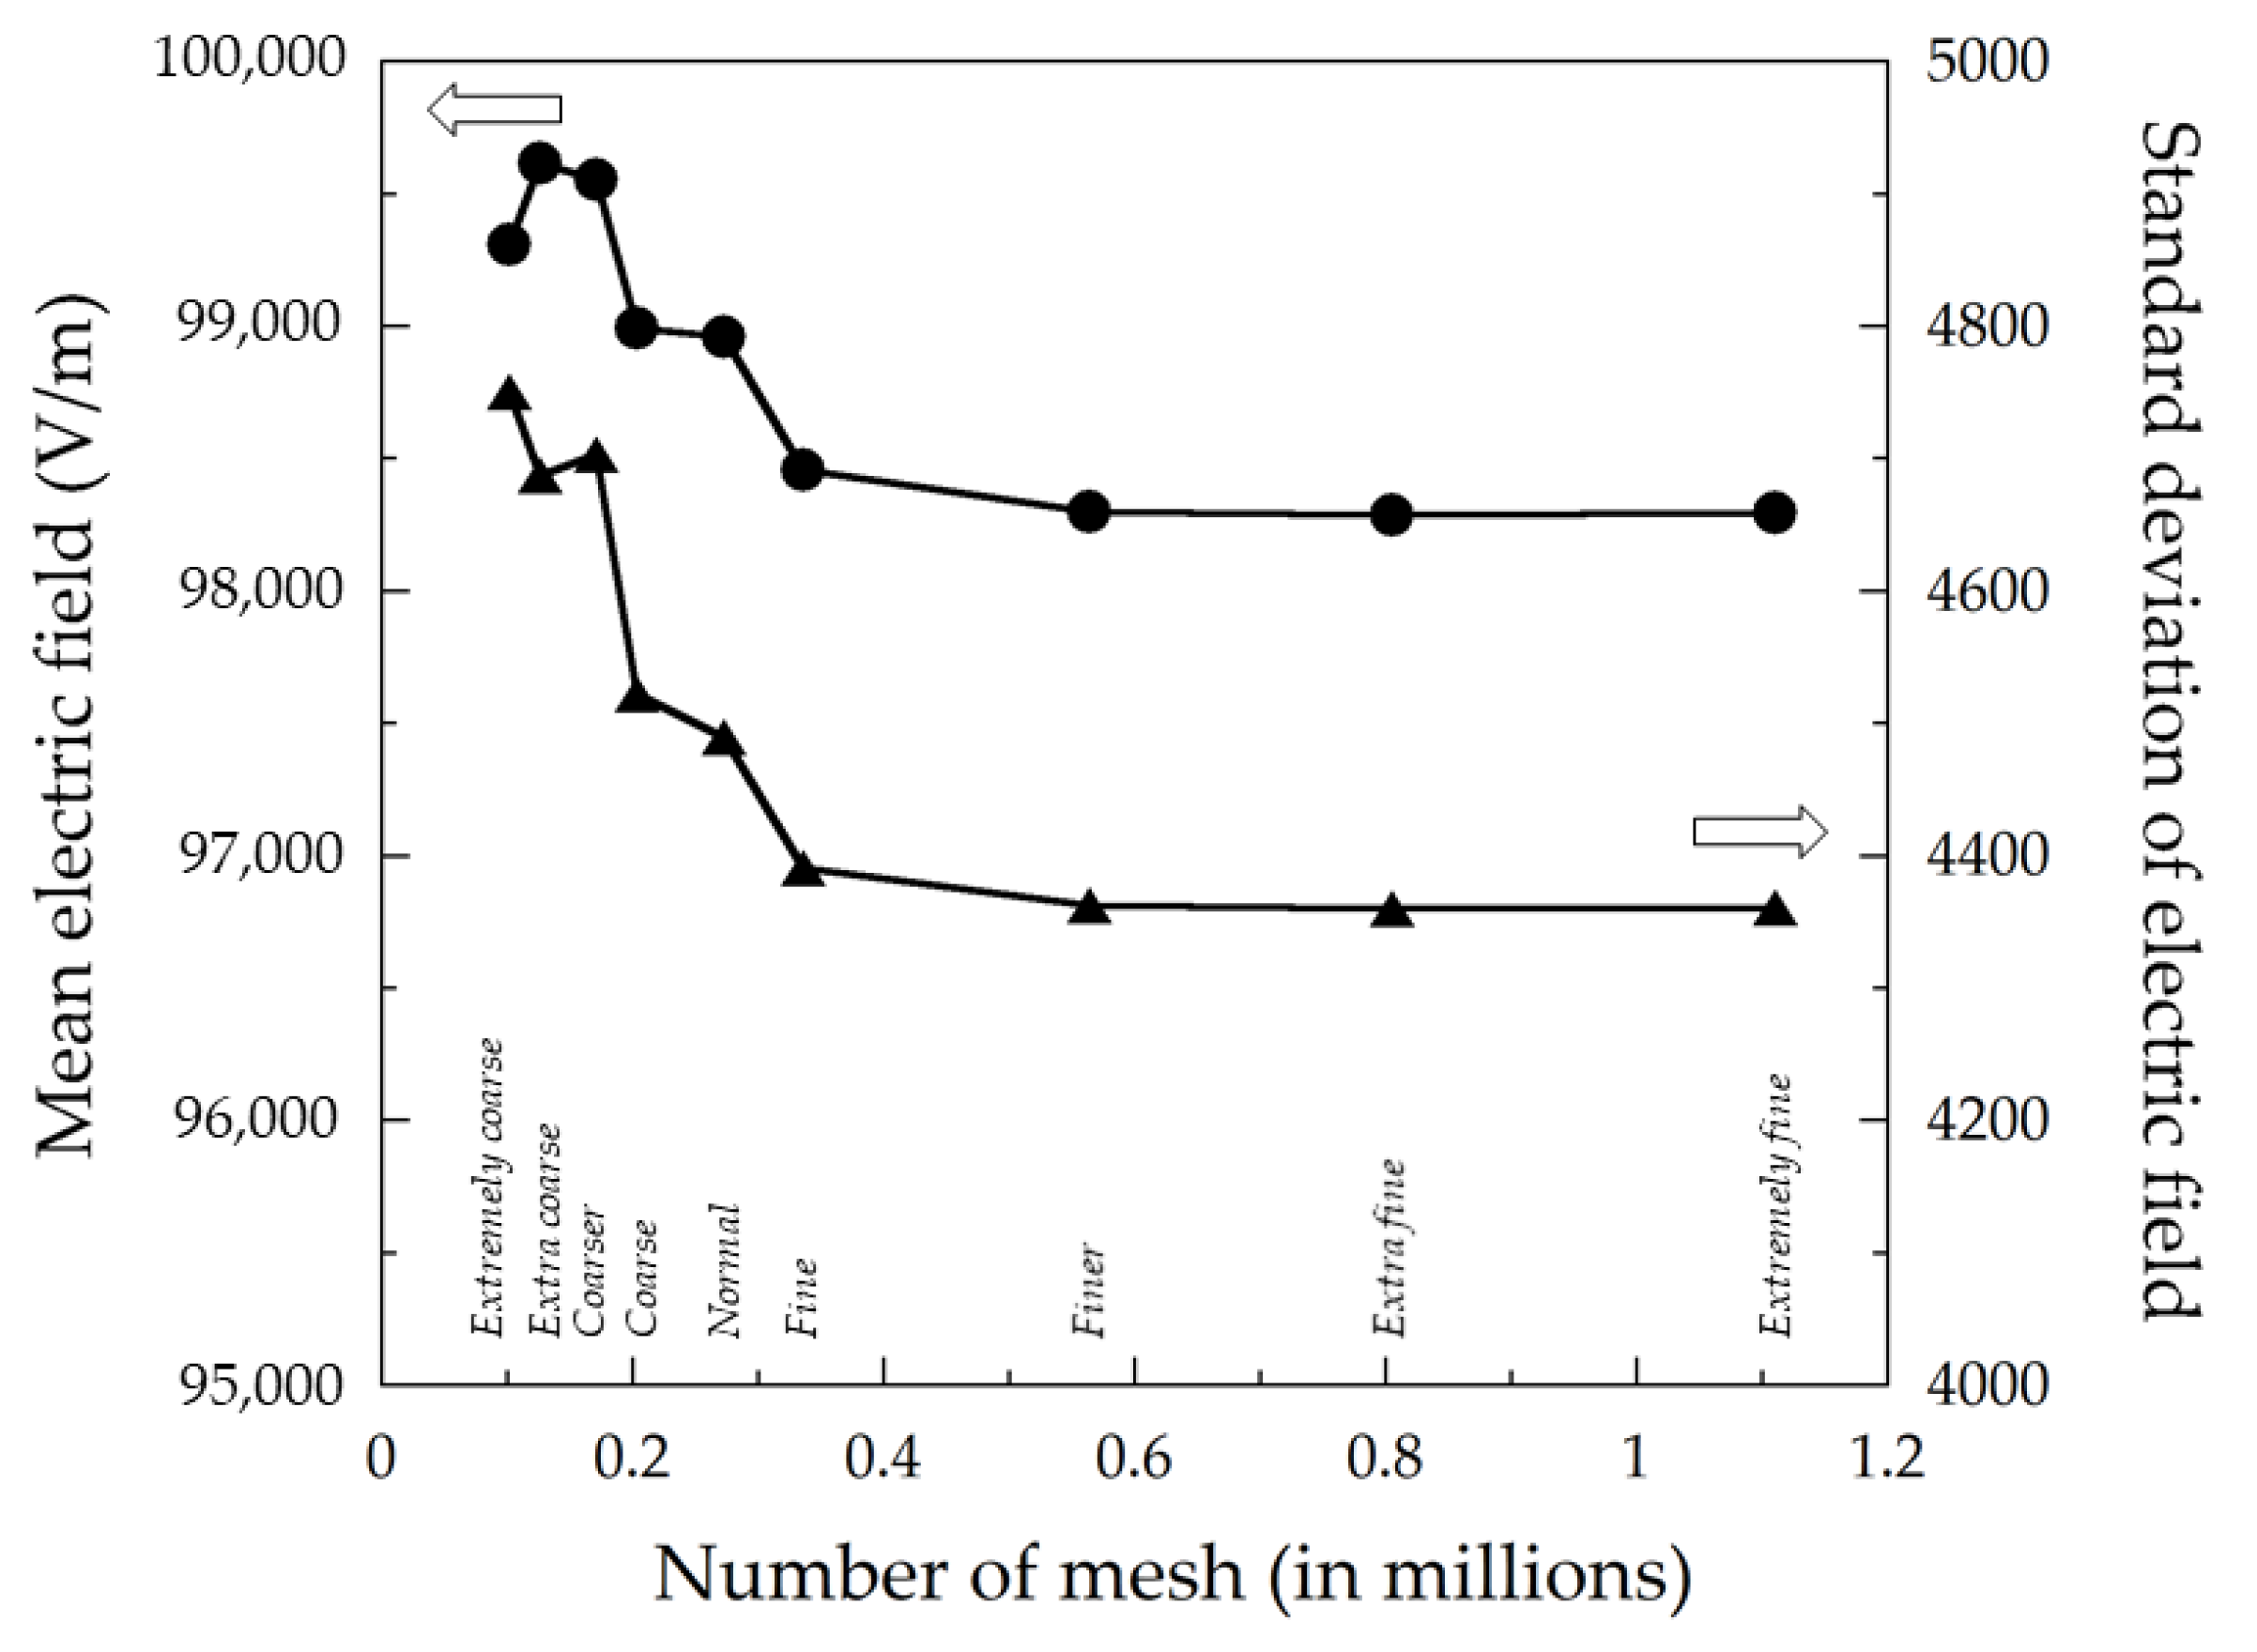
  • The simulation results of this model were independent of the mesh when using the finer, extra fine, and extremely fine types.
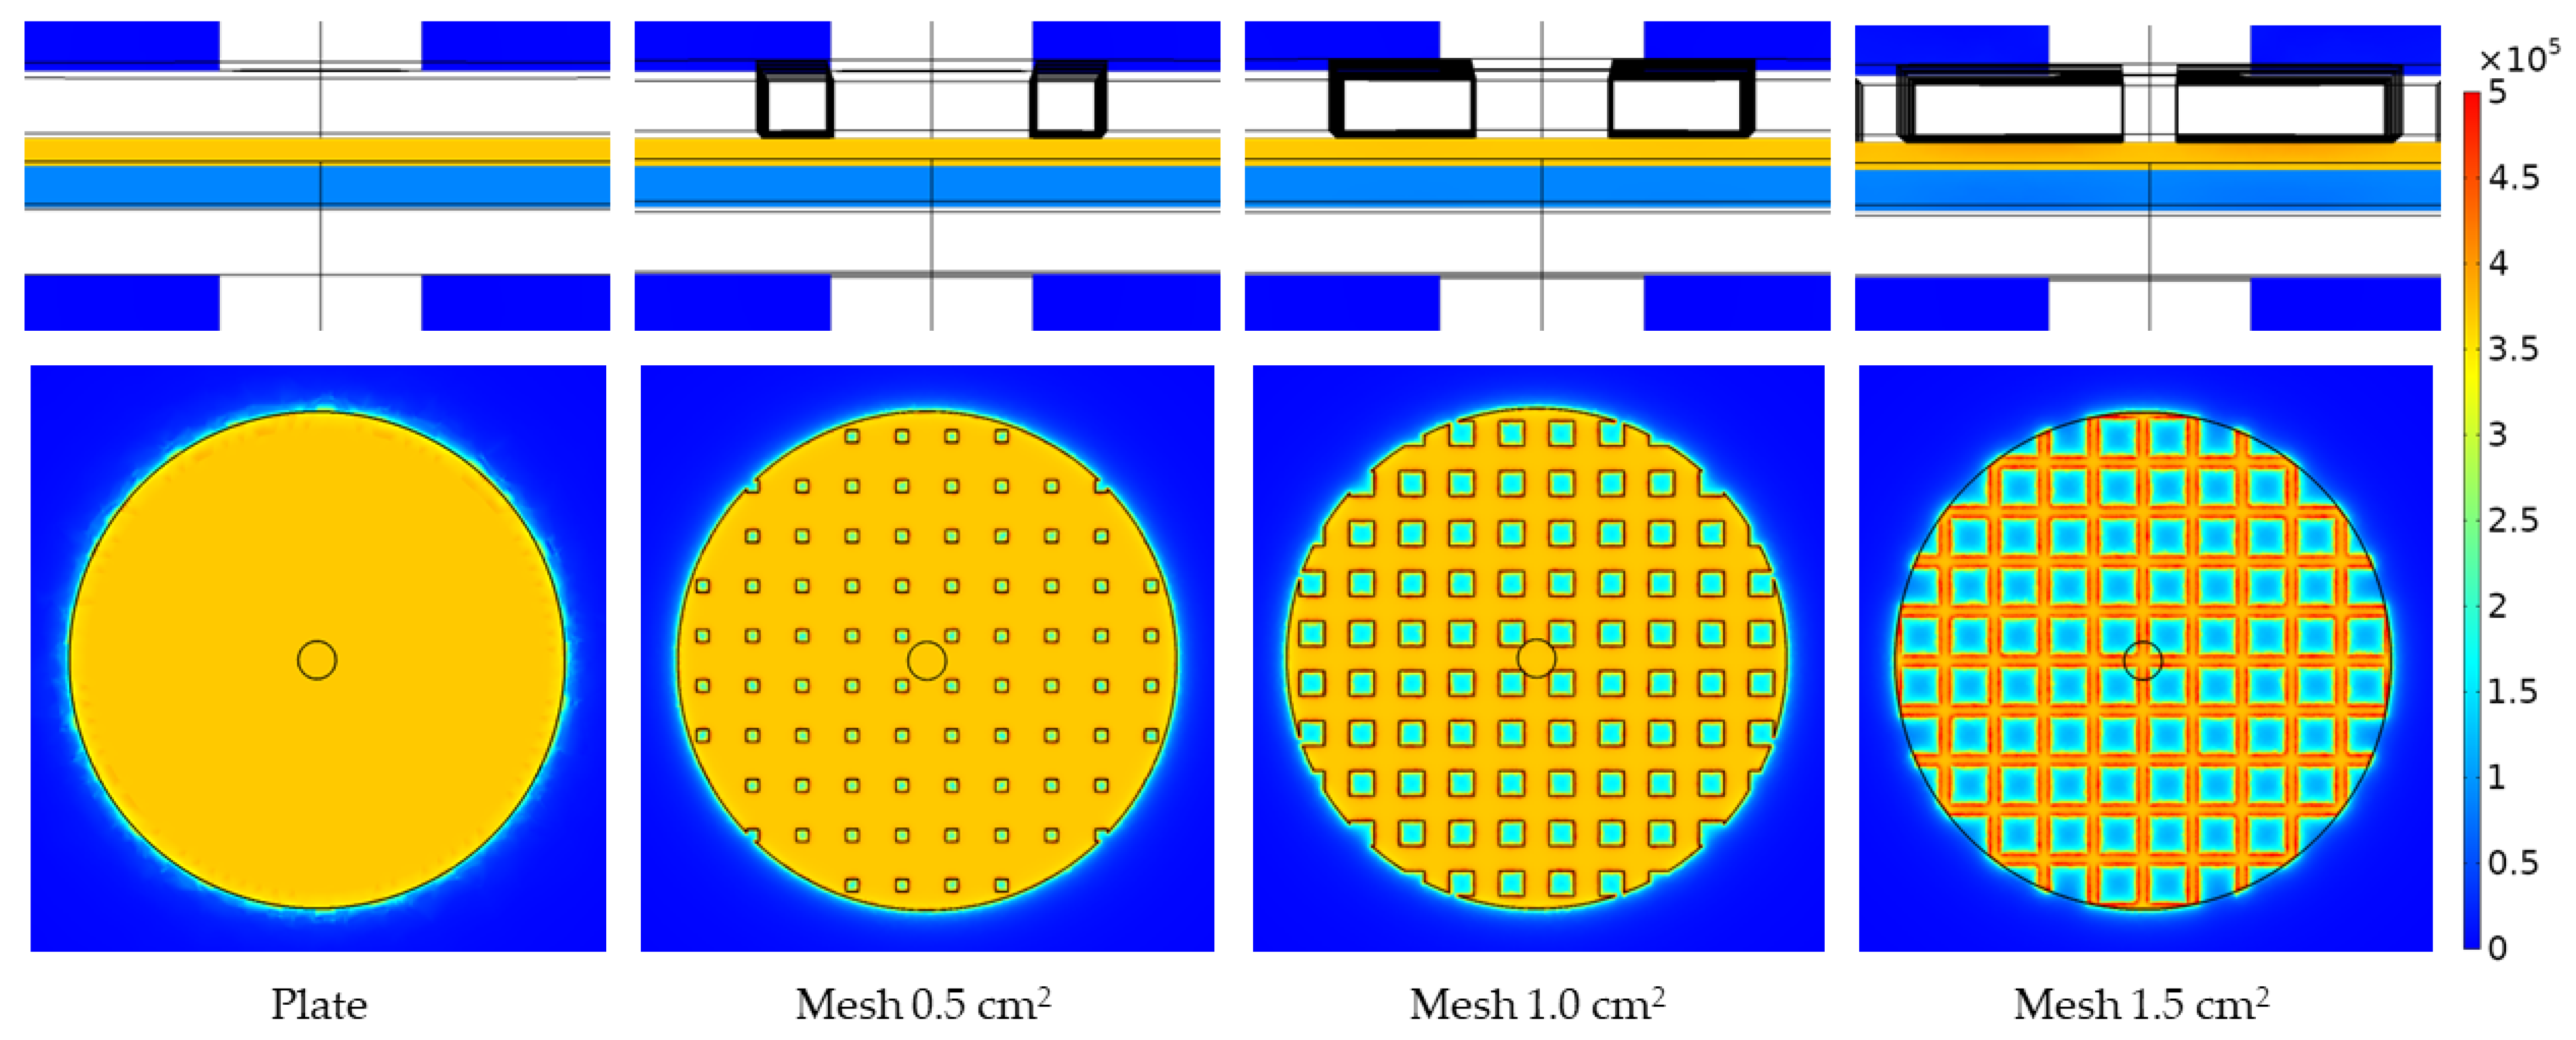
  • The top electrode of the plasma system can use a mesh electrode to replace the typical electrode. Based on the simulation results, this can lower the voltage required for initiating plasma production for similar conditions by approximately 2–6%.
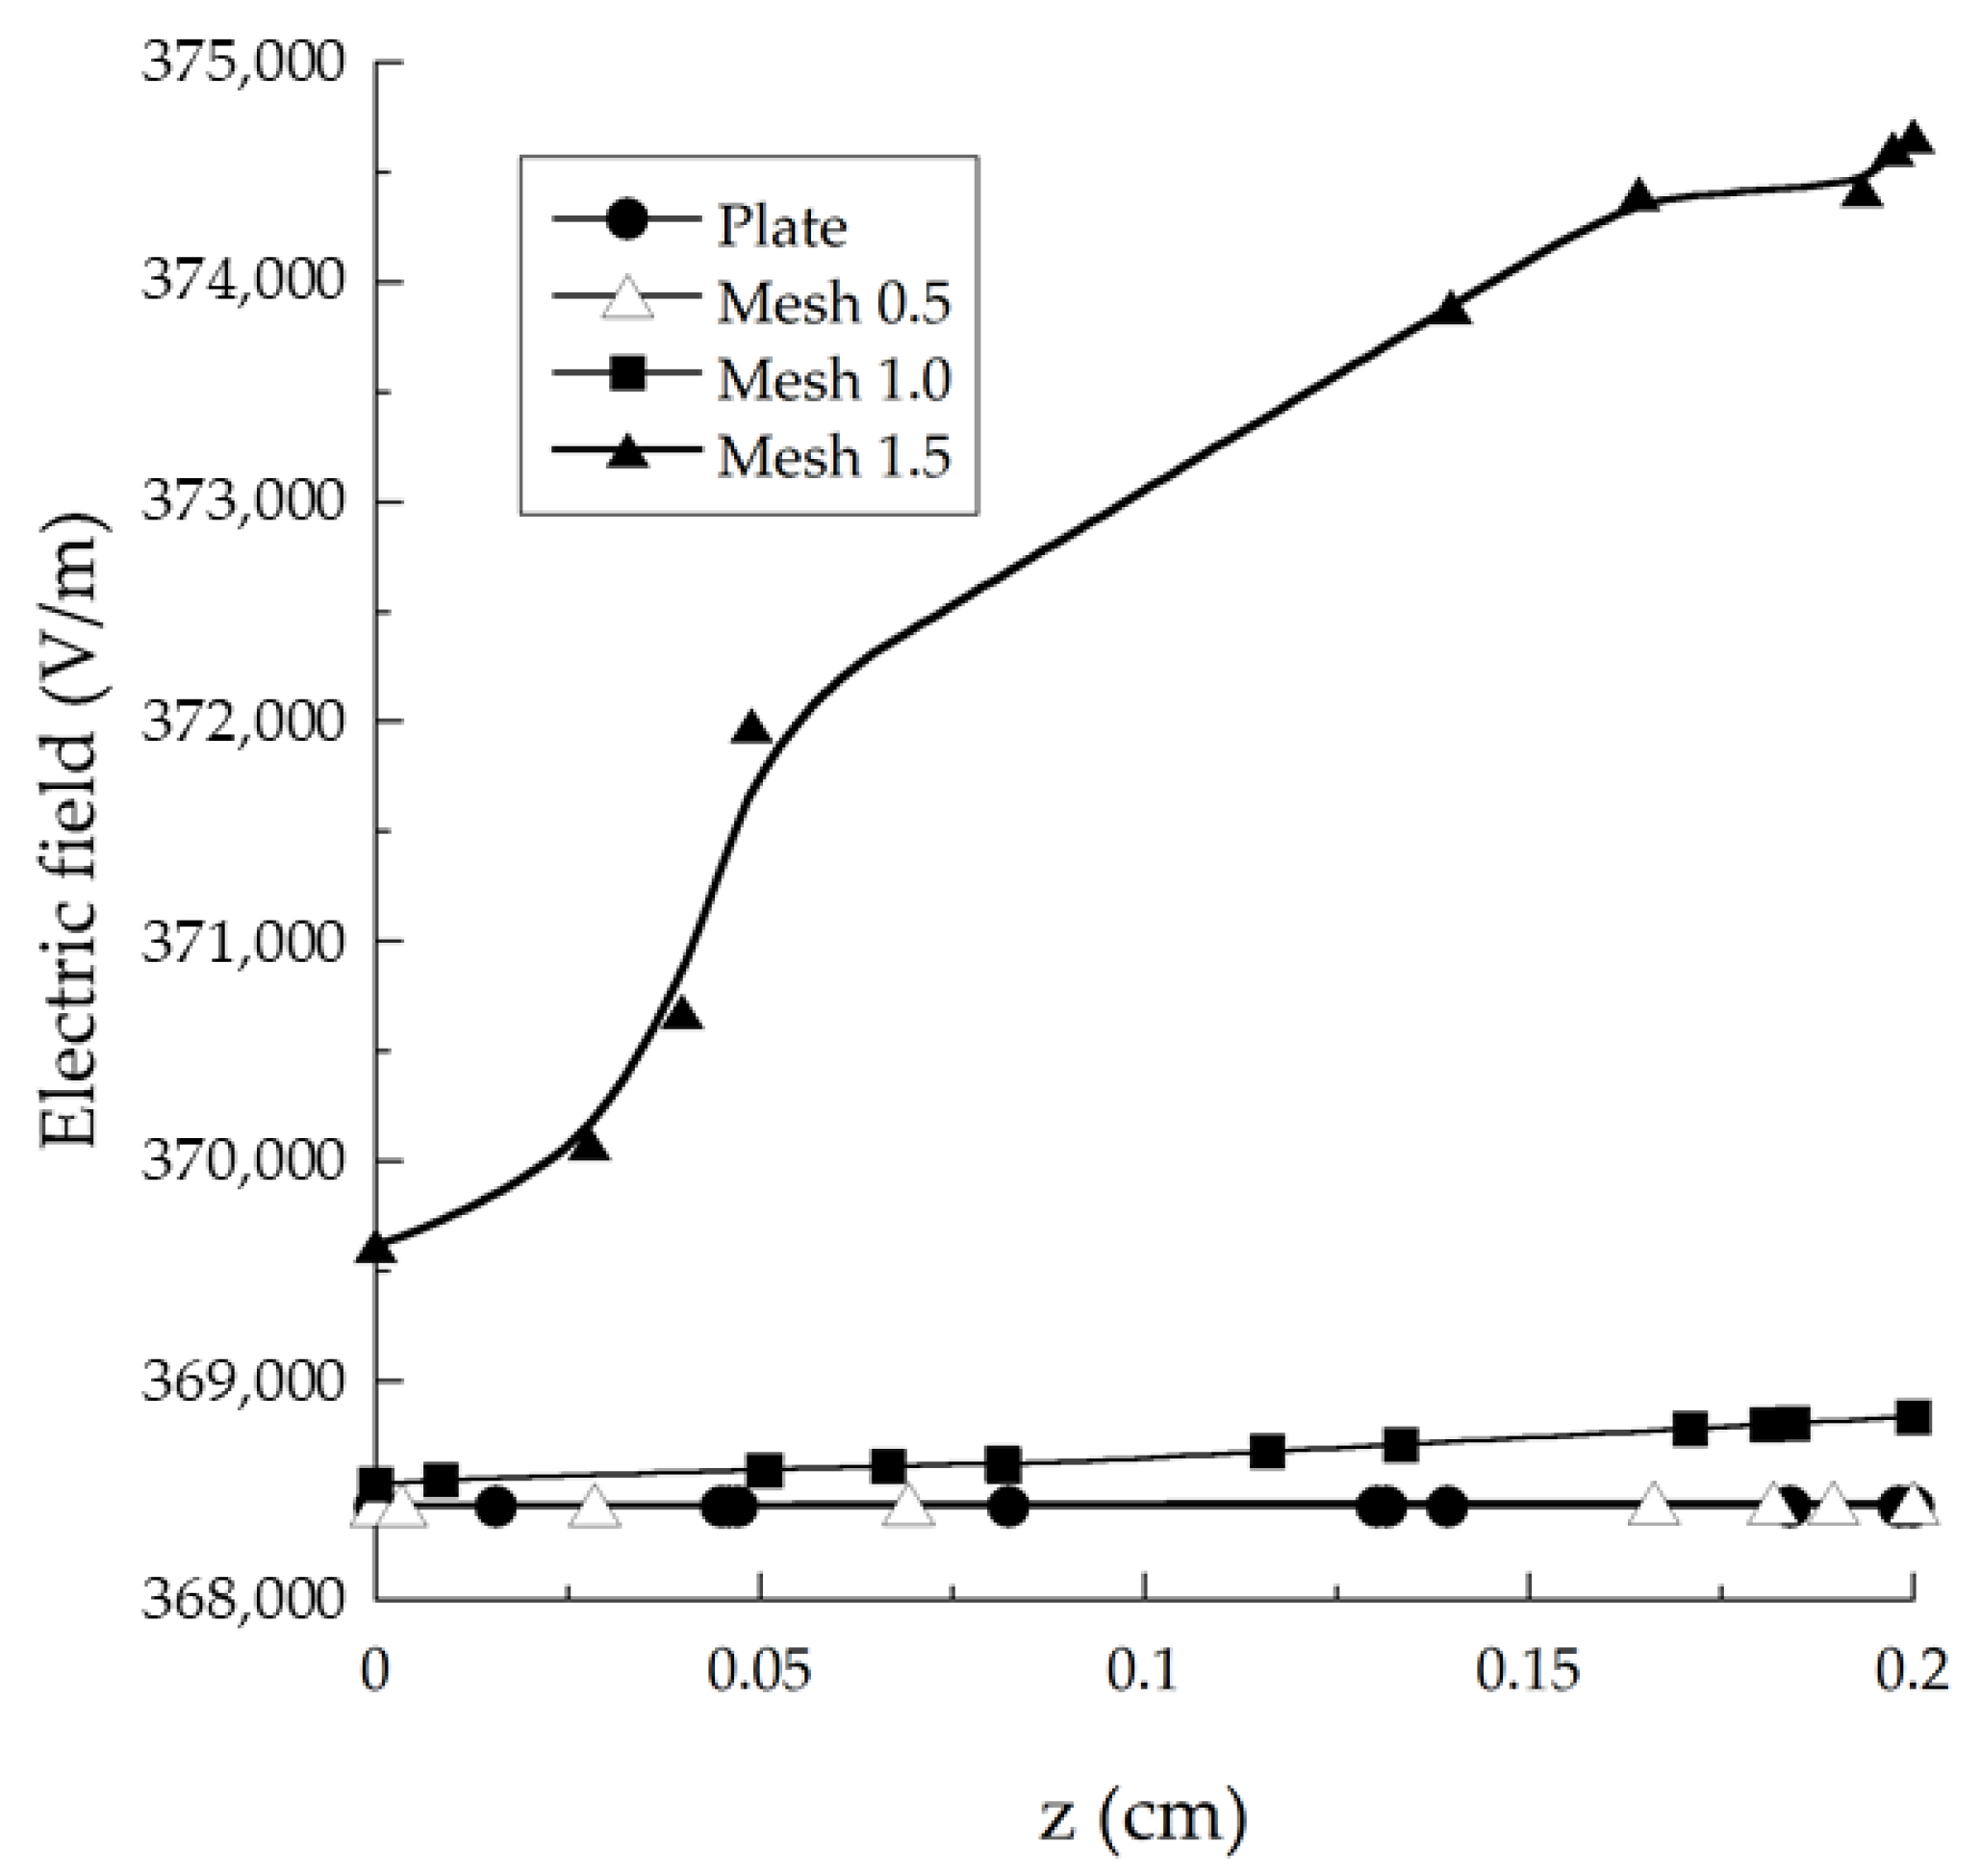
  • A higher-intensity electric field can be generated via electrodes with a larger mesh size, resulting in a lower breakdown voltage than for electrodes with a small mesh size.
  • A comparison of the results for relative dielectric permittivity with different starch shows that the breakdown voltage decreases with increasing permittivity of the used starch.
  • Starch with a polyhedral granule shape uses a voltage for breakdown significantly lower than that used in sphere and ellipsoid shapes.
  • The thinner starch layer allows it to ionize at lower voltages while increasing the starch layer thickness requires an increase in the breakdown voltage.
  • When the thickness of the starch layer is fixed, the breakdown voltage is unaffected by the starch granule diameter.
These results can be beneficial in determining the optimal breakdown voltage for each type of starch because each kind has unique properties. Furthermore, they can be constructive in determining the suitable plasma system design for starch modifications.

Author Contributions

Conceptualization, P.C. (Pitchasak Chankuson); methodology, P.C. (Pitchasak Chankuson) and A.P.; software, P.C. (Pitchasak Chankuson) and A.P.; validation, P.C. (Pitchasak Chankuson) and P.C. (Paramee Chumsri); formal analysis, P.C. (Pitchasak Chankuson) and P.C. (Paramee Chumsri); resources, P.C. (Pitchasak Chankuson), A.P. and P.C. (Paramee Chumsri); data curation, P.C. (Pitchasak Chankuson), A.P. and P.C. (Paramee Chumsri); writing—original draft preparation, P.C. (Pitchasak Chankuson) and P.C. (Paramee Chumsri); writing—review and editing, P.C. (Pitchasak Chankuson); visualization, P.C. (Pitchasak Chankuson). All authors have read and agreed to the published version of the manuscript.

Funding

This research received no external funding.

Institutional Review Board Statement

Not applicable.

Informed Consent Statement

Not applicable.

Data Availability Statement

Data are contained within the article.

Acknowledgments

The authors would like to thank the Center of Excellence in Plasma and Electromagnetic Waves, Walailak University, for support with software package COMSOL Multiphysics 3.5a Software, and the Faculty of Science and Technology, Nakhon Si Thammarat Rajabhat University, for support with the research equipment and resources.

Conflicts of Interest

The authors declare no conflict of interest.

References

  1. Vamadevan, V.; Bertoft, E. Structure-function relationships of starch components. Starch-Stärke 2015, 67, 55–68. [Google Scholar] [CrossRef]
  2. Robyt, J. Starch: Structure, Properties, Chemistry, and Enzymology. In Glycoscience; Fraser-Reid, B.O., Tatsuta, K., Thiem, J., Eds.; Springer: Berlin/Heidelberg, Germany, 2008; pp. 1437–1472. [Google Scholar] [CrossRef]
  3. Park, S.H.; Na, Y.; Kim, J.; Kang, S.D.; Park, K.-H. Properties and applications of starch modifying enzymes for use in the baking industry. Food Sci. Biotechnol. 2018, 27, 299–312. [Google Scholar] [CrossRef] [PubMed]
  4. Guo, Z.; Gou, Q.; Yang, L.; Yu, Q.-L.; Han, L. Dielectric barrier discharge plasma: A green method to change structure of potato starch and improve physicochemical properties of potato starch films. Food Chem. 2022, 370, 130992. [Google Scholar] [CrossRef] [PubMed]
  5. Goiana, M.L.; de Brito, E.S.; Alves Filho, E.G.; Miguel, E.D.C.; Fernandes, F.A.N.; Azeredo, H.M.C.D.; Rosa, M.D.F. Corn starch based films treated by dielectric barrier discharge plasma. Int. J. Biol. Macromol. 2021, 183, 2009–2016. [Google Scholar] [CrossRef]
  6. Figueroa-Pinochet, M.F.; Castro-Alija, M.J.; Tiwari, B.K.; Jiménez, J.M.; López-Vallecillo, M.; Cao, M.J.; Albertos, I. Dielectric Barrier Discharge for Solid Food Applications. Nutrients 2022, 14, 4653. [Google Scholar] [CrossRef]
  7. Singh, J.; Colussi, R.; McCarthy, O.J.; Kaur, L. Chapter 8—Potato Starch and Its Modification. In Advances in Potato Chemistry and Technology, 2nd ed.; Singh, J., Kaur, L., Eds.; Academic Press: Cambridge, MA, USA, 2016; pp. 195–247. [Google Scholar] [CrossRef]
  8. Beh, C.Y.; Cheng, E.M.; Mohd Nasir, N.F.; Abdul Majid, M.S.; Khor, S.F.; Mohd Jamir, M.R.; Mohd Tarmizi, E.Z.; Lee, K.Y. Dielectric Properties of Hydrothermally Modified Potato, Corn, and Rice Starch. Agriculture 2022, 12, 783. [Google Scholar] [CrossRef]
  9. Wang, S.; Wang, J.; Liu, Y.; Liu, X. Starch Modification and Application. In Starch Structure, Functionality and Application in Foods; Wang, S., Ed.; Springer: Singapore, 2020; pp. 131–149. [Google Scholar] [CrossRef]
  10. Jayakody, L.; Hoover, R. Effect of annealing on the molecular structure and physicochemical properties of starches from different botanical origins—A review. Carbohydr. Polym. 2008, 74, 691–703. [Google Scholar] [CrossRef]
  11. Carvalho, A.P.M.G.; Barros, D.R.; da Silva, L.S.; Sanches, E.A.; Pinto, C.D.C.; de Souza, S.M.; Clerici, M.T.P.S.; Rodrigues, S.; Fernandes, F.A.N.; Campelo, P.H. Dielectric barrier atmospheric cold plasma applied to the modification of Ariá (Goeppertia allouia) starch: Effect of plasma generation voltage. Int. J. Biol. Macromol. 2021, 182, 1618–1627. [Google Scholar] [CrossRef]
  12. Compart, J.; Singh, A.; Fettke, J.; Apriyanto, A. Customizing Starch Properties: A Review of Starch Modifications and Their Applications. Polymers 2023, 15, 3491. [Google Scholar] [CrossRef]
  13. Pratiwi, M.; Faridah, D.N.; Lioe, H.N. Structural changes to starch after acid hydrolysis, debranching, autoclaving-cooling cycles, and heat moisture treatment (HMT): A review. Starch-Stärke 2018, 70, 1700028. [Google Scholar] [CrossRef]
  14. Brasoveanu, M.; Nemtanu, M.R. Behaviour of starch exposed to microwave radiation treatment. Starch-Stärke 2014, 66, 3–14. [Google Scholar] [CrossRef]
  15. Falsafi, S.R.; Maghsoudlou, Y.; Rostamabadi, H.; Rostamabadi, M.M.; Hamedi, H.; Hosseini, S.M.H. Preparation of physically modified oat starch with different sonication treatments. Food Hydrocoll. 2019, 89, 311–320. [Google Scholar] [CrossRef]
  16. Matta Junior, M.D.; Castanha, N.; dos Anjos, C.B.P.; Augusto, P.E.D.; Sarmento, S.B.S. Ozone technology as an alternative to fermentative processes to improve the oven-expansion properties of cassava starch. Food Res. Int. 2019, 123, 56–63. [Google Scholar] [CrossRef] [PubMed]
  17. Tian, S.; Chen, Y.; Chen, Z.; Yang, Y.; Wang, Y. Preparation and Characteristics of Starch Esters and Its Effects on Dough Physicochemical Properties. J. Food Qual. 2018, 2018, 1395978. [Google Scholar] [CrossRef]
  18. Shi, M.; Gu, F.; Wu, J.; Yu, S.; Gao, Q. Preparation, physicochemical properties, and in vitro digestibility of cross-linked resistant starch from pea starch. Starch-Stärke 2013, 65, 947–953. [Google Scholar] [CrossRef]
  19. Fonseca, L.M.; Gonçalves, J.R.; El Halal, S.L.M.; Pinto, V.Z.; Dias, A.R.G.; Jacques, A.C.; Da Zavareze, E.R. Oxidation of potato starch with different sodium hypochlorite concentrations and its effect on biodegradable films. LWT Food Sci. Technol. 2015, 60, 714–720. [Google Scholar] [CrossRef]
  20. Dura, A.; Blaszczak, W.; Rosell, C.M. Functionality of porous starch obtained by amylase or amyloglucosidase treatments. Carbohydr. Polym. 2014, 101, 837–845. [Google Scholar] [CrossRef]
  21. Thirumdas, R.; Kadam, D.; Annapure, U.S. Cold plasma: An alternative technology for the starch modification. Food Biophys. 2017, 12, 129–139. [Google Scholar] [CrossRef]
  22. Goiana, M.L.; Mattos, A.L.A.; de Azeredo, H.M.C.; de Freitas Rosa, M.; Fernandes, F.A.N. Influence of Dielectric Barrier Discharge Cold Plasma Treatment on Starch, Gelatin, and Bacterial Cellulose Biodegradable Polymeric Films. Polymers 2022, 14, 5215. [Google Scholar] [CrossRef]
  23. Sifuentes-Nieves, I.; Mendez-Montealvo, G.; Flores-Silva, P.C.; Nieto-Perez, M.; Neira-Velazquez, G.; Rodriguez-Fernandez, O.; Hernandez-Hernandez, E.; Velazquez, G. Dielectric barrier discharge and radio-frequency plasma effect on structural properties of starches with different amylose content. Innov. Food Sci. Emerg. Technol. 2021, 68, 102630. [Google Scholar] [CrossRef]
  24. Gupta, R.K.; Guha, P.; Srivastav, P.P. Effect of high voltage dielectric barrier discharge (DBD) atmospheric cold plasma treatment on physicochemical and functional properties of taro (Colocasia esculenta) starch. Int. J. Biol. Macromol. 2023, 253, 126772. [Google Scholar] [CrossRef] [PubMed]
  25. Chauhan, M.; Kalaivendan, R.G.T.; Eazhumalai, G.; Annapure, U.S. Atmospheric pressure pin-to-plate cold plasma effect on physicochemical, functional, pasting, thermal, and structural characteristics of proso-millet starch. Food Res. Int. 2023, 173, 113444. [Google Scholar] [CrossRef] [PubMed]
  26. Thirumdas, R.; Trimukhe, A.; Deshmukh, R.R.; Annapure, U.S. Functional and rheological properties of cold plasma treated rice starch. Carbohydr. Polym. 2017, 157, 1723–1731. [Google Scholar] [CrossRef]
  27. Banura, S.; Thirumdas, R.; Kaur, A.; Deshmukh, R.R.; Annapure, U.S. Modification of starch using low pressure radio frequency air plasma. LWT 2018, 89, 719–724. [Google Scholar] [CrossRef]
  28. Yan, S.; Gui-Yun, C.; Ya-Jie, H.; Ye, C. Improved solubility of banana starch by dielectric barrier discharge plasma treatment. Int. J. Food Sci. Technol. 2019, 55, 641–648. [Google Scholar] [CrossRef]
  29. Okyere, A.Y.; Bertoft, E.; Amponsah Annor, G. Modification of cereal and tuber waxy starches with radio frequency cold plasma and its effects on waxy starch properties. Carbohydr. Polym. 2019, 223, 115075. [Google Scholar] [CrossRef]
  30. Zhu, Q.; Yao, S.; Wu, Z.; Li, D.; Ding, T.; Liu, D.; Xu, E. Hierarchical structural modification of starch via non-thermal plasma: A state-of-the-art review. Carbohydr. Polym. 2023, 311, 120747. [Google Scholar] [CrossRef]
  31. Von Engel, A. Ionized Gases; American Institute of Physics Press: New York, NY, USA, 1993; pp. 193–204. [Google Scholar]
  32. Chankuson, P.; Chumsri, P. The Plasma Ozonizer System for Mangosteen Storage Container to Preserve the Quality of Mangosteen. Appl. Sci. 2023, 13, 4873. [Google Scholar] [CrossRef]
  33. Murillo, D.; Huergo, C.; Gallego, B.; Rodríguez, R.; Tornín, J. Exploring the Use of Cold Atmospheric Plasma to Overcome Drug Resistance in Cancer. Biomedicines 2023, 11, 208. [Google Scholar] [CrossRef]
  34. Magureanu, M.; Bradu, C.; Parvulescu, V.I. Plasma processes for the treatment of water contaminated with harmful organic compounds. J. Phys. D Appl. Phys. 2018, 51, 313002. [Google Scholar] [CrossRef]
  35. Pánka, D.; Jeske, M.; Łukanowski, A.; Baturo-Ciésniewska, A.; Prus, P.; Maitah, M.; Maitah, K.; Malec, K.; Rymarz, D.; Muhire, J.d.D.; et al. Can Cold Plasma Be Used for Boosting Plant Growth and Plant Protection in Sustainable Plant Production? Agronomy 2022, 12, 841. [Google Scholar] [CrossRef]
  36. Xiao, D. Gas Discharge and Gas Insulation; Shanghai Jiao Tong University Press: Shanghai, China, 2015; pp. 47–122. [Google Scholar]
  37. Lisovskiy, V.A.; Osmayev, R.O.; Gapon, A.V.; Dudin, S.V.; Lesnik, I.S.; Yegorenkov, V.D. Electric field non-uniformity effect on dc low pressure gas breakdown between flat electrodes. Vacuum 2017, 145, 19–29. [Google Scholar] [CrossRef]
  38. Tschiersch, R.; Nemschokmichal, S.; Bogaczyk, M.; Meichsner, J. Self-stabilized discharge filament in plane-parallel barrier discharge configuration: Formation, breakdown mechanism, and memory effects. J. Phys. D Appl. Phys. 2017, 50, 415206. [Google Scholar] [CrossRef]
  39. Talaat, M.; Farahat, M.A.; Said, T. Numerical investigation of the optimal characteristics of a transverse layer of dielectric barrier in a non-uniform electric field. J. Phys. Chem. Solids 2018, 121, 27–35. [Google Scholar] [CrossRef]
  40. Nijdam, S.; Teunissen, J.; Ebert, U. The physics of streamer discharge phenomena. Plasma Sources Sci. Technol. 2020, 29, 103001. [Google Scholar] [CrossRef]
  41. Fridman, A. Plasma Chemistry; Cambridge University Press: Cambridge, UK, 2011; pp. 157–166. [Google Scholar]
  42. Lee, M.; Park, G.; Park, C.; Kim, C. Improvement of grid independence test for computational fluid dynamics model of building based on grid resolution. Adv. Civil Eng. 2020, 2020, 8827936. [Google Scholar] [CrossRef]
  43. Knotek, S.; Schmelter, S.; Olbrich, M. Assessment of different parameters used in mesh independence studies in two-phase slug flow simulations. Meas. Sens. 2021, 18, 100317. [Google Scholar] [CrossRef]
  44. Radmilović-Radjenović, M.; Radjenović, D.; Radjenović, B. Simulation studies of the electrode configuration effect on the breakdown phenomenon. Int. J. Adv. Res. Comput. Sci. Electron. Eng. 2019, 8, 68–72. [Google Scholar]
  45. Foruzan, E.; Akmal, A.A.S.; Niayesh, K.; Lin, J.; Sharma, D.D. Comparative study on various dielectric barriers and their effect on breakdown voltage. High. Volt. 2018, 3, 51–59. [Google Scholar] [CrossRef]
  46. Facta, M.; Umiati, N.A.K.; Warsito, A. Geometrical shape investigation for electrodes in silent discharge chamber. IOP Conf. Ser. Mater. Sci. Eng. 2017, 190, 012022. [Google Scholar] [CrossRef]
  47. Zhang, S.; Chen, Z.; Zhang, B.; Chen, Y. Numerical Investigation on the Effects of Dielectric Barrier on a Nanosecond Pulsed Surface Dielectric Barrier Discharge. Molecules 2019, 24, 3933. [Google Scholar] [CrossRef] [PubMed]
  48. Seidela, J.V.; Castañeda-Uribeb, O.A.; Arevaloc, S.; Muñozd, F.; Proude, W.; Avila, A. Relative permittivity estimation of wheat starch: A critical property for understanding electrostatic hazards. J. Hazard. Mater. 2019, 368, 228–233. [Google Scholar] [CrossRef] [PubMed]
  49. Soloviev, V.R.; Selivonin, I.V.; Moralev, I.A. Breakdown voltage for surface dielectric barrier discharge ignition in atmospheric air. Phys. Plasmas 2017, 24, 103528. [Google Scholar] [CrossRef]
  50. Elaissi, S.; Alsaif, N.A.M. Modelling of Nonthermal Dielectric Barrier Discharge Plasma at Atmospheric Pressure and Role of Produced Reactive Species in Surface Polymer Microbial Purification. Polymers 2023, 15, 1235. [Google Scholar] [CrossRef]
  51. Kawagoe, Y. The Characteristic Polyhedral, Sharp-edged Shape of Compound-type Starch Granules in Rice Endosperm is Achieved via the Septum-like Structure of the Amyloplast. J. Appl. Glycosci. 2013, 60, 29–36. [Google Scholar] [CrossRef]
  52. Song, G.; Wang, Y.; Tan, D.Q. A review of surface roughness impact on dielectric film properties. IET Nanodielectr. 2022, 5, 1–23. [Google Scholar] [CrossRef]
  53. Yang, G.; Zhang, Q.; Zhong, S.; Sun, R. Effect of surface roughness on characteristics of surface dielectric barrier discharge. High. Volt. Appar. 2016, 52, 96–100. [Google Scholar] [CrossRef]
  54. Hink, R.; Pipa, A.V.; Sch¨afer, J.; Caspari, R.; Weichwald, R.; Foest, R.; Brandenburg, R. Influence of dielectric thickness and electrode structure on the ion wind generation by micro fabricated plasma actuators. J. Phys. D Appl. Phys. 2020, 53, 405201. [Google Scholar] [CrossRef]
  55. Belinger, A.; Dap, S.; Naudé, N. Influence of the dielectric thickness on the homogeneity of a diffuse dielectric barrier discharge in air. J. Phys. D Appl. Phys. 2022, 55, 465201. [Google Scholar] [CrossRef]
Figure 1. A model consisting of the high voltage and ground electrode. Quartz acts as a dielectric and covers the bottom electrode.
Applsci 13 12143 g001
Figure 2. Mesh sizes for the top electrode are (a) 0.5 cm2, (b) 1.0 cm2, and (c) 1.5 cm2.
Applsci 13 12143 g002
Figure 3. The starch module with different granule shapes: (a) sphere, (b) ellipsoid, and (c) polyhedral.
Applsci 13 12143 g003
Figure 4. The starch module with thickness layers of (a) 0.6 mm, (b) 1.0 mm, and (c) 1.5 mm.
Applsci 13 12143 g004
Figure 5. The starch module with granule diameters of (a) 5 microns, (b) 50 microns, and (c) 150 microns.
Applsci 13 12143 g005
Figure 6. Paschen curves for argon calculated using Equation (6).
Applsci 13 12143 g006
Figure 7. Mean value (circles) and standard deviation (triangles) of the electric field for the different meshes.
Applsci 13 12143 g007
Figure 8. The distribution of the electric field between the gaps for the four top electrodes.
Applsci 13 12143 g008
Figure 9. The distribution of the electric field in the gaps along the yz planes (top) and xy planes (bottom) of the four top electrodes.
Applsci 13 12143 g009
Figure 10. The Paschen curve of the four top electrodes.
Applsci 13 12143 g010
Figure 11. The breakdown voltage versus the pressure and gap distance (pd) product of each relative permittivity result.
Applsci 13 12143 g011
Figure 12. Schemes of the Paschen curves of different relative permittivity results using (a) parallel plate electrode and (b) mesh-plate electrode.
Applsci 13 12143 g012
Figure 13. The breakdown voltage with the product of the pressure and gap distance (pd) for each type of granule.
Applsci 13 12143 g013
Figure 14. Schemes of the Paschen curves of different starch shapes using (a) parallel plate electrode and (b) mesh-plate electrode.
Applsci 13 12143 g014
Figure 15. The breakdown voltage with the gap distance and pressure product (pd) for each starch thickness.
Applsci 13 12143 g015
Figure 16. Paschen curves for three different starch thickness layers (0.6, 1.0, and 1.5 mm) using (a) parallel plate electrode and (b) mesh-plate electrode.
Applsci 13 12143 g016
Figure 17. The plots of the breakdown voltage versus the products of the gas pressure and gap distance (pd) for three starch diameters.
Applsci 13 12143 g017
Figure 18. Paschen curves are shown for three different starch diameters (10, 50, and 150 microns) using (a) parallel plates and (b) mesh plates as electrodes.
Applsci 13 12143 g018
Table 1. Number of mesh for the different mesh types.
Mesh TypeNumber of Mesh (×106)
extremely coarse0.102
extra coarse0.127
coarser0.171
coarse0.203
normal0.273
fine0.336
finer0.564
extra fine0.805
extremely fine1.114
Table 2. The breakdown voltage of different top electrodes at pressure 760 torr.
Gap Distance
(mm)
pd
(torr cm)
Breakdown Voltage (V)
PlateMesh 0.5 cm2Mesh 1.0 cm2Mesh 1.5 cm2
0.17.63094316331593031
0.215.22903296129552847
0.322.82937299129812900
0.430.43038308730772984
0.538.03166320531963113
0.645.63309334333393259
0.753.23461349434913414
0.860.83617365136483572
0.968.43777381138083735
1.076.03938397339703899
Plate means the parallel plate electrode. Mesh means mesh electrodes with mesh sizes of 1.5 cm2.
Table 3. The breakdown voltage of different starch relative permittivity levels at pressure 760 torr.
Gap Distance
(cm)
pd
(torr cm)
Breakdown Voltage (V)
εr = 3.1εr = 5.2εr = 7.5
PlateMeshPlateMeshPlateMesh
0.2152600656595854551457465412
0.3228730771857181706270916974
0.4304886587018758860786008455
0.538010,57010,36910,43510,23710,22510,050
0.645611,96811,74911,85311,64611,74811,552
0.753213,46413,22113,36313,13413,28913,050
0.860814,94714,66214,84514,57814,77214,524
0.968416,39916,08616,29416,01216,23015,958
1.0760.017,83917,47317,74117,40417,67017,352
Plate means the parallel plate electrode. Mesh means the mesh electrode with a mesh size of 1.5 cm2.
Table 4. The breakdown voltage of various starch granule shapes at pressure 760 torr.
Gap Distance
(cm)
pd
(torr cm)
Breakdown Voltage (V)
SphereEllipsoidPolyhedral
PlateMeshPlateMeshPlateMesh
0.2152600656596123579551455055
0.3228730771857448733868186681
0.4304886587018994887183908286
0.538010,57010,36910,66510,33799699859
0.645611,96811,74912,04811,82711,49811,371
0.753213,46413,22113,55113,30713,01712,874
0.860814,94714,66215,02914,74214,51114,354
0.968416,39916,08616,49116,17615,97015,821
1.0760.017,83917,47317,93717,56017,40817,202
Plate means the parallel plate electrode. Mesh means mesh electrodes with mesh sizes of 1.5 cm2.
Table 5. The breakdown voltage varies depending on the starch thickness layer at 760 torr of pressure.
Gap Distance
(cm)
pd
(torr cm)
Breakdown Voltage (V)
0.6 mm1.0 mm1.5 mm
PlateMeshPlateMeshPlateMesh
0.2152600656596083583261585978
0.3228730771857400725974937355
0.4304886587018976880990868937
0.538010,57010,36910,69910,49610,82910,623
0.645611,96811,74912,11611,90412,26512,038
0.753213,46413,22113,62913,39613,79813,549
0.860814,94714,66215,12914,85715,31815,011
0.968416,39916,08616,59716,26516,80116,465
1.0760.017,83917,47318,05317,67418,27317,907
Plate means the parallel plate electrode. Mesh means mesh electrodes with mesh sizes of 1.5 cm2.
Table 6. The breakdown voltage changes according to starch granule diameter at 760 torr of pressure.
Gap Distance
(cm)
pd
(torr cm)
Breakdown Voltage (V)
10 Micron50 Micron150 Micron
PlateMeshPlateMeshPlateMesh
0.2152599956536000565560065659
0.3228729971787300718173077185
0.4304885586928857869488658701
0.538010,55810,35810,56010,36110,57010,369
0.645611,95511,73711,95711,74011,96811,749
0.753213,44913,20713,45113,21013,46413,221
0.860814,93014,64714,93314,65114,94714,662
0.968416,38116,06916,38316,07316,39916,086
1.0760.017,81917,45417,82217,45817,83917,473
Plate means the parallel plate electrode. Mesh means mesh electrodes with mesh sizes of 1.5 cm2.
Disclaimer/Publisher’s Note: The statements, opinions and data contained in all publications are solely those of the individual author(s) and contributor(s) and not of MDPI and/or the editor(s). MDPI and/or the editor(s) disclaim responsibility for any injury to people or property resulting from any ideas, methods, instructions or products referred to in the content.

