Article

Application of EDEM Simulation for Calculating and Optimizing a Closed Coal Fly Ash Screw Conveyor

1
School of Mechanical Engineering, Hanoi University of Science and Technology, Hanoi 100000, Vietnam
2
Giaohangtietkiem JSC, VTV-Giaohangtietkiem Building, No. 8 Pham Hung St., Me Tri Ward, Nam Tu Liem Dist., Hanoi 100000, Vietnam
3
Innovative Global Program, College of Engineering, Shibaura Institute of Technology, Tokyo 135-8548, Japan
*
Author to whom correspondence should be addressed.
Appl. Sci. 2023, 13(22), 12169; https://doi.org/10.3390/app132212169
Submission received: 2 October 2023 / Revised: 4 November 2023 / Accepted: 7 November 2023 / Published: 9 November 2023
(This article belongs to the Topic Advances in Sustainable Materials and Products)

Abstract

:
In contemporary bulk material transportation systems, closed screw conveyors have become prevalent. These conveyors, enclosed within troughs or cylindrical bodies, effectively mitigate environmental contamination and material toxicity during transit. Their hermetic design prevents material dispersion by wind, thereby minimizing losses and preserving the integrity of raw materials, particularly those with potential health implications such as urea and cement. Consequently, employing a screw conveyor constitutes a prudent safety measure. Despite the widespread use of screw conveyors, a comprehensive understanding of the behavior of material particles within these systems remains elusive and subject to discrepancies across various methodologies. Presently, a multitude of calculation methods and applications exist, resulting in disparities between theoretical computations and practical implementation. Drawing upon Alan W. Roberts’ meticulously devised calculation methodology, renowned for its precision, the authors have developed a swift computational tool utilizing VBA Excel software 2023. Additionally, EDEM simulation software was employed to model granular material behavior. The ensuing calculations guided the selection of optimized technical dimensions for the screw conveyor, which were then fabricated and subjected to real-world testing at the Vinh Tan thermal power plant. Remarkably, the achieved output capacity demonstrated a mere 7% deviation from calculations performed with the VBA program and a 2% variation from those conducted via EDEM simulation. Furthermore, a comprehensive graph depicting the relationship between screw conveyor speed and capacity has been provided, affording a means to finely tune throughput with exceptional accuracy along the production line. The results obtained provide the basis for the development of a device that meets the required capacity specifications accurately and precisely on the first attempt. This accomplishment satisfies stringent capacity standards without the need for any adjustments or modifications, all while ensuring minimal cost and time efficiency.

1. Introduction

The calculation of screw conveyors is approached through various methods [1]. A comprehensive grasp of screw conveyor performance based on continuum mechanical principles is currently lacking. This is primarily due to the intricate nature of flow geometry and the fact that robust continuum models for dense particulate materials are still in the developmental stage. The conveyed materials exhibit a wide range of forms and physical properties, spanning from dry grains to liquid-saturated pastes, and from fine powders to coarse granules [2]. The research employs the methodology proposed by Roberts to examine the impact of granular motion on volumetric efficiency concerning theoretical throughput [3]. The outcomes indicate a direct correlation between feeder efficiency, screw rotation speed, and the helix angle of particle motion. This relationship holds true across various speed ranges and incline angles in closed screw conveyors, as evidenced by both predictive modeling and experimental validation. The study meticulously outlines the parameters and includes detailed analysis diagrams depicting material movement characteristics. These findings reveal intricate interconnections among key dimensions within the screw conveyor, such as screw diameter, screw shaft diameter, screw pitch, rotation speed, incline angle, etc. The properties of the conveyed material, including density, angle of repose, and coefficient of friction, play pivotal roles in the calculation and design of screw conveyors [4]. Several material parameters are particularly noteworthy for screw conveyors. The angle of repose denotes the steepest angle of an unconfined material heap measured from the horizontal plane, indicating the material’s heap stability [5]. Additionally, it offers insights into the cohesiveness of granular materials. Material density refers to its mass per unit volume, a crucial factor in determining the conveyor’s carrying capacity. The coefficient of friction represents the force that opposes relative motion between two contacting surfaces and is instrumental in assessing the power required to drive the screw conveyor, etc.
The DEM (discrete element method) simulation technique hinges on modeling the interactions among material particles themselves, as well as between the material and the screw-conveying apparatus. It operates by simulating the micro-level motion of these particles, adhering to fundamental mechanical principles such as Newton’s laws. The DEM simulation software version 8.2.0, Altair EDEM (Engineering Data EDEM), is widely recognized and a product of Altair Engineering, a global leader in computer-aided engineering (CAE) software and technology. Additionally, this software boasts an extensive library encompassing a range of industrial materials, from powders to granules and pellets. Notably, the material properties within the Altair EDEM library closely mirror real-world attributes, rendering them highly applicable in the design and operation of equipment for handling loose materials.
The default model within Altair EDEM Software version 8.2.0, as outlined in the Altair EDEM Software manual, is the Hertz–Mindlin (no slip) model, which utilizes Hertzian contact theory to determine the normal force component [6]. Another frequently employed approach is the Mindlin–Deresiewicz model [7], which incorporates damping components for both normal and tangential forces. The damping coefficient is correlated with the coefficient of restitution. The tangential friction force is governed by the Coulomb law of friction. Rolling friction is implemented through a contact-independent model involving constant torque in a specific direction. The DEM method is extensively employed and analyzed from various perspectives. Research [8] delved into the capacity of closed screws across a range of climbing angles. The simulation results were influenced by alterations in capacity at different speeds and angles of the screw conveyor [9]. A study by Renfeng Zhao et al. in 2022 introduced a structural optimization design of screw conveyors, which involved an examination of several model screw conveyors followed by the selection of the most optimized design [10]. The calibration and validation of materials within DEM have garnered significant attention from researchers. In 2017, C.J. Coetzee presented a comprehensive review paper on the calibration of the discrete element method, outlining methodologies for calibrating specific parameters and addressing potential challenges for future studies [11]. Furthermore, a study by V.A. Rodriguez et al. in 2022 proposed a detailed approach for calibration and validation at a pilot scale, demonstrating remarkably meticulous execution and yielding results closely aligned with real-world observations, with a low margin of error [12]. These studies highlight the importance and complexity of calibration and validation in DEM research.
In 2017, Željko V. Despotović et al. conducted a study on resonant linear vibratory conveyors, emphasizing the need for a detailed mathematical model to improve state observation accuracy and enhance performance and control quality. They derived the model from basic mechanical principles and built a simulation model based on these equations. They validated their findings by comparing them with experimental results from a real industrial vibratory conveyor [13]. In 2018, P.V. Boslovyak et al. focused on the development and enhancement of conveyor transport, specifically a specialized suspended belt conveyor with a load-carrying belt. They underscored the significance of reducing the mass of the conveyor’s metal structure during the initial design phase. The study introduced a mathematical model for the linear-section metal structure of the conveyor with a suspended load-carrying belt. The findings emphasized that employing modern approaches, particularly optimization methods, in the design of the conveyor’s metal structure leads to improvements in both weight and overall dimensions of the conveyor [14]. Vitalii P. Kondrakhin et al.’s study extensively explores the mathematical modeling and optimization of a single-roll gyratory shaft crusher, with a focus on its working chamber and executive body. Using differential equations and analytical expressions, the study identifies rational design parameters, encompassing the shape of the working chamber cheek, rotation speed, and productivity. The results demonstrate significant reductions in both torque and radial load, underscoring the effectiveness of the optimized parameters [15].
In this study, five main phases were undertaken: (1) Analysis of Coal Fly Ash Properties. (2) Application of Roberts’ theory, a swift VBA Excel calculation program was developed [16]. This program facilitated the selection of a set of technical dimensions that met the specified optimal capacity; (3) 3D modeling and simulation: A 3D model was constructed using SolidWorks software (2023 SP5) and then simulated in the EDEM software with coal fly ash in Vietnam; (4) manufacture of a real screw conveyor for experimentation at the Vinh Tan thermal power plant in Vietnam; (5) evaluation and comparison: Finally, a comprehensive evaluation and comparative analysis were carried out, comparing the results obtained from calculations, simulations, and actual tests.
The objectives of this paper encompass the following: (1) To discern and implement a robust calculation and simulation methodology within the EDEM software prior to manufacturing, ensuring the avoidance of model failure and meeting all specified capacity requirements accurately from the very first attempt, thereby optimizing cost and time; (2) to provide a method for the calculation and simulation of coal fly ash materials, including approaches for experimentation, determination, and computation of material parameters; (3) ultimately, to elucidate the intricate correlation between speed and capacity within the realm of screw conveyors, thereby enhancing our understanding of the material-handling process.

2. Materials and Methods

2.1. Specification of Coal Fly Ash

The accurate selection of fly ash properties holds significant implications for the precision of calculations and simulations. Extensive research has been conducted to investigate various properties of fly ash, including bulk density, angle of repose, particle size distribution, particle shape, etc.
The authors’ methodology for determining the properties of coal fly ash involves leveraging research papers on fly ash to obtain the necessary material parameters for their calculation methods. Once these parameters are secured, they incorporate the GEMM_particle_material_8454 material from the Altair EDEM software version 8.2.0’s material library. This material was chosen due to its close resemblance to the material property values derived from the aforementioned studies. Following this, a detailed analysis of the properties of coal fly ash is conducted as follows:
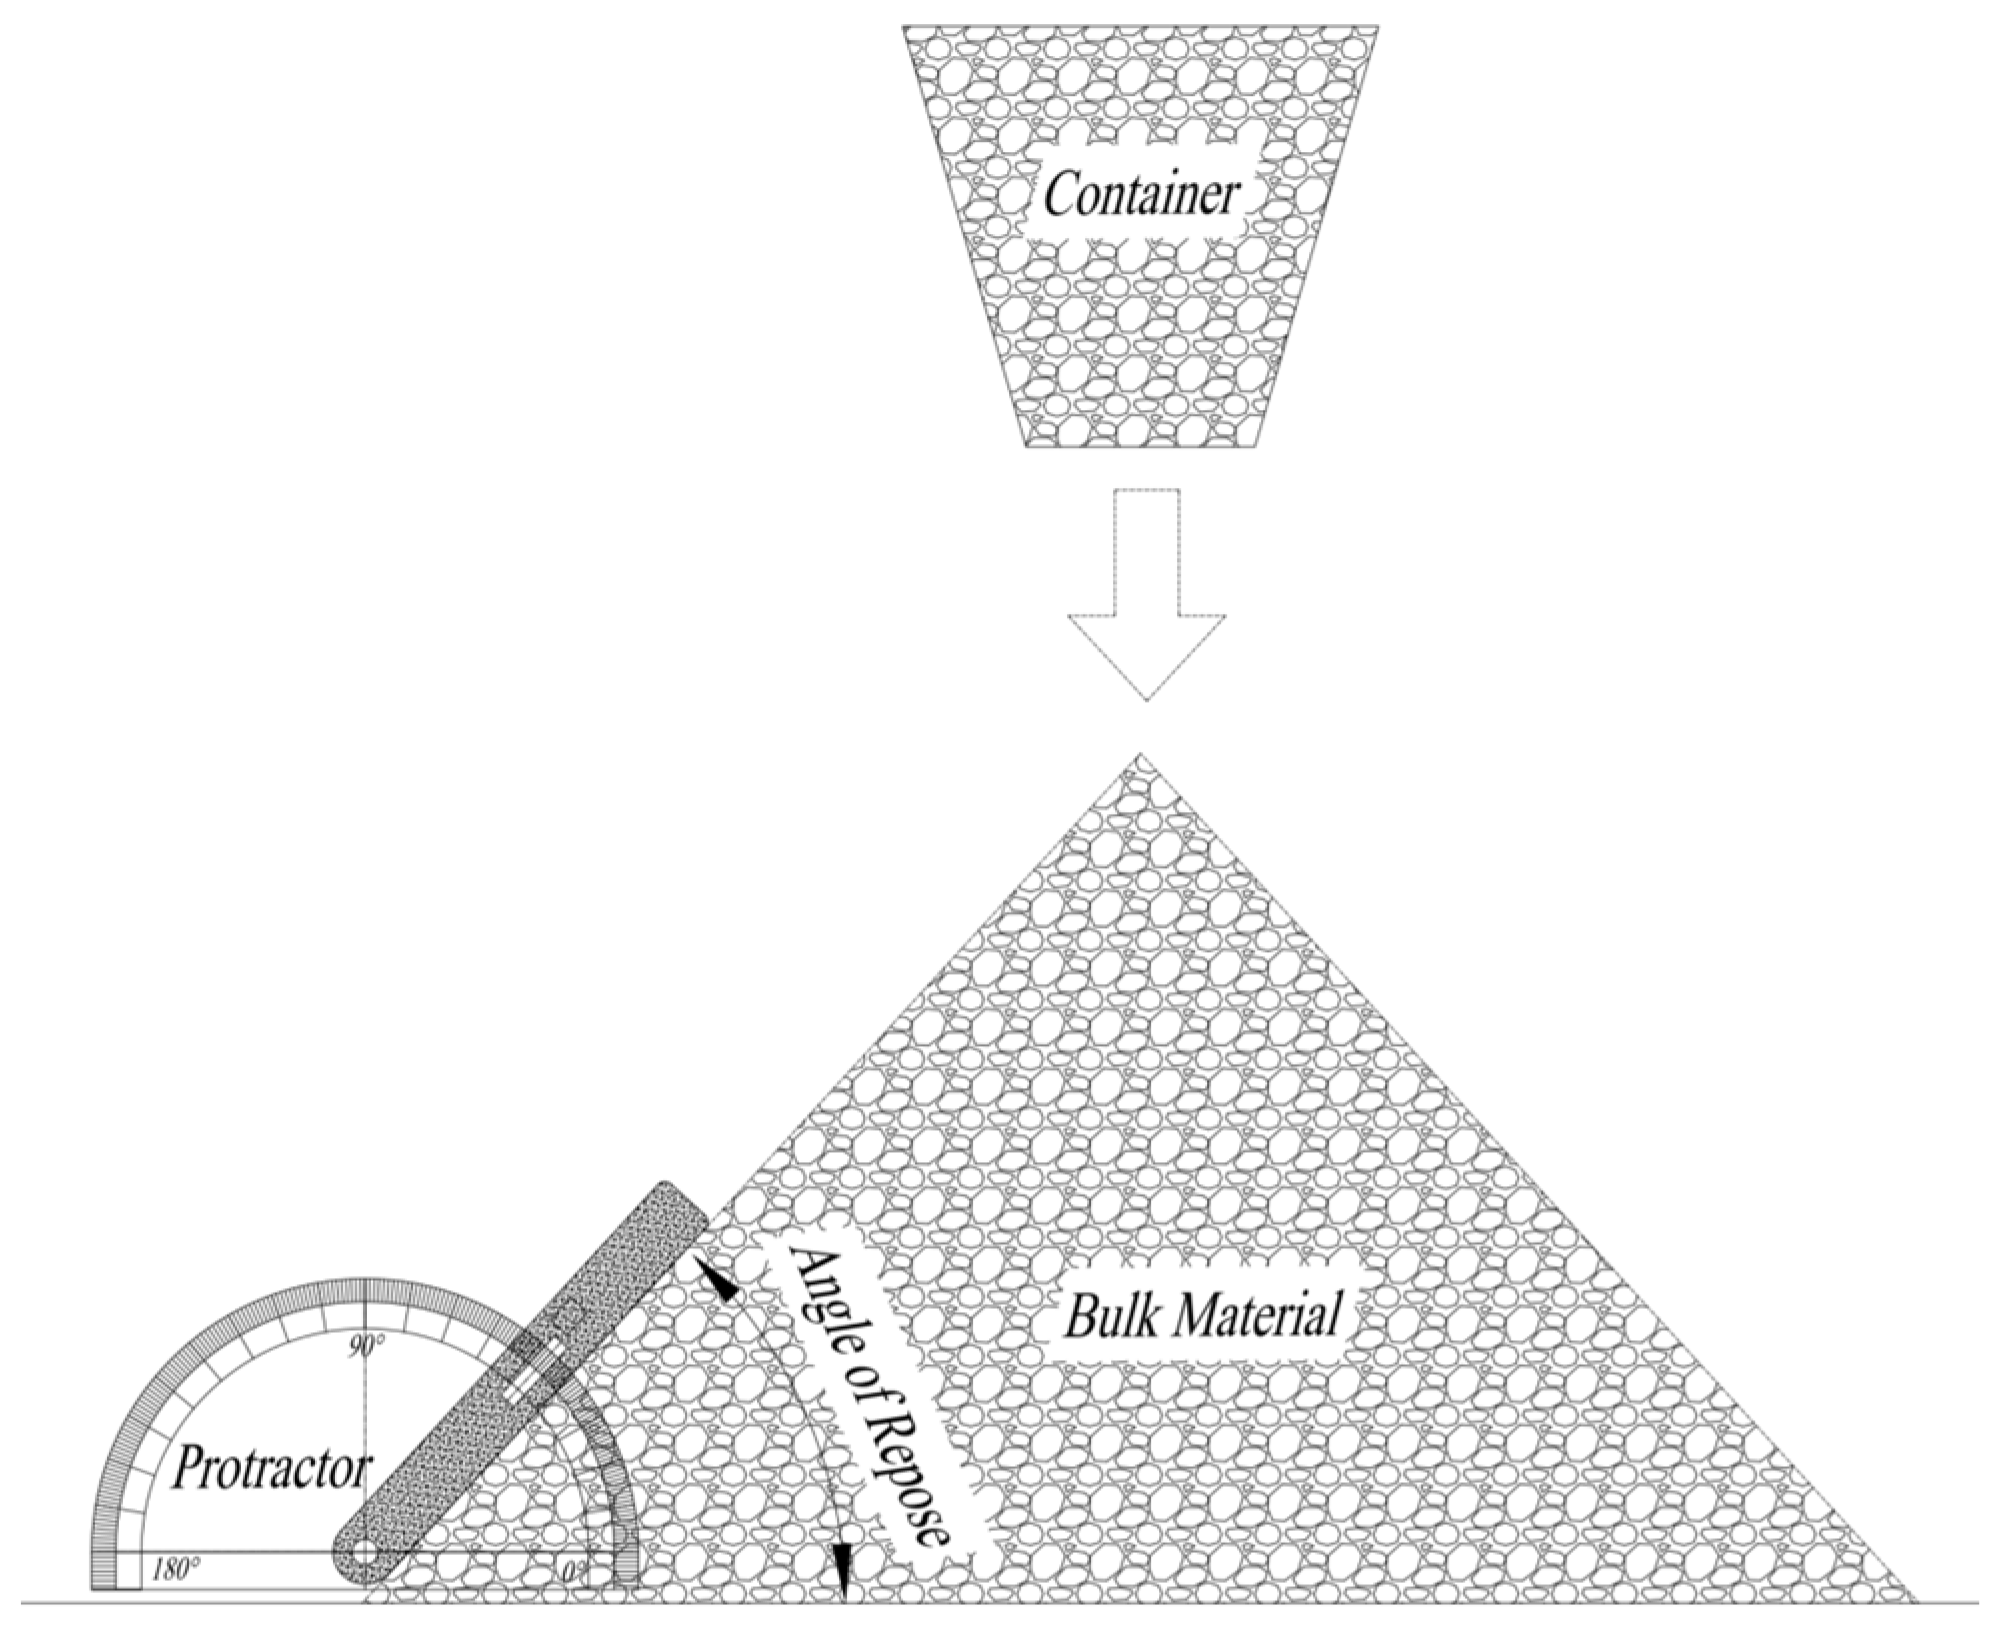
The first property of note is the inherent angle of repose of the material, which has been extensively discussed by [5,17]. This natural angle of repose is intertwined with other material attributes such as friction coefficient, bulk density, internal friction angle, and particle size. Initially measured in the eighteenth century, the angle of repose can now be assessed through experimental methods. In contemporary times, numerical techniques, such as the discrete element method (DEM), have enabled accurate determination of the angle of repose [18]. Figure 1 illustrates the principal method for measuring the angle of repose of a bulk material. This figure provides a visual representation of the method, making it easier to understand.
A study conducted revealed that the angle of repose for fly ash obtained from a power plant measured 47 degrees [17]. This angle exhibited an upward trend in tandem with rising moisture content. Moreover, the particle size distribution of the fly ash exerted an influence on the angle of repose; finer particle distributions resulted in a lower angle compared to coarser distributions. In a comprehensive study on coal ash in Vietnam, encompassing its deposition and utilization [19]. The particle size and distribution of fly ash in Vietnam were also investigated in a study conducted by [20,21]. The fly ash particles in Vietnam are characterized by their small size and high fineness, with particles smaller than 45 μm accounting for up to 83.9%. Real-life images of fly ash and observations under an electron microscope are presented in Figure 2.
The authors also conducted a study on the chemical composition of fly ash in Vietnam, where the predominant components were found to be SiO2 and Al2O3, constituting over 80% of the composition [21,22,23]. The detailed composition of fly ash is outlined in Table 1.
The study led by [24] delved into the bulk density of fly ash. This study conducted an extensive assessment of fly ash types worldwide, demonstrating that the bulk density of fly ash falls within the range of 640–1440 kg/m3. Notably, the bulk density demonstrated an inverse relationship with particle size distribution, registering the highest values for fly ash with finer particles and the lowest for coarser distributions. Additionally, moisture content exerted an impact, as fly ash with higher moisture content exhibited lower bulk density compared to counterparts with lower moisture content and the bulk density of fly ash in Vietnam, which is approximately 880 kg/m3. The bulk density of fly ash from thermal power plants in developed and developing countries worldwide was determined using the Archimedes method. The findings indicated that fly ash from developed countries exhibits a higher bulk density compared to that from developing countries. This discrepancy arises from the fact that developed nations commonly employ coal with higher ash content and employ more advanced coal combustion technologies [25,26]. The difference in moisture content and combustion technology is the cause of the variation between the two materials in the EDEM library and the actual conditions in Vietnam, as illustrated in Table 2. Furthermore, a separate investigation outlined in study [21] explored the solid density of fly ash originating from coal-fired power plants, revealing a value of approximately 2200 kg/m3.
The coefficient of static friction of fly ash is subject to variation based on specific properties such as particle size distribution, moisture content, and compaction. It is crucial to measure this coefficient for the fly ash to be utilized to ensure safe and efficient handling. A study conducted by Gilson Lomboy al. reported a coefficient of static friction of 0.56 for fly ash [27]. For the coefficient of rolling friction, which denotes the ratio of force necessary to sustain rolling motion between two surfaces to the normal force between them, values typically range between 0.05 and 0.1 for fly ash from coal-fired power plants. Zhang et al. observed a coefficient of rolling friction of 0.08 for fly ash [27].
Regarding the coefficient of restitution, which represents the ratio of the velocity of separation after a collision to the velocity of approach before the collision, values for fly ash generally fall between 0.3 and 0.6. J. Xie et al. found a coefficient of restitution of 0.5 for fly ash [28]. Finally, the set of material property parameters is established for the purposes of calculation, optimization, and simulation, as outlined in Table 2.
The two material properties are quite similar, differing primarily in bulk density. In this section, the adjustments were made to align with the characteristics of fly ash in Vietnam. This adjustment is a critical factor influencing the accuracy of the screw conveyor calculation and simulation.

2.2. Methods for Calculating Screw Conveyors

Screw pumps capacity
The capacity of the pipe screw is contingent upon the rotational speed of the screw, the material being transported, and the filling level or filling factor of the screw. The screw capacity is determined by the following expression [3]:
Q = Q t η V ( m 3 / s )
where, Q t —maximum capacity that can be transported; η V —volume coefficient.
The maximum capacity can be written as
Q t = Γ ω D 3 ( m 3 / s )
With
Γ = 1 8 [ ( 1 + 2 C D ) 2 ( D c D ) 2 ] [ p D t s D ]
where D—diameter of conveyor screw (m); p—screw pitch (m); C—radial clearance (m); D c —screw diameter (m); ω —rotational speed of the screw (rad/s); t s —thickness of screw blade (m).
The dimensions of the screw conveyor are shown in detail in the design drawing of the screw conveyor that the authors designed, optimized, manufactured, and are currently using stably at the Vinh Tan thermal power plant. The specifications of the actual screw conveyor are shown in Figure 3.
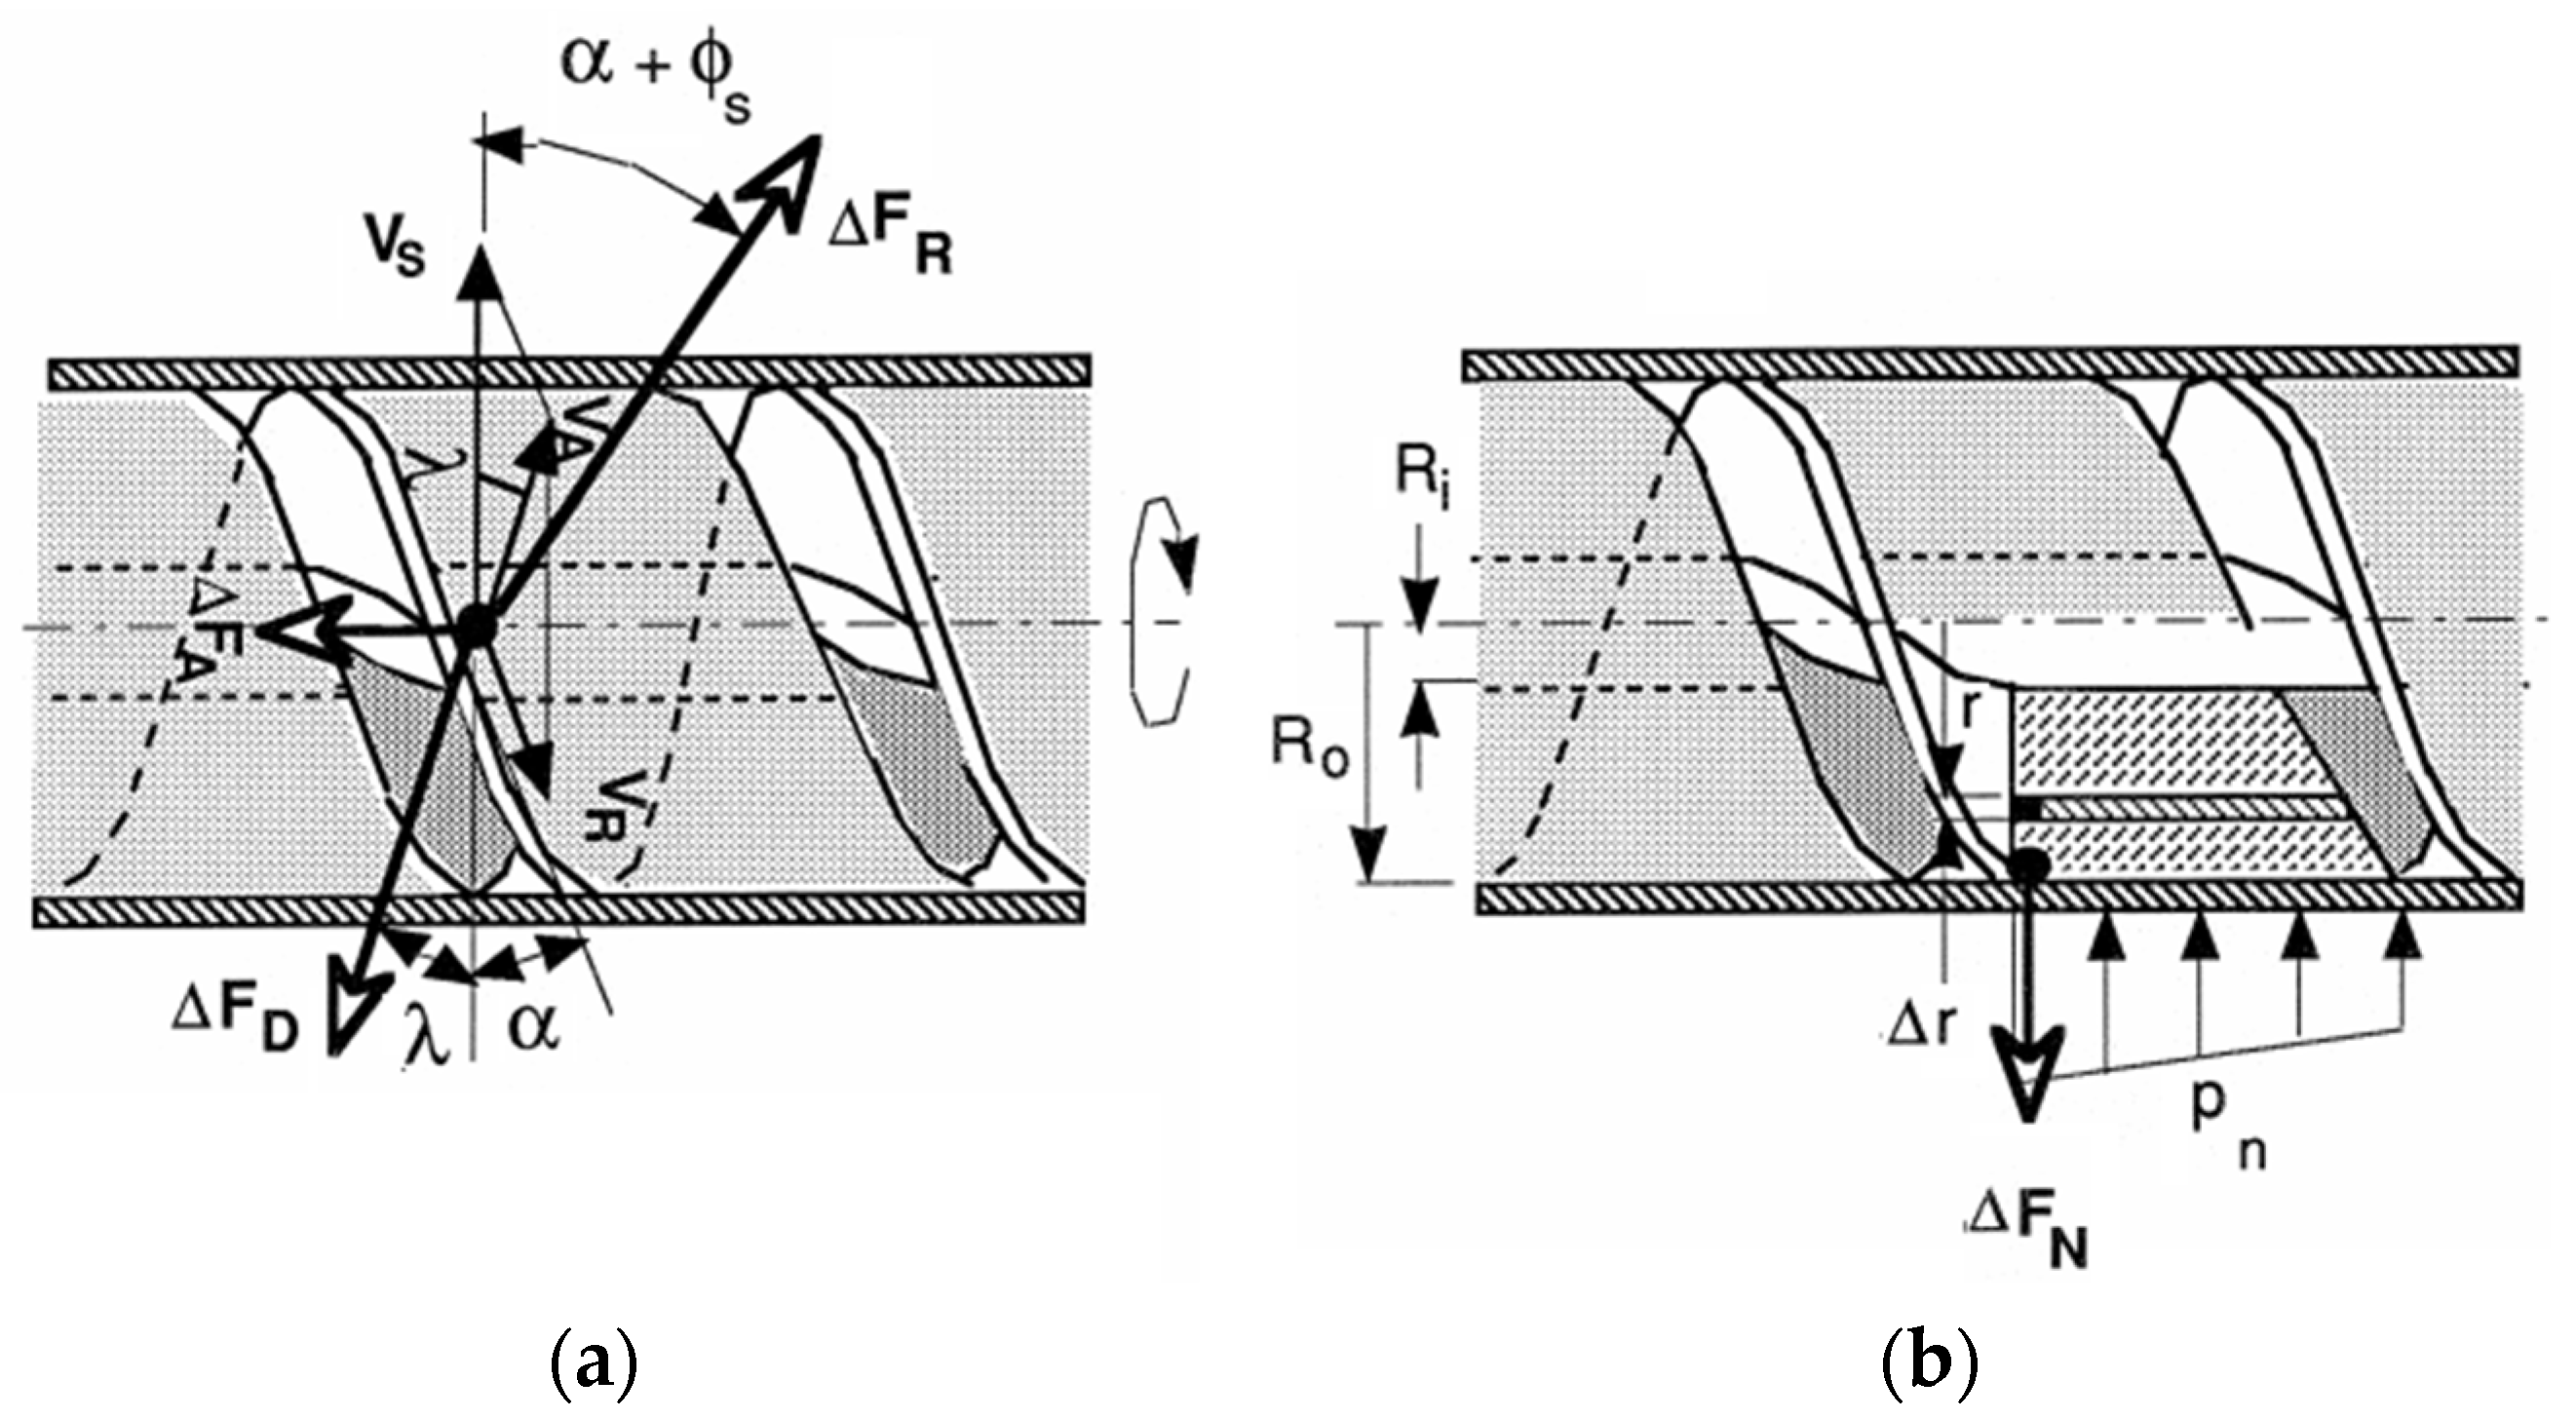
The magnitude of the relative velocity is primarily influenced by the frictional resistance between the material and the screw housing. This force hinges on the coefficient of friction existing between the material and the screw housing, as well as the centrifugal pressure exerted by the material on the screw housing [29]. The force acting on the screw conveyor is illustrated in Figure 4.
The connection between the rotational speed Ns and the incline angle of the screw conveyor is defined as follows:
N s = r ω 2 g = N 2 D 1789 = [ 1 + tan λ tan α ] 2 [ k F sin ( α + ϕ s ) μ g cos ( α + ϕ s + λ ) k s ]
where g is gravitational acceleration; k F = (1 − μ g k s ); k s = 2 k j η F ( p / D ) ; k j = 0.4; η F is filling ratio; and ϕ S is friction angle for screw surface.
Based on the theoretical framework presented, a calculation application was developed to determine essential parameters when designing a screw conveyor for fly ash. This application was implemented using Excel VBA programming, enabling rapid and efficient calculations to optimize conveyor capacity [16]. The dimensions of the coal fly ash screw conveyor for calculation and simulation are shown in Table 3.
The result of the VBA program calculation is shown in the line graph.
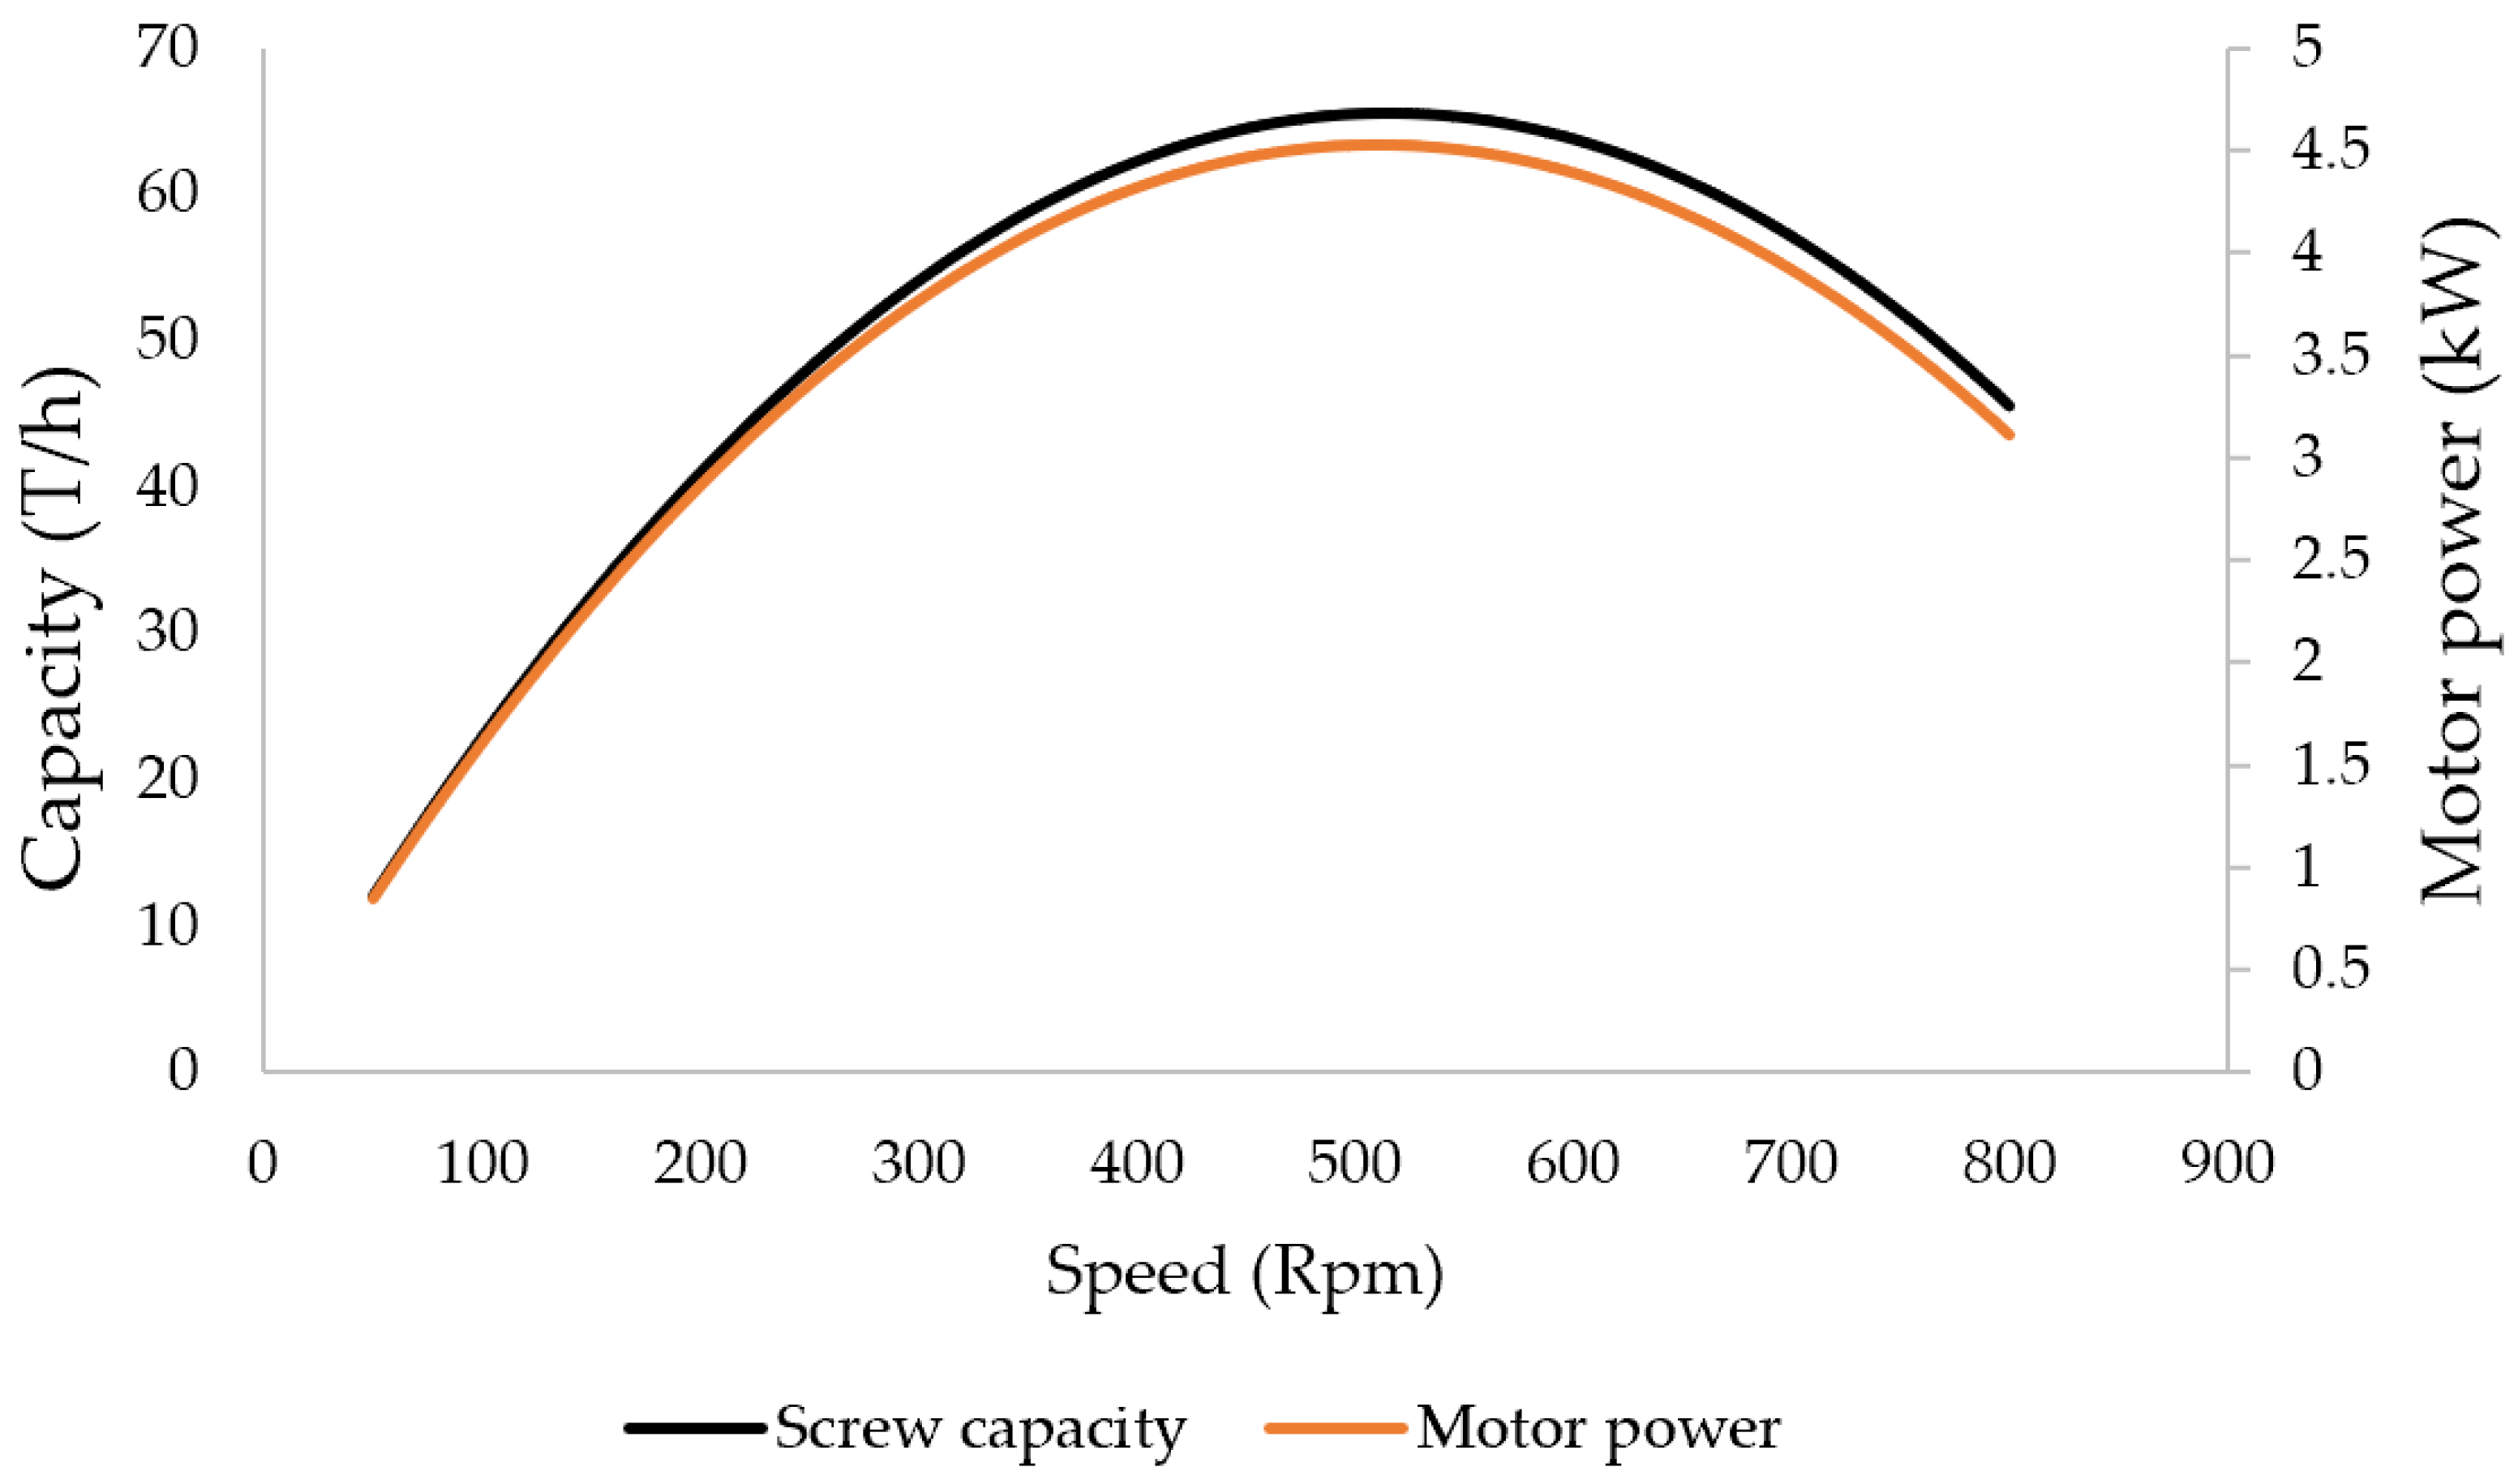
The capacity and motor power of the coal fly ash screw conveyor in range of speed by Roberts and tool VBA Excel is illustrated in Figure 5. Indeed, it is evident that the maximum capacity of the screw conveyor reaches approximately 65.7 tons per hour, achieved at a speed of around 500 revolutions per minute (rpm). When applying the Roberts method, it was noted that the motor power curve bore a relatively similar shape to the power curve of the screw conveyor. Given the relatively short length of the actual model, which is only 1300 mm, and its operation in a horizontal direction, the maximum motor power required was merely 4.53 kW. In the actual model, a motor with a power of 5.5 kW was chosen, resulting in the smooth operation of the screw conveyor system. In this study, due to the relatively low power values, selecting a suitable motor was straightforward. Consequently, an in-depth optimization and analysis of this parameter was not the primary focus of this research.

2.3. Altair EDEM Simulation

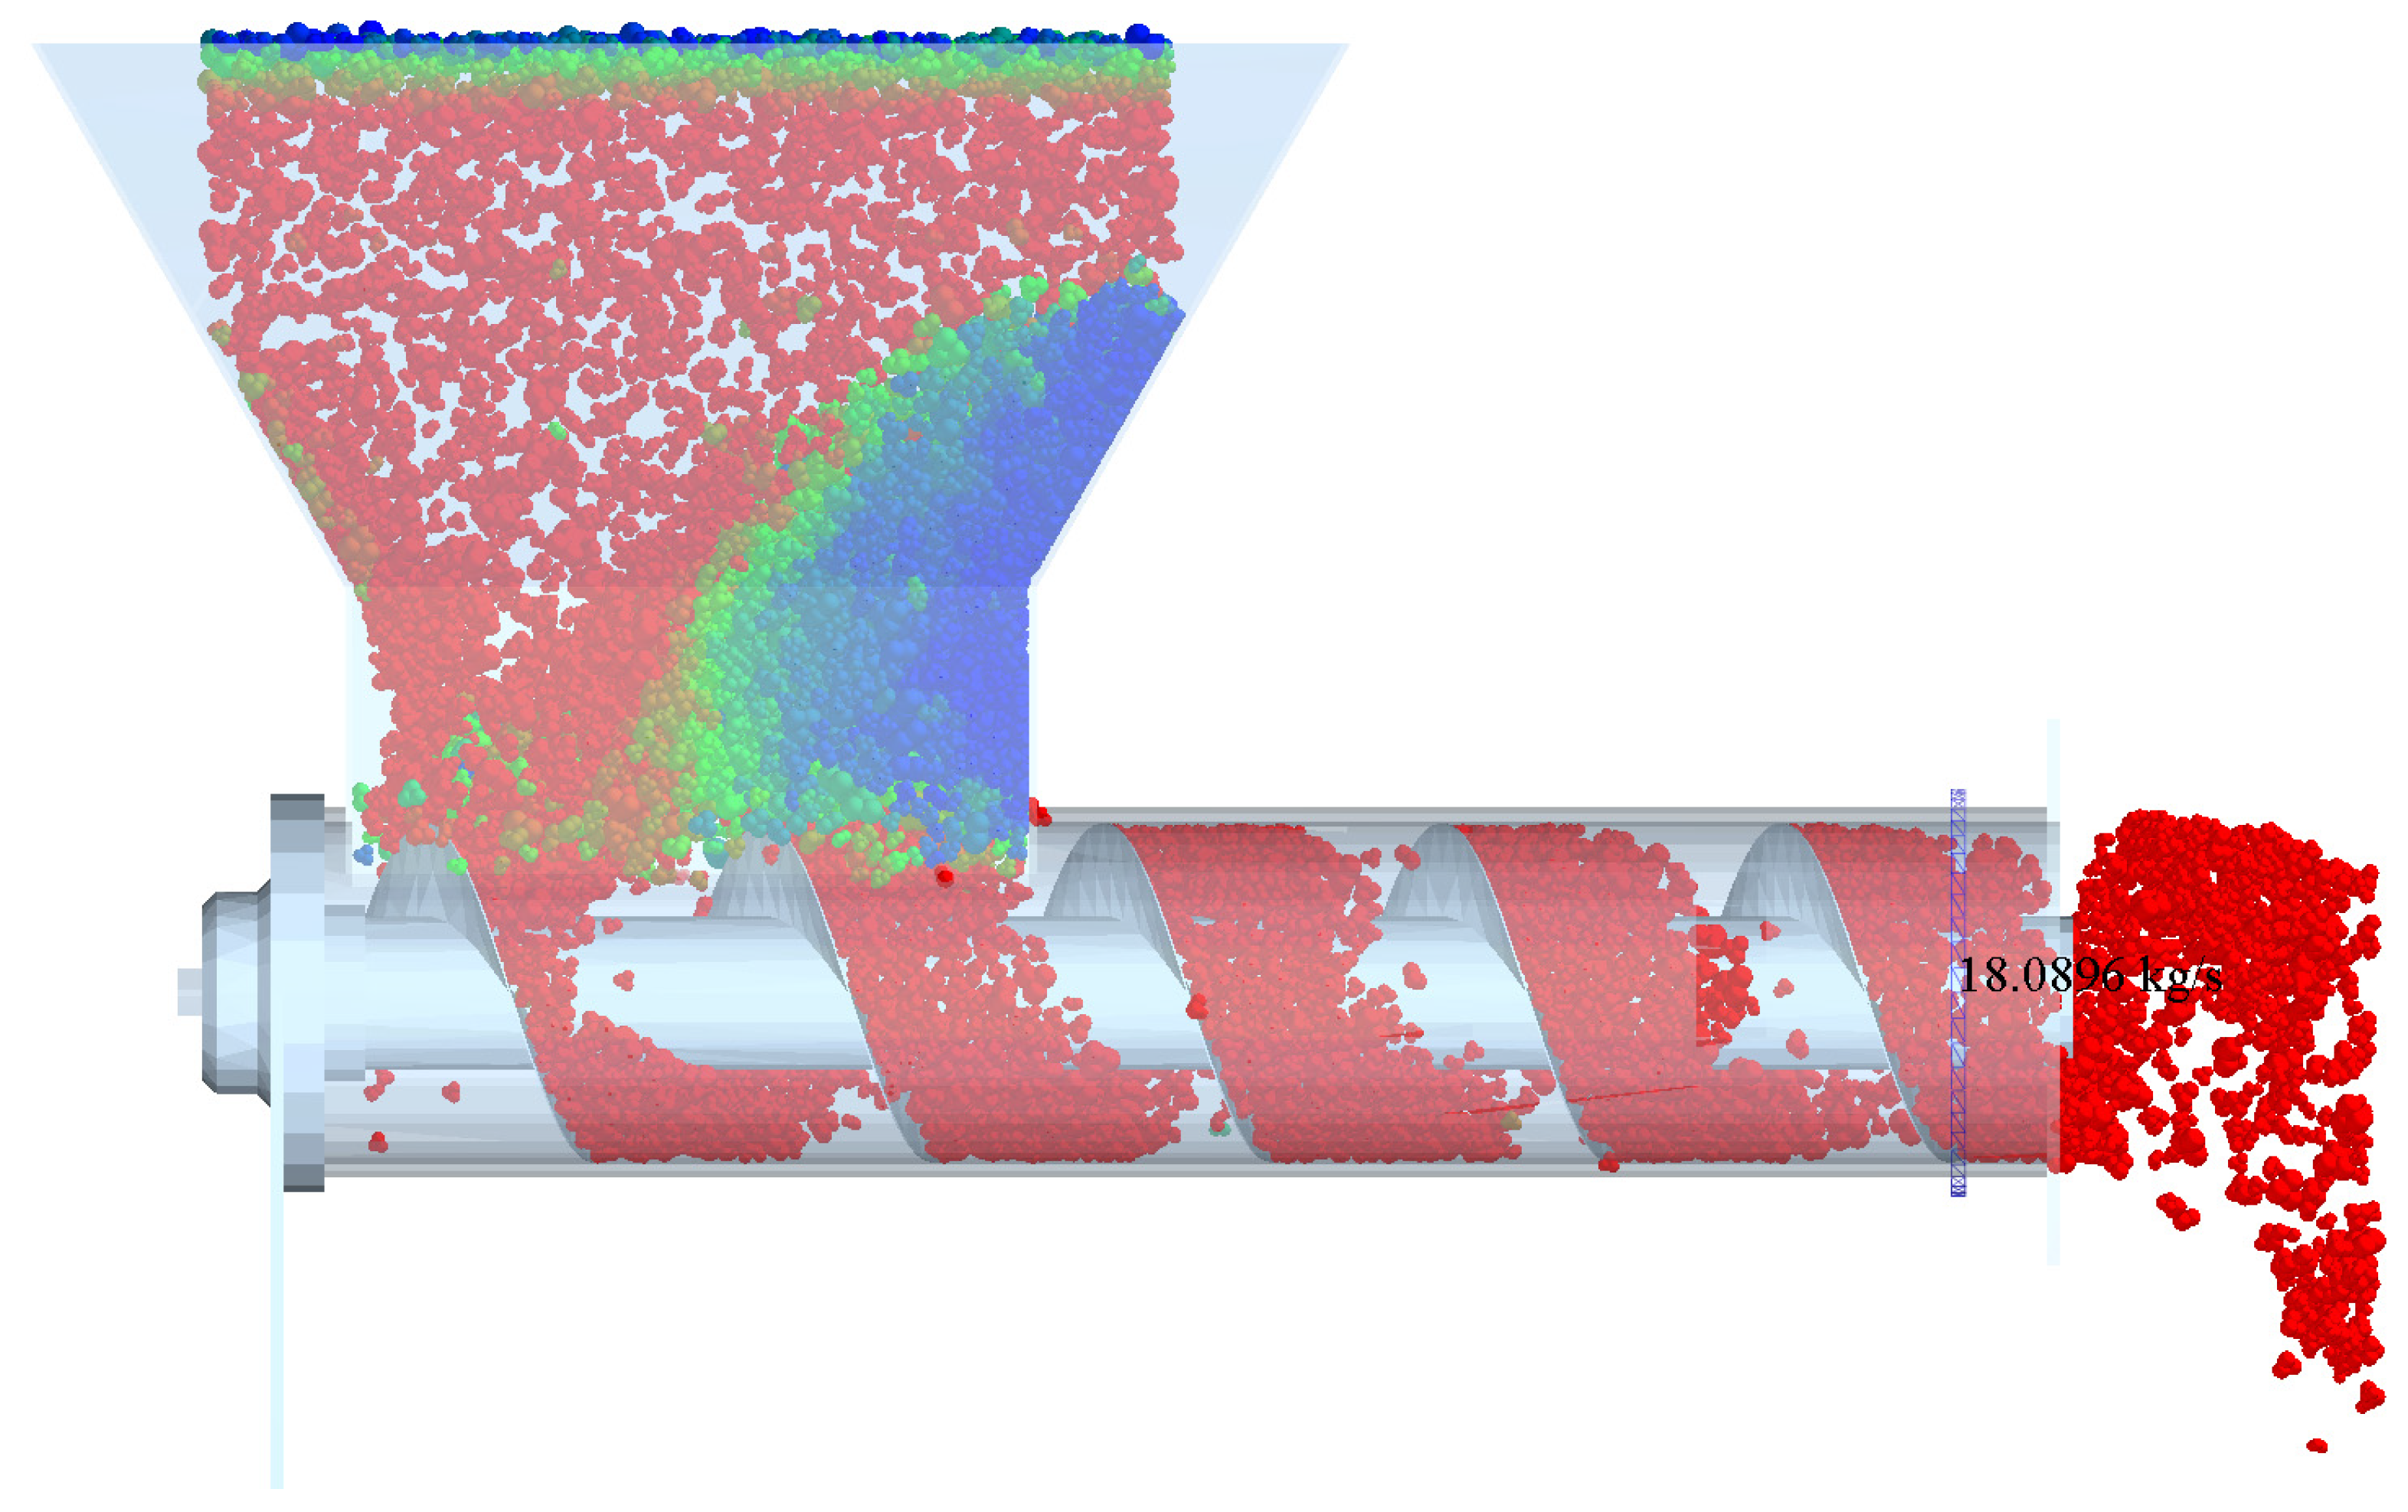
The closed screw conveyor’s 3D model was generated using 3D software 2023. Subsequently, this model was imported into the EDEM software for the purpose of conducting calculations. The Altair EDEM software version 8.2.0 (2022.2) was utilized, operating on a Dell Precision 5540 computer. This computer is equipped with an Intel® Core™ i7-9850H processor and 32 GB of DDR4 memory. A 3D model of the closed screw conveyor used in the simulation is illustrated in Figure 6, depicting the conveying speed of the bulk material within the screw conveyor.
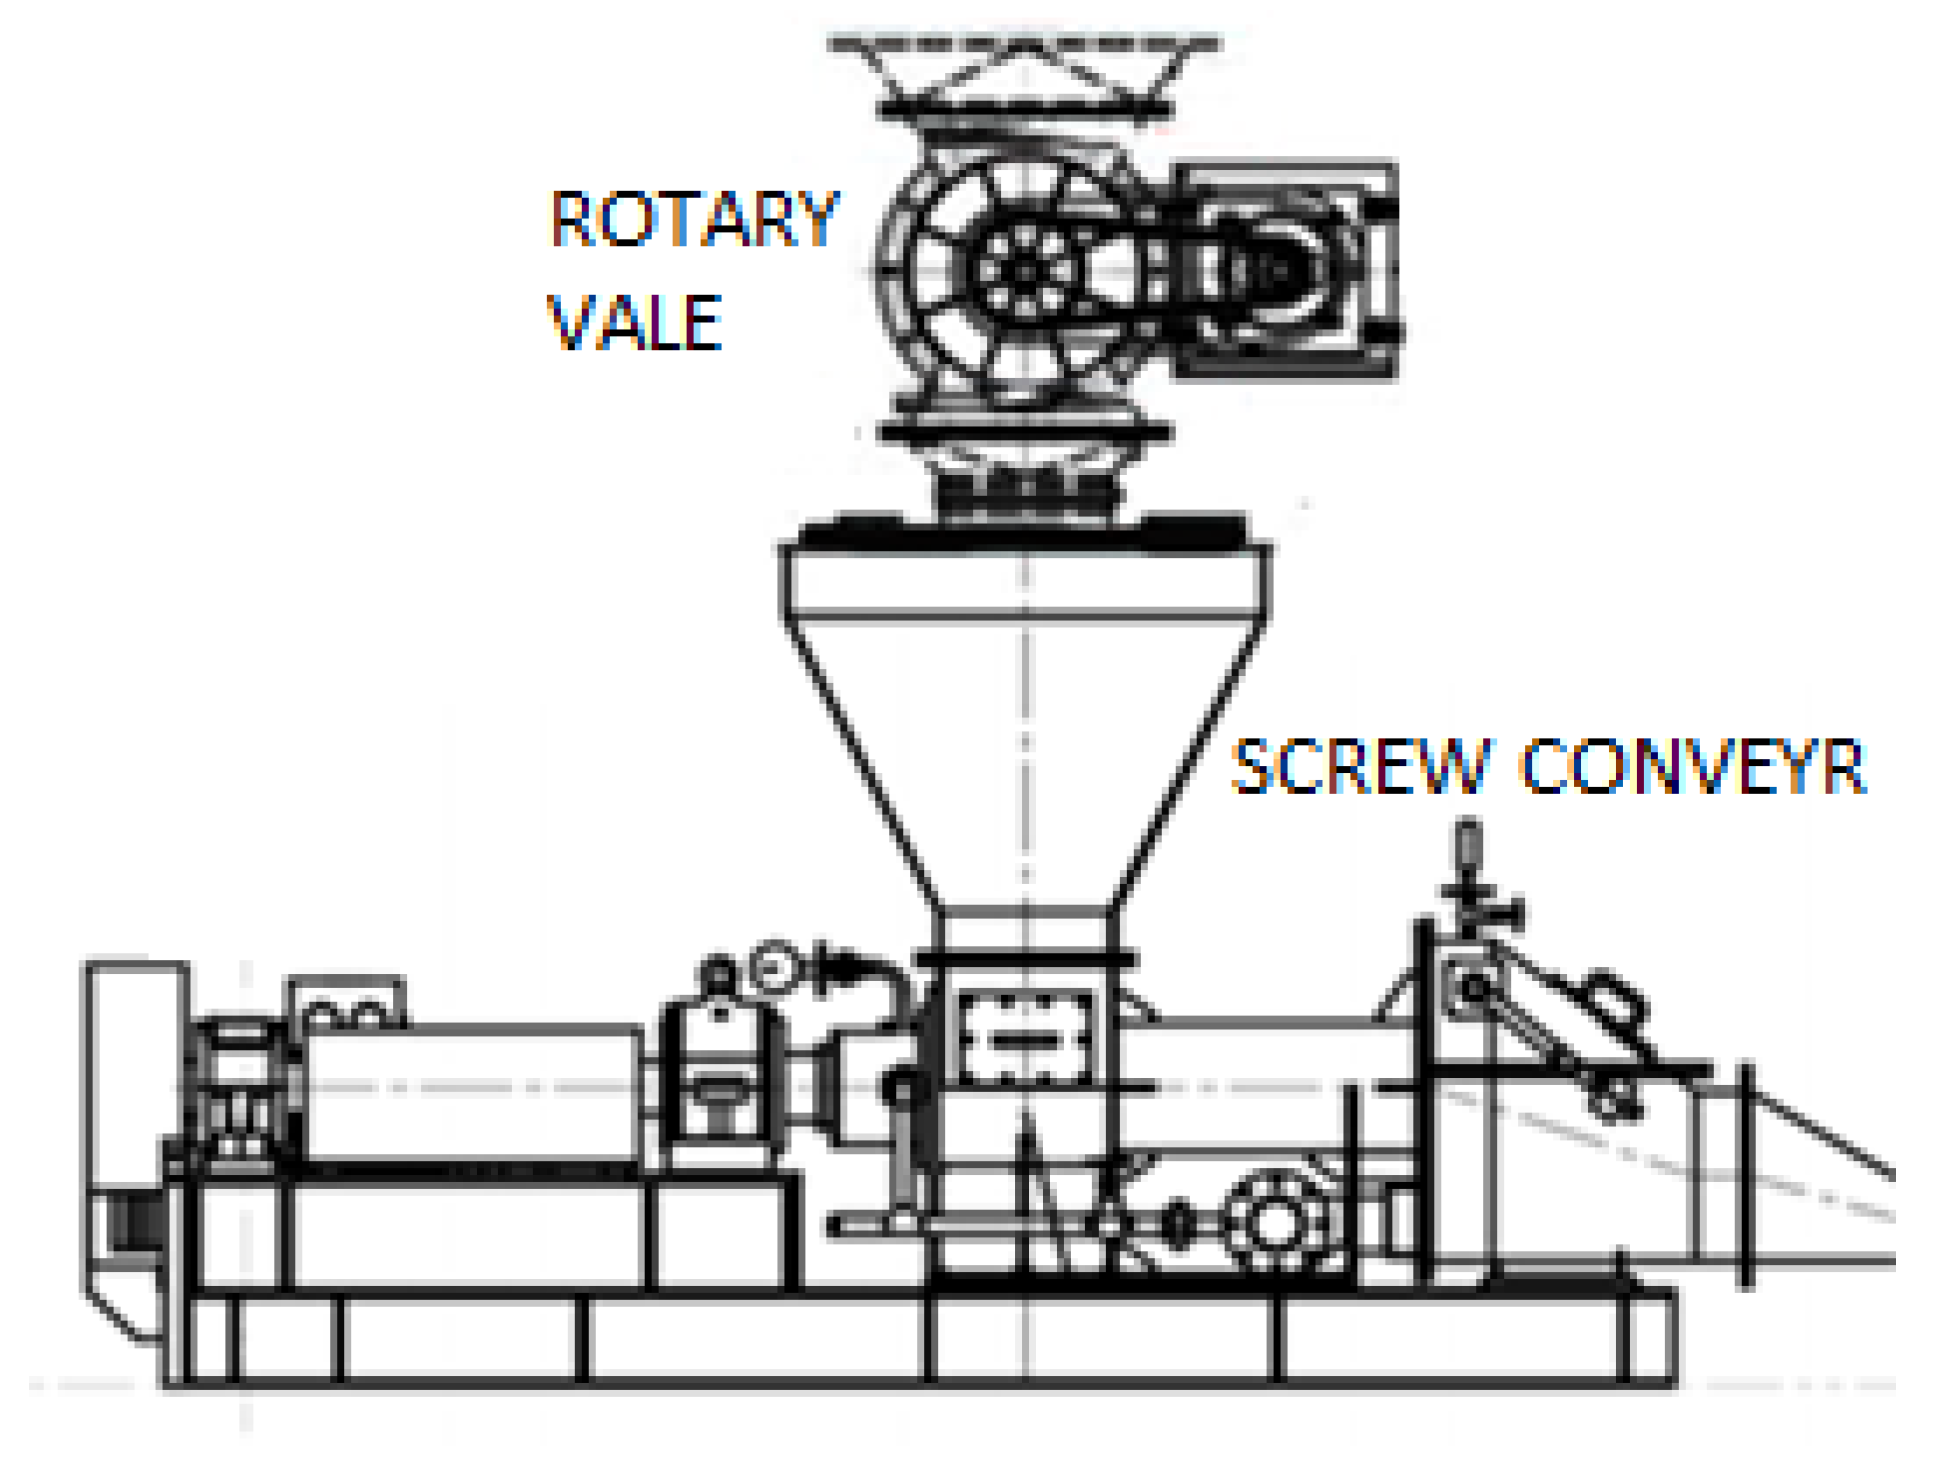
The optimal speed for the screw conveyor is set at 500 rpm, and the screw pitch is measured at 250 mm. The length of the closed screw conveyor feed is established at twice the screw pitch, equating to 500 mm. This configuration is designed to ensure uniform power distribution, prevent jamming, and apply even pressure at the feed port. Material flow is initiated by a rotary valve with a capacity of approximately 30 kg/s. This process is depicted in detail in Figure 7. In the simulation model, a factory environment was constructed, with a throughput capacity of 30 kg/s.
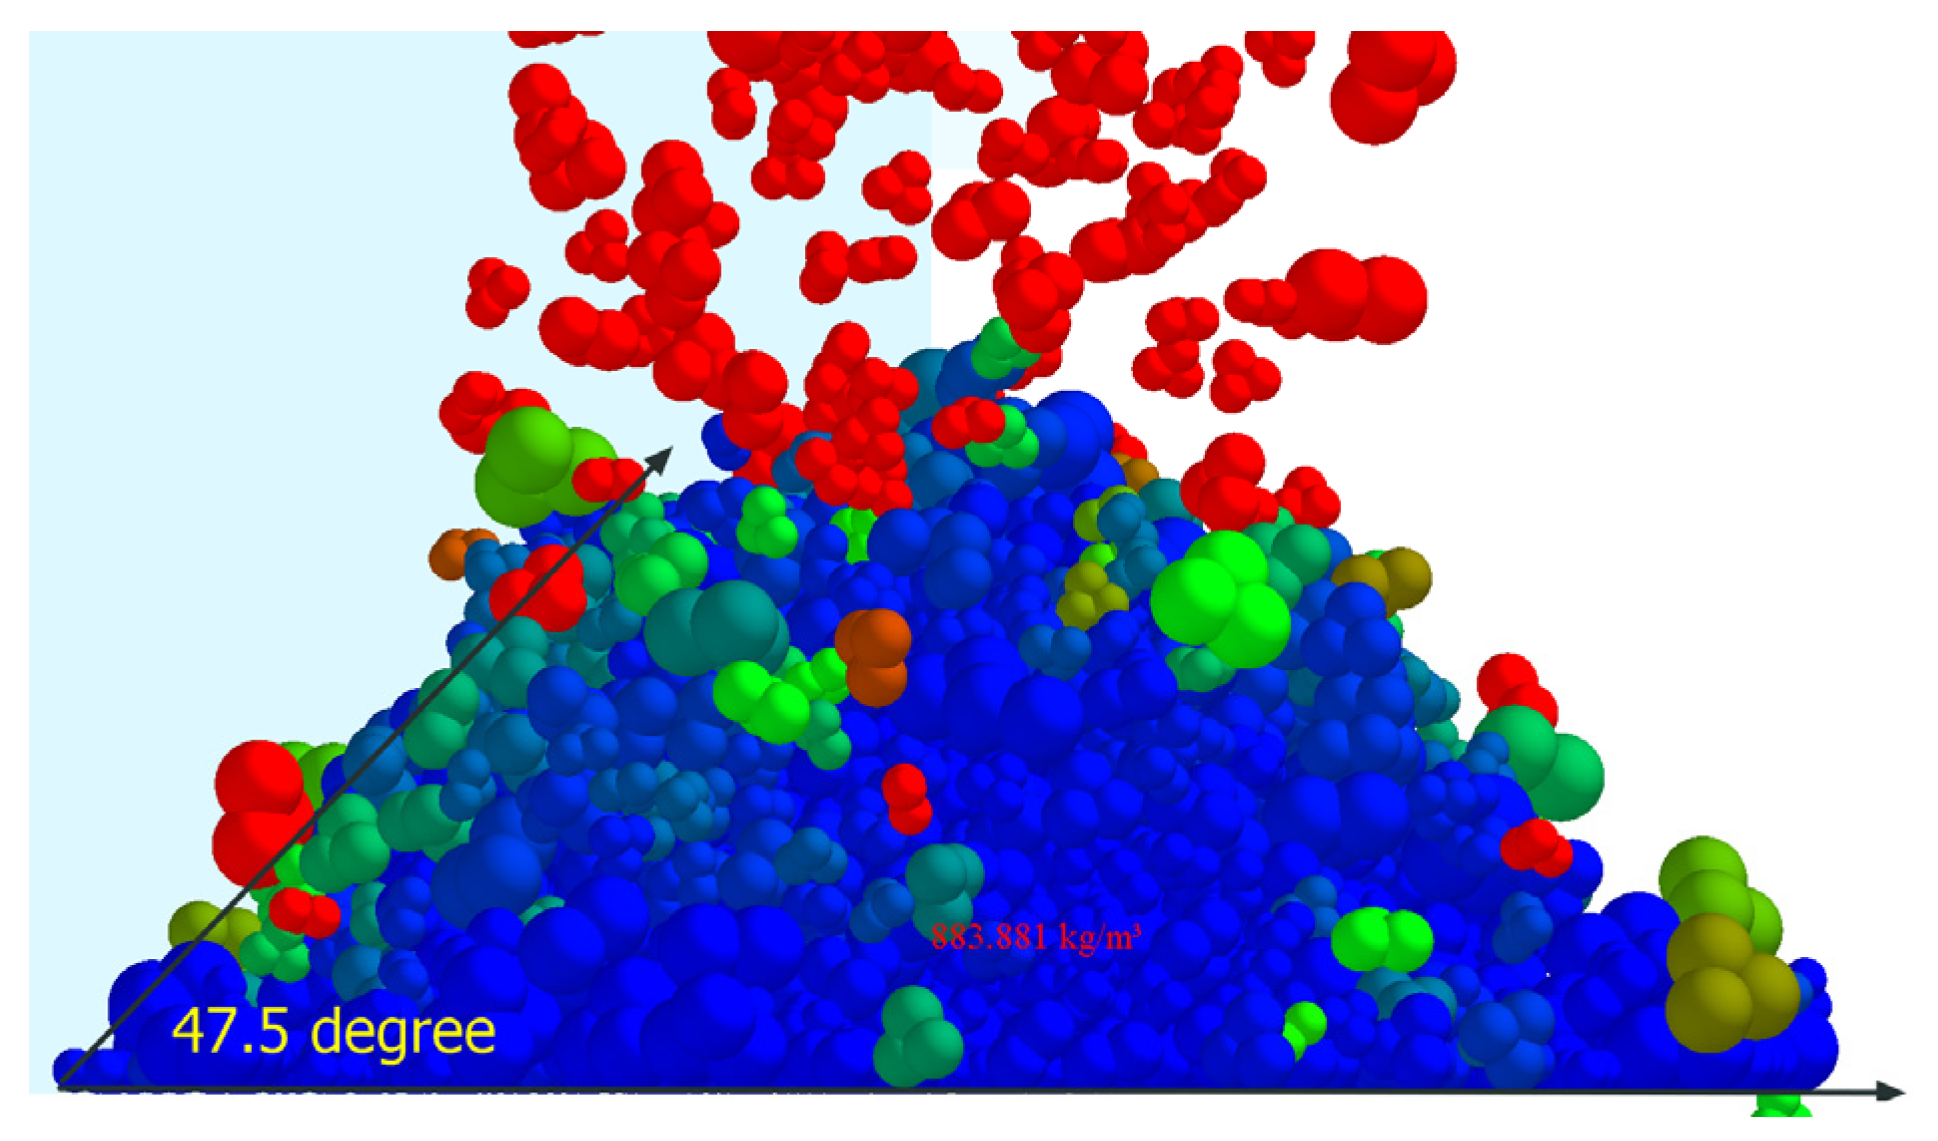
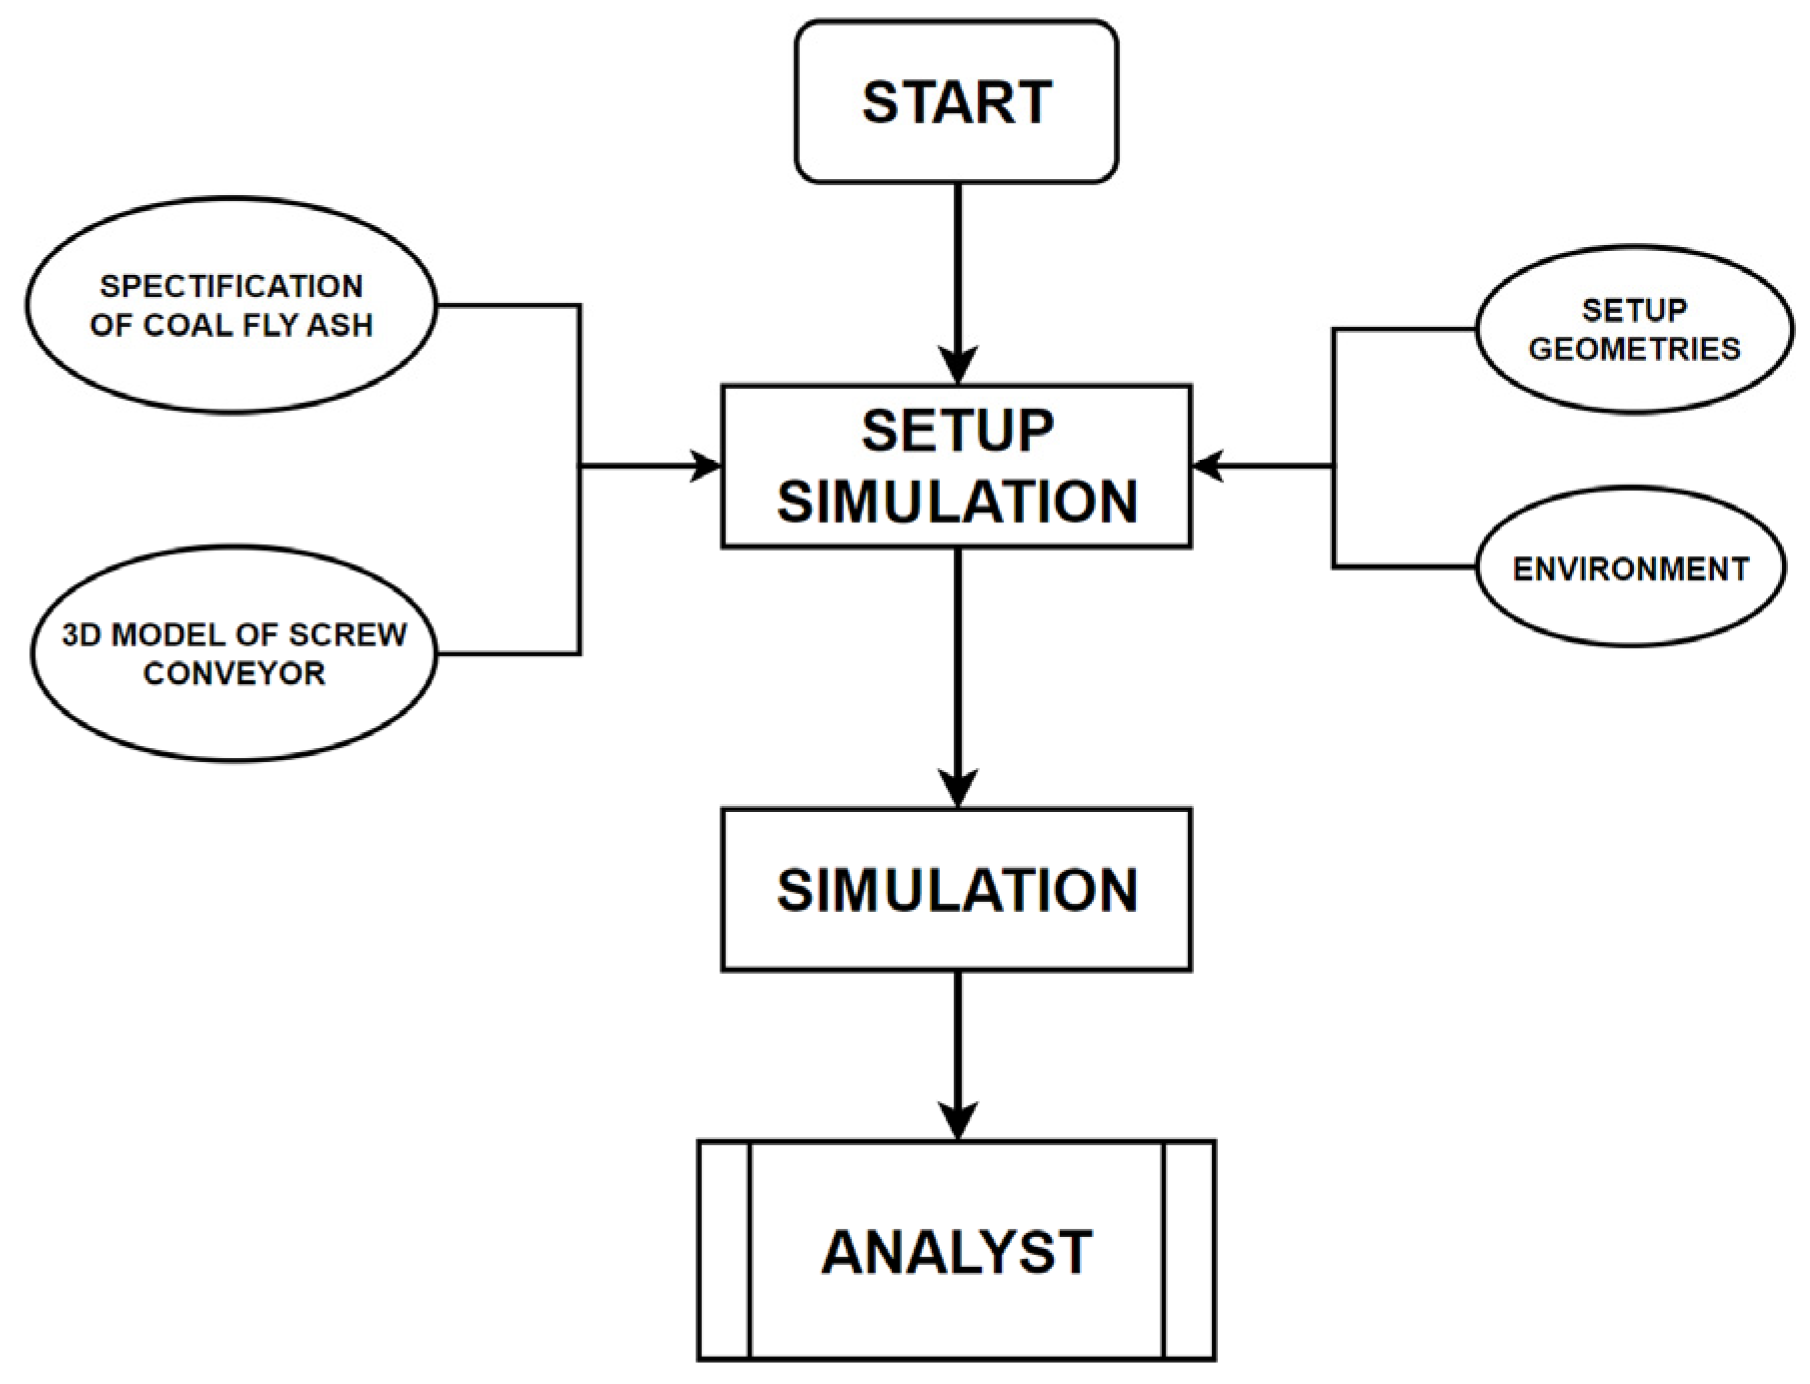
The precision of the physical parameters in this method constitutes a pivotal factor in ensuring the reliability of the simulation outcomes. Consequently, a thorough examination of material properties is imperative. Equally significant is the selection of an appropriate DEM modeling approach [30]. In this study, a calibration of the repose angle was carried out in EDEM using the material model depicted in Figure 8 and Figure 9. The resulting natural repose angle closely aligns with the material properties outlined in Table 2, measuring 47.5 degrees, as shown in Figure 9. The procedure conducted by the author’s team within the EDEM software is presented in Figure 10.
In this study, material calibration was conducted to assess the static response angle of the fly ash. However, to enhance the accuracy of the simulation, it is advisable to additionally measure the dynamic response angle. This method is thoroughly and precisely analyzed in the study by V.A. Rodriguez et al. [12].
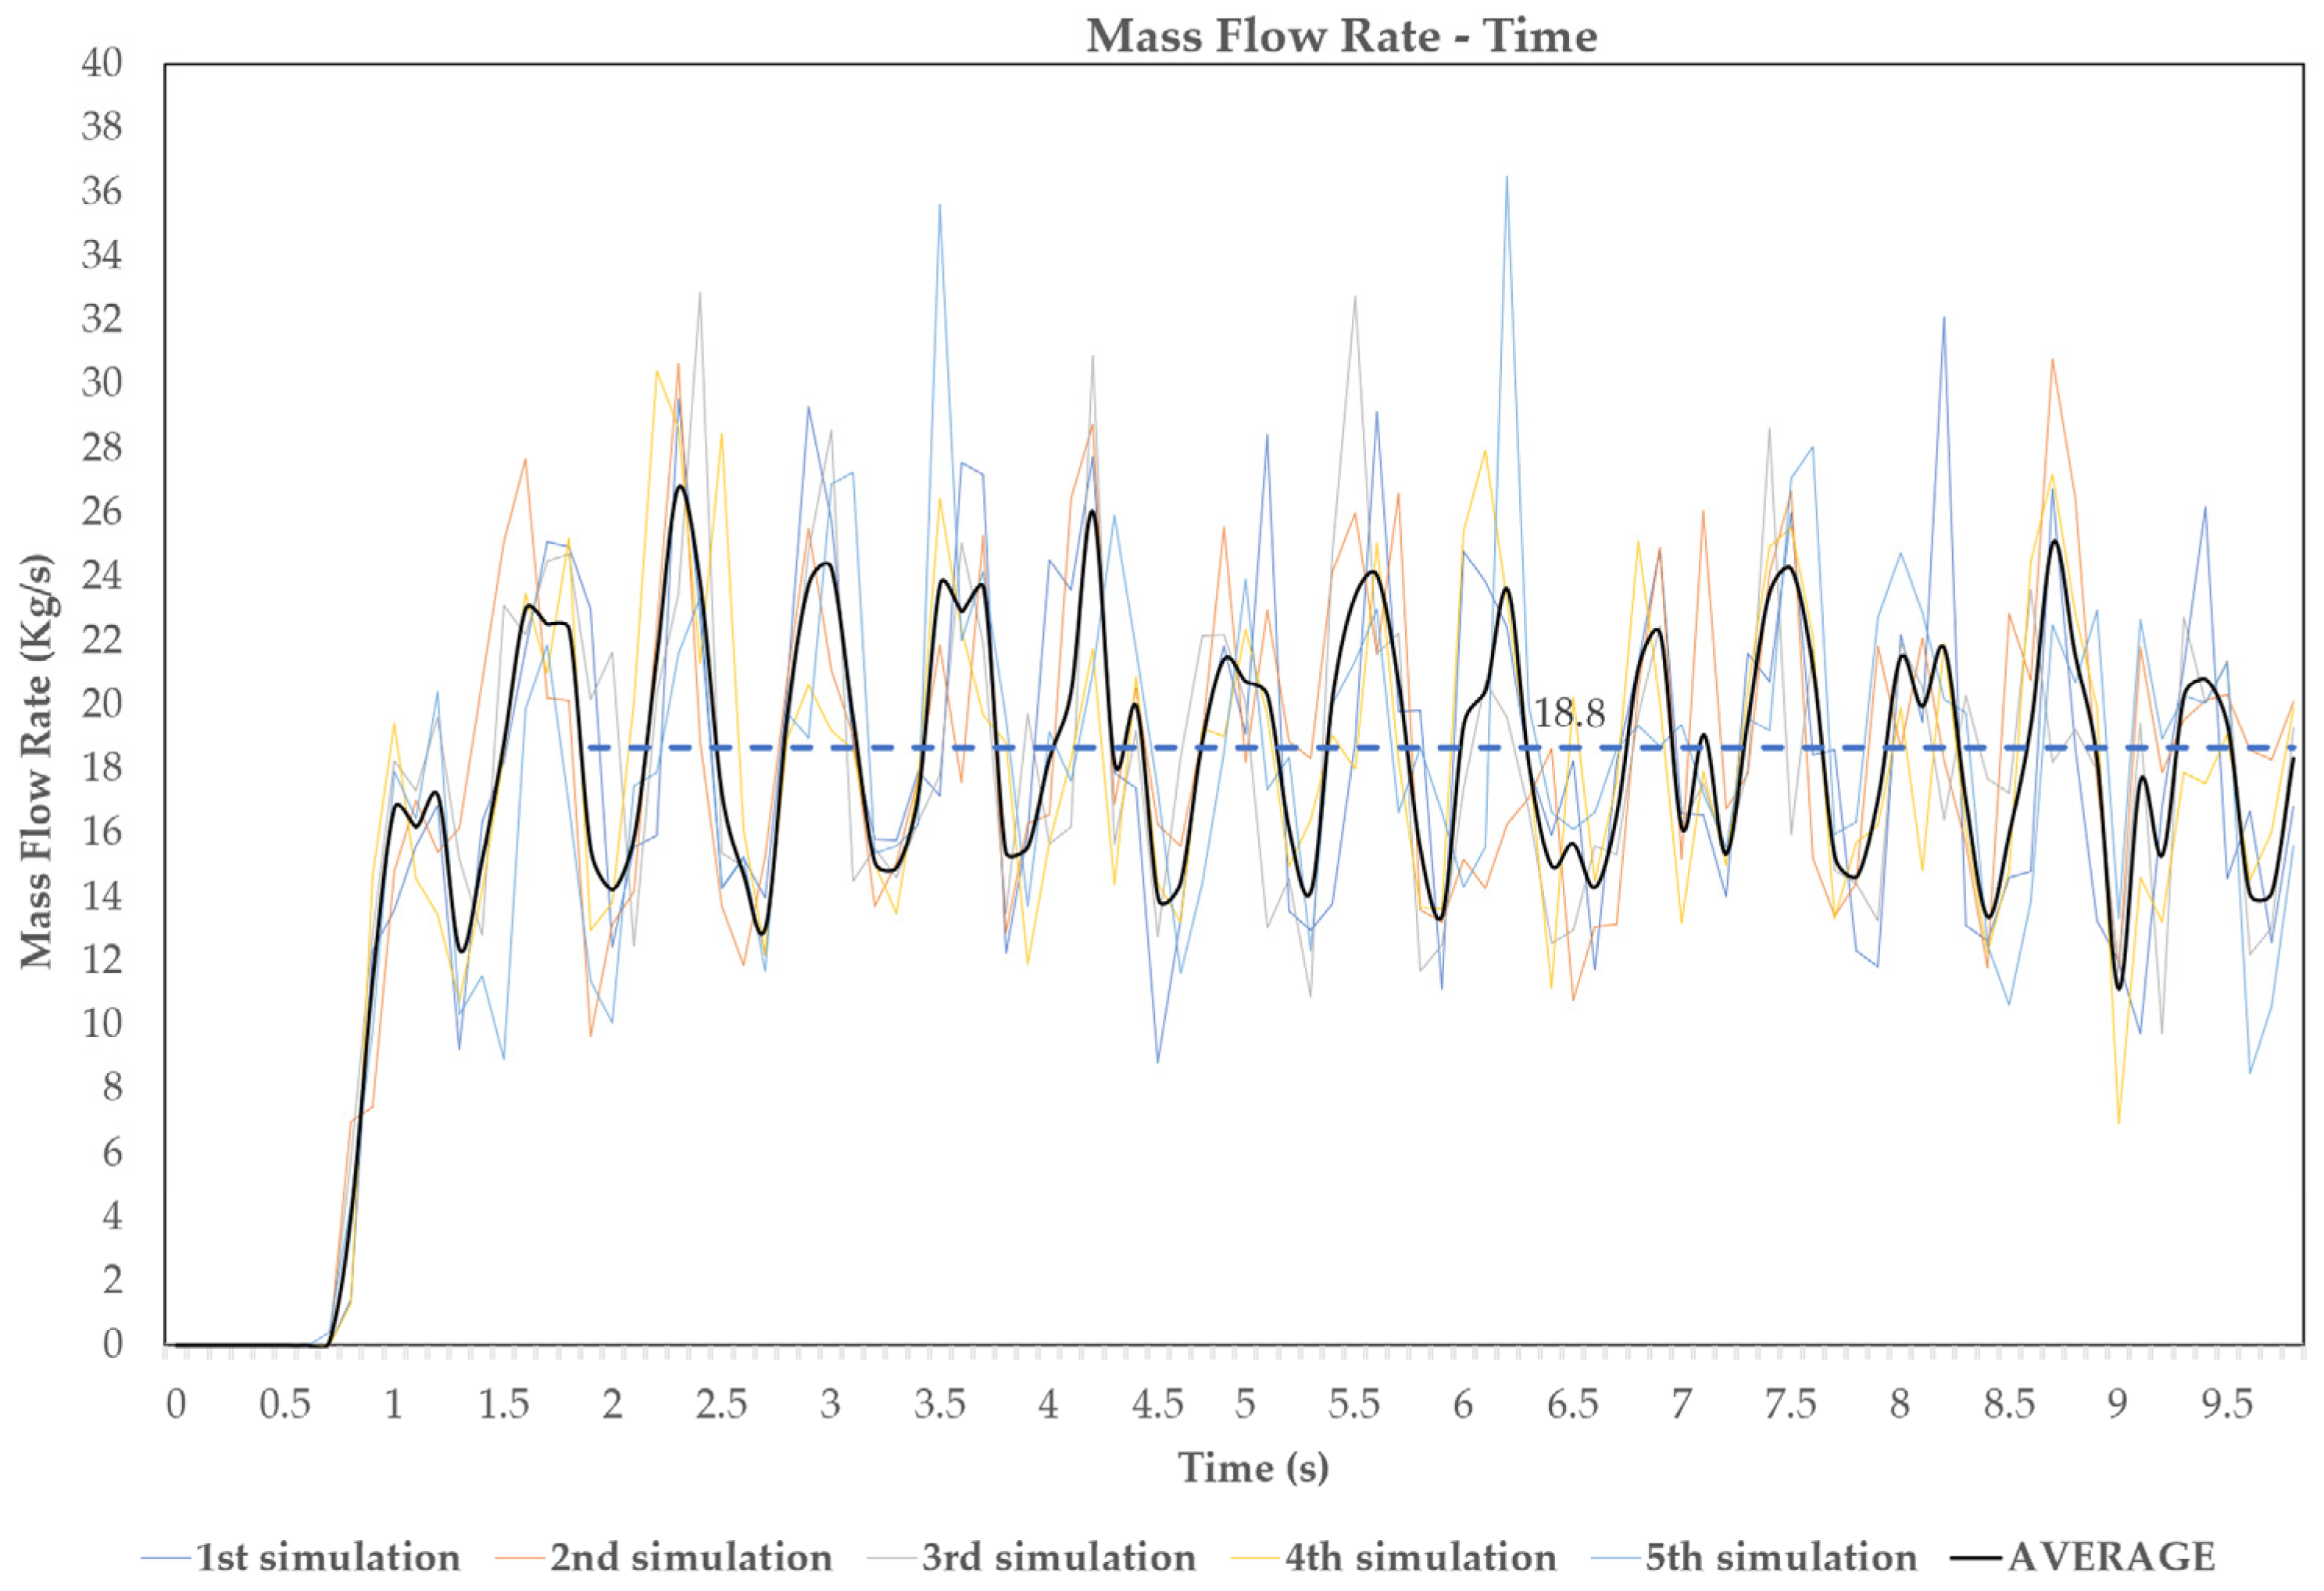
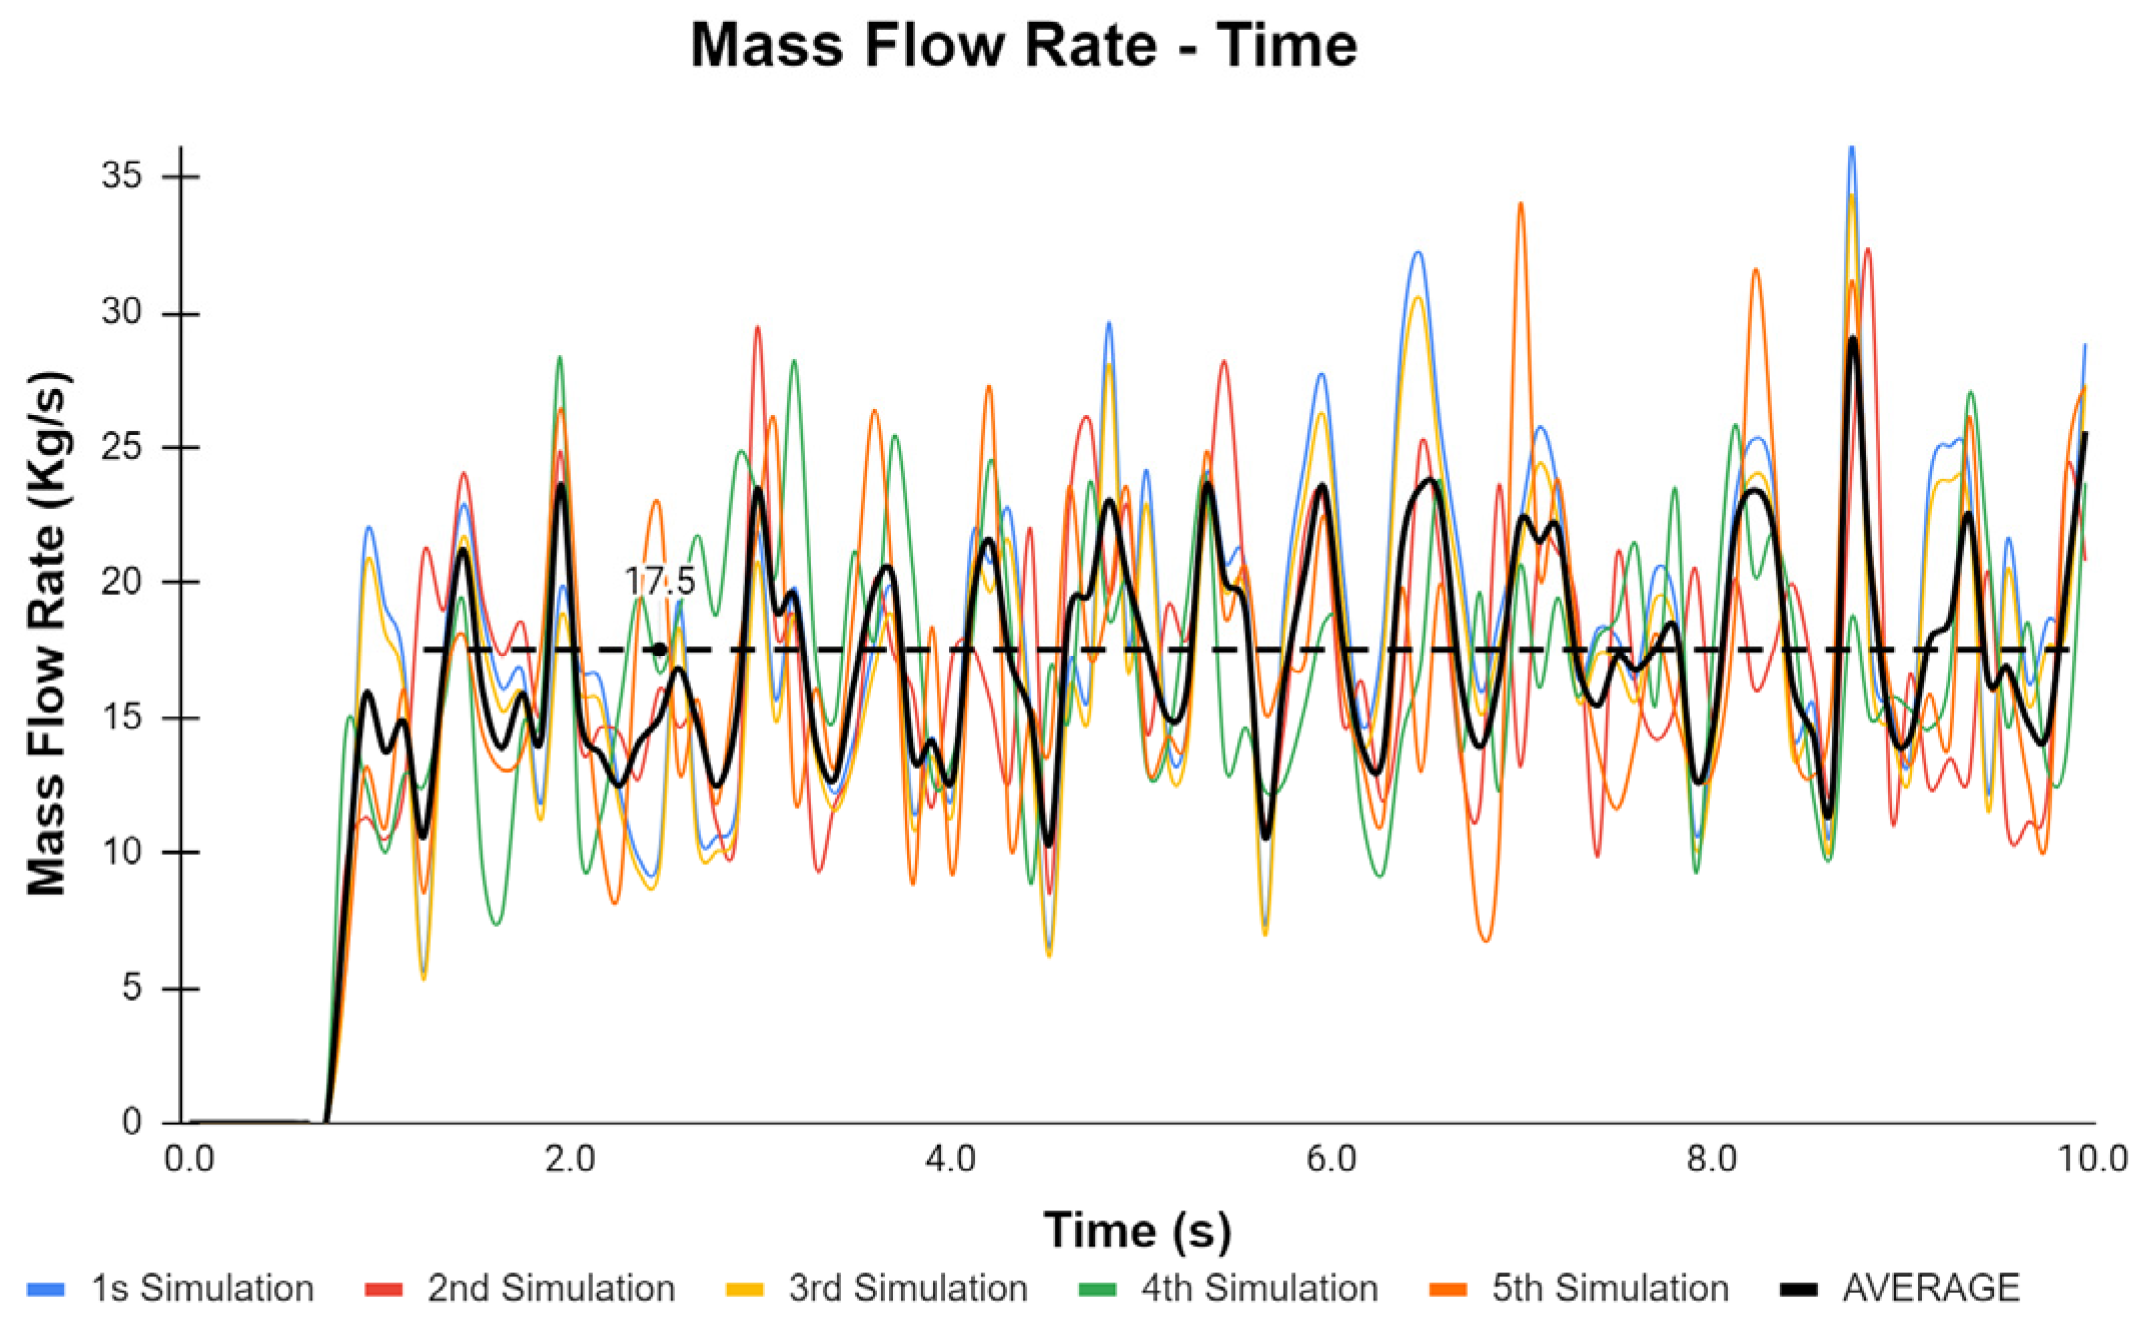
In this study, we have drawn upon findings from various research endeavors on coal fly ash in Vietnam. The material property parameters specific to coal fly ash employed in the simulation are presented in Table 1. At the range of screw conveyor speeds from 100 to 700 rpm, simulations were conducted 5 times to ensure accuracy for each speed. At speed 500, which is the operating speed, the recorded capacity of the screw conveyor averages 18.8 kg per second, which translates to 67.7 tons per hour. The capacity graph for a speed of 500 rpm is depicted in Figure 11.
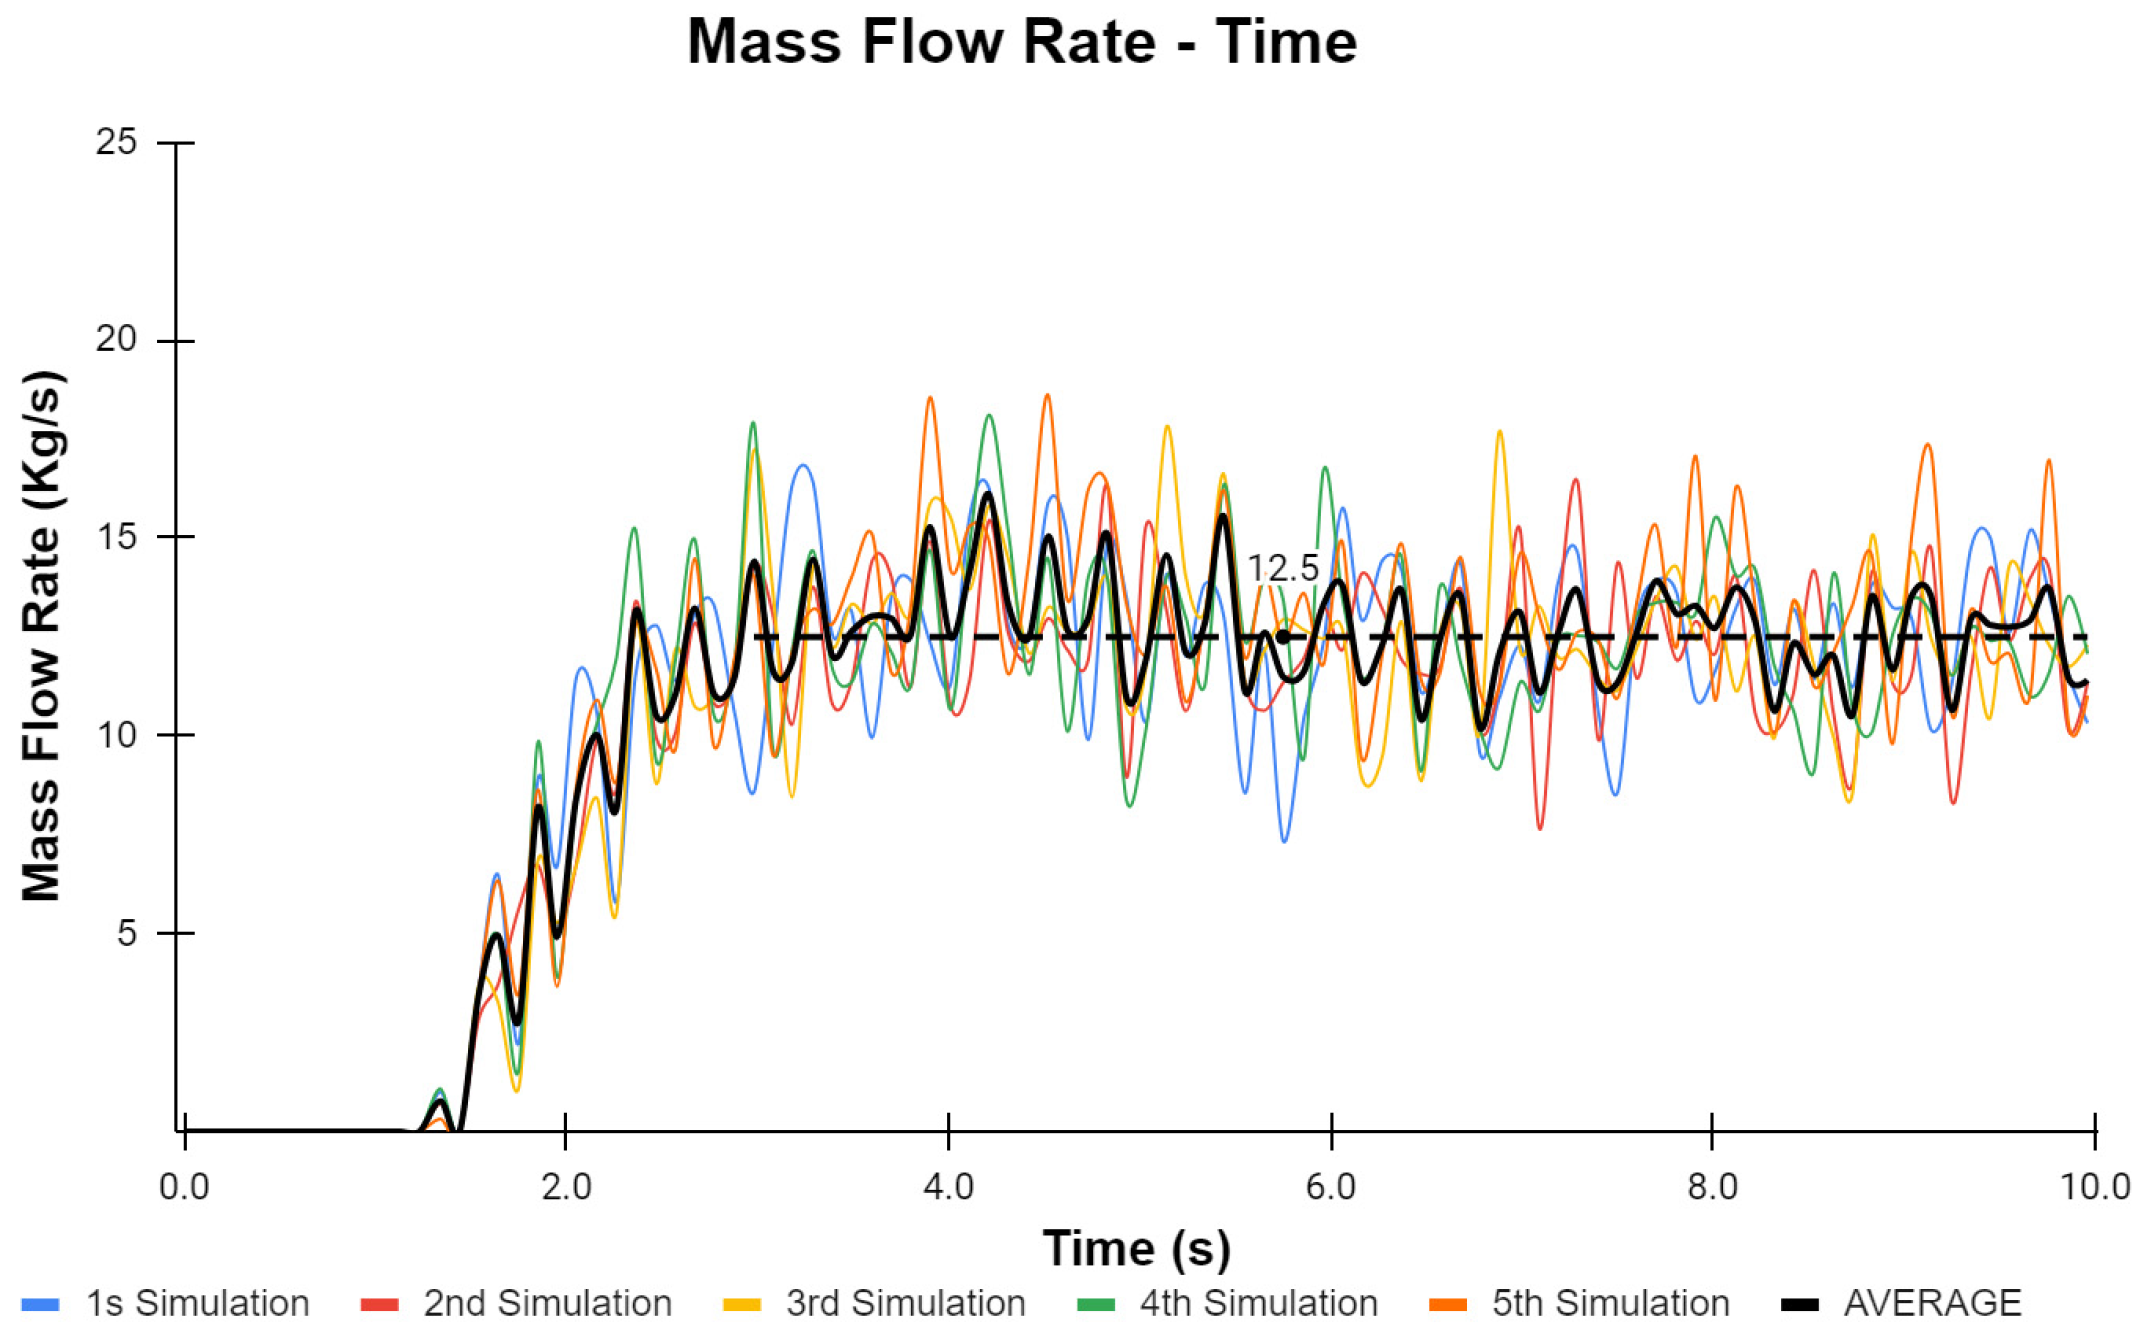
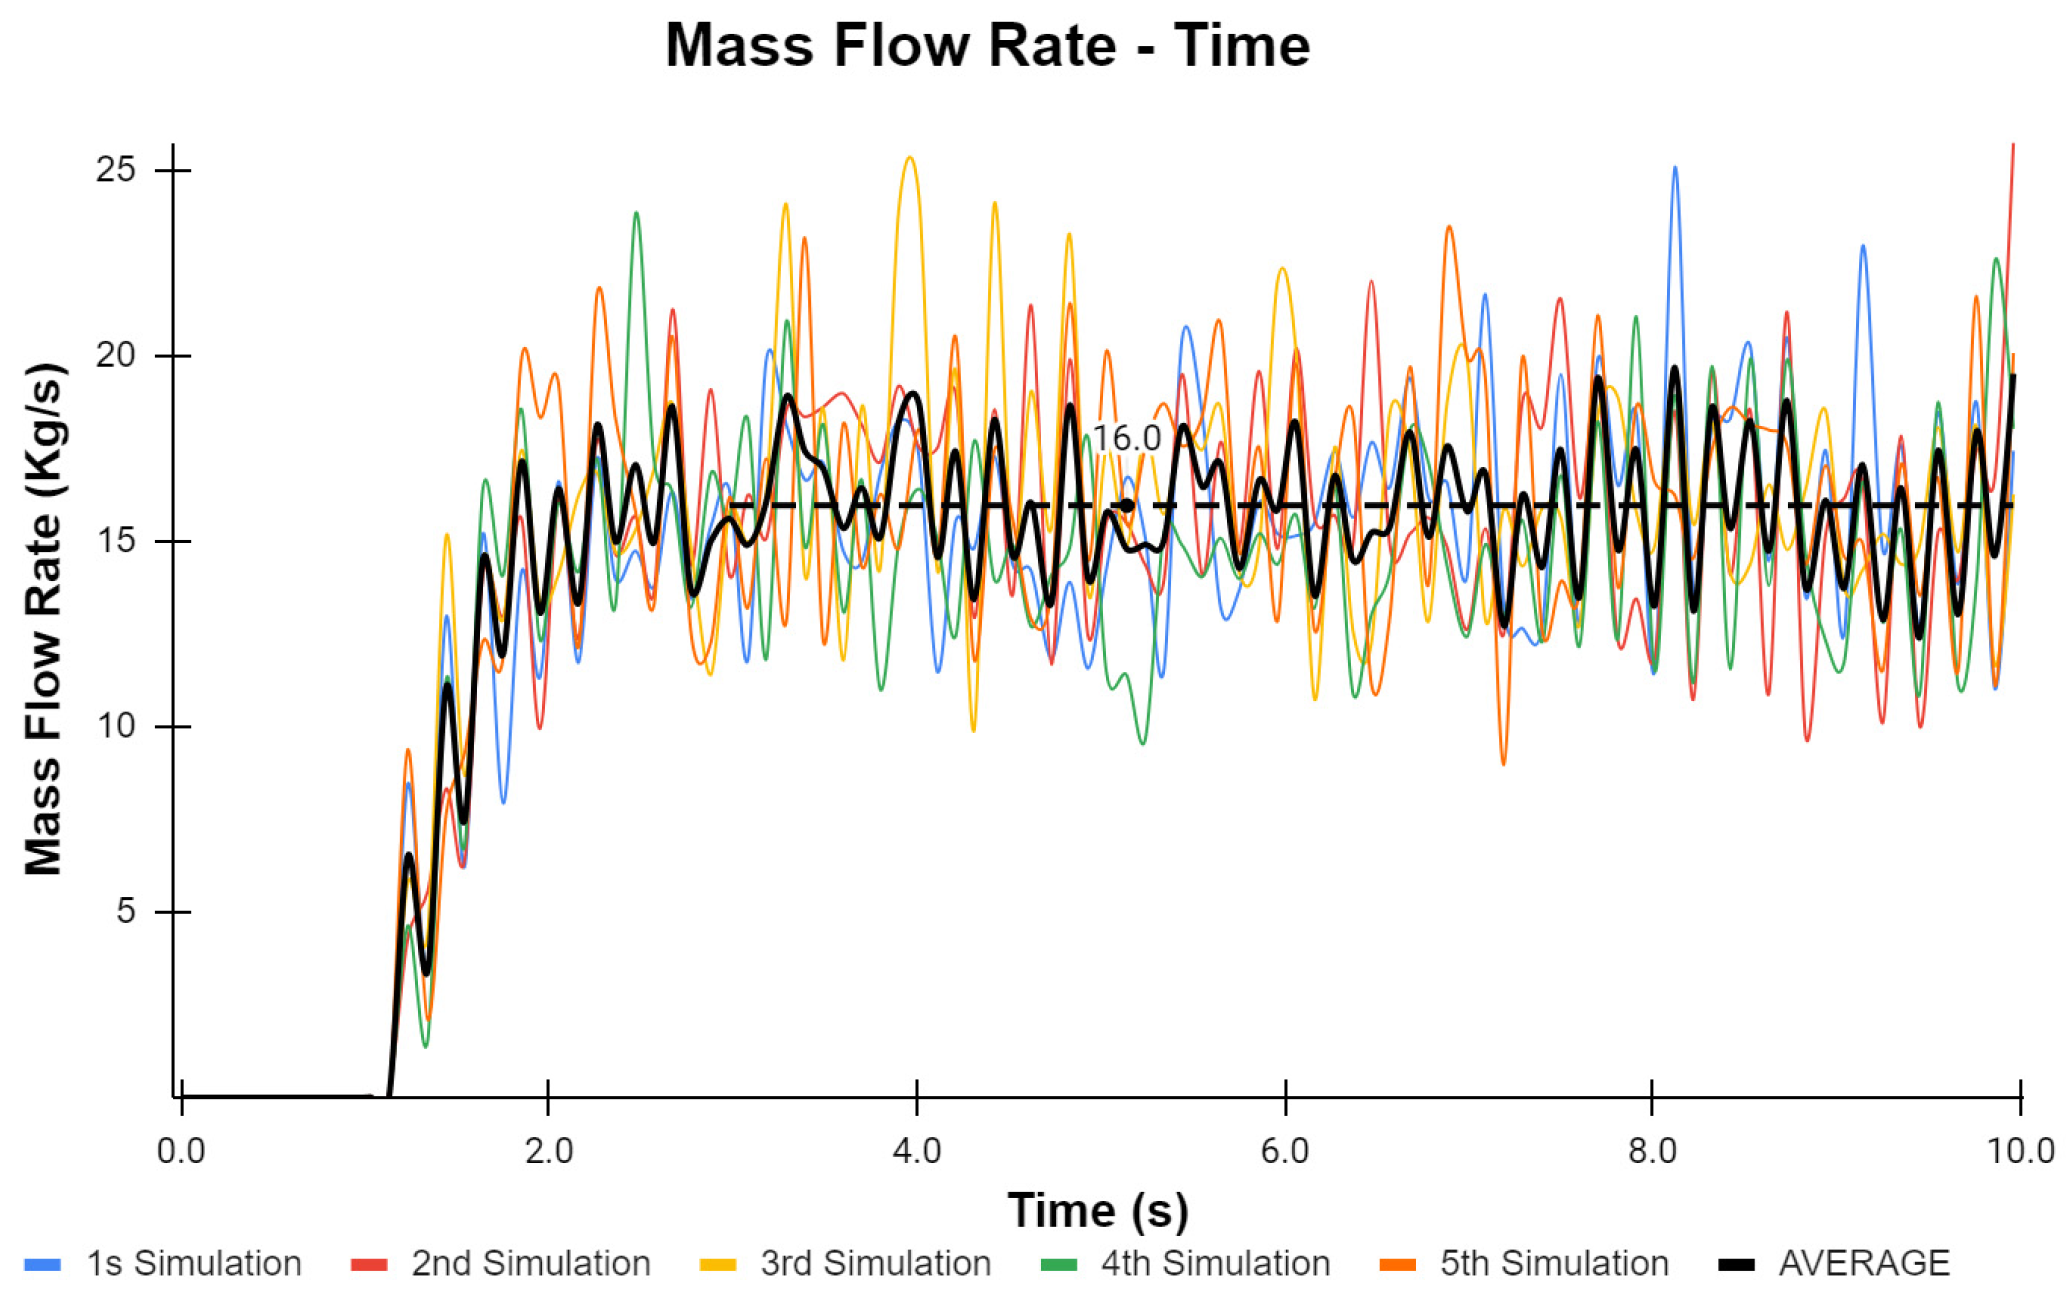
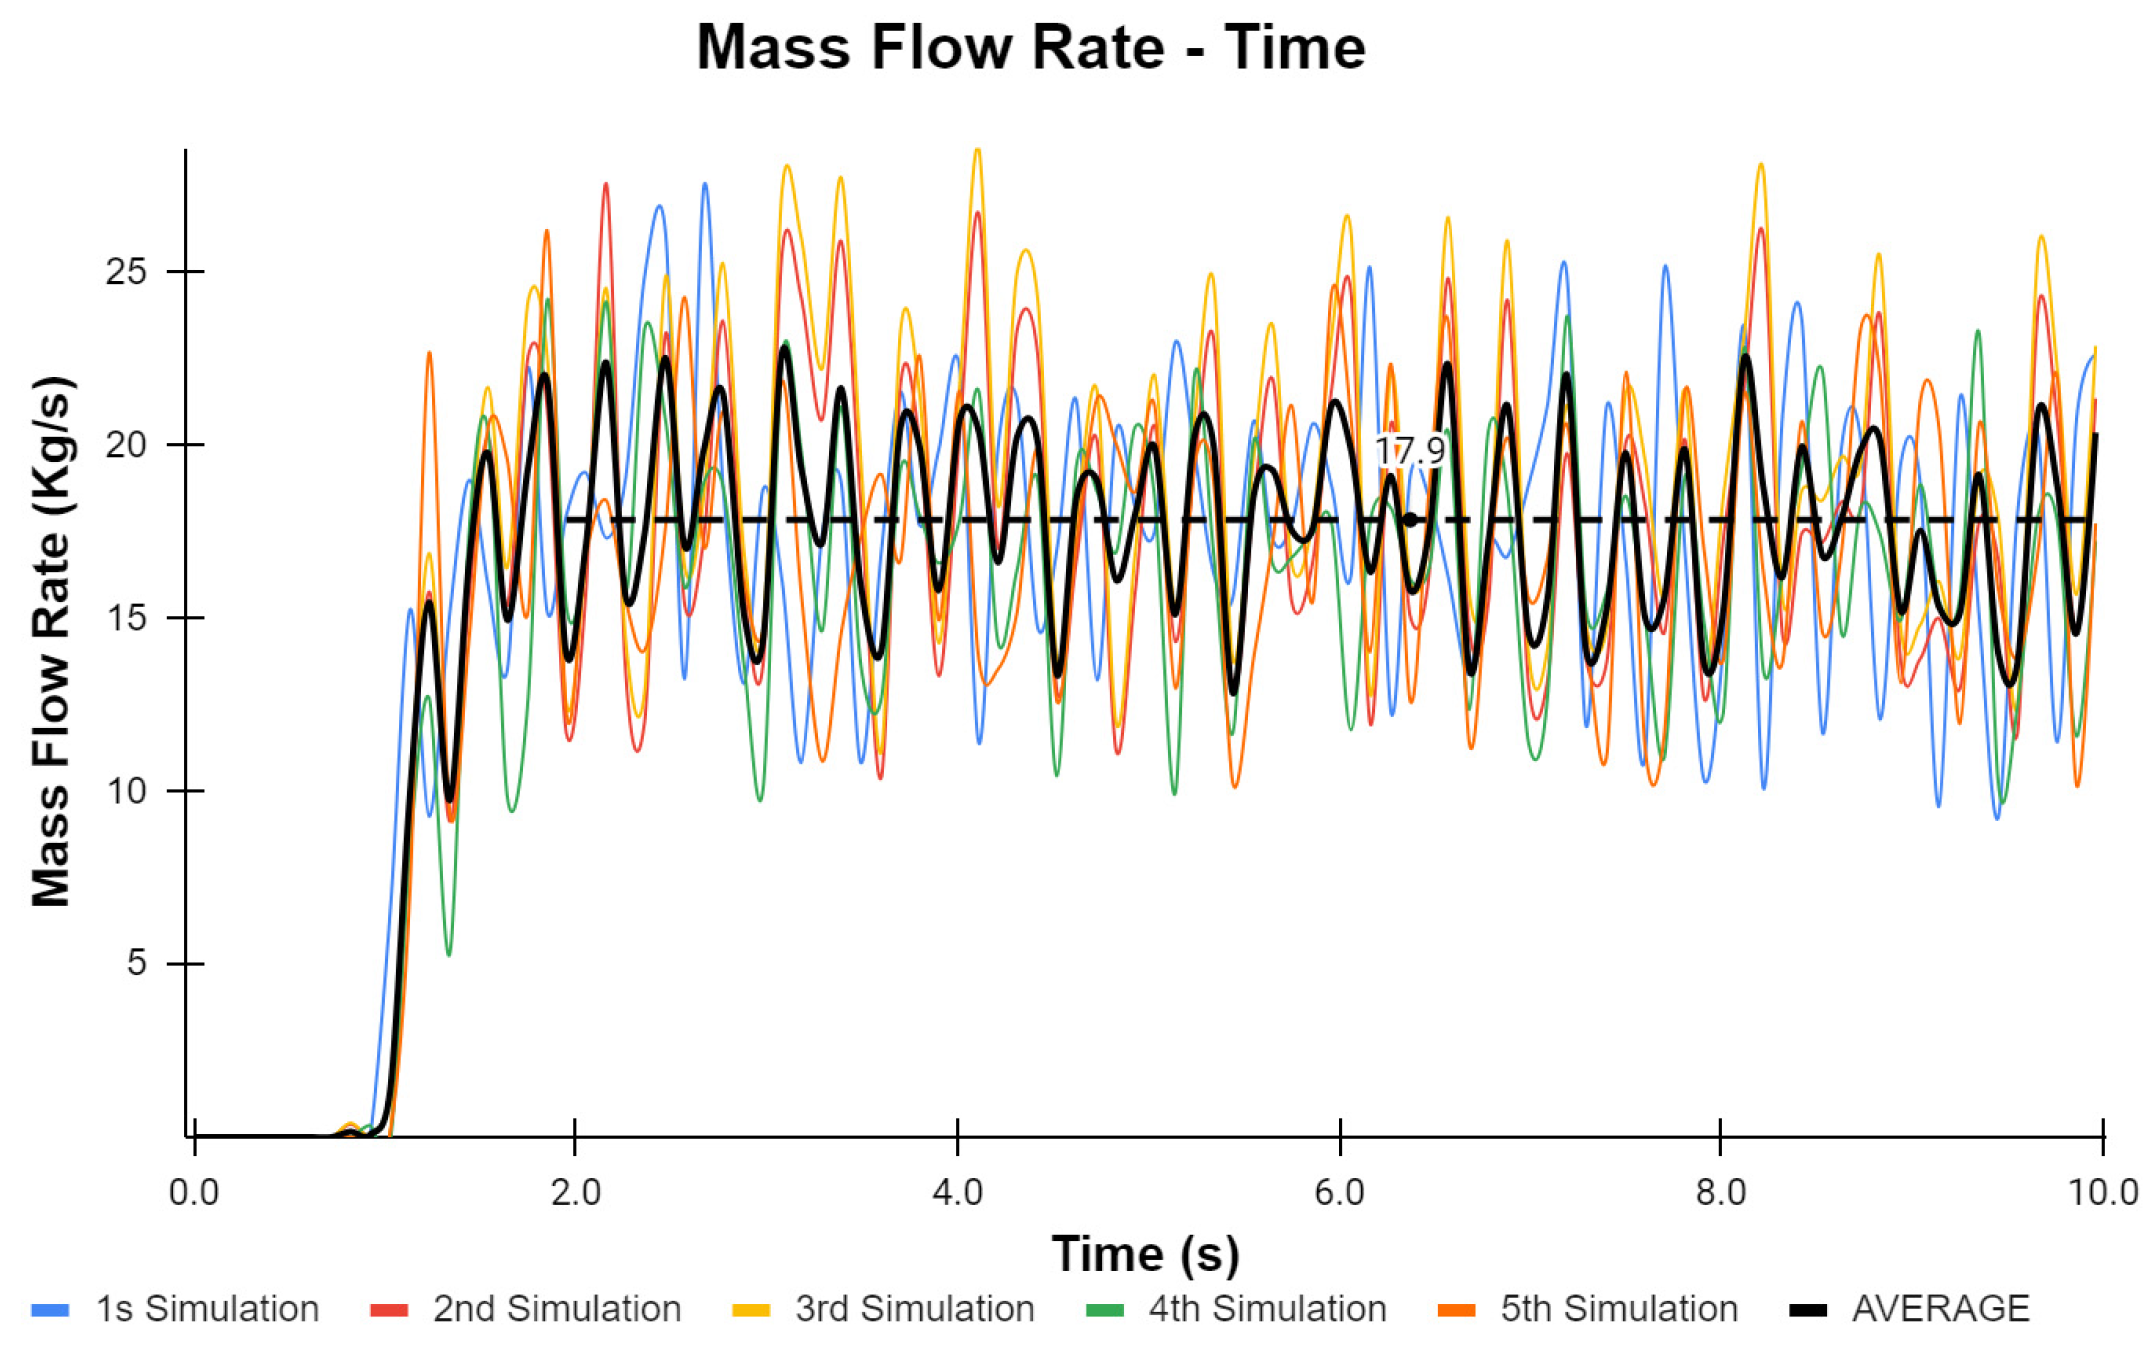
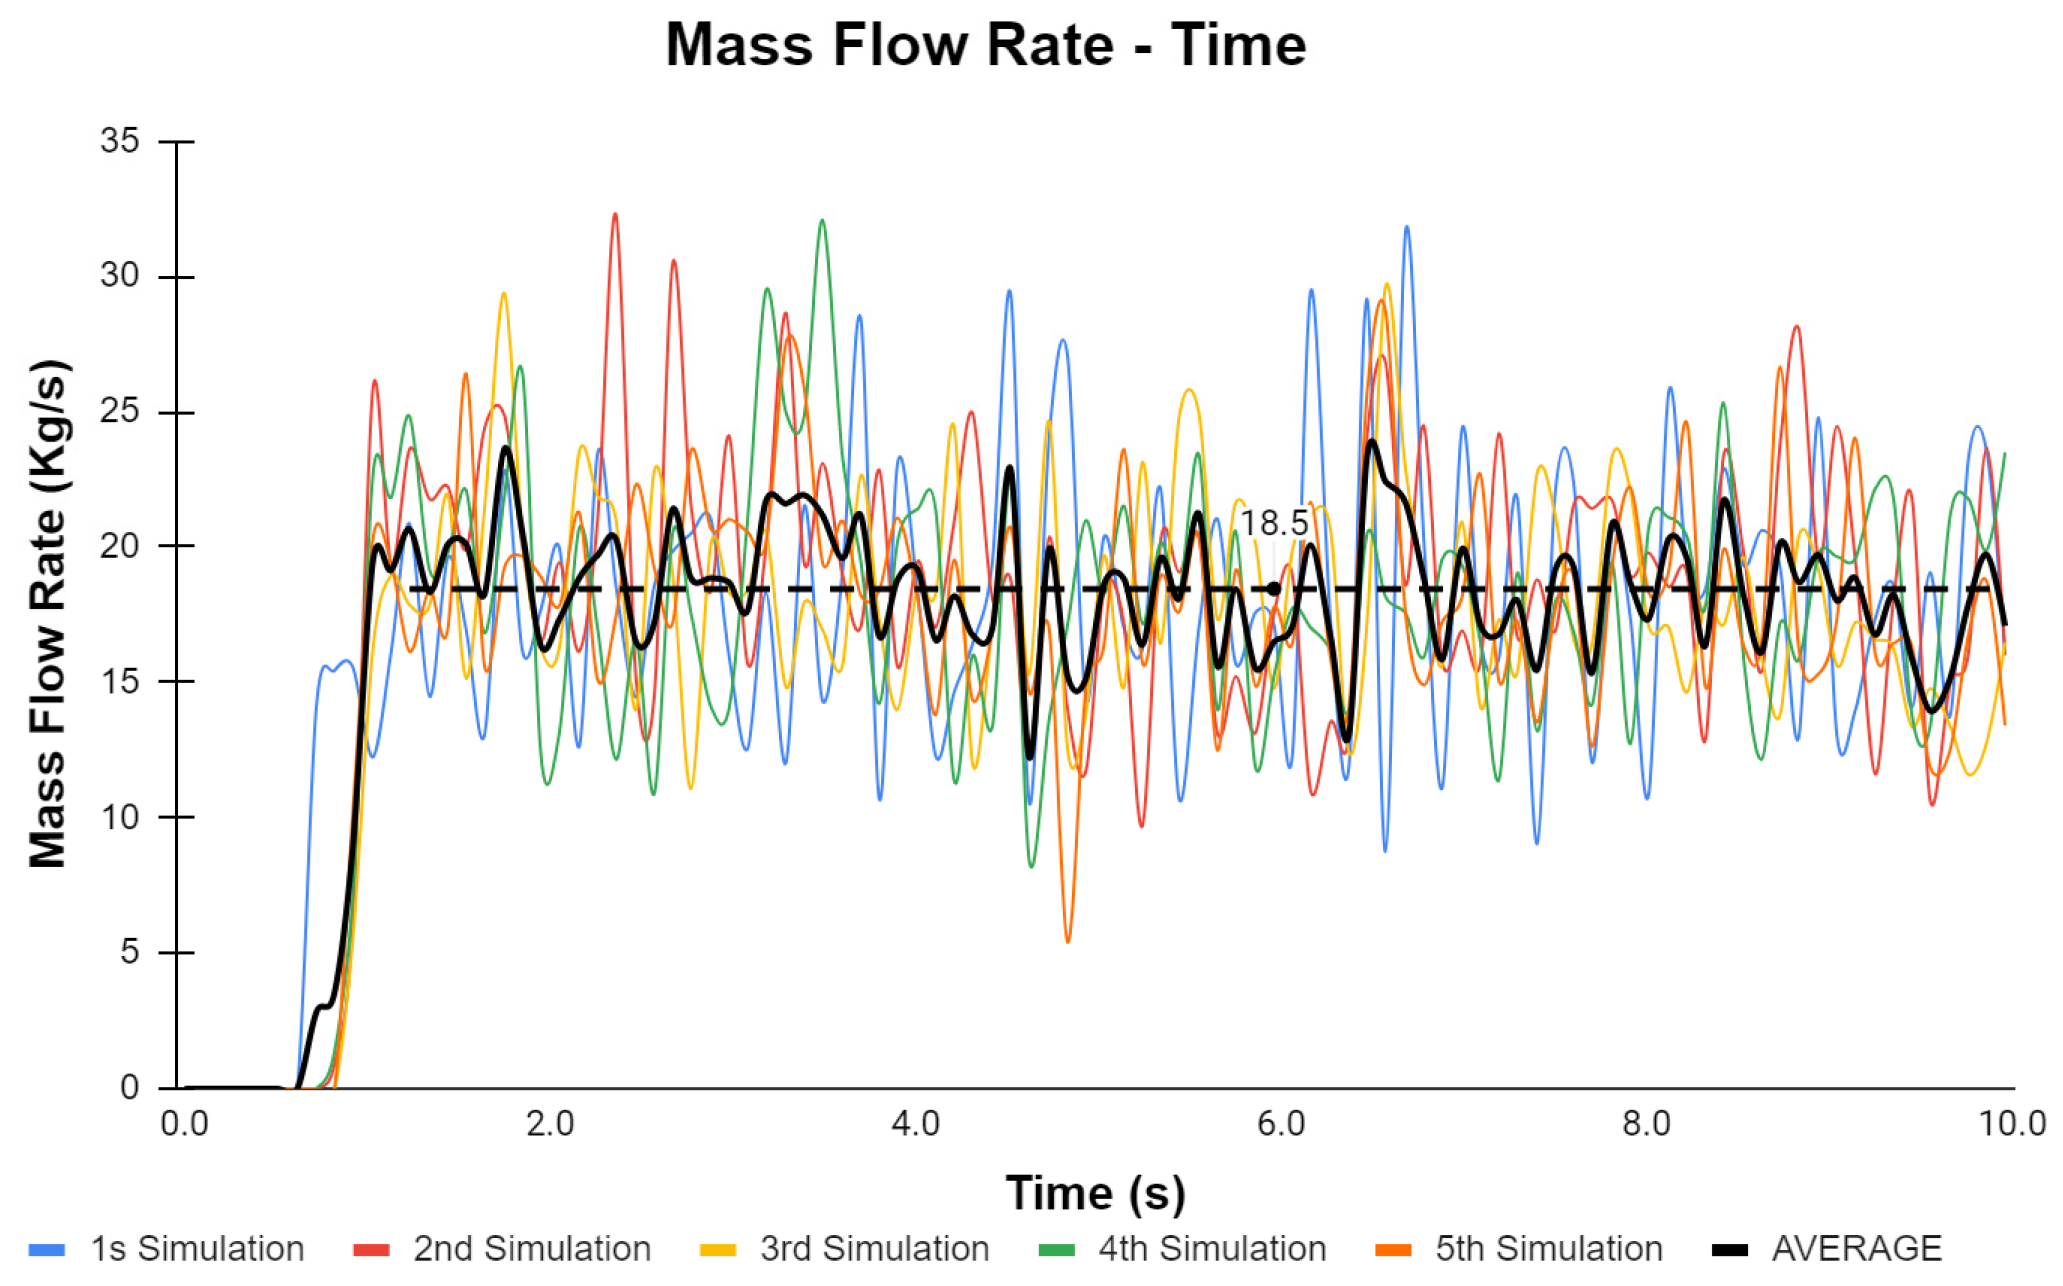
It is evident that from 2 s to 10 s, the screw’s capacity consistently fluctuates around 18.8 kg/s. This demonstrates that the screw conveyor operates in a stable condition. The capacity diagram for the screw conveyor at other speeds is illustrated in Figure 12, Figure 13, Figure 14, Figure 15, Figure 16 and Figure 17.
From Figure 12, Figure 13, Figure 14, Figure 15, Figure 16 and Figure 17, it can be observed that in the lower velocity range, it takes more time to reach a steady state. The mean deviation at speeds of 100 rpm and 200 rpm from the capacity curve is approximately 12.4% and 12.8%, respectively. However, at higher speeds of 600 rpm and 700 rpm, the mean deviation increases to 22.8% and 25.5%, respectively. This indicates that at higher speed ranges, the capacity of the screw conveyor experiences significant fluctuations, possibly due to the complex motion, alterations, and intricate interactions of the fly ash material during the conveying process within the screw conveyor.

3. Results and Discussion

3.1. Created Model Screw Conveyor and Actual Test

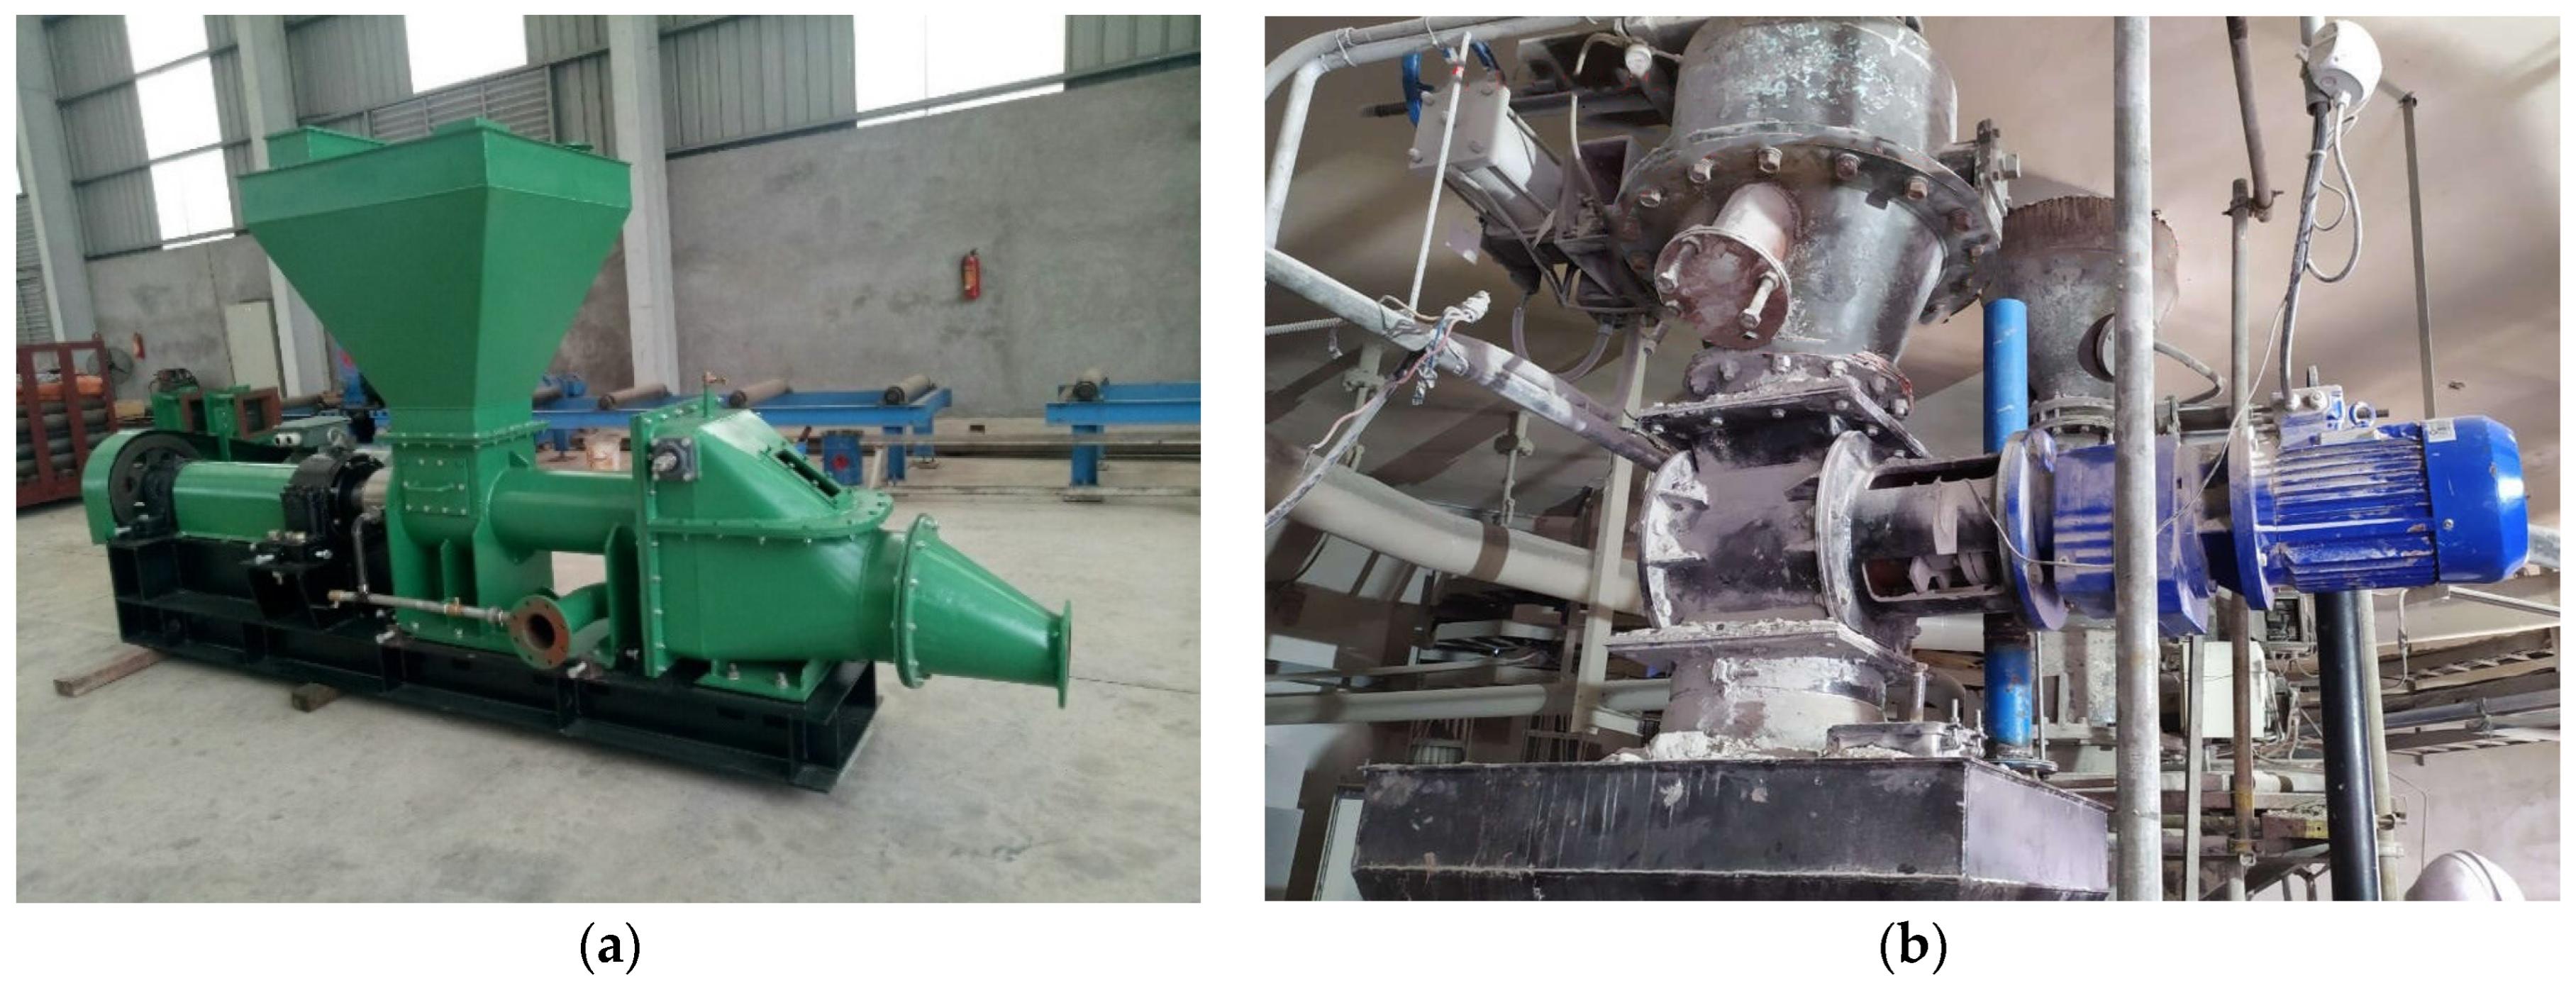
Experimental Method: Fly ash will be fed into the screw conveyor via a rotary valve with a capacity of approximately 30 kg/s. The screw conveyor will be operated at speeds of 300 rpm, 500 rpm, and 700 rpm by adjusting the frequency of the variable frequency drive through the speed sensor of the screw conveyor shaft. The actual testing system is illustrated in Figure 18. The experimental results are recorded and presented in Table 4. As a result of this operation, fly ash will be transported to the end of the screw conveyor at a specific rate. The output of fly ash will be directed into a silo with a total volume of 35 m3. The time taken to completely fill the silo was recorded and is presented in the table below.
This method allows for the practical evaluation of the screw conveyor’s performance in handling and transporting fly ash. Based on the data provided in Table 4, the average capacity of the screw conveyor is calculated to be 68.3 ton/hour at the normal operating speed of 500 rpm. Similarly, at speeds of 300 rpm and 700 rpm, the corresponding average capacities of the screw conveyor are 56.7 ton/hour and 61.5 ton/hour, respectively. These figures provide a clear understanding of the performance of the screw conveyor at different speeds, which is crucial for optimizing its operation and efficiency.

3.2. Capacity Discrepancy: Calculation vs. Actual Test

The material property of fly ash from coal-fired power plants in Vietnam has been determined. These parameters are of great importance in the calculation, simulation, and evaluation of technology and design. A set of general material parameters is provided. The detailed material parameter set is shown in Table 1. The most important properties for research and calculations are the angle of repose, the bulk density and solid density of the material, and the friction coefficients between the material and the equipment. In addition, the size parameters of materials, as well as the distribution ratio of materials, should also be considered.
The fast calculation tool based on the Roberts theory is well suited for the calculation and optimization of screw conveyors for the rapid identification of parameters with good accuracy. The simulation model in the EDEM software fully reflects the operation of the screw conveyor, the operation of the material particles, higher capacity accuracy, and is close to reality. Table 5 presents a comparison of the capacity between the two methods and the actual model. This comparison provides a clear understanding of the performance and accuracy of each method in relation to the actual model.
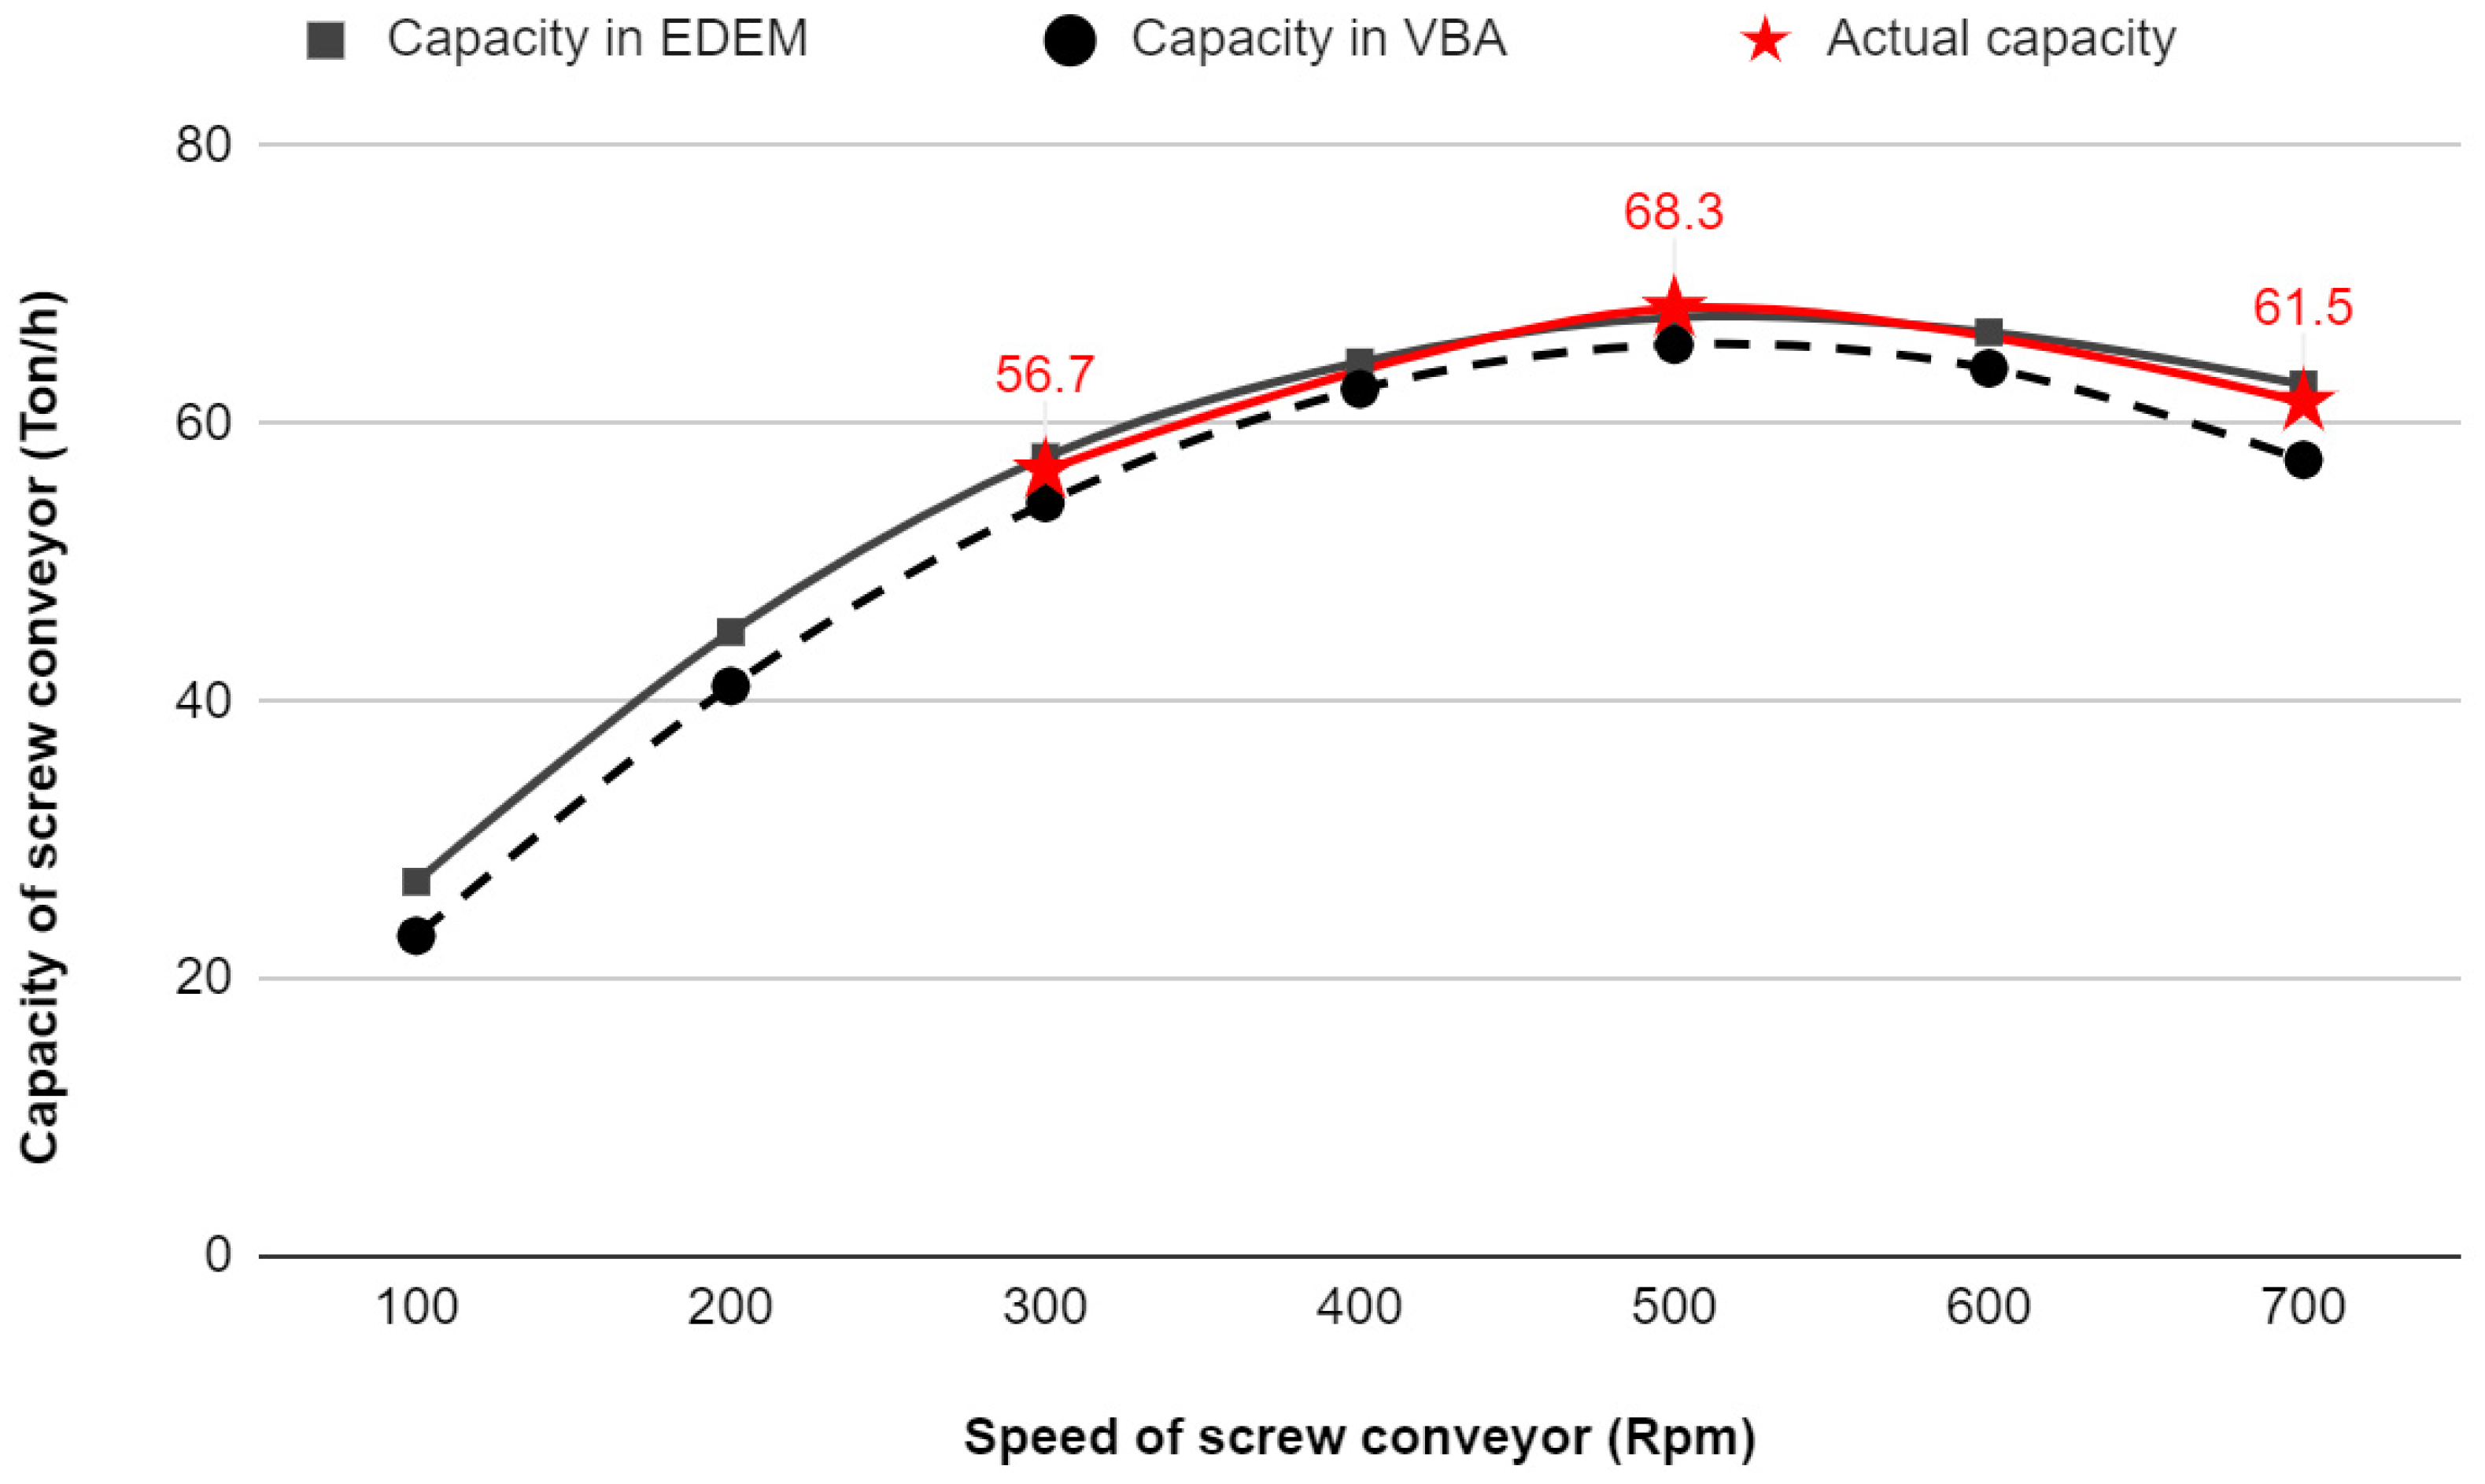
It can be observed that among the screw conveyor speeds of 300 rpm, 500 rpm, and 700 rpm, the results obtained from the quick calculation using the VBA Excel software tool show a minimal error rate at a speed of 500 rpm. Specifically, when compared to the actual values, the error rate is only 3.87%. At speeds of 300 rpm and 700 rpm, the corresponding error rates are 4.17% and 6.74%, respectively. This demonstrates the feasible accuracy and effectiveness of the VBA Excel tool in these calculations. Additionally, the disparity between the simulation and the actual experiment is even lower, at just 0.97%. This level of error is quite small and may be deemed acceptable. The accompanying line chart visually represents the error rate between the two methods. This demonstrates the high level of accuracy achieved through both calculation and simulation approaches.
A comparative study was conducted to assess two methods for calculating the flow of granular materials: a rapid calculation tool and DEM simulation.
As observed in Figure 19, at speeds of 300 rpm, 500 rpm, and 700 rpm, the deviation between the actual capacity and the capacity calculated using the EDEM method is consistently lower compared to the deviation with the VBA method. This suggests that the EDEM method may provide a more accurate estimation of capacity at these speeds. Indeed, while the deviation for the EDEM method ranges from 0.97% to 2.11%, the VBA method consistently exhibits a deviation between 3.87% and 6.74%. At the higher speed of 700 rpm, the deviation of the EDEM method from reality is relatively low, at only 2.11%, whereas the VBA method shows a much higher deviation of 6.74%. The discrepancy between the two methods also takes a substantial leap to 8.7%. These results reflect, in part, the accuracy of the employed method and emphasize the need for further research and adjustments to the parameters. However, accepting results with slightly lower accuracy to save time in the initial calculations of the design phase is also a consideration. This discrepancy is attributed to the heightened velocity of granular particles at elevated speeds. Consequently, meticulous consideration of the physical interactions among particles and between particles and the device’s surface is imperative. In particular, when comparing the actual capacity curve with the EDEM-simulated capacity curve, it is observed that at 500 rpm, the actual capacity values are higher. However, the opposite is true at 300 rpm and 700 rpm, but these deviation values are not too high, measuring just under 2.11%. Therefore, it can be seen that the actual capacity curve and the EDEM-simulated capacity curve closely follow each other and have points of intersection. The capacity curve calculated using VBA has not achieved this, but with a relatively small deviation of about 6.74%, it can be completely acceptable in initial calculations, with the advantage of saving time. Figure 19 shows a comparison of the capacity of the screw conveyor using the VBA tool, the EDEM simulation, and the actual test.
The combined application of these two methods enables evaluation across a broader range of speeds, encompassing both low and high speeds, where other conventional screw conveyor calculation methods may fall short. These conventional methods typically excel only within specific speed ranges, angles of inclination, and certain inlet sizes. In contrast, the EDEM method demonstrates superior performance in this context. Traditional methods for calculating screw conveyors often depend on factors such as filling ratio and inclination correction factor, as seen in methods such as the CEMA method or the KWS method. There are also empirical-based methods. The outcomes of these methods frequently produce capacity–speed curves that are linear within a particular speed range or under certain conditions.
The DEM simulation method demonstrates superior accuracy compared to the rapid calculation VBA tool in the case of this screw conveyor. Employing a combined approach encompassing both the rapid calculation VBA tool and EDEM simulation software emerges as a highly effective strategy for designers, manufacturers, and optimizers. This integrated methodology not only enhances initial accuracy but also leads to cost reduction during the evaluation phase, particularly when assessed based on the 3D design model. Furthermore, virtual EDEM simulation affords insights into material movement patterns and facilitates the detection of potential design errors.
The capacity curve, contingent on the screw conveyor’s shaft speed, furnishes users with the adaptability to fine-tune capacity parameters. The utilization of both methods comes with distinct advantages and drawbacks. The quick design tool necessitates only fundamental material parameters such as density and friction coefficient between the fly ash and screw conveyor surface. The programmed rules facilitate rapid and smooth calculations, albeit with a trade-off in accuracy. Conversely, employing the EDEM software demands a comprehensive comprehension of material properties, precise material model construction, and longer processing times. On average, each simulation takes approximately 120 to 200 min. If exclusively relying on the EDEM method, optimization becomes more intricate and time intensive. To mitigate execution time in simulating complex systems, omitting stationary material particles can yield up to a 25% reduction in processing time. Additionally, adjustments to material size in the simulation model warrant consideration [11,31]. Despite challenges related to execution time and hardware requirements, coupled with the need for thorough material property research, this method yields highly accurate and practical results.
In future research, the impact of various material properties and parameters on the performance and efficiency of mathematical models will be investigated. The exploration of the application of mathematical models for long, flexible screw conveyors or those with specific load requirements and lightweight frames is also being considered for future research endeavors.
In this paper, data on the properties of fly ash in Vietnam, sourced from literature, was utilized. It is important to note that this approach may still introduce some discrepancies in the results. Conducting comprehensive experiments on these material properties could potentially lead to more accurate and reliable research outcomes. However, setting up and conducting such experiments would require a significant amount of time and resources. Furthermore, extending the research to apply to different particulate materials such as cement, sand, grains, etc., could be a prospective direction for future studies. Additionally, in-depth studies on various conditions, such as incline angles, changes in screw pitch, and alterations in screw diameter, will be undertaken. Advancing our understanding in this field is essential, as these conditions can significantly impact the accuracy and reliability of the mathematical models, as well as the quality and quantity of the output products.

4. Conclusions

The study concludes with a successful integration of Roberts’s theory with advanced material property identification methods, resulting in the development of a swift and precise optimal calculation program for screw conveyors using Excel VBA. This, combined with the synergy with EDEM software for comprehensive simulation, establishes a powerful tool tailored for designers, technology optimization engineers, and researchers in technological solutions.
Furthermore, the utilization of two distinct methods in calculating and optimizing the capacity of the coal fly ash screw conveyor has been demonstrated. Both methods exhibit their respective strengths and weaknesses, yet they ultimately yield acceptable results. Specifically, the error rates for the optimal calculation program in VBA Excel and EDEM simulation are approximately 7% and 2%, respectively. This difference holds significant implications, especially in applications involving quantification, such as screw conveyors used for weighing purposes.
By elucidating critical material properties crucial for the accurate calculation, optimization, and design of a screw conveyor system, this paper delivers invaluable insights for industry professionals and researchers alike. This foundational knowledge sets the stage for further innovations in material handling and transportation technologies, ultimately contributing to heightened efficiency and productivity across diverse sectors.

Author Contributions

Conceptualization, V.-T.T.; project administration, V.-T.T. and T.-A.B.; supervision, T.-A.B.; funding acquisition: N.-T.B.; methodology: V.-T.T. and T.-A.B.; formal analysis, V.-T.T., T.-A.B. and N.-T.B.; experimental data collection, V.-T.T. and T.-A.B.; writing, V.-T.T. and T.-A.B.; review and editing, T.-A.B. and N.-T.B. All authors have read and agreed to the published version of the manuscript.

Funding

This research received no external funding.

Institutional Review Board Statement

Not applicable.

Informed Consent Statement

Not applicable.

Data Availability Statement

Due to privacy or ethical restrictions, the data presented in this study are available upon request from the corresponding author. The data are not publicly available as they are currently being used under an ongoing project by the authors.

Acknowledgments

The School of Mechanical Engineering, Hanoi University of Science and Technology and Vinh Tan Thermal Power Company are gratefully acknowledged for providing support and conditions to carry out this research. This work was also supported by the Centennial Shibaura Institute of Technology Action for the 100th anniversary of the Shibaura Institute of Technology to enter the top ten Asian Institutes of Technology.

Conflicts of Interest

Author Van-Thien Tran was employed by the company Giaohangtietkiem JSC. The remaining authors declare that the research was conducted in the absence of any commercial or financial relationships that could be construed as a potential conflict of interest.

References

  1. Tan, Y.; Rackl, M.; Yang, W.; Fottner, J.; Meng, W.; Kessler, S. A comparative study on design standards of screw conveyors in China, Germany and the USA—Part I: Theoretical calculation and quantitative analysis. Particuology 2022, 69, 61–76. [Google Scholar] [CrossRef]
  2. Chongchitpaisan, P.; Sudsawat, S. A Review on Screw Conveyors for Bulk Materials in Various Applications. Ladkrabang Eng. J. 2022, 39, 1–13. [Google Scholar]
  3. Roberts, A.W. The influence of granular vortex motion on the volumetric performance of enclosed screw conveyors. Powder Technol. 1999, 104, 56–67. [Google Scholar] [CrossRef]
  4. Gupta, A.K.; Nott, P.R. Analysis of the Flow of Granular Materials through a Screw Conveyor. arXiv 2021, arXiv:2111.13396. [Google Scholar] [CrossRef]
  5. Beakawi Al-Hashemi, H.M.; Baghabra Al-Amoudi, O.S. A review on the angle of repose of granular materials. Powder Technol. 2018, 330, 397–417. [Google Scholar] [CrossRef]
  6. Stoimenov, N.; Ružić, J. Analysis of the particle motion during mechanical alloying using EDEM software. IFAC-Pap. 2019, 52, 462–466. [Google Scholar] [CrossRef]
  7. Mindlin, R.D. Compliance of elastic bodies in contact. J. Appl. Mech. 1949, 16, 259–268. [Google Scholar] [CrossRef]
  8. Faishol, A.; Mulyadi; Widodo, E. Capacity and power analysis on inclined screw conveyor using DEM simulation. J. Energy Mech. Mater. Manuf. Eng. 2023, 8, 1–6. [Google Scholar] [CrossRef]
  9. Yang, W.; Meng, W.; Gao, L.; Tan, Y.; Fottner, J.; Dai, X.; Yao, F.; Yuan, Y.; Sun, X. Analysis of the Screw Flight Wear Model and Wear Regularity of the Bulk Transport in Screw Ship Unloader. Trans. Mech. Eng. 2022, 46, 15–29. [Google Scholar] [CrossRef]
  10. Zhao, R.; Guo, L.; Gao, W.; Xiao, X.; Liu, Y. Structure Optimization Design of Screw Conveyor based on EDEM. J. Phys. Conf. Ser. 2022, 2200, 012002. [Google Scholar] [CrossRef]
  11. Coetzee, C.J. Review: Calibration of the discrete element method. Powder Technol. 2017, 310, 104–142. [Google Scholar] [CrossRef]
  12. Rodriguez, V.A.; Barrios, G.K.P.; Bueno, G.; Tavares, L.M. Coupled DEM-MBD-PRM simulations of high-pressure grinding rolls. Part 1: Calibration and validation in pilot-scale. Miner. Eng. 2022, 177, 107389. [Google Scholar] [CrossRef]
  13. Boslovyak, P.V.; Emelyanova, G.A. Optimization Mathematical Modeling of the Weight of Metal Structure of Suspended Belt Conveyor Linear Section. IFAC-PapersOnLine 2018, 51, 616–619. [Google Scholar] [CrossRef]
  14. Kondrakhin, V.P.; Martyushev, N.V.; Klyuev, R.V.; Sorokova, S.N.; Efremenkov, E.A.; Valuev, D.V.; Mengxu, Q. Mathematical Modeling and Multi-Criteria Optimization of Design Parameters for the Gyratory Crusher. Mathematics 2023, 11, 2345. [Google Scholar] [CrossRef]
  15. Despotović, Ž.V.; Urukalo, D.; Lečić, M.R.; Ćosić, A. Mathematical modeling of resonant linear vibratory conveyor with electromagnetic excitation: Simulations and experimental results. Appl. Math. Model. 2017, 41, 1–24. [Google Scholar] [CrossRef]
  16. Bui, T.-A.; Tran, V.-T. A Study on Designing Screw Conveyors for Granular Materials Based on Numerical Simulation. In Proceedings of the International Conference on Advanced Mechanical Engineering, Automation, and Sustainable Development 2021 (AMAS2021), Ha Long, Vietnam, 4–7 November 2021; Springer: Cham, Switzerland, 2022; pp. 493–498. [Google Scholar]
  17. Lanzerstorfer, C. Chemical and physical characterization of cyclone fly ashes from five grate-fired biomass combustion plants. Carpathian J. Earth Environ. Sci. 2014, 9, 129–135. [Google Scholar]
  18. Tan, Y.; Yu, Y.; Fottner, J.; Kessler, S. Automated measurement of the numerical angle of repose (aMAoR) of biomass particles in EDEM with a novel algorithm. Powder Technol. 2021, 388, 462–473. [Google Scholar] [CrossRef]
  19. Nguyen, M.D.; Trinh, V.C. Coal ash in Vietnam—Deposition and utilization. A feasibility study. Hanoi—Linkop. 1993, 1–46. [Google Scholar]
  20. Duc, D.S. Properties of fly ash from a thermal power plant in Vietnam. Int. J. ChemTech Res. 2014, 6, 2656–2659. [Google Scholar]
  21. Nguyen, T.B.; Nguyen, T.T.; Dinh, H.Q. Research and assessment of the quality of fly ash and high fire slag of thermal power plant and metallurgy plant in VietNam. J. Irrig. Sci. Technol. 2019, 57, 27–39. [Google Scholar]
  22. Bui, T.-A.; Pham, V.-H.; Nguyen, D.-T.; Bui, N.-T. Effectiveness of Lubricants and Fly Ash Additive on Surface Damage Resistance under ASTM Standard Operating Conditions. Coatings 2023, 13, 851. [Google Scholar] [CrossRef]
  23. Bui, T.-A.; Bui, N.-T. Investigating the Impact of Fly-Ash Additive on Viscosity Reduction at Different Temperatures: A Comparative Analysis. Appl. Sci. 2023, 13, 7859. [Google Scholar] [CrossRef]
  24. Gollakota, A.R.K.; Volli, V.; Shu, C.-M. Progressive utilisation prospects of coal fly ash: A review. Sci. Total Environ. 2019, 672, 951–989. [Google Scholar] [CrossRef] [PubMed]
  25. Koh, S.L.; Lim, Y.S.; Morris, S. Potential of Advanced Coal and Gas Combustion Technologies in GHG Emission Reduction in Developing Countries from Technical, Environmental and Economic Perspective. Energy Procedia 2011, 12, 878–885. [Google Scholar] [CrossRef]
  26. Feng, S.; Li, Y. Study on coal fly ash classified by bulk density. J. Phys. Conf. Ser. 2021, 1732, 012127. [Google Scholar] [CrossRef]
  27. Lomboy, G.; Sundararajan, S.; Wang, K. Micro- and macroscale coefficients of friction of cementitious materials. Cem. Concr. Res. 2013, 54, 21–28. [Google Scholar] [CrossRef]
  28. Xie, J.; Dong, M.; Li, S.; Mei, Y.; Shang, Y. An experimental study of fly ash particle oblique impact with stainless surfaces. J. Aerosol Sci. 2018, 123, 27–38. [Google Scholar] [CrossRef]
  29. Kadurumba, C.H.; Enibe, S.O. Kinematics and Dynamic Evaluation of the Screw Conveyor of a Cassava Centrifuge Dewatering Machine. Niger. J. Technol. 2014, 33, 268–274. [Google Scholar] [CrossRef]
  30. Zhang, K.; Yu, W.; Li, D.; Zou, D.; Zhang, S. Measurement and simulation validation of numerical model parameters of fresh concrete. Sci. Eng. Compos. Mater. 2021, 28, 437–452. [Google Scholar] [CrossRef]
  31. Mio, H.; Akashi, M.; Shimosaka, A.; Shirakawa, Y.; Hidaka, J.; Matsuzaki, S. Speed-up of computing time for numerical analysis of particle charging process by using discrete element method. Chem. Eng. Sci. 2009, 64, 1019–1026. [Google Scholar] [CrossRef]
Figure 1. The method for measuring the angle of repose of a bulk material.
Applsci 13 12169 g001
Figure 2. (a) Fly ash particle shape in natural state; (b) fly ash particle shape through scanning electron microscope.
Applsci 13 12169 g002
Figure 3. Specifications of the actual screw conveyor.
Applsci 13 12169 g003
Figure 4. Force acting in a screw conveyor [3]. (a) Forces acting on the bulk material during conveying; (b) A cross section showing the forces acting on a screw conveyor.
Applsci 13 12169 g004
Figure 5. Capacity and motor power of coal fly ash screw conveyor in range of speed by Roberts and tool VBA excel.
Applsci 13 12169 g005
Figure 6. 3D model of closed screw conveyor in simulation.
Applsci 13 12169 g006
Figure 7. Drawing of fly ash conveyor experiment.
Applsci 13 12169 g007
Figure 8. Established basic particle unit of the particulate material.
Applsci 13 12169 g008
Figure 9. The angle of repose simulation test of the particulate material.
Applsci 13 12169 g009
Figure 10. Flowchart of simulation in Altair EDEM software version 8.2.0.
Applsci 13 12169 g010
Figure 11. Capacity diagram of coal fly ash at speed 500 rpm.
Applsci 13 12169 g011
Figure 12. Capacity diagram of coal fly ash at speed 100 rpm—capacity about 7.5 kg/s.
Applsci 13 12169 g012
Figure 13. Capacity diagram of coal fly ash at speed 200 rpm—capacity about 12.5 kg/s.
Applsci 13 12169 g013
Figure 14. Capacity diagram of coal fly ash at speed 300 rpm—capacity about 16.0 (kg/s).
Applsci 13 12169 g014
Figure 15. Capacity diagram of coal fly ash at speed 400 rpm—capacity about 17.9 (kg/s).
Applsci 13 12169 g015
Figure 16. Capacity diagram of coal fly ash at speed 600 rpm—capacity about 18.5 kg/s.
Applsci 13 12169 g016
Figure 17. Capacity diagram of coal fly ash at speed 700 rpm—capacity about 17.5 kg/s.
Applsci 13 12169 g017
Figure 18. Actual model test at Vinh Tan thermal power company, Vietnam. (a) The actual model tests. (b) The actual rotary valve model.
Applsci 13 12169 g018
Figure 19. Competition between calculation and EDEM simulation and actual test.
Applsci 13 12169 g019
Table 1. Grain size distribution and chemical compositions of Vietnam dry fly ash. Reprinted from ref. [23].
ComponentPercentage
SiO257.02%
Al2O323.82%
K2O6.56%
Fe2O34.69%
Table 2. Material property parameters of coal fly ash in Vietnam.
Material Property ParametersValue
(for Calculation and EDEM Simulation)
EDEM Material
Library
GEMM_Particle 8454
Angle of repose (degree)47.547.51
Bulk density (kg/m3)883724.54
Solid density (kg/m3)22001500
The coefficient of static friction0.550.56
The coefficient of rolling friction0.080.1
The coefficient of restitution0.50.55
The coefficient of static friction with steel surface0.6--
Table 3. Dimensions of coal fly ash screw conveyor for calculation and simulation.
Dimension of Screw ConveyorValue
Diameter D (mm)273
Diameter of shaft Dc (mm)141
Pitch p (mm)250
Length L (mm)1300
Balde thickness t (mm)8
Radial Clearance C (mm)10
Speed of Screw (rpm)100–700
Table 4. Capacity of actual test screw conveyor.
NoSpeed
(rpm)
Mass
(ton)
Time
(min)
Capacity of Screw
Conveyor (m3/h)
Capacity of Screw
Conveyor (ton/h)
1.1300353363.656.3
1.2300353363.656.3
1.3300353265.658.0
1.4300353461.854.6
1.5300353265.658.0
2.1500352875.066.3
2.2500352777.868.8
2.3500352680.871.4
2.4500352777.868.8
2.5500352875.066.3
3.1700353070.061.9
3.2700352972.464.1
3.3700353167.759.9
3.4700353167.759.9
3.5700353070.061.9
Table 5. Capacity between 2 methods calculation and actual test.
No.Speed
(rpm)
Capacity
in EDEM
(kg/s)
Capacity
in EDEM
(ton/h)
Capacity
in VBA
(ton/h)
Difference
between
2 Methods
Actual
Capacity
(ton/h)
Deviation Ratio EDEM/VBA
(%/%)
11007.527.023.114.4%
220012.545.041.18.7%
330016.057.654.35.7%56.71.66%/4.17%
440017.964.462.53.0%
550018.867.765.72.9%68.30.97%/3.87%
660018.566.664.03.9%
770017.562.857.48.7%61.52.11%/6.74%
Disclaimer/Publisher’s Note: The statements, opinions and data contained in all publications are solely those of the individual author(s) and contributor(s) and not of MDPI and/or the editor(s). MDPI and/or the editor(s) disclaim responsibility for any injury to people or property resulting from any ideas, methods, instructions or products referred to in the content.