
Characterization of Freeze-Thaw Cycle Damage to Mudstone in Open Pit in Cold Regions—Based on Nuclear Magnetic Resonance Method

 , ,
, ,  ,
,
Abstract
:1. Introduction
2. Materials and Methods
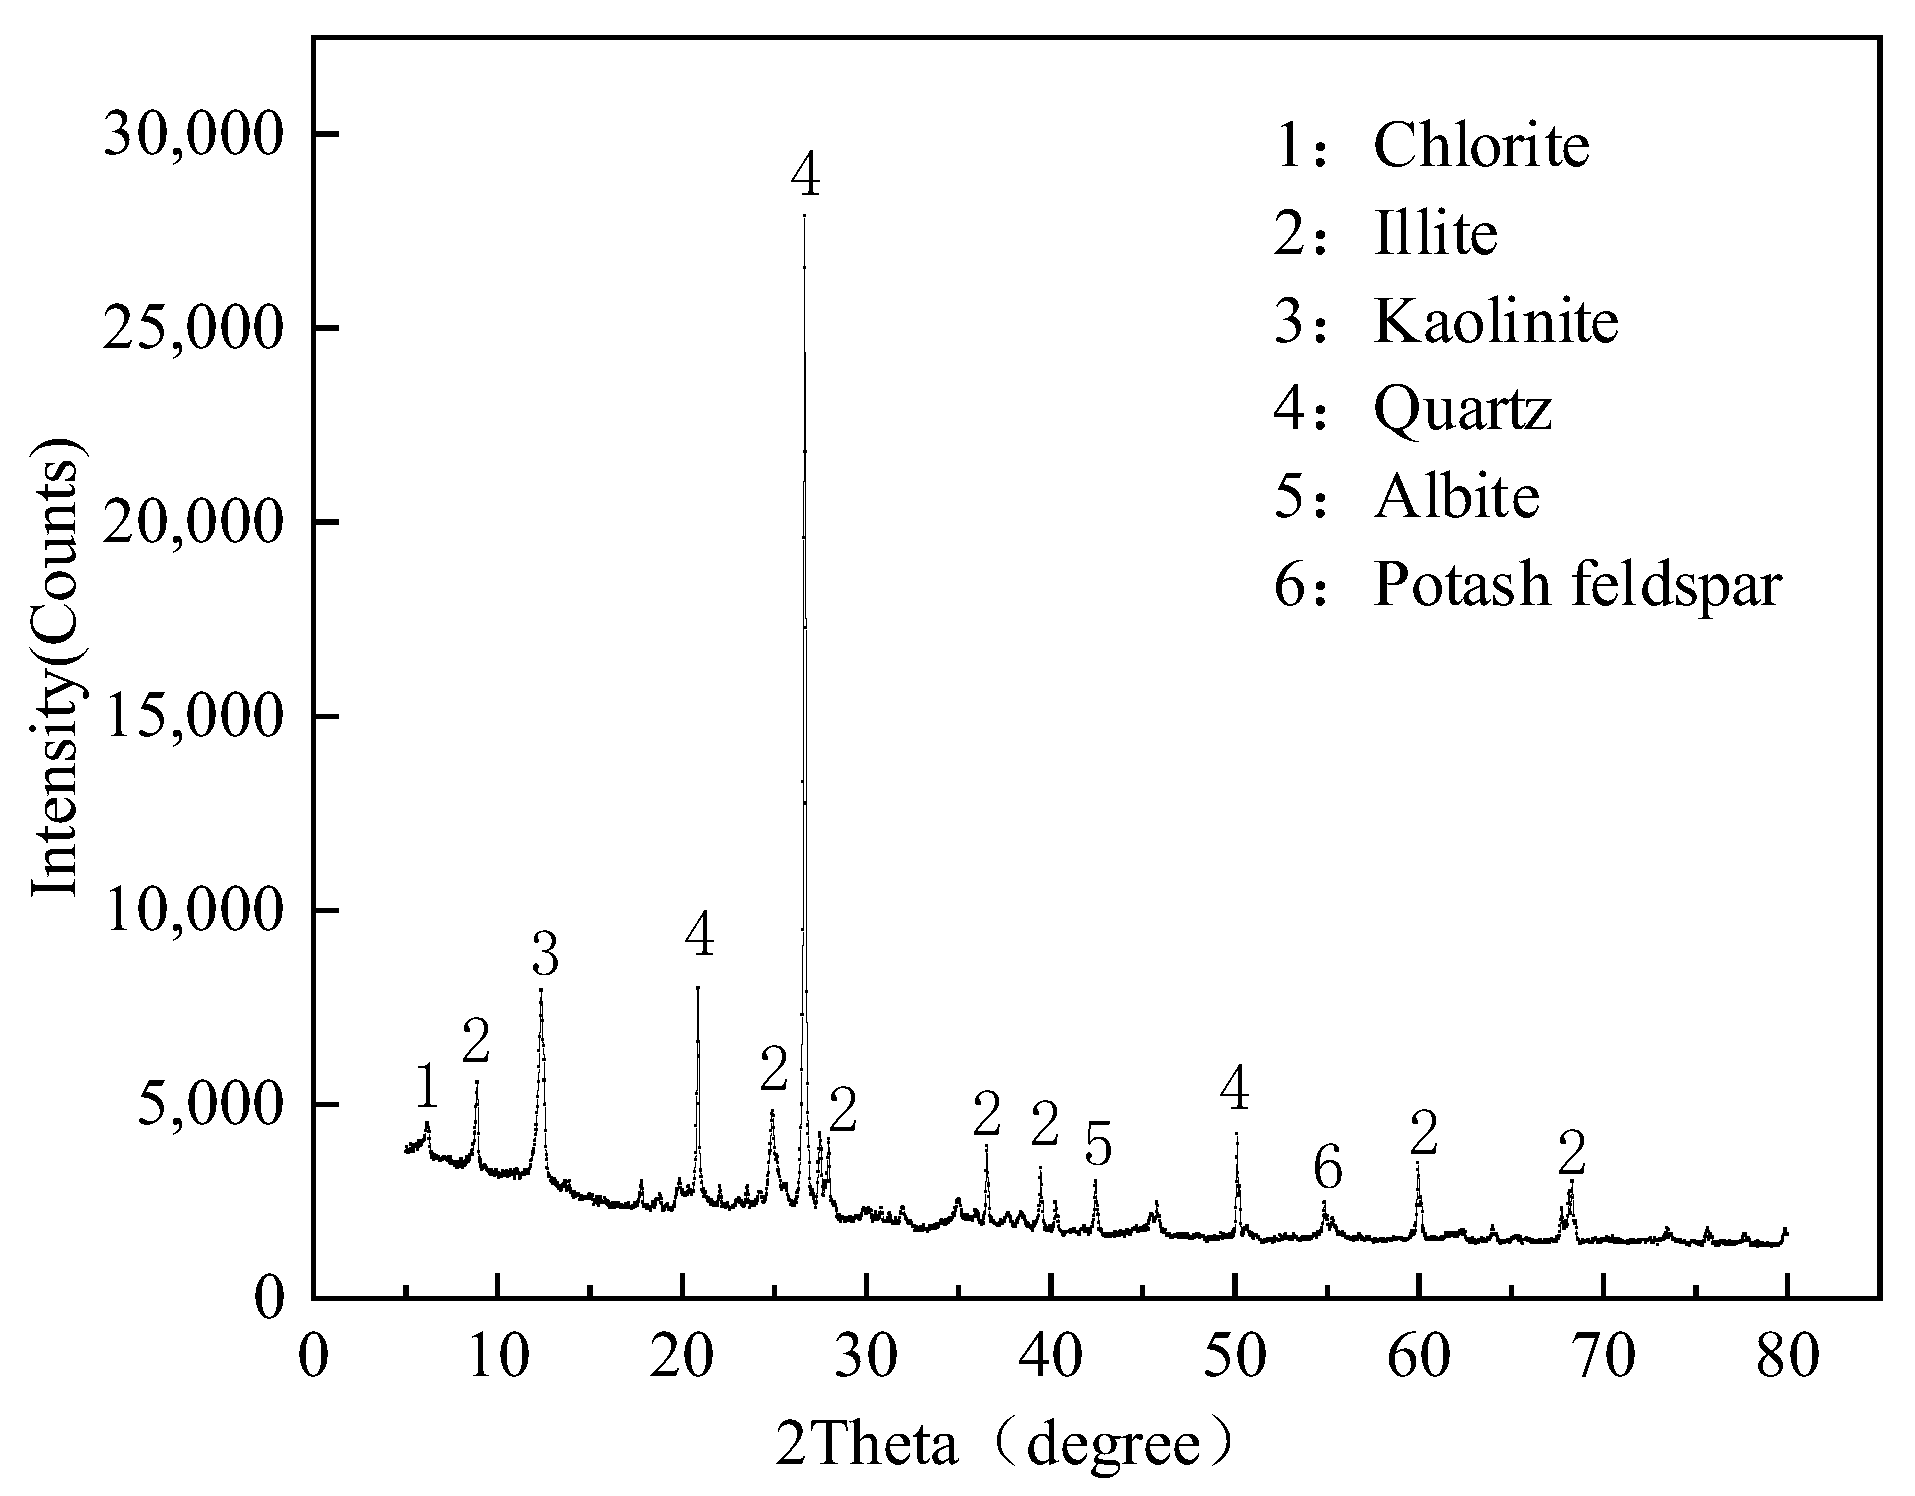
2.1. Open-Pit Mudstone
2.2. Test Equipment
2.3. Test Methods
2.3.1. Freeze–Thaw Cycle Test
- (1)
- Plastic film samples were always used during the freezing and thawing process to prevent water from entering the samples during the thawing process and to cut off the source of water replenishment of the samples to simulate slopes with no water recharge from the rock formation;
- (2)
- Mudstone samples were left bare and natural during the freeze–thaw process to simulate mudstone slopes in a natural state with good conditions for moisture replenishment in the rock formation.
2.3.2. NMR Test
2.3.3. Uniaxial Compression Test
3. Results
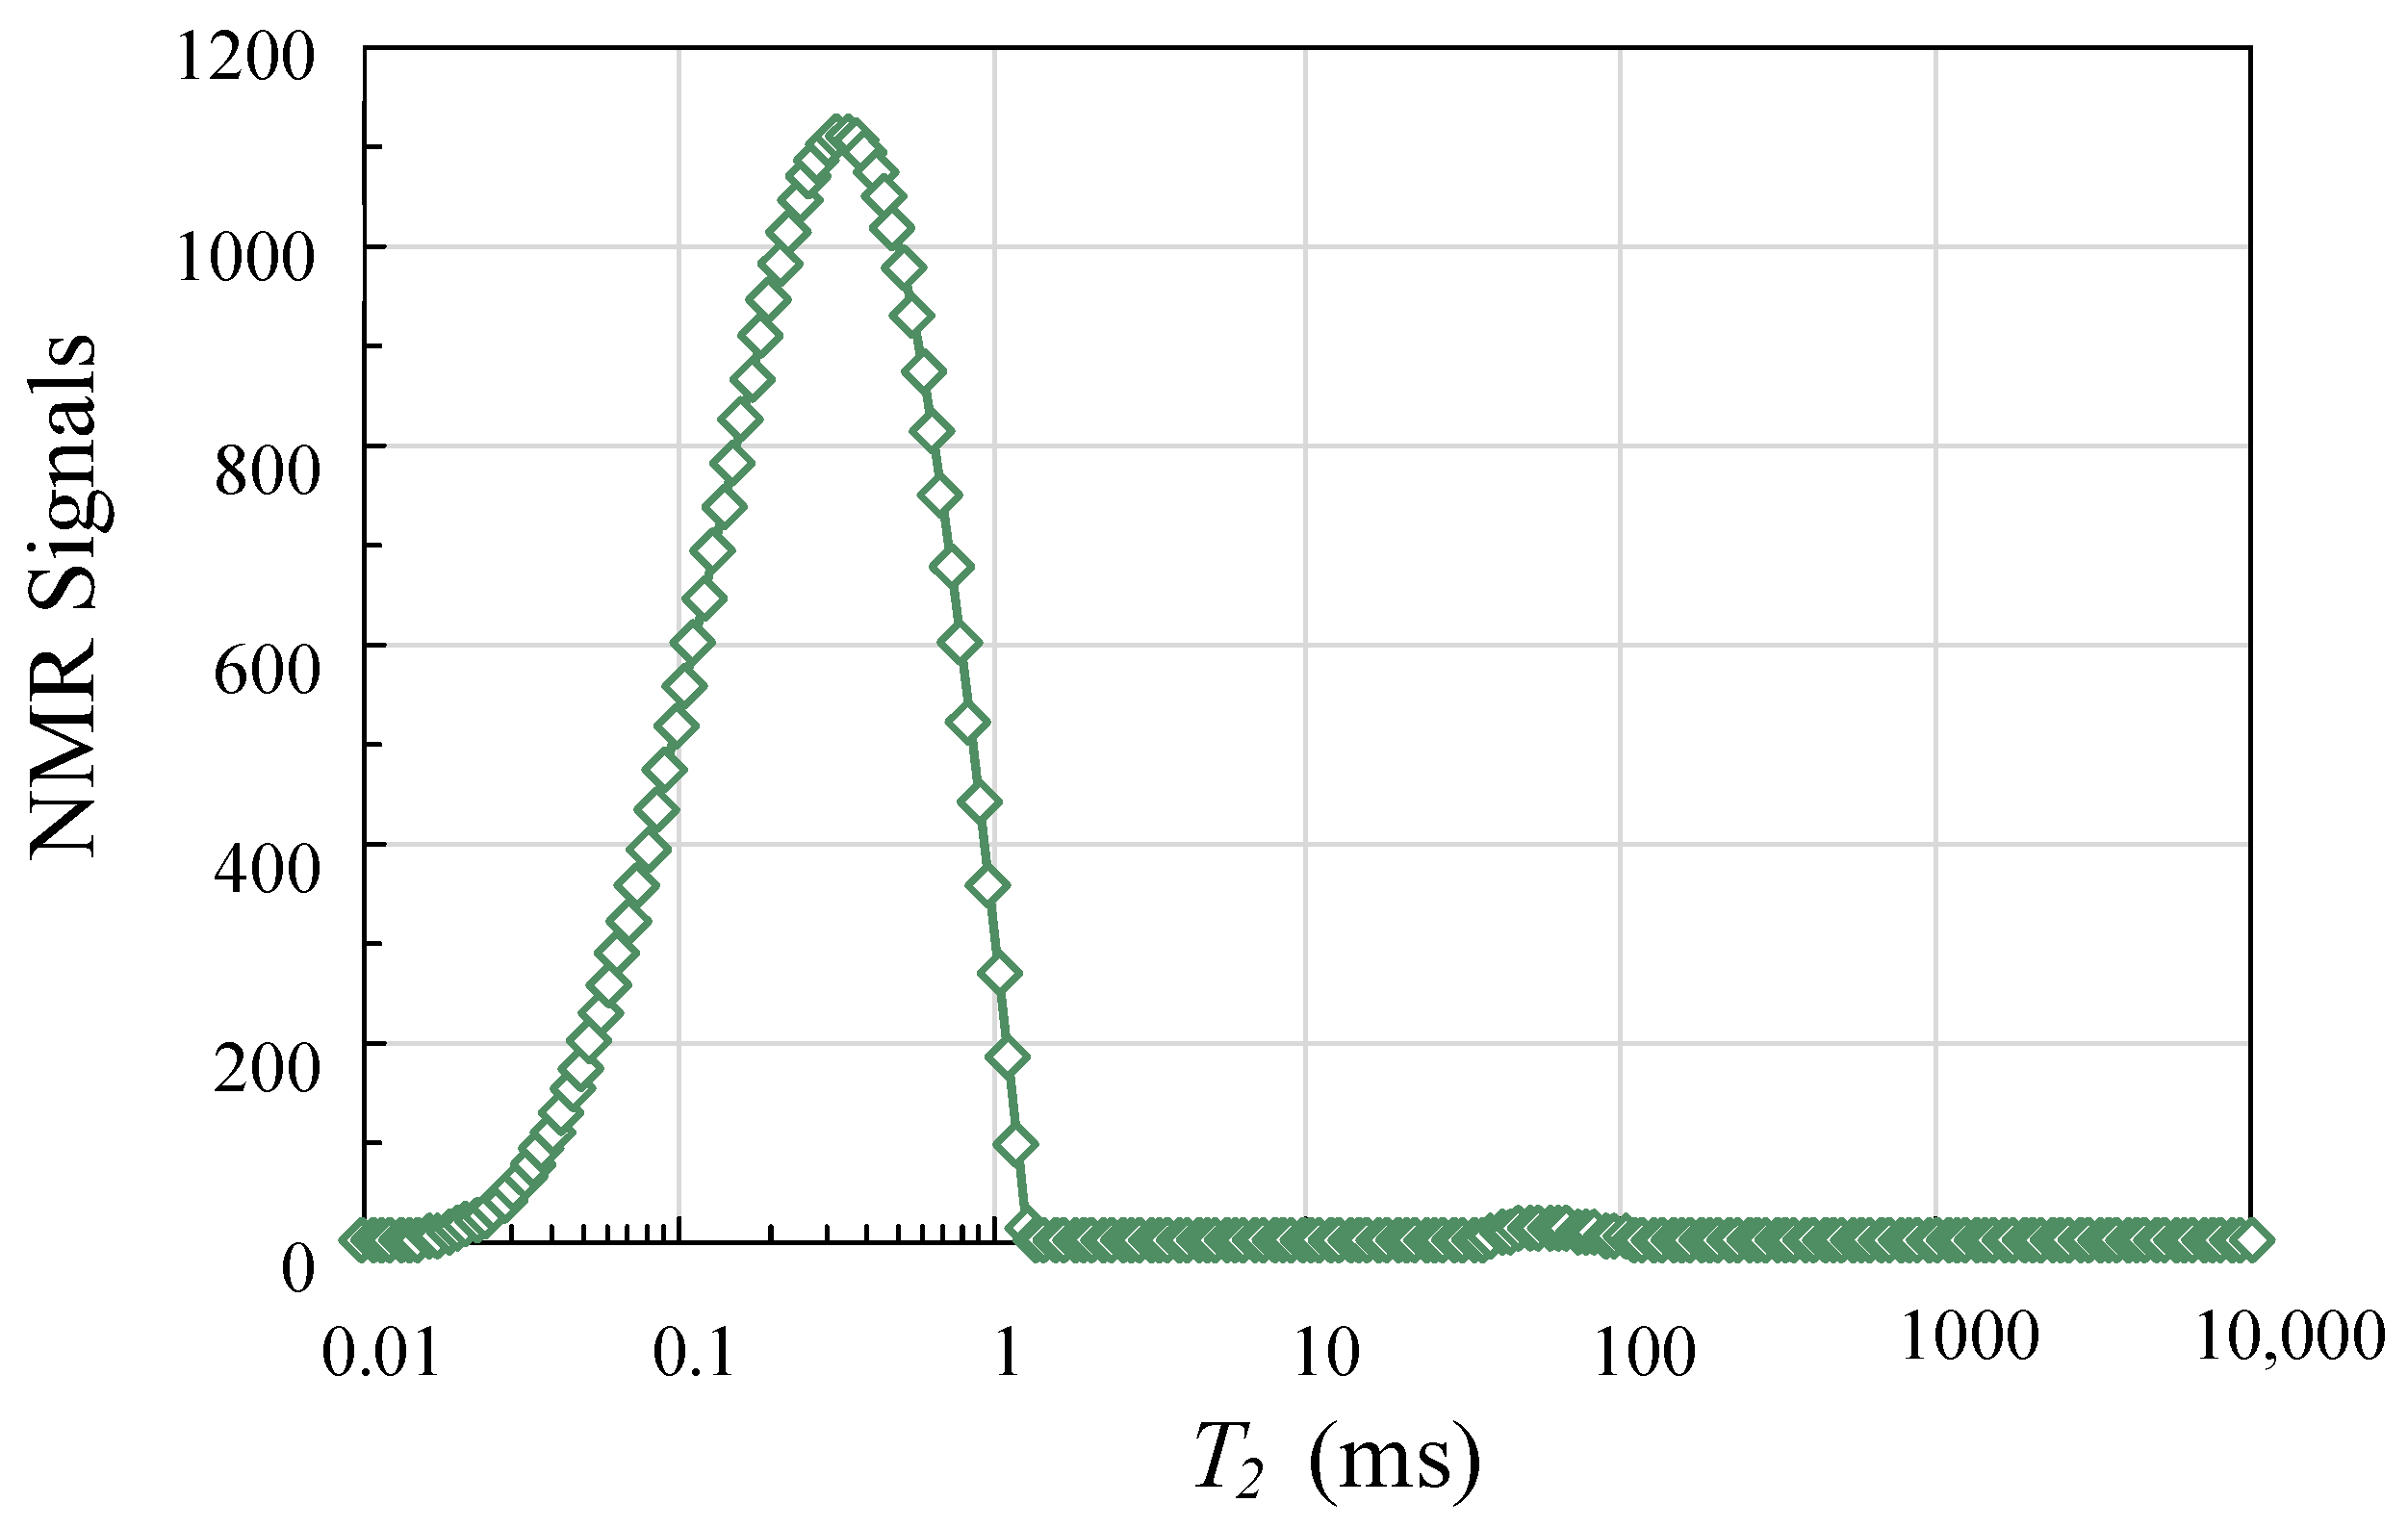
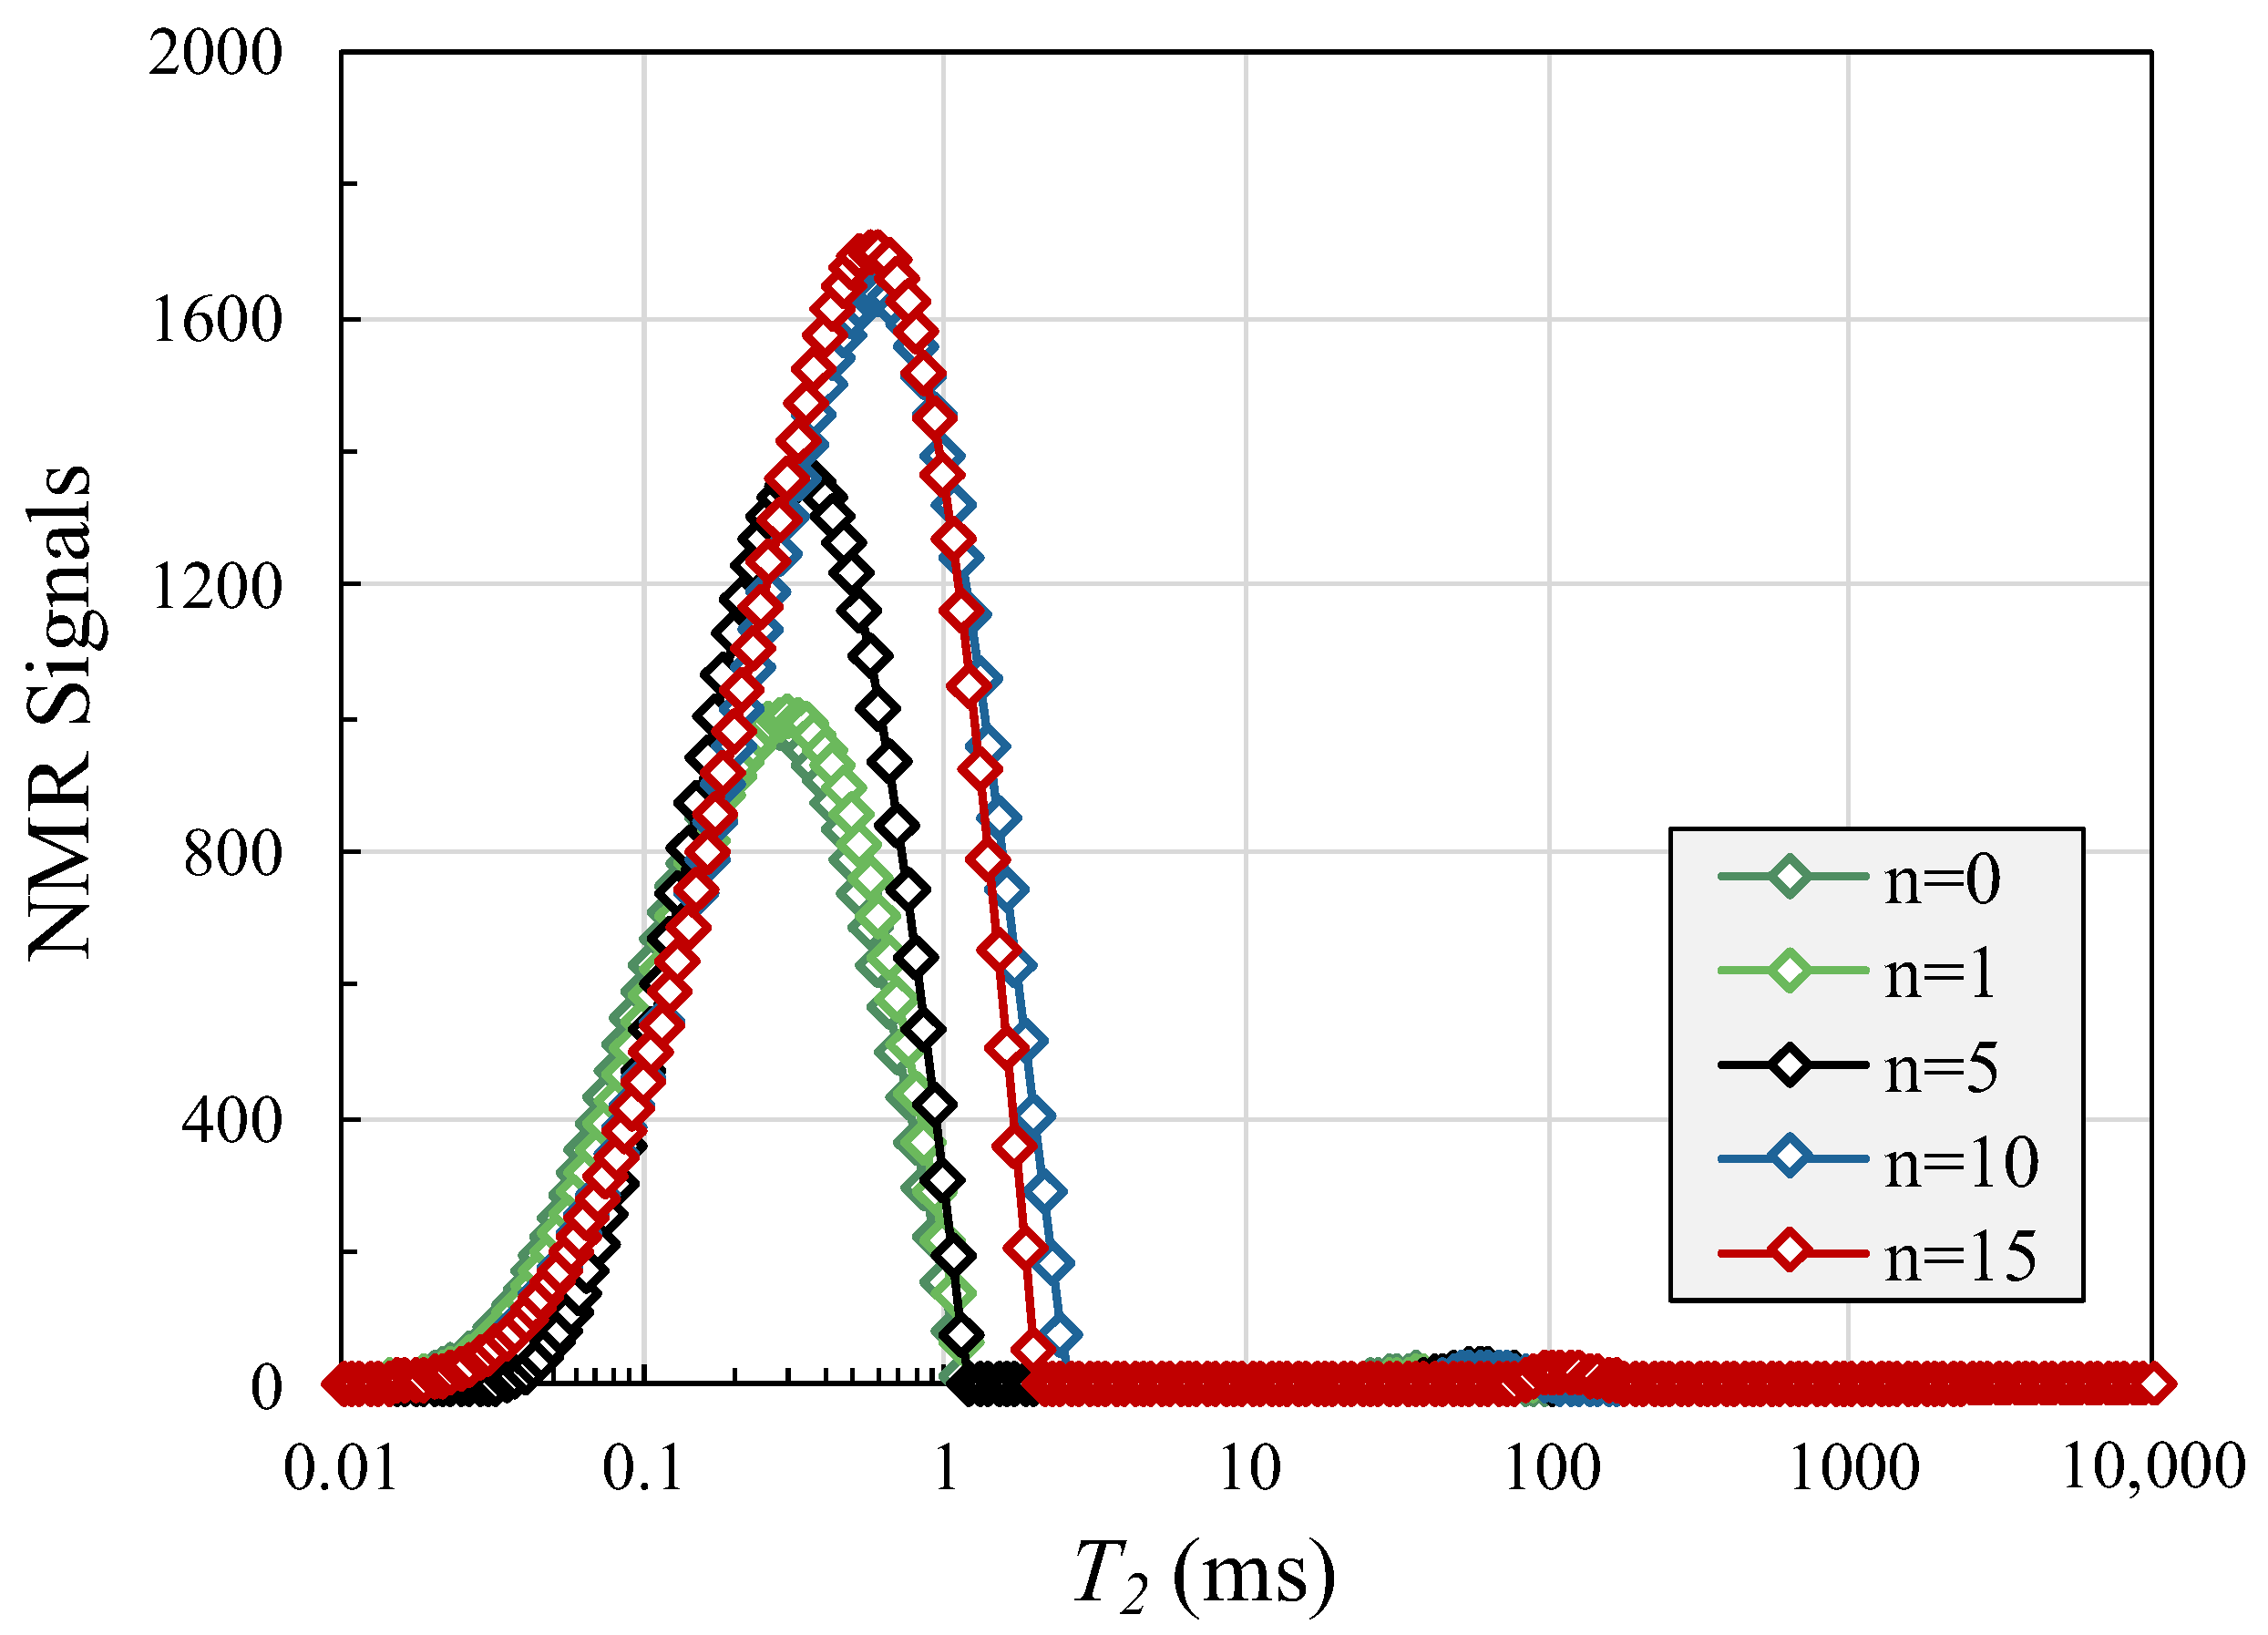
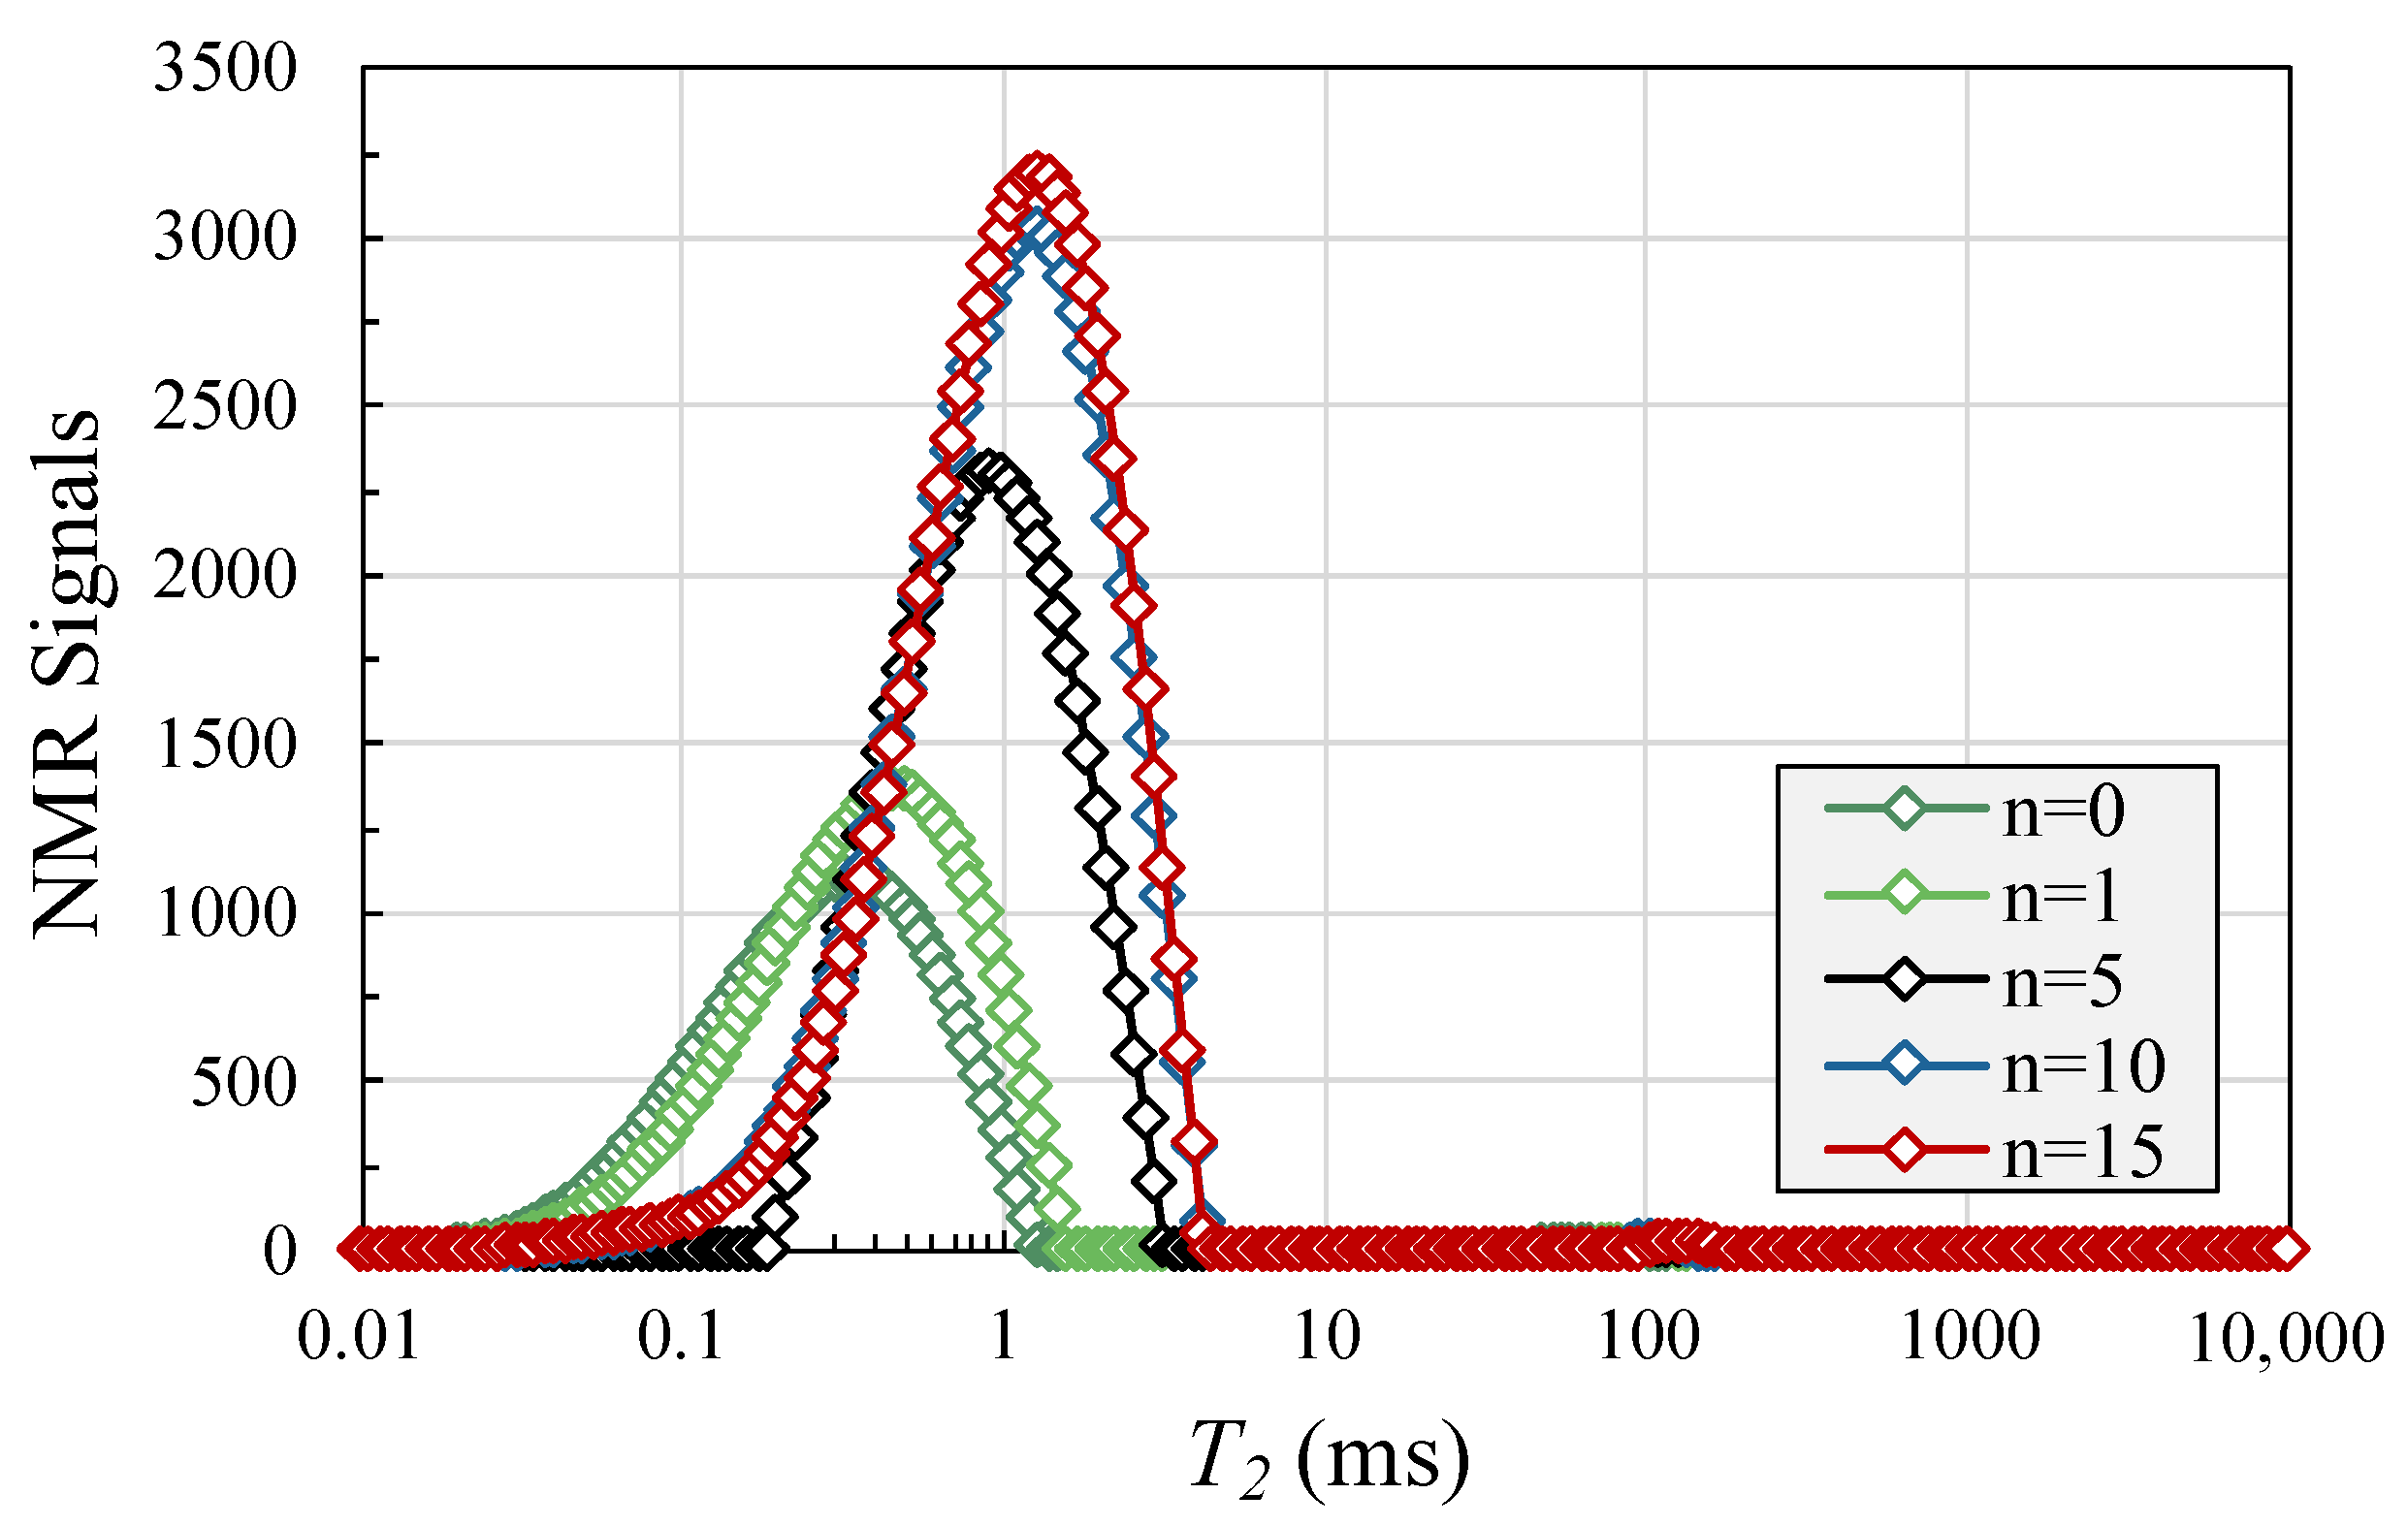
3.1. NMR Spectrum
3.1.1. Sealed Mudstone
3.1.2. Natural Mudstone
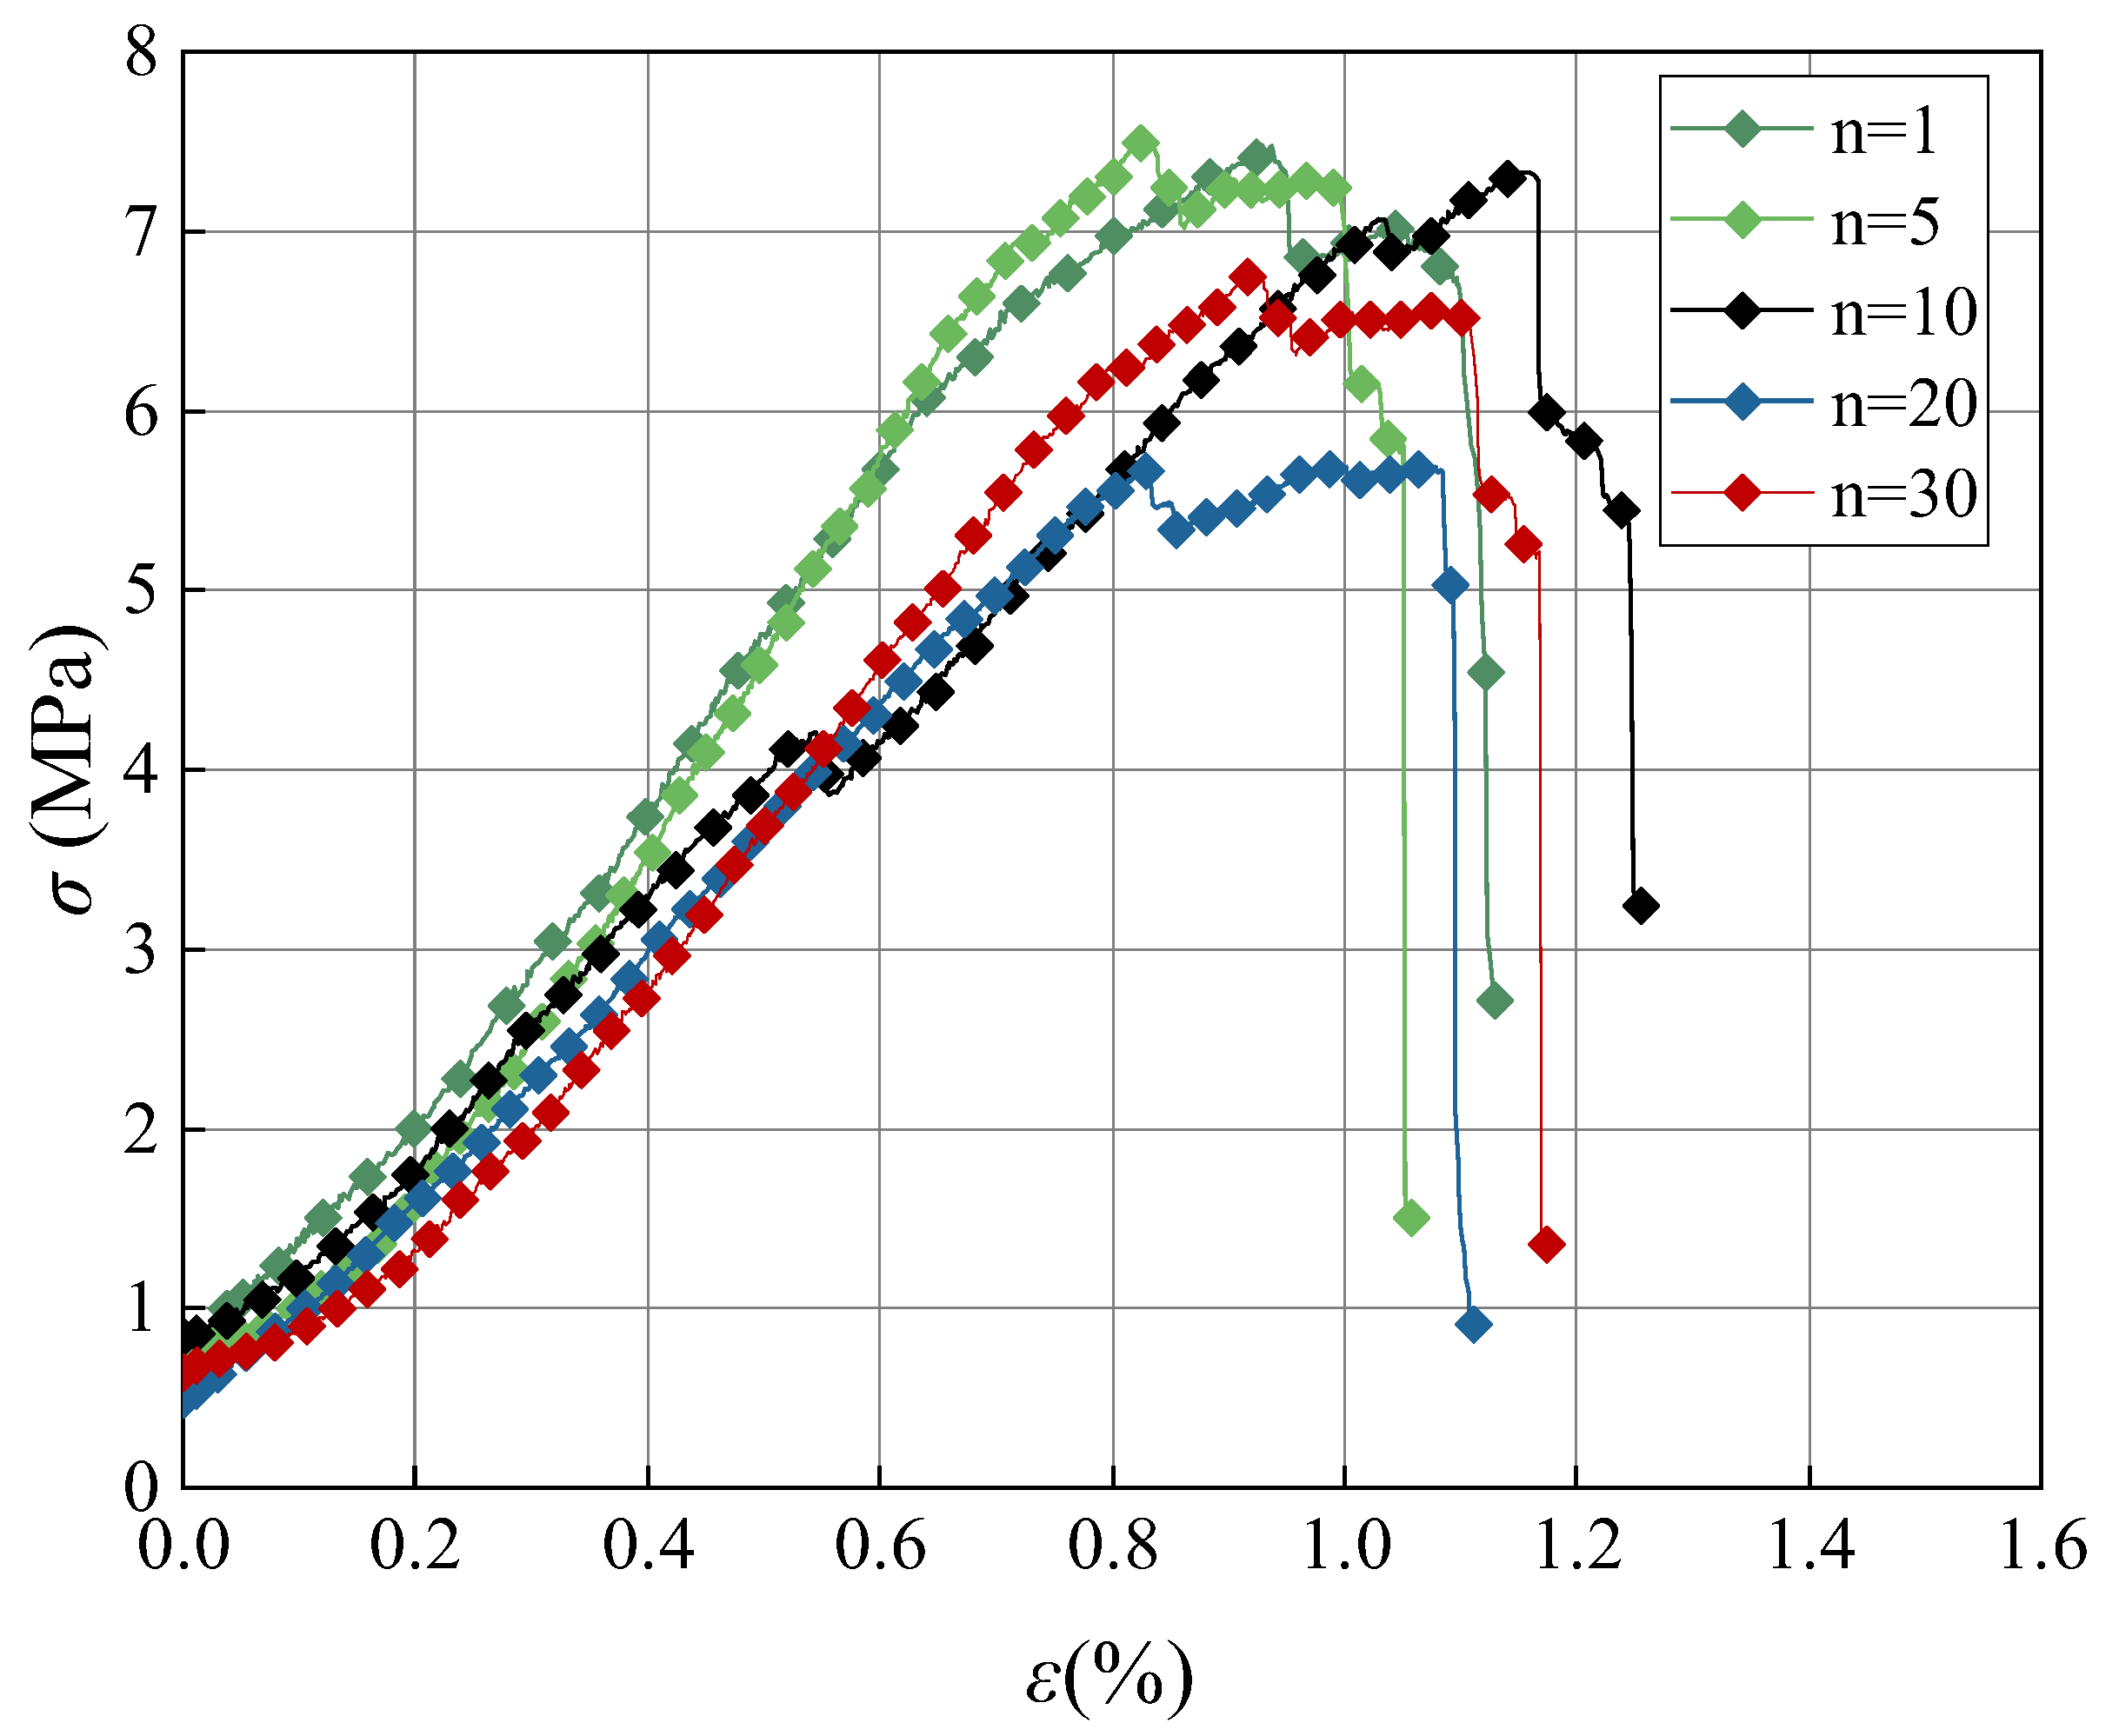
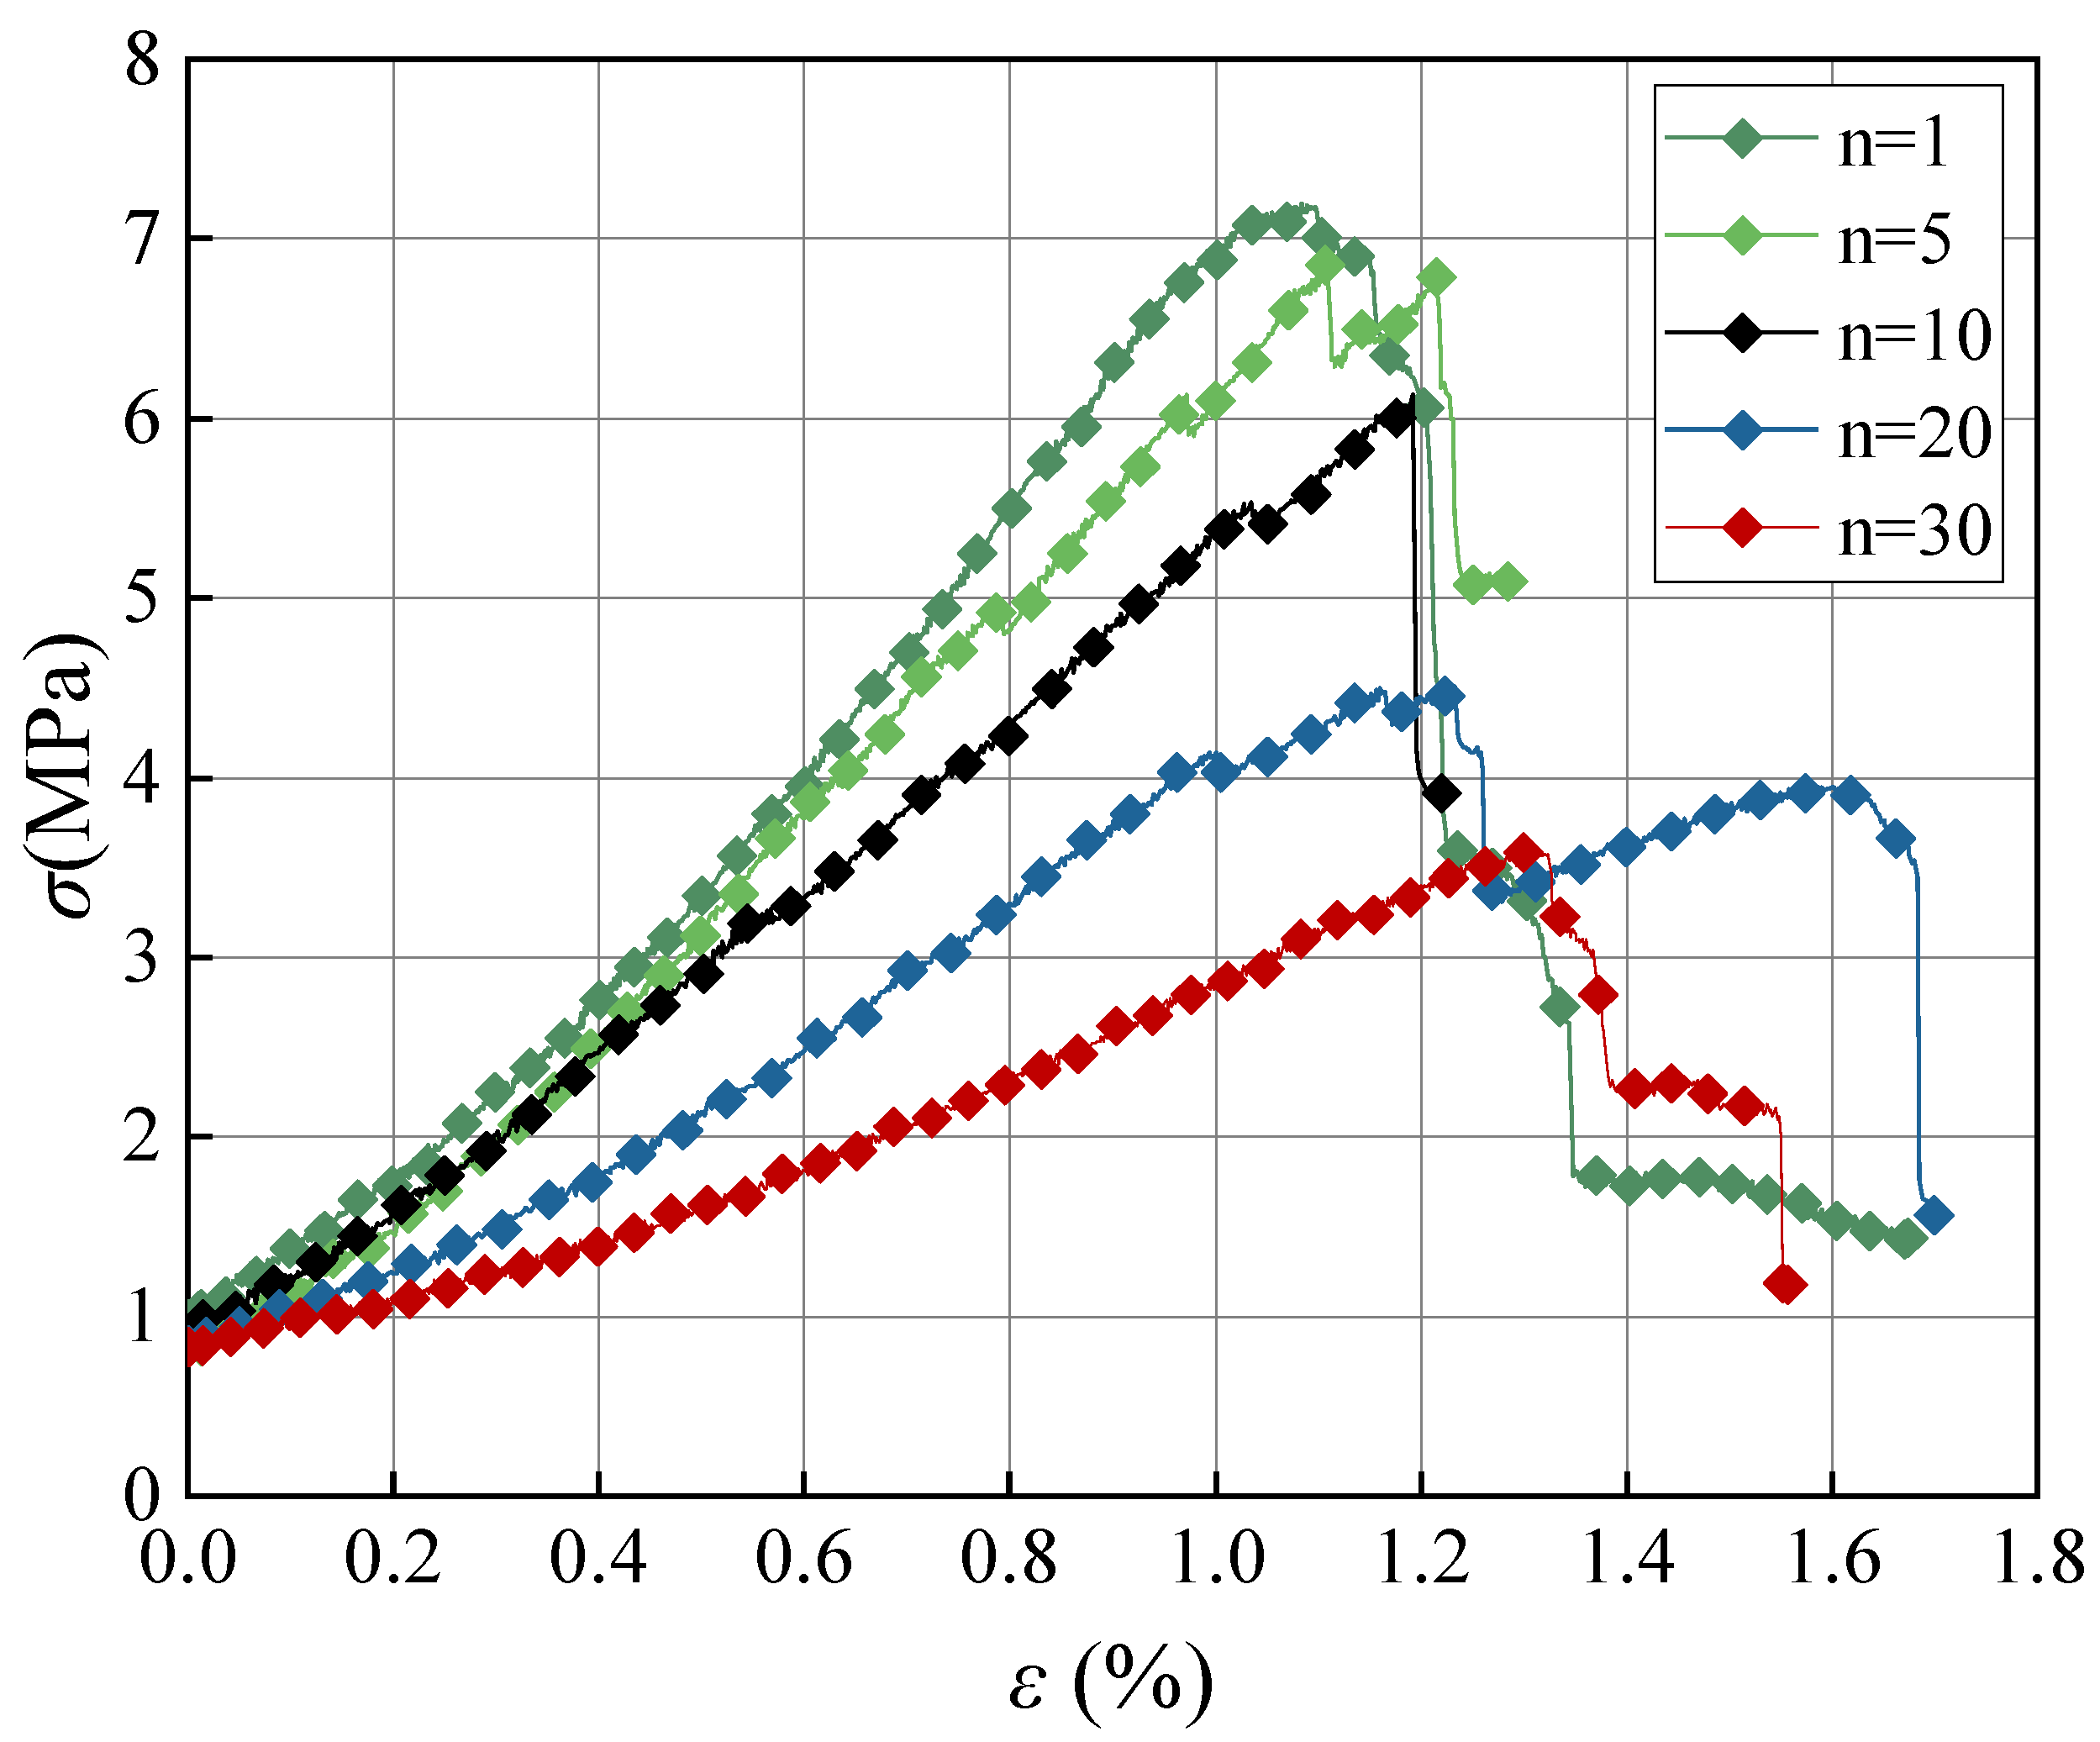
3.2. Mechanical Properties
3.2.1. Sealed Mudstone
3.2.2. Natural Mudstone
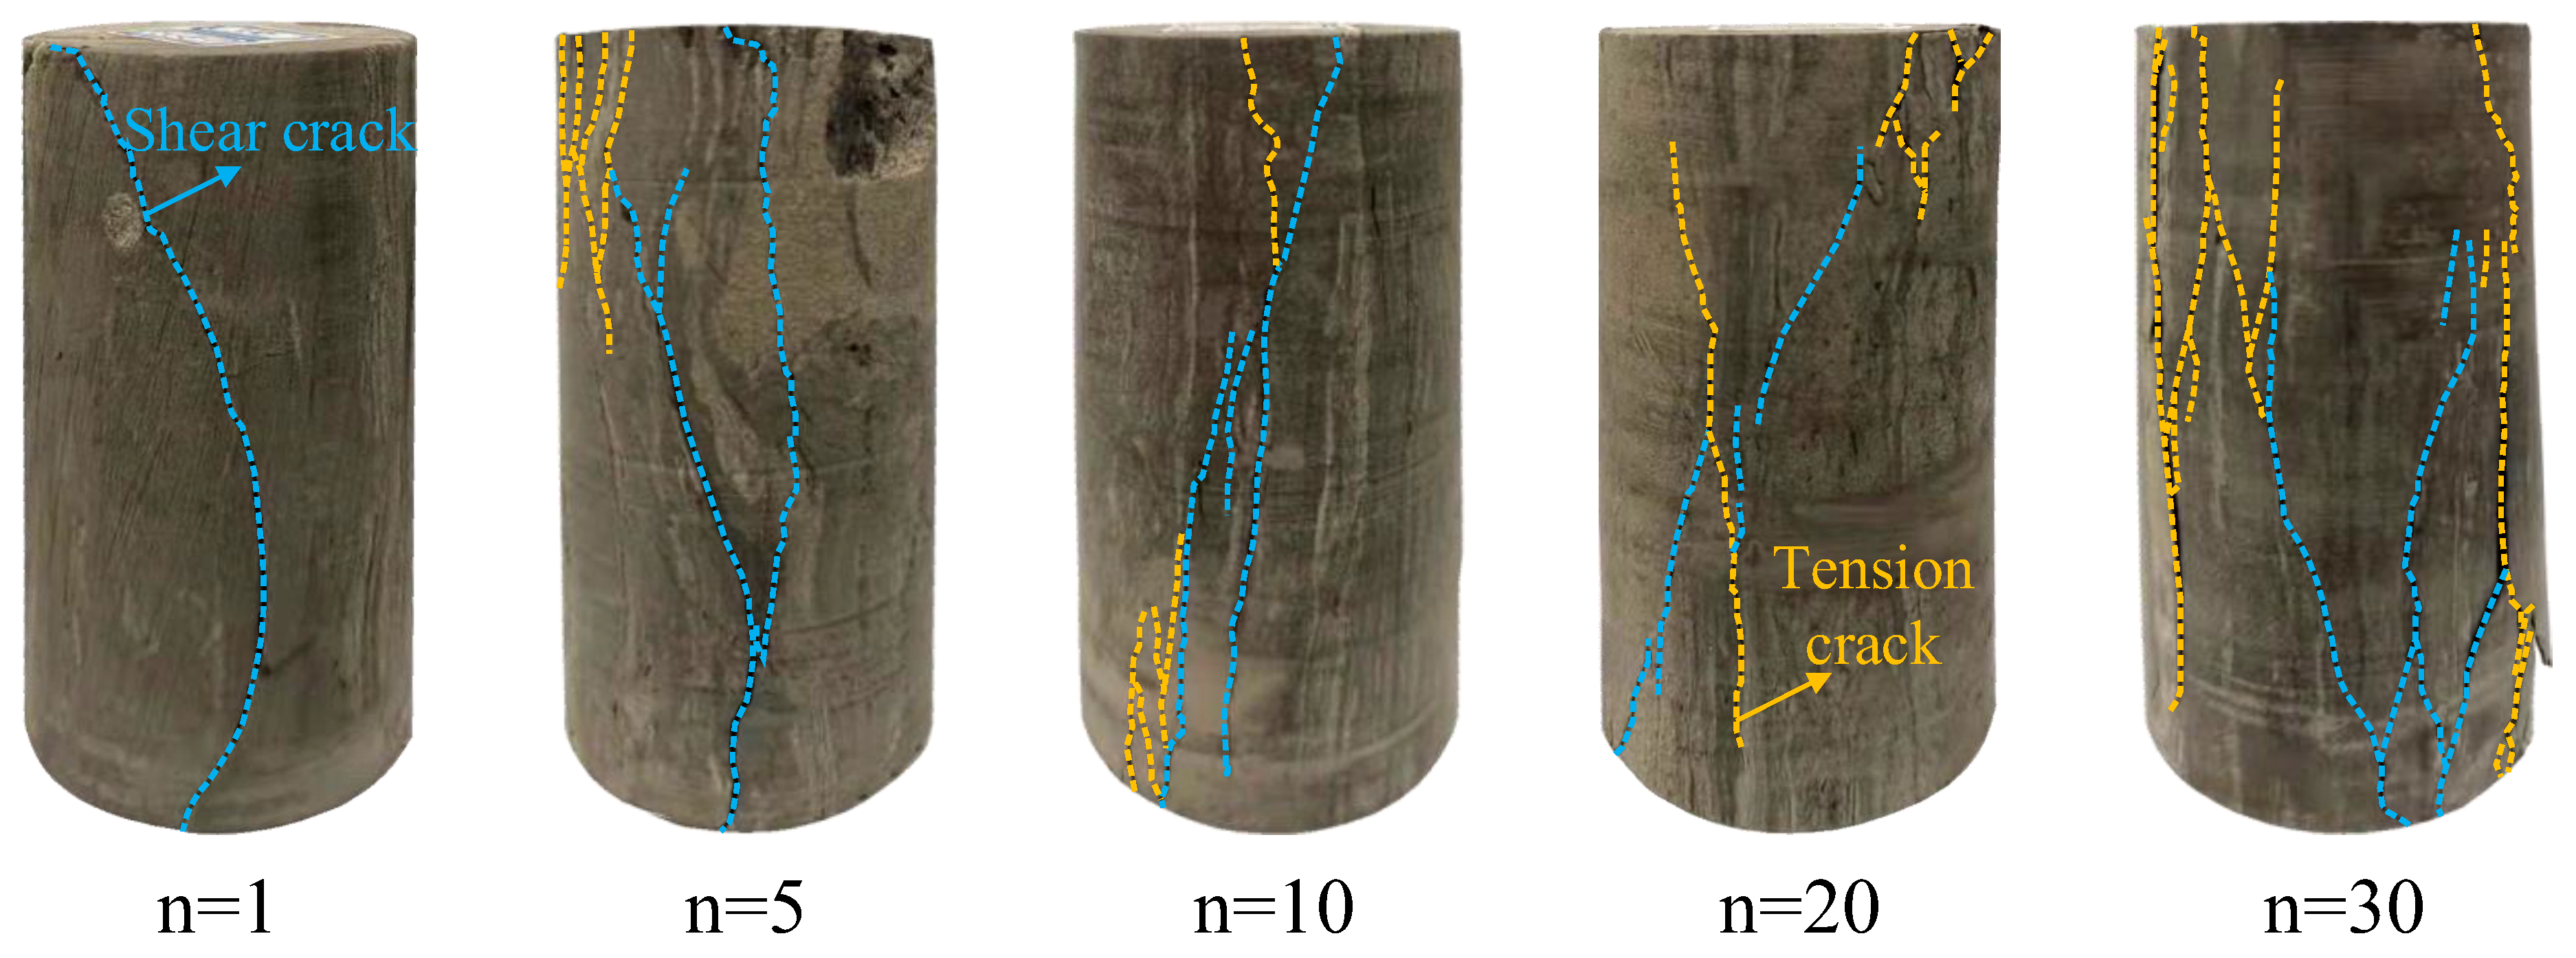
3.3. Macrofracture Characteristics
4. Discussions
4.1. Microporosity Changes in Mudstone
4.1.1. Sealed Mudstone
4.1.2. Natural Mudstone
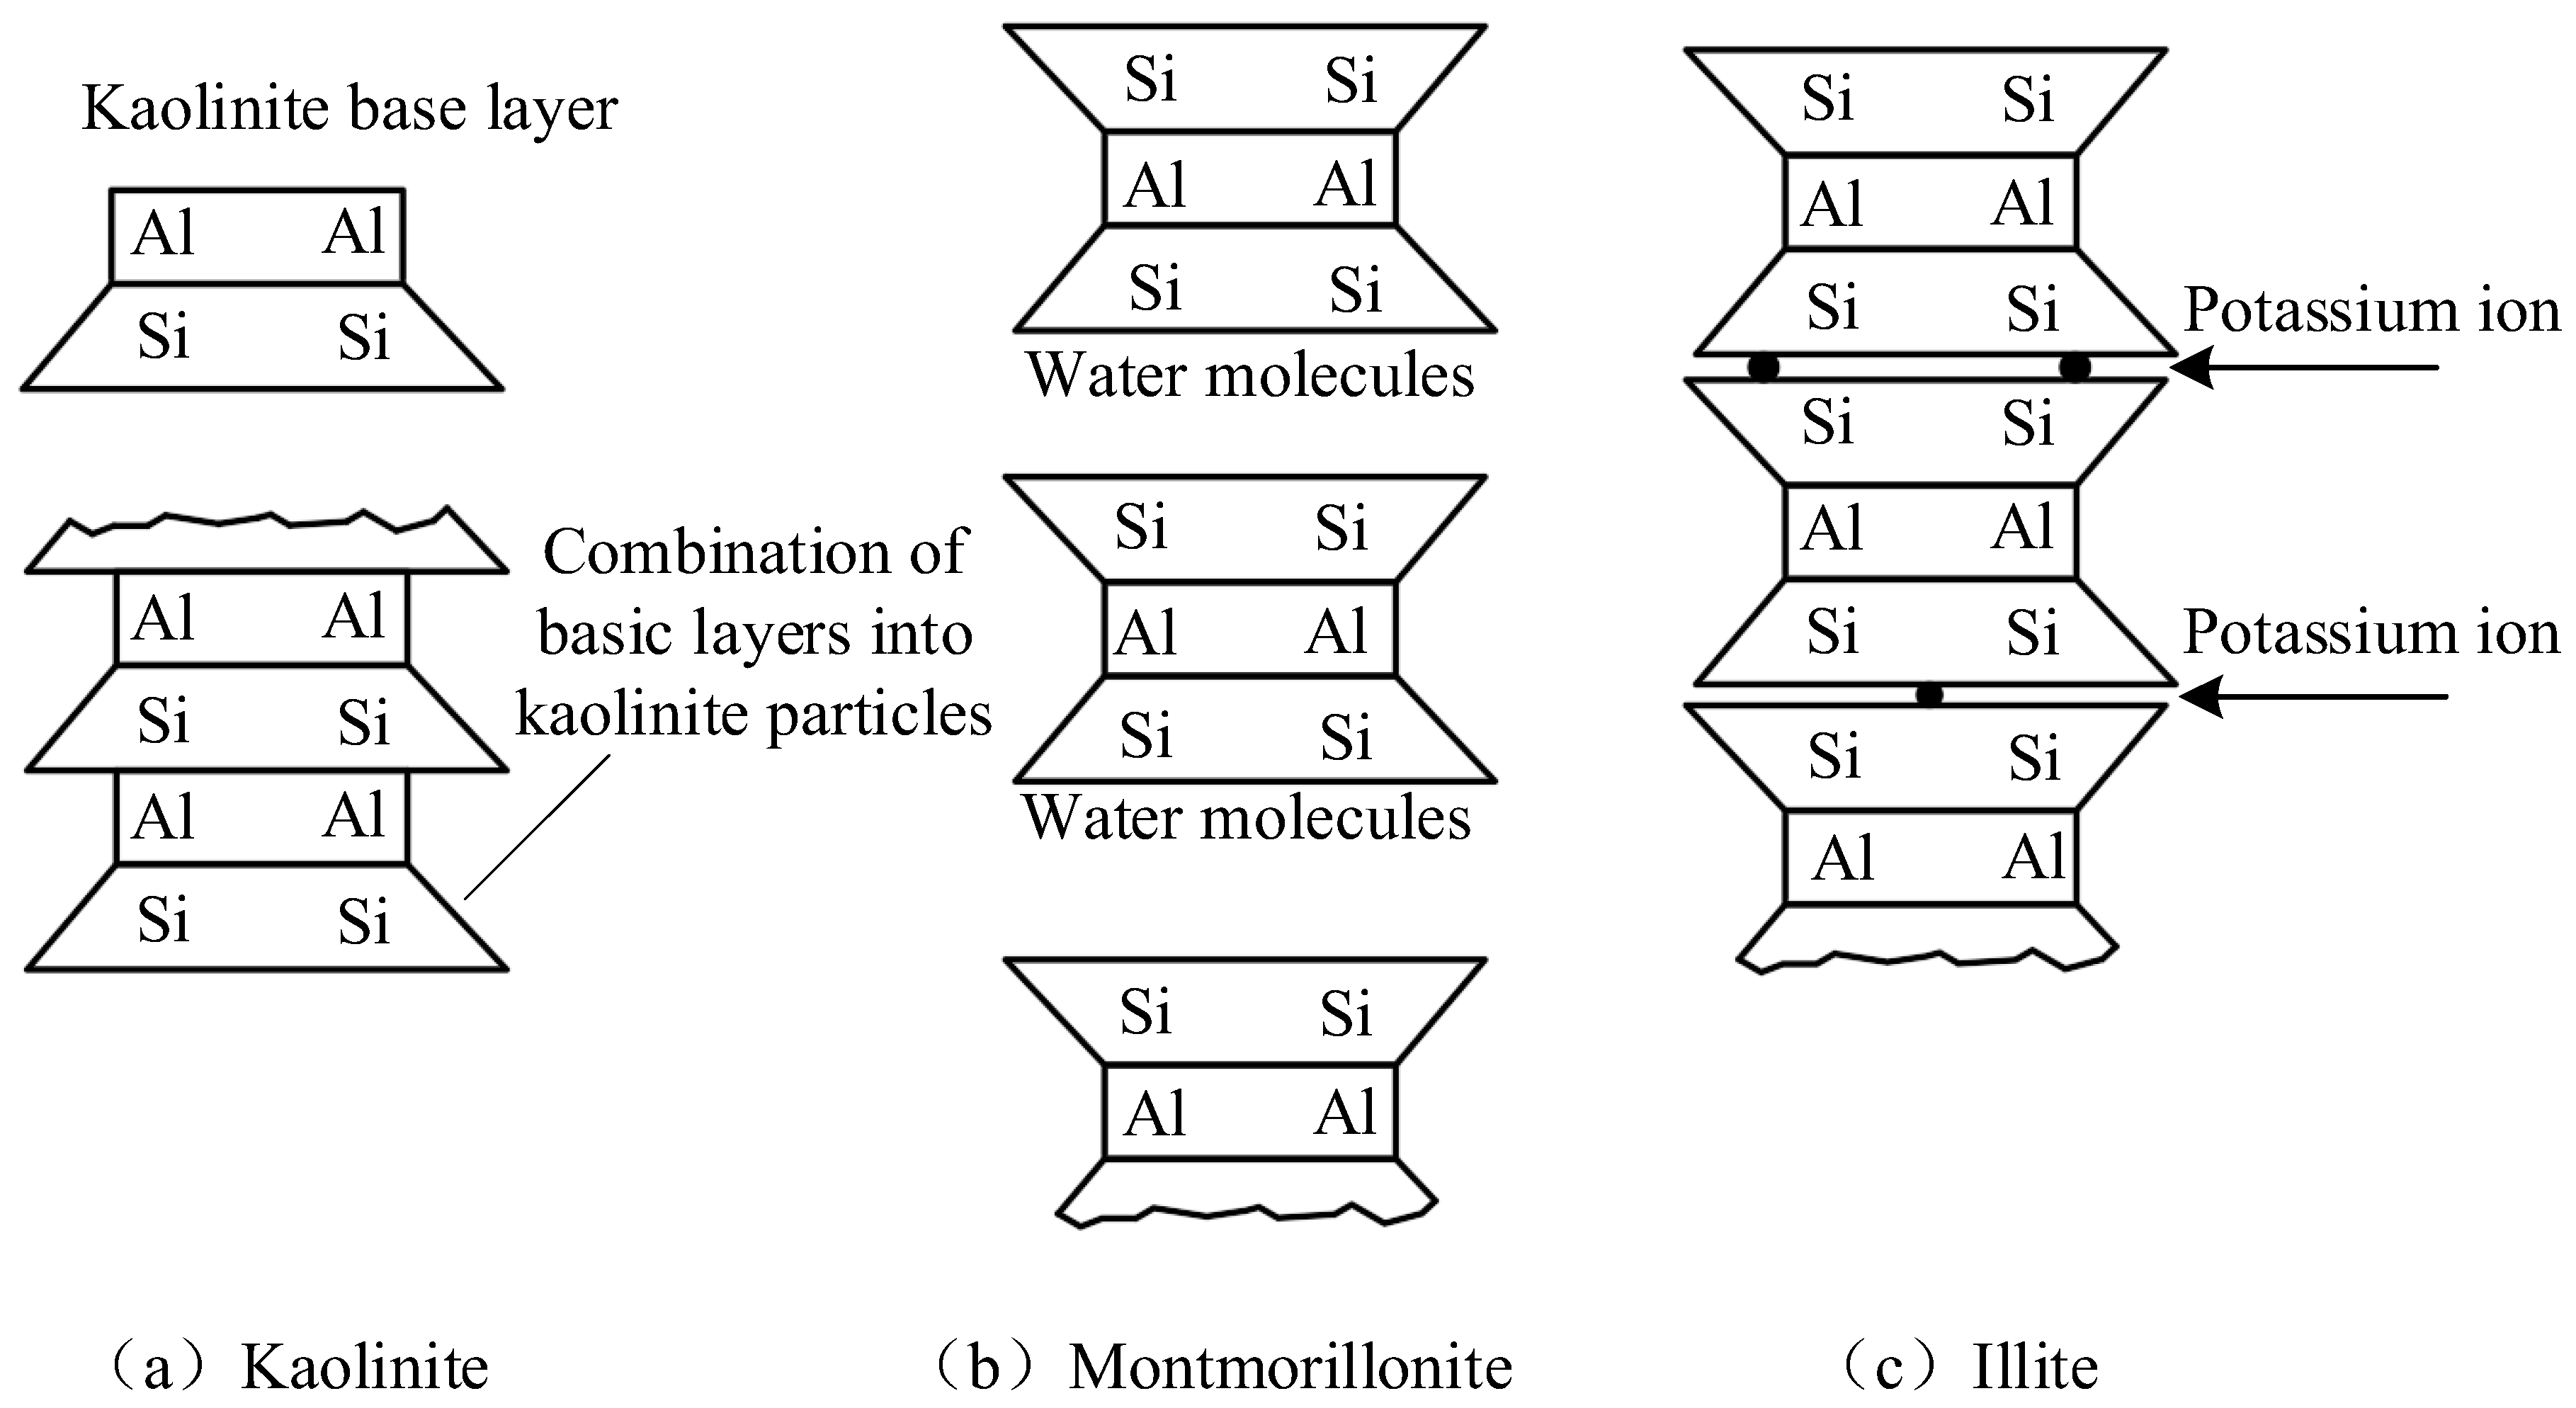
4.2. Mudstone Hydration
5. Conclusions
- (1)
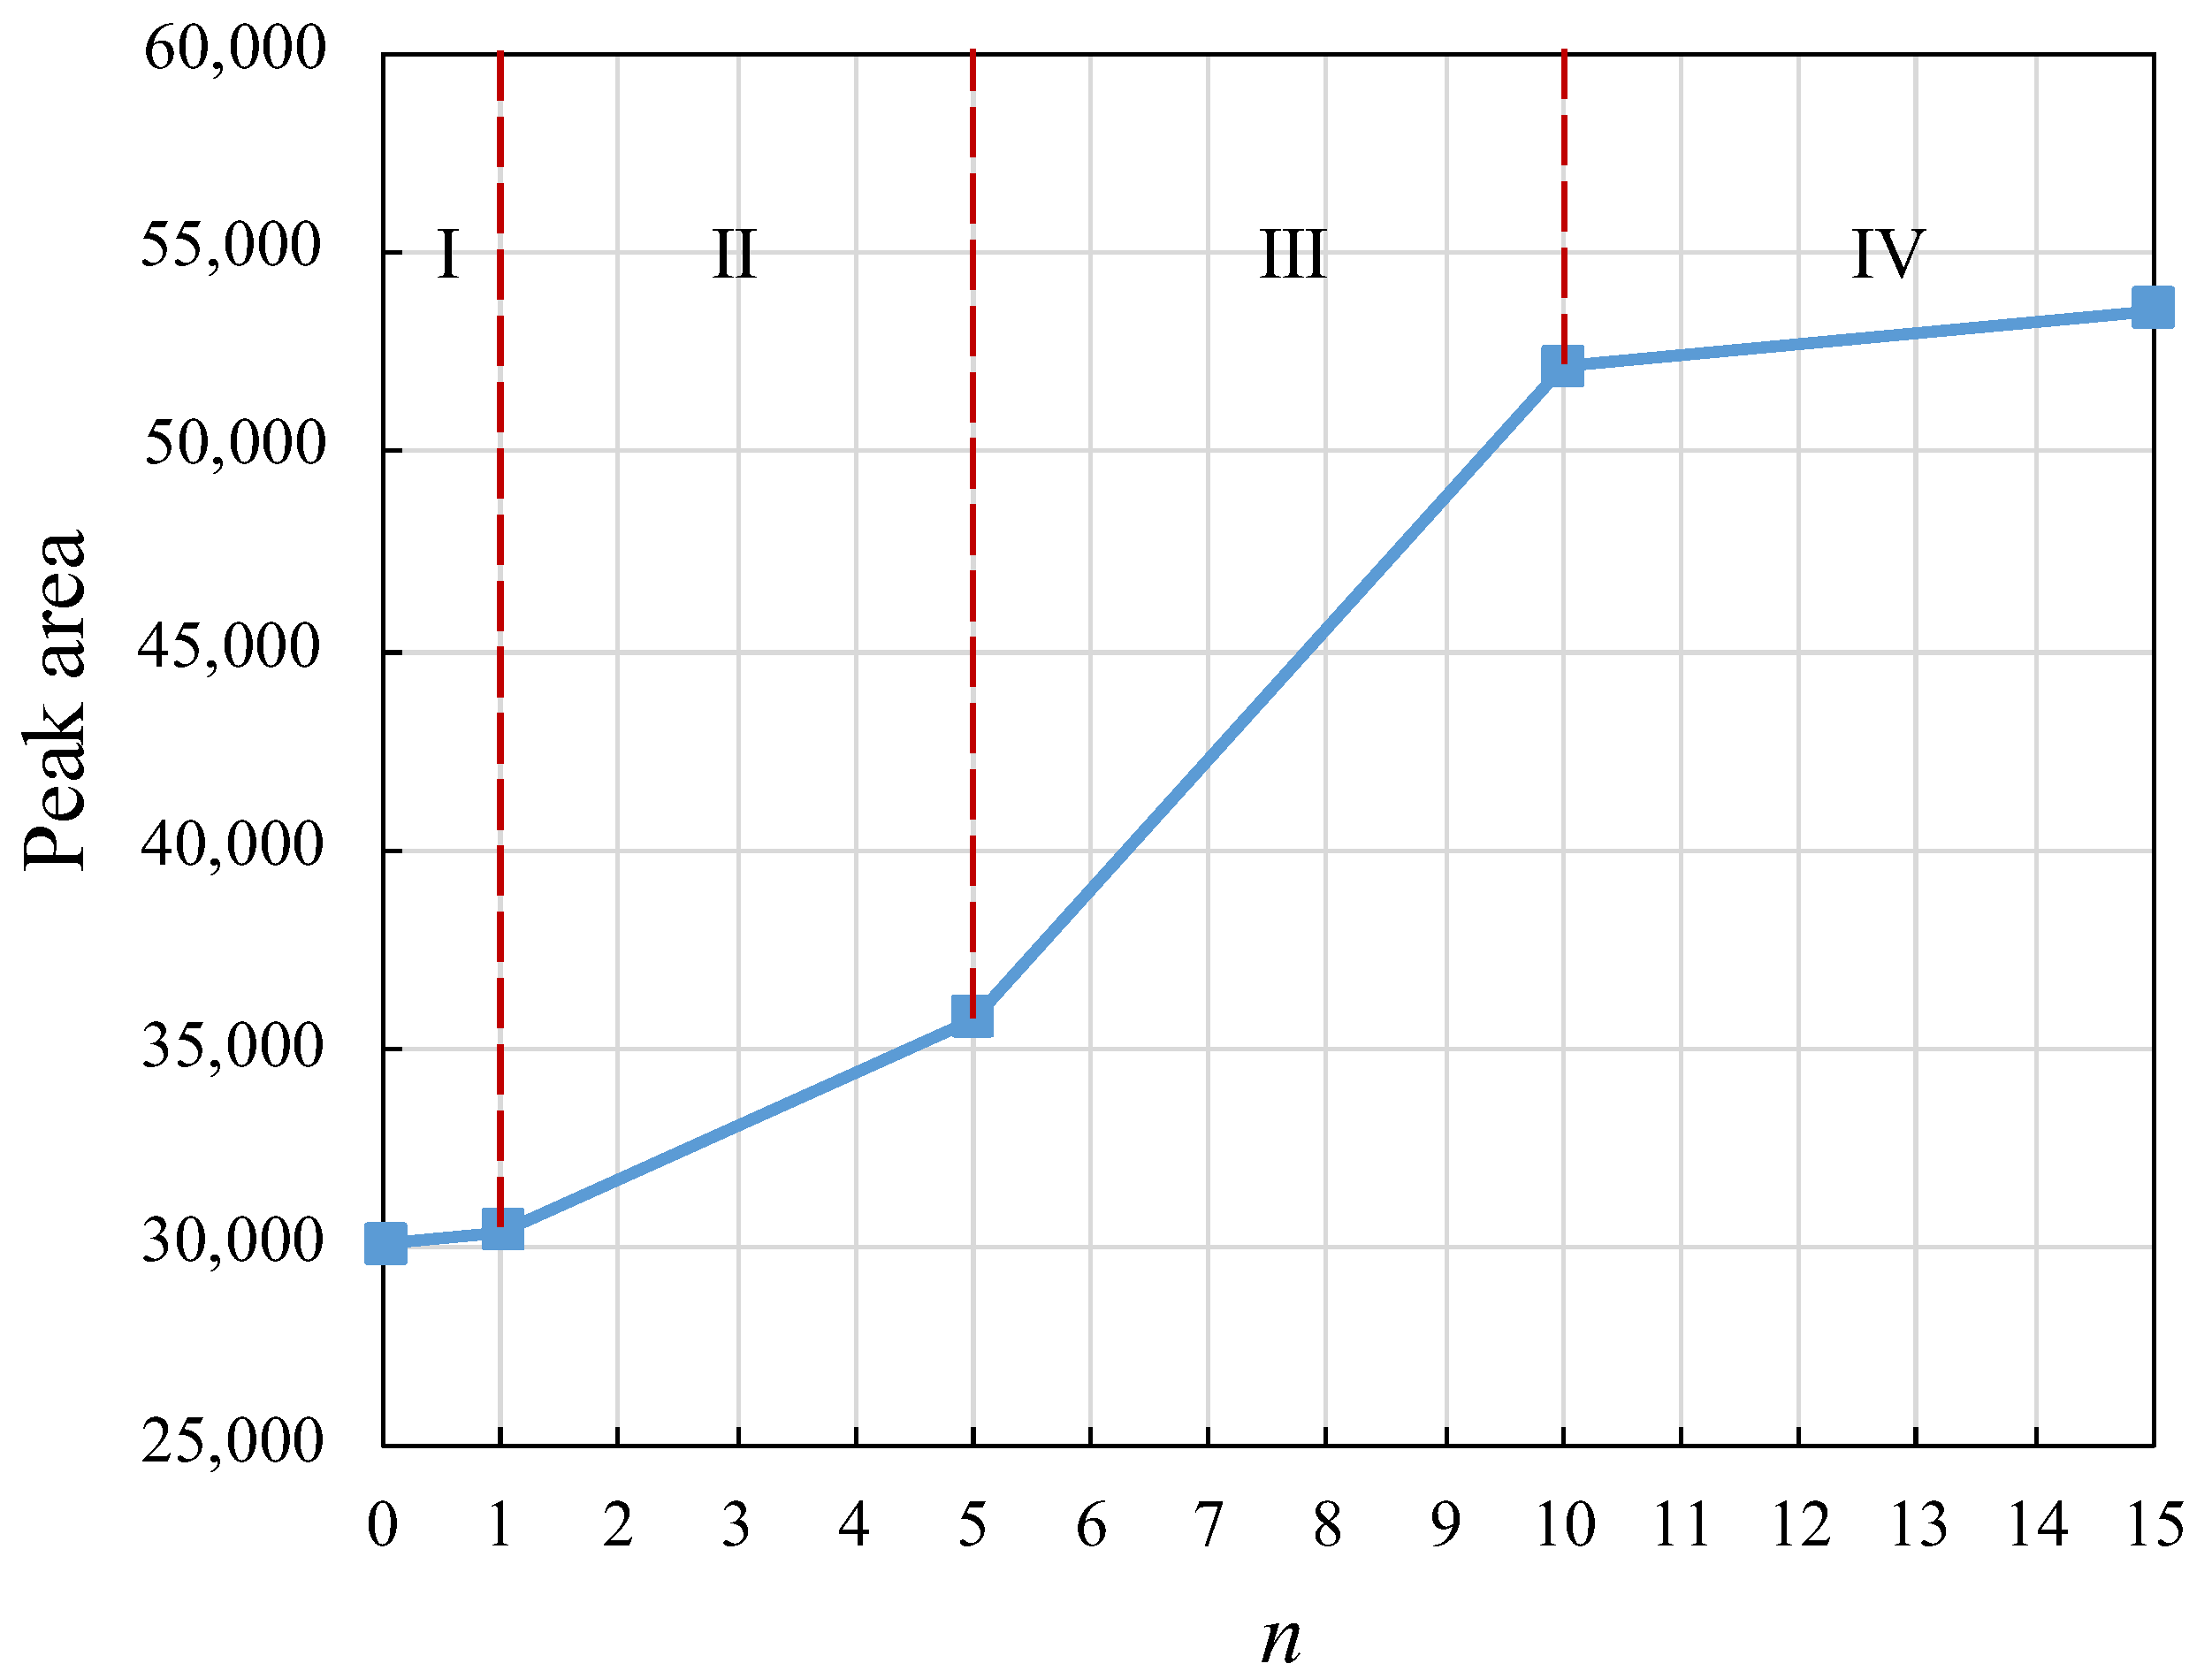
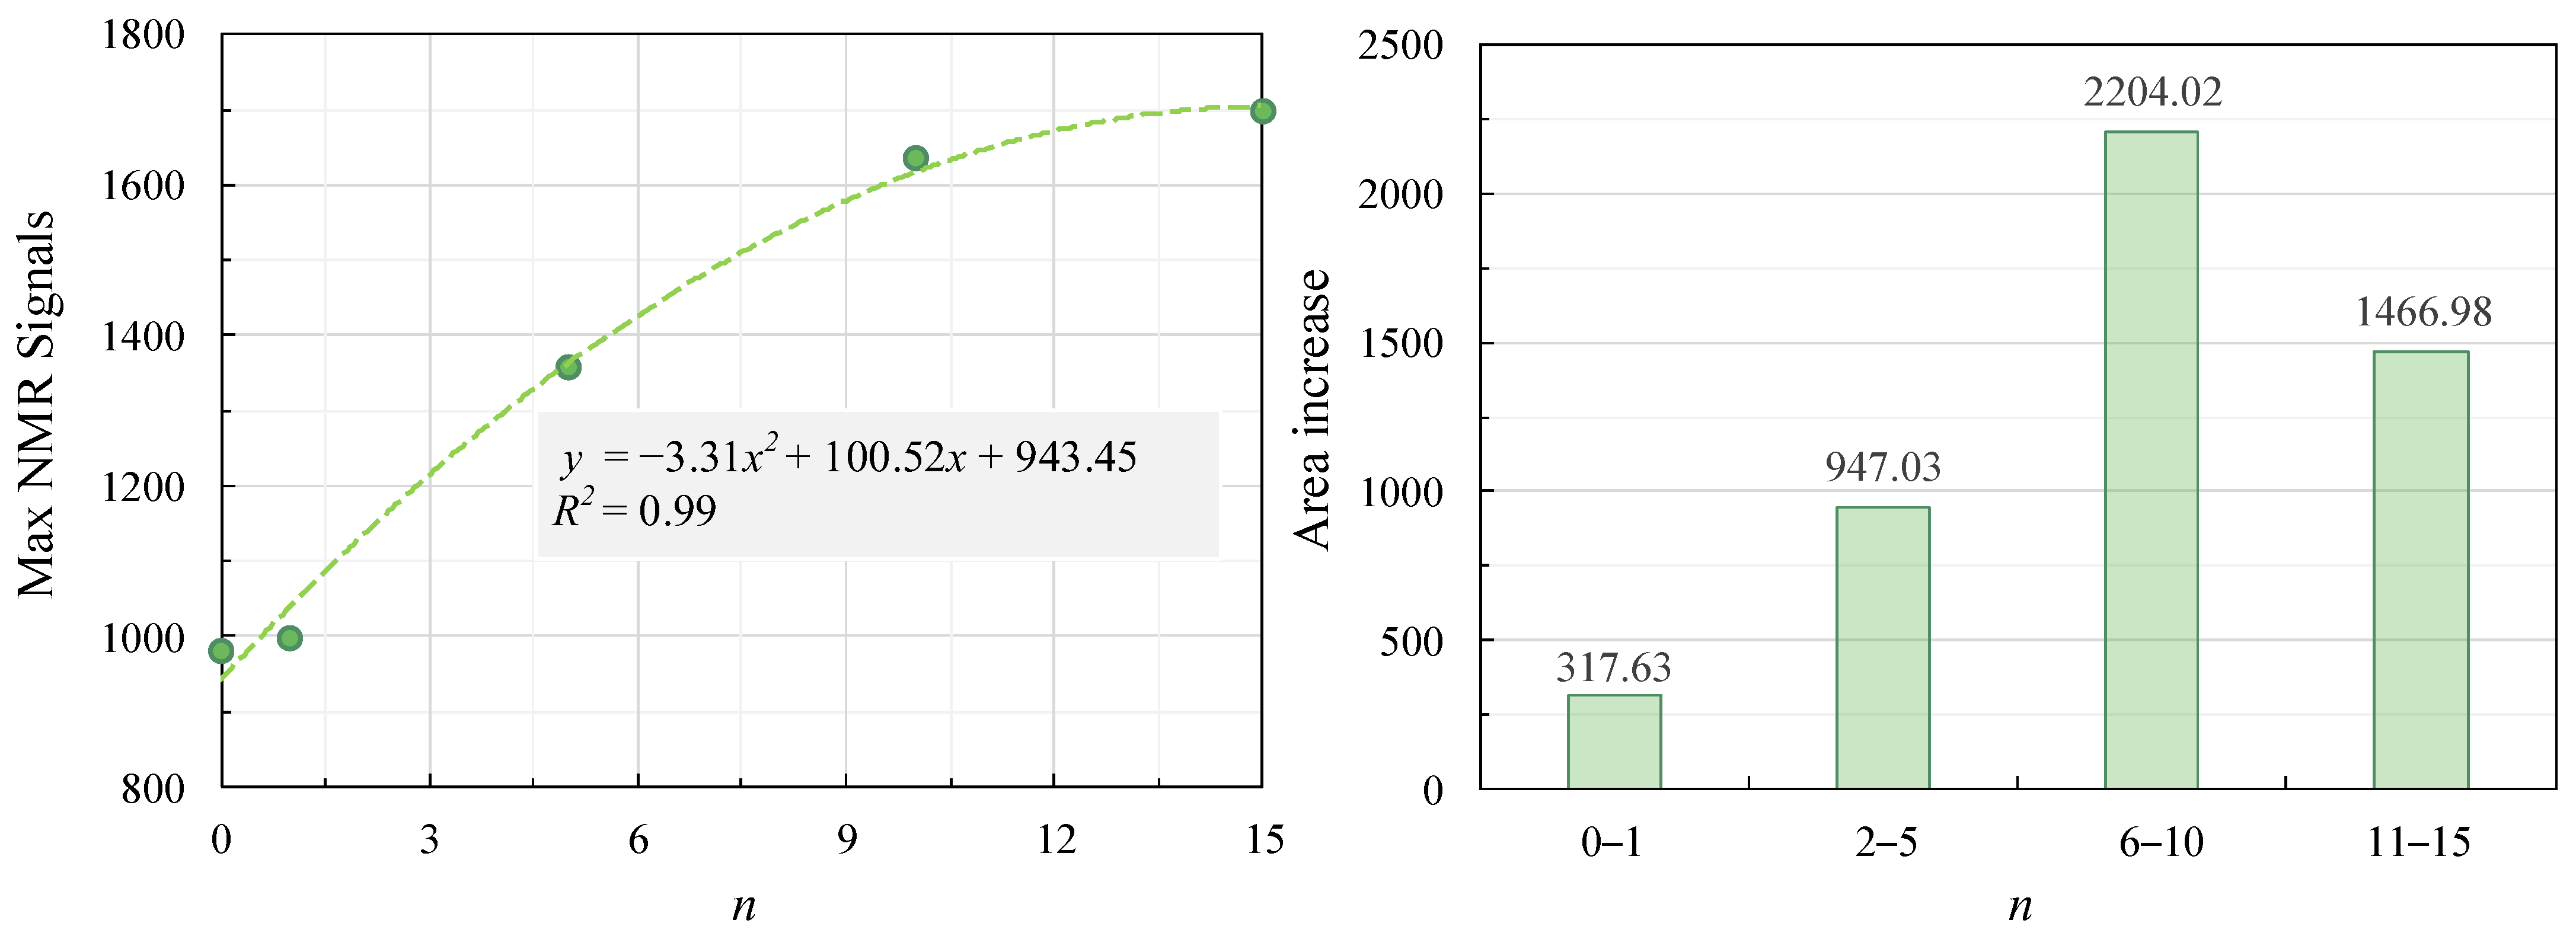
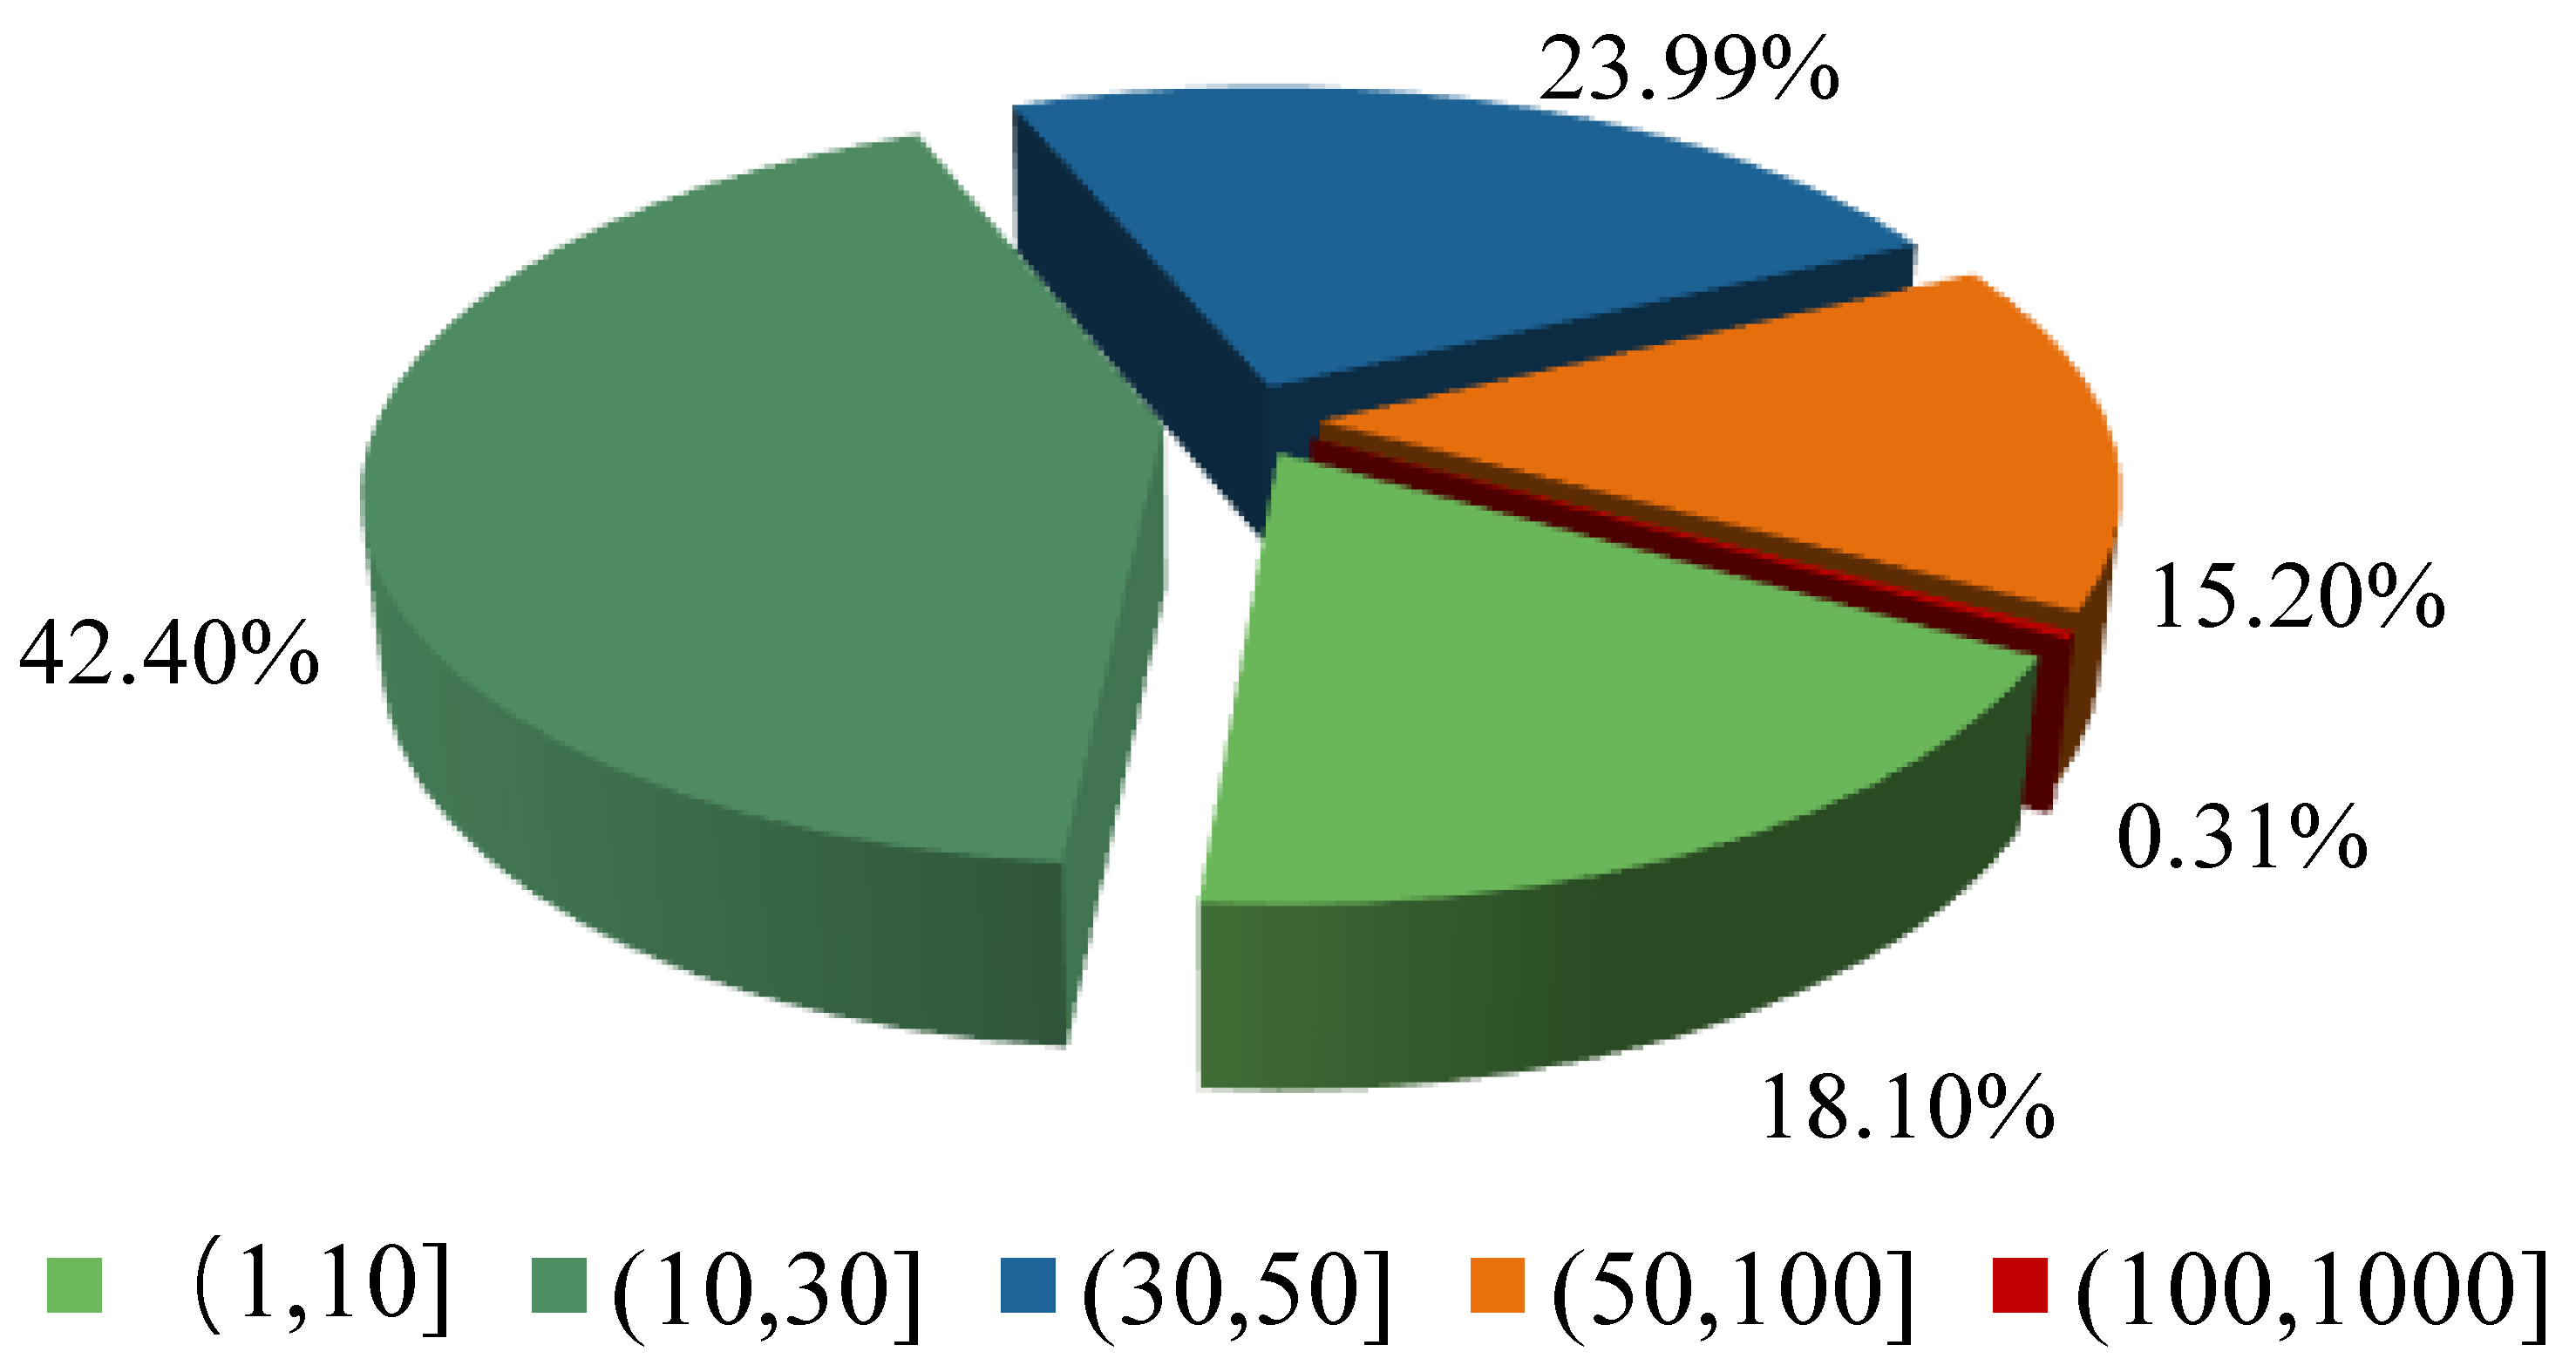
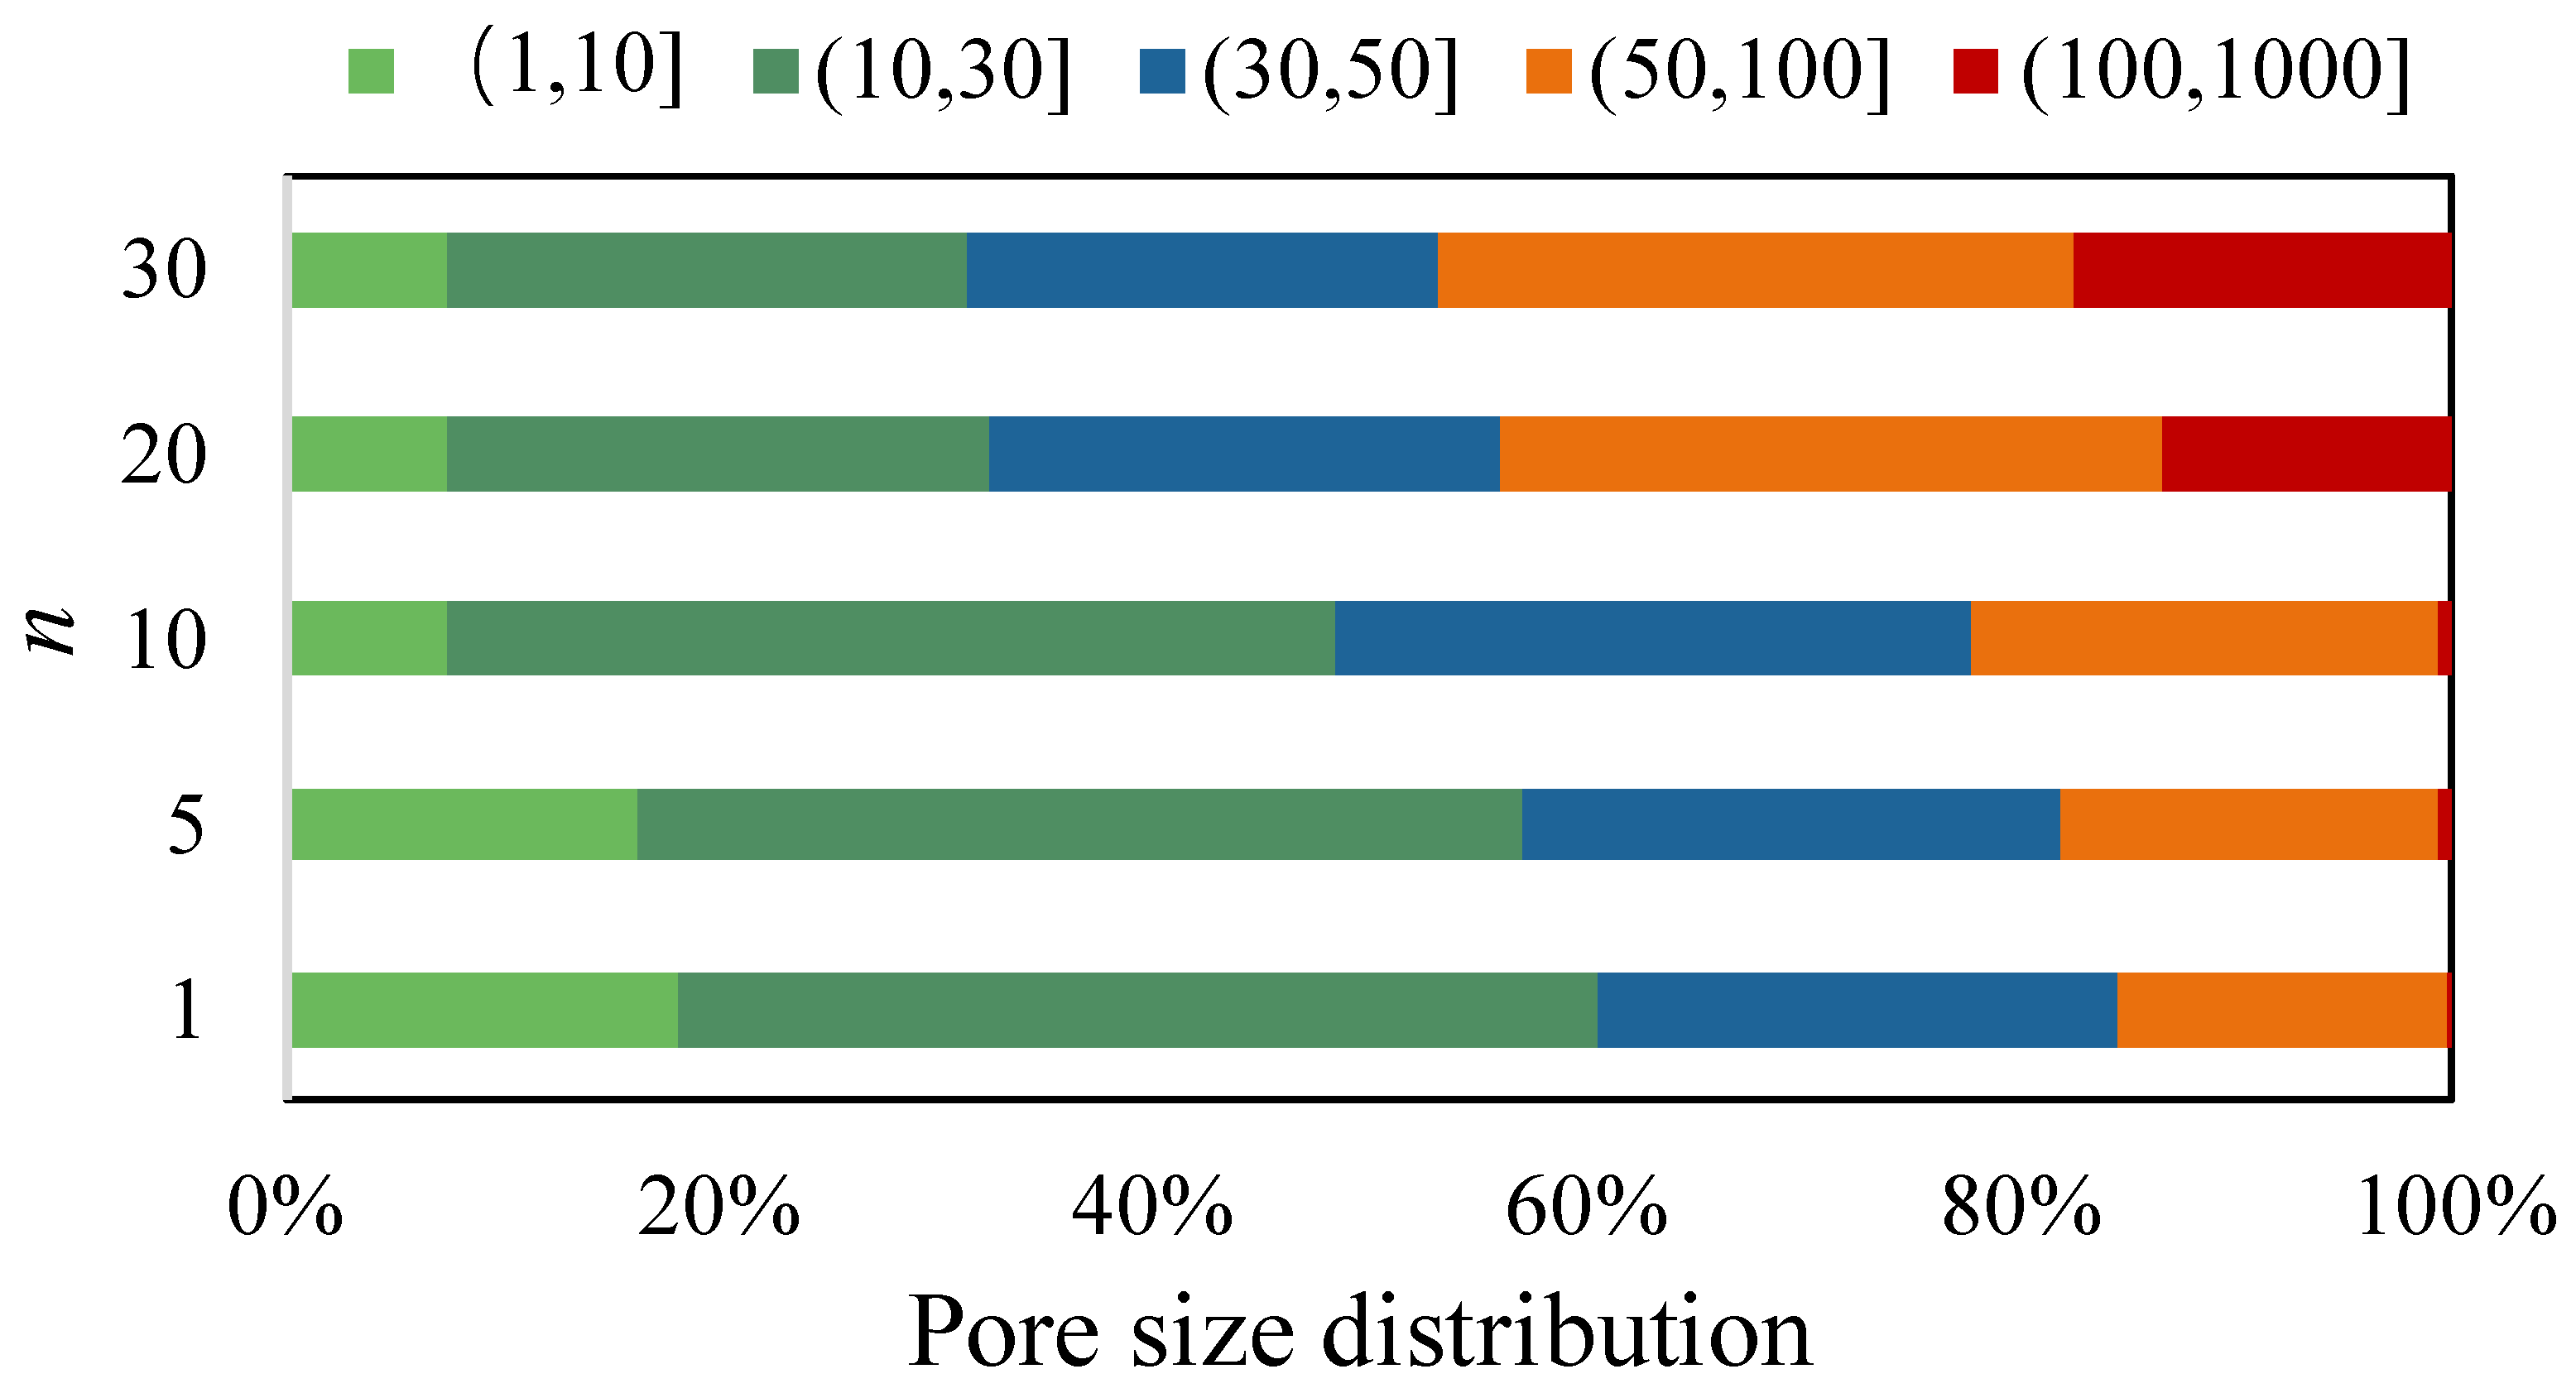
- The study in this paper utilized the NMR technique to determine the changes in the microporous structure of mudstone during the freeze–thaw process. The results indicated that the average pore size of mudstone increases as the number of freeze–thaw cycles increases. The process mainly affects the expansion of tiny pores, followed by medium and large pores. Additionally, the study found that the percentage of pores within the range of 50–100 nm increased with the number of freeze–thaw cycles, with the maximum gain observed between 6–10 cycles.
- (2)
- The uniaxial compression test confirmed the variations in the mudstone’s macroscopic mechanical properties. Both the uniaxial compressive strength and elastic modulus of the mudstone displayed a linear decrease as the number of freeze–thaw cycles increased.
- (3)
- The characteristics of mudstone damage changed with the increase in freeze–thaw cycles. The damaged sample gradually transformed from a shear mode with a single rupture surface to a double rupture surface with conjugate shear wear. Finally, it was transformed into tensile damage with multiple rupture surfaces.
- (4)
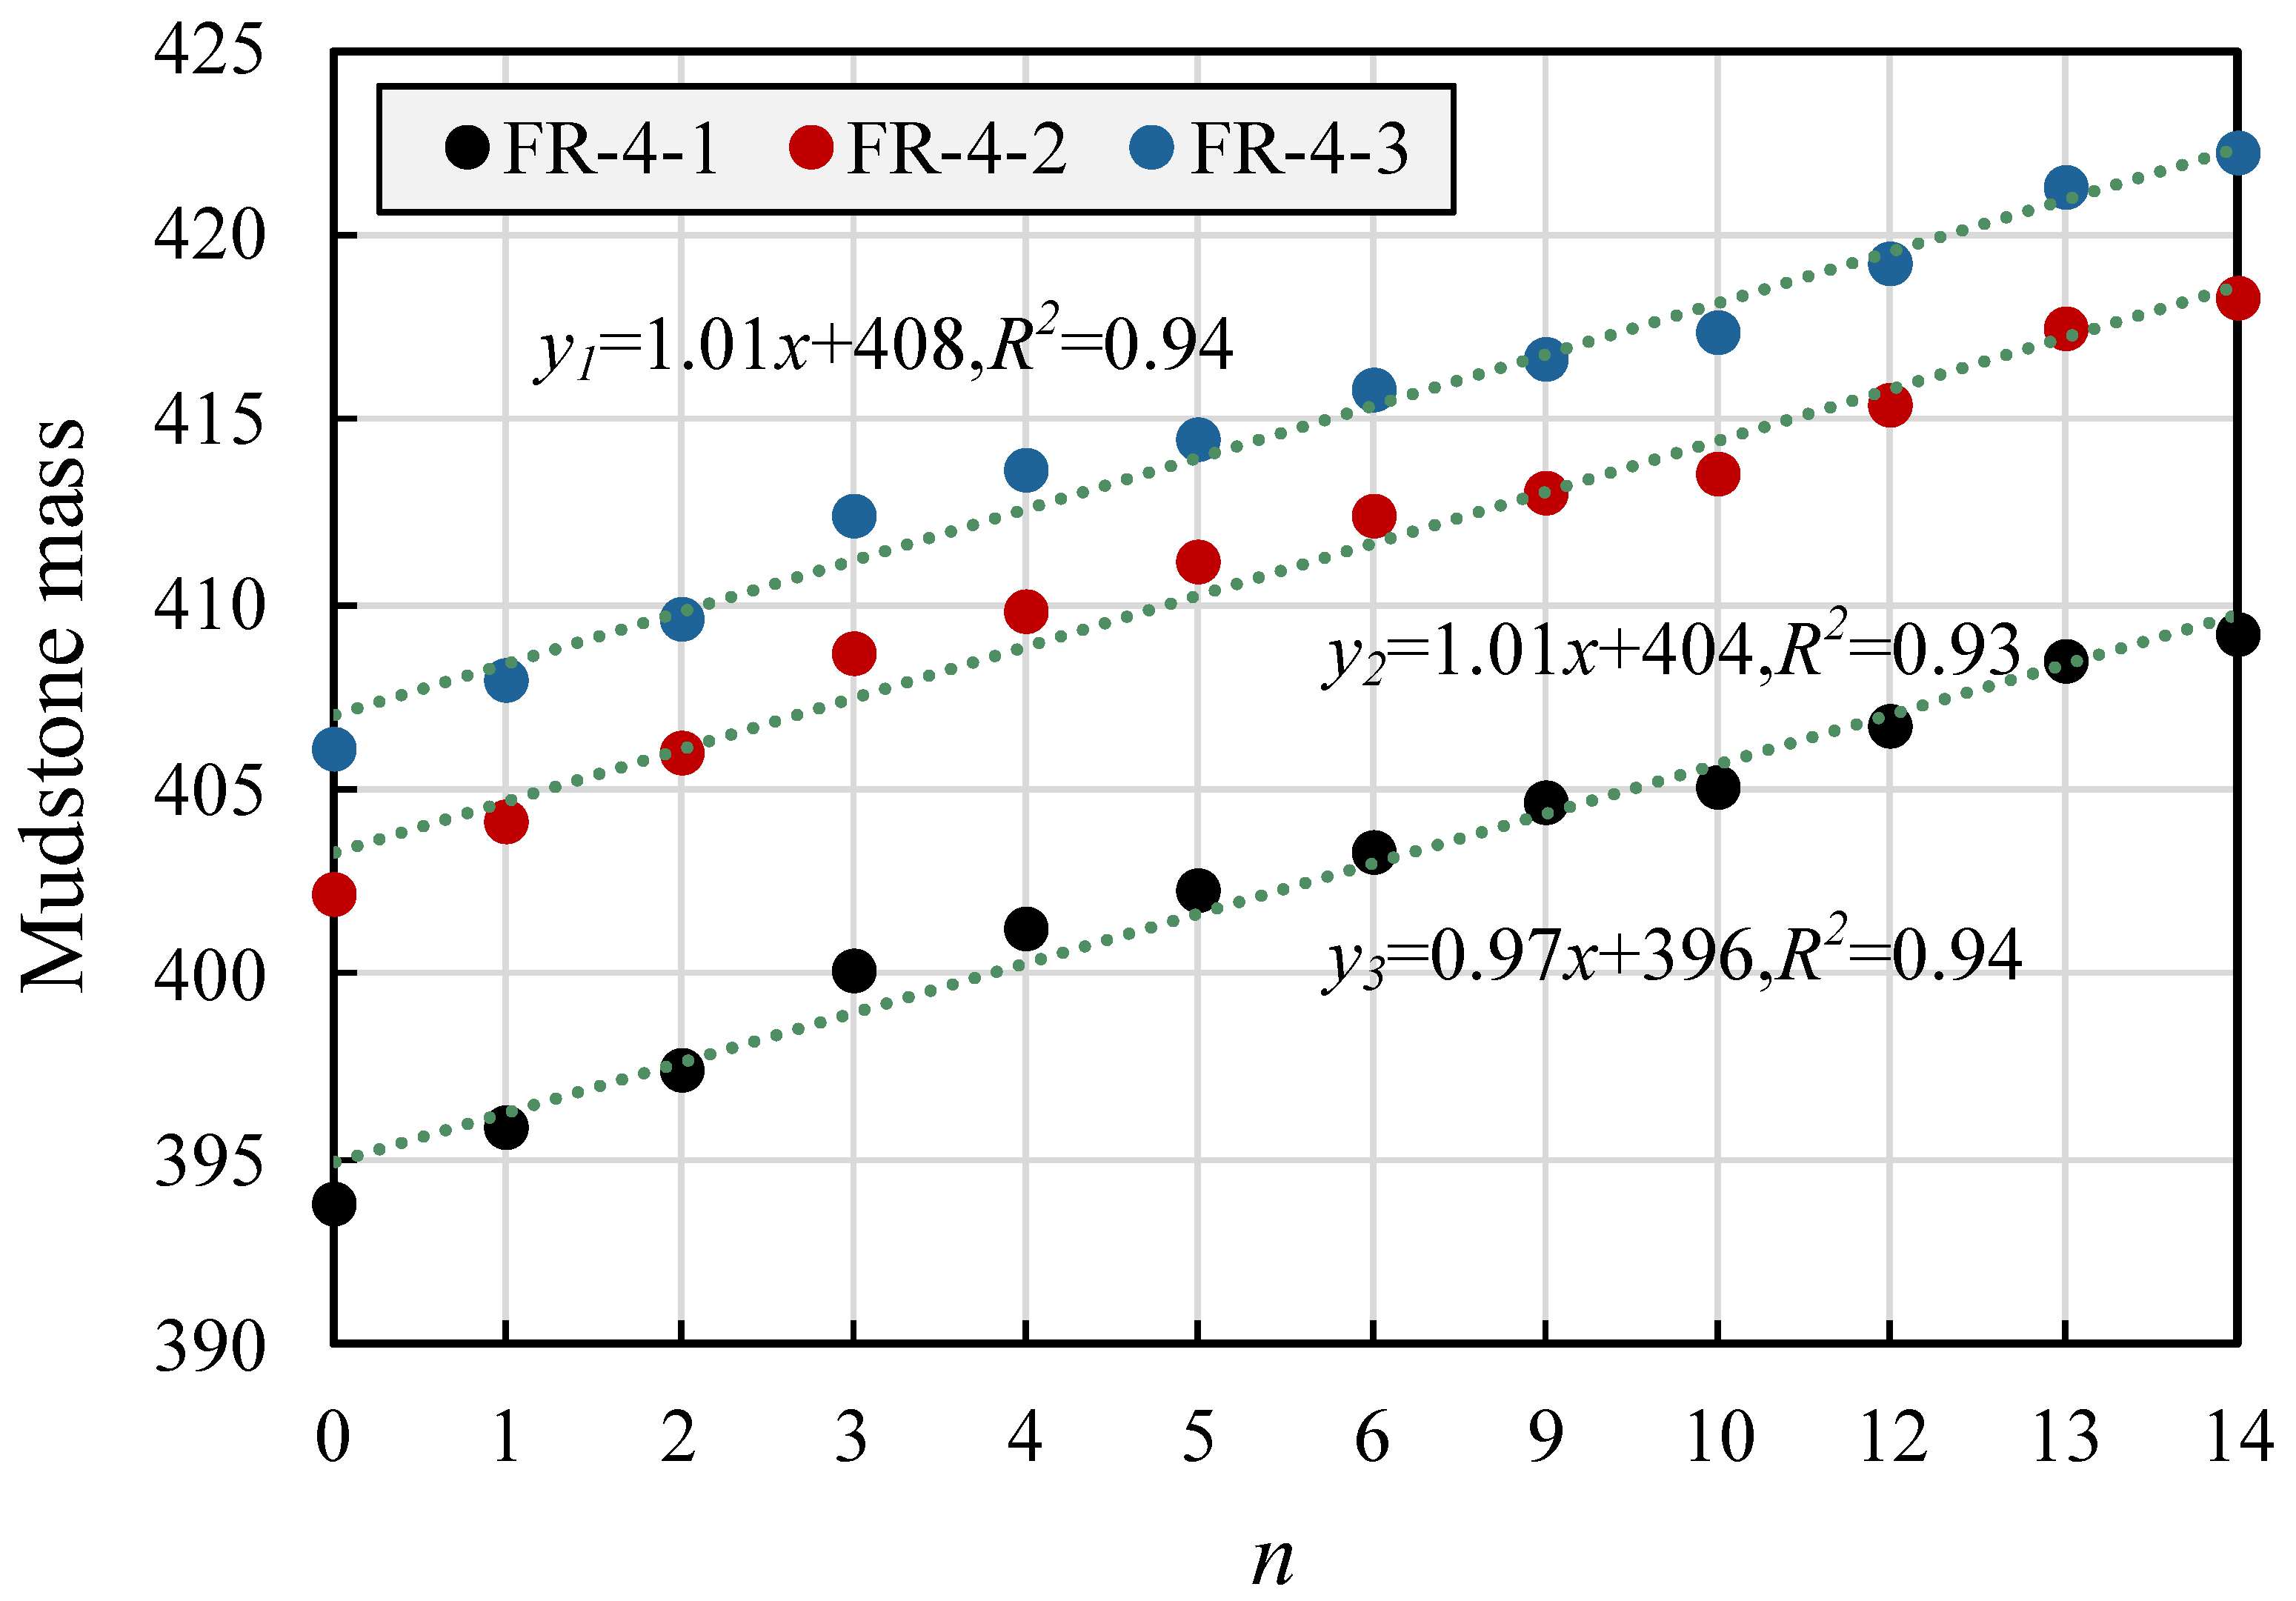
- The process of clay mineral hydration resulted in the expansion of interlayer and intergranular spaces, exerting pressure on the rock skeleton. This pressure caused the existing pores to widen and new pores to form. As a result, the average pore size of natural mudstone samples increased significantly more after freeze–thaw cycles than sealed samples.
- (5)
- The primary focus of this paper was to investigate the freeze–thaw damage of mudstone using NMR technology. The damage characteristics and micromechanisms of mudstone under different recharge conditions in open-pit mines were investigated. Currently, only the freeze–thaw damage mechanism of mudstone has been studied, but other lithologies in open-pit mines will be examined in the future. Additionally, the study aimed to explore the impact of freeze–thaw damage on slope stability.
Author Contributions
Funding
Institutional Review Board Statement
Informed Consent Statement
Data Availability Statement
Conflicts of Interest
References
- Zhou, Y.; Guo, D.; Qiu, G. Chinese Tundra; Science Press: Beijing, China, 2000; Volume 1–10. [Google Scholar]
- Mei, H.; Chen, Y.; Shi, X.; Gao, F.; Fei, T. Barriers and Strategies of Building Carbon Neutral in Cold Regions. Bull. Natl. Nat. Sci. Found. China 2023, 37, 364–371. [Google Scholar] [CrossRef]
- Ye, P. Study on Coal Resources Development Strategy in Xinjiang; Xi’an University of Science and Technology: Xi’an, China, 2011. [Google Scholar]
- Cao, X.; Lv, G.; Zhu, Y. Characteristics of China’s major metal mineral resources and regional distribution. Resour. Ind. 2004, 6, 22–24. [Google Scholar] [CrossRef]
- Cui, G.; Ma, J.; Wang, X.; Hou, Z.; Wang, D. Calculation method for frost heave force of tunnel with broken surrounding rock in seasonal frozen area and its engineering application. J. Southeast Univ. Nat. Sci. 2021, 51, 294–299. [Google Scholar]
- Liu, C.; Cui, Y.; Chen, C.; Lv, J.; Li, B.; Wang, L. Research on the south side landslide at west open-pit coal mine in Fushun City, Liaoning Province of China. Geol. Bull. China 2022, 41, 713–726. [Google Scholar] [CrossRef]
- Li, G.; Ma, W.; Wang, X.; Jin, H.; Wang, Y.; Zhao, Y.; Cai, Y.; Zhang, P. Frost hazards and mitigative measures following operation of Mohe-Daqing line of China-Russia crude oil pipeline. Rock Soil Mech. 2015, 36, 2963–2973. [Google Scholar] [CrossRef]
- Yang, H.; Liu, P.; Liu, B.; Yi, Z.; Wang, J.; Yue, Y. Study on damage mechanisms of the microstructure of sandy conglomerate at Maijishan grottoes under freeze-thaw cycles. Chin. J. Rock Mech. Eng. 2021, 40, 545–555. [Google Scholar] [CrossRef]
- Lu, X. Research on Freeze-Thaw Damage Mechanism of Mudstone Slope and Seasonal Control Mining Method in Open-pit Mines of Cold Regions; China University of Mining and Technology: Xuzhou, China, 2021. [Google Scholar]
- Martínez-Martínez, J.; Benavente, D.; Gomez-Heras, M.; Marco-Castaño, L.; García-del-Cura, M.Á. Non-linear decay of building stones during freeze–thaw weathering processes. Constr. Build. Mater. 2013, 38, 443–454. [Google Scholar] [CrossRef]
- Winkler, E.M. Frost damage to stone and concrete: Geological considerations. Eng. Geol. 1968, 2, 315–323. [Google Scholar] [CrossRef]
- Kodama, J.; Goto, T.; Fujii, Y.; Hagan, P. The effects of water content, temperature and loading rate on strength and failure process of frozen rocks. Int. J. Rock Mech. Min. Sci. 2013, 62, 1–13. [Google Scholar] [CrossRef]
- Liu, Z. Study on Damage Failure Mechanism of Jointed Rockmass under Freeze-Thaw Cycle Condition; China University of Geosciences: Wuhan, China, 2013. [Google Scholar]
- Rong, X.; Li, L.; Zheng, S.; Wang, F.; Huang, W.; Zhang, Y.; Lu, D. Freeze–thaw damage model for concrete considering a nonuniform temperature field. J. Build. Eng. 2023, 72, 106747. [Google Scholar] [CrossRef]
- Zhong, W.L.; Wang, G.; Xi, Y.; Fan, L.F. Damage evaluation of geopolymer under three freezing-thawing treatments with different freezing temperatures based on ultrasonic technique. J. Build. Eng. 2023, 69, 106268. [Google Scholar] [CrossRef]
- Haibin, M.; Chao, G.; Zhengran, L.; Zhihua, C. 3D mesoscale analysis of concrete containing defect damages during different freeze-thaw cycles. Constr. Build. Mater. 2022, 358, 129449. [Google Scholar]
- Ma, J.; Jin, J.; Wu, P.; Qin, Z.; Jia, B. Study on the pore structure characteristics and damage constitutive model of sandstone under freeze-thaw conditions. Front. Earth Sci. 2023, 11, 1095686. [Google Scholar] [CrossRef]
- Bo, S.; Xingyue, L.; Kai, C.; Ningbo, P.; Jie, H.; Rui, C.; Chen, J. Study on the Characteristics of Damaged Sandstone in the Longshan Grottoes Using Water Chemistry and Freeze–Thaw Cycling. Minerals 2023, 13, 430. [Google Scholar]
- Gao, F.; Wang, Q.; Deng, H.; Zhang, J.; Tian, W.; Ke, B. Coupled effects of chemical environments and freeze–thaw cycles on damage characteristics of red sandstone. Bull. Eng. Geol. Environ. 2017, 76, 1481–1490. [Google Scholar] [CrossRef]
- Tan, X.; Chen, W.; Yang, J.; Cao, J. Laboratory investigations on the mechanical properties degradation of granite under freeze-thaw cycles. Cold Reg. Sci. Technol. 2011, 68, 130–138. [Google Scholar] [CrossRef]
- Zhang, C.; Jin, X.; Hou, C.; He, J. Mechanical and acoustic emission characteristics of anhydrite rock under freeze-thaw cycles. J. Mt. Sci. 2023, 20, 227–241. [Google Scholar] [CrossRef]
- Jiaxu, J.; Xinlei, Z.; Xiaoli, L.; Yahao, L.; Shaohua, L. Study on critical slowdown characteristics and early warning model of damage evolution of sandstone under freeze–thaw cycles. Front. Earth Sci. 2023, 10, 1006642. [Google Scholar]
- Youzhen, Y.; Qingqing, L.; Hailong, M.; Jahanzaib, I.; Wei, L.; Yishen, Z.; Wenguo, M.; Gang, Z.; Hongbo, L. A Semi-Empirical Damage Model of Helankou Rocks Based on Acoustic Emission. Materials 2023, 16, 4001. [Google Scholar]
- Shixing, C.; Jianhong, L.; Kaifang, F.; Yuanyi, C.; Zeping, W. Study on the bonding performance between basalt textile and concrete under freeze-thaw cycles. Eng. Fail. Anal. 2023, 146, 107095. [Google Scholar]
- Sun, Y.; Zhai, C.; Xu, J.Z.; Cong, Y.Z.; Qin, L.; Zhao, C. Characterisation and evolution of the full size range of pores and fractures in rocks under freeze-thaw conditions using nuclear magnetic resonance and three-dimensional X-ray microscopy. Eng. Geol. 2020, 271, 105616. [Google Scholar] [CrossRef]
- Wang, Y.; Feng, W.K.; Wang, H.J.; Li, C.H.; Hou, Z.Q. Rock bridge fracturing characteristics in granite induced by freeze-thaw and uniaxial deformation revealed by AE monitoring and post-test CT scanning. Cold Reg. Sci. Technol. 2020, 177, 103115. [Google Scholar] [CrossRef]
- Zening, W.; Wei, Y.; Cheng, Z.; Yong, S.; Wei, T.; Aikun, C.; Hexiang, X.; Yu, W. Freezing characteristics and microstructural damage evolution of granular materials in cold regions under freezing–thawing cycles. Environ. Earth Sci. 2023, 82, 191. [Google Scholar]
- Jian, L.; Yi, Y.; Jianchao, Y.; Yang, L.; Xiangwei, L. Study on Pore Structure Evolution Characteristics of Weakly Cemented Sandstone under Freeze–Thaw Based on NMR. Water 2023, 15, 281. [Google Scholar]
- Wang, X.; Wu, Y.; Shen, X.; Wang, H.; Liu, S.; Yan, C. An experimental study of a freeze-thaw damage model of natural pumice concrete. Powder Technol. 2018, 339, 651–658. [Google Scholar] [CrossRef]
- Yaozeng, W.; Wencui, Y.; Yong, G.; Penghuan, L.; Ai, Z. Investigation on meso-debonding process of the sandstone–concrete interface induced by freeze–thaw cycles using NMR technology. Constr. Build. Mater. 2020, 252, 118962. [Google Scholar]
- GB/T 50266-2013; Standard for Test Methods of Engineering Rock Mass. China Planning Press: Beijing, China, 2013.
- Vasić, M.V.; Jantunen, H.; Mijatović, N.; Nelo, M.; Muñoz Velasco, P. Influence of coal ashes on fired clay brick quality: Random forest regression and artificial neural networks modeling. J. Clean. Prod. 2023, 407, 137153. [Google Scholar] [CrossRef]
- Li, J. Experiment Study on Deterioration Mechanism of Rockunder the Conditions of Freezing-Thawing Cycles in Coldregions Based on NMR Technology; Central South University: Changsha, China, 2012. [Google Scholar]
- DL/T 5368-2007; Code for Rock Tests of Hydroelectric and Water Conservancy Engineering. China Electric Power Press: Beijing, China, 2007.
- Jia, H.; Wang, T.; Xiang, W.; Tan, L.; Shen, Y.; Yang, G. Influence of water content on the physical and mechanical behaviour of argillaceous siltstone and some microscopic explanations. Chin. J. Rock Mech. Eng. 2018, 37, 1618–1628. [Google Scholar] [CrossRef]
- Fu, H.; Zha, H.; Zeng, L.; Gao, Q. Disintegration behavior and mechanism of carbonaceous mudstone under acidic corrosion and wetting-drying cycles. Bull. Eng. Geol. Environ. 2023, 82, 168. [Google Scholar] [CrossRef]
- Wu, S. TULIXUE, 1 ed.; Chongqing University Press: Chongqing, China, 2016; p. 241. [Google Scholar]


| Sample | Capacity (g/cm3) | Dry Density (g/cm3) | Content (%) | Porosity (%) |
|---|---|---|---|---|
| Mudstone | 2.04 | 1.98 | 2.89 | 3.34 |
| Ingredient | Quartz | Illite | Chlorite | Potash Feldspar | Albite | Kaolin |
|---|---|---|---|---|---|---|
| Percentage (%) | 23 | 47 | 8 | 5 | 7 | 10 |
| Formula | SiO2 | Al2O3 | Fe2O3 | K2O | MgO | Na2O | TiO2 | CaO | LOI |
|---|---|---|---|---|---|---|---|---|---|
| Percentage (%) | 57.42 | 18.76 | 4.90 | 1.90 | 1.41 | 0.87 | 0.80 | 0.70 | 13.24 |
| No. | Title | Equipment Type | Manufacturer |
|---|---|---|---|
| 1 | Ultrasonic wave velocity measuring instrument | HS-YS4A | Beijing Jinyang Wanda Technology Co., Beijing, China |
| 2 | Automatic freeze–thaw cycle tester | JC-ZDR-5 | Fushun Xinfu Xinyuan Electromechanical Instrument Factory, Fushun, China |
| 3 | Electronic universal testing machine | WDW-300 | Jinan Chengyu Testing Equipment Co., Ltd., Jinan, China |
| 4 | Nuclear magnetic resonance core analyzer | MacroMR12-150H-I | NIUMAG, Shanghai, China |
| Environmental Conditions | Number of Freeze–Thaw Cycles (n) | |||||
|---|---|---|---|---|---|---|
| 0 | 1 | 5 | 10 | 20 | 30 | |
| Sealed mudstone | I | FS-1 | FS-2 | FS-3 | FS-4 | FS-5 |
| Natural mudstone | FR-1 | FR-2 | FR-3 | FR-4 | FR-5 | |
| Number of Freeze–Thaw Cycles | 0 | 1 | 5 | 10 | 20 | 30 |
|---|---|---|---|---|---|---|
| Freeze–thaw coefficient | 1.000 | 0.926 | 0.877 | 0.789 | 0.579 | 0.460 |
Disclaimer/Publisher’s Note: The statements, opinions and data contained in all publications are solely those of the individual author(s) and contributor(s) and not of MDPI and/or the editor(s). MDPI and/or the editor(s) disclaim responsibility for any injury to people or property resulting from any ideas, methods, instructions or products referred to in the content. |
© 2023 by the authors. Licensee MDPI, Basel, Switzerland. This article is an open access article distributed under the terms and conditions of the Creative Commons Attribution (CC BY) license (https://creativecommons.org/licenses/by/4.0/).
Share and Cite
Lu, X.; Qi, X.; Tian, Y.; Li, R.; Wang, Z.; Tu, L.; Zhang, Z. Characterization of Freeze-Thaw Cycle Damage to Mudstone in Open Pit in Cold Regions—Based on Nuclear Magnetic Resonance Method. Appl. Sci. 2023, 13, 12264. https://doi.org/10.3390/app132212264
Lu X, Qi X, Tian Y, Li R, Wang Z, Tu L, Zhang Z. Characterization of Freeze-Thaw Cycle Damage to Mudstone in Open Pit in Cold Regions—Based on Nuclear Magnetic Resonance Method. Applied Sciences. 2023; 13(22):12264. https://doi.org/10.3390/app132212264
Chicago/Turabian StyleLu, Xiang, Xiang Qi, Ya Tian, Rui Li, Zhile Wang, Lixiao Tu, and Zhiyuan Zhang. 2023. "Characterization of Freeze-Thaw Cycle Damage to Mudstone in Open Pit in Cold Regions—Based on Nuclear Magnetic Resonance Method" Applied Sciences 13, no. 22: 12264. https://doi.org/10.3390/app132212264