Article

Mesoscopic Damage and Fracture Characteristics of Hard Rock under High-Frequency Ultrasonic Vibration Excitation

Jiangsu Engineering Laboratory of Mine Earthquake Monitoring and Prevention, School of Mines, China University of Mining and Technology, Xuzhou 221116, China
*
Author to whom correspondence should be addressed.
Appl. Sci. 2023, 13(22), 12424; https://doi.org/10.3390/app132212424
Submission received: 17 October 2023 / Revised: 6 November 2023 / Accepted: 15 November 2023 / Published: 17 November 2023
(This article belongs to the Section Acoustics and Vibrations)

Abstract

:
Ultrasonic high-frequency vibrational fracture technology can compensate for the deficiencies of traditional fracture methods and has promising applications in underground rock drilling engineering. In this study, ultrasonic high-frequency vibrational tests were performed on brittle fine-grained red sandstone in combination with CT real-time scanning, which revealed mesoscopic fracture processes in the rock. Digital image processing technology is used to identify and extract the pores of CT images, and the pore evolution law of rock slices at different layers under ultrasonic vibration excitation is quantitatively studied. The results show that the increase in porosity decreases with increasing distance from the excitation surface, with the lowest layers of the rock showing an increase in porosity of only 0.22%. In addition, a mechanical model of rock breaking by ultrasonic vibrations was derived to explain the non-uniform damage mechanism of rock space under ultrasonic vibration excitation.

1. Introduction

The demand for resources is escalating annually. The depletion of shallow reserves has compelled a gradual transition in the exploitation of mineral resources towards deeper layers [1]. The intricate stress environment of deep formations exacerbates the challenges associated with fracturing the inner hard rock. For instance, the primary rock-breaking methods employed in underground coal mining encompass drilling and blasting, as well as mechanical approaches. However, as the mining depth surpasses 1000 m, the conventional drilling and blasting technique becomes increasingly ineffective. Conversely, the mechanical rock-breaking method generally encounters issues such as elevated wear rate and low efficiency, hindering the promotion of industrial development. Consequently, there is an urgent need to unearth a novel, efficient rock-breaking method.
The utilization of ultrasonic high-frequency vibrations for rock fragmentation represents a novel approach in this field. Compared to conventional rock fragmentation methods, the advantages of ultrasonic vibration technology are multifaceted: Firstly, rocks exposed to high-frequency impact loads in excess of 20,000 times per second rapidly develop fatigue damage, thereby reducing the challenges associated with fragmentation. Secondly, when the natural frequency of the rock aligns with the vibrational excitation frequency, resonance effects occur, increasing the likelihood of rock fragmentation. Lastly, the implementation of ultrasonic vibrational rock fragmentation is relatively straightforward mechanistically. Overall, ultrasonic vibrational rock fragmentation effectively compensates for the shortcomings of traditional methods and holds significant potential for application in deep underground rock fragmentation engineering.
Ultrasonic vibrational fracture technology has been successfully implemented in space drilling sampling [2,3,4] and oil exploration [5] due to its high efficiency, offering a novel approach for the efficient fracturing of hard rock formations. Wiercigroch was the first to integrate ultrasonic high-frequency axial vibrations with conventional rock breaking, significantly enhancing drilling rates [6]. Utilizing numerical simulations, Zhao discovered that the wear rate of the drill bit and rock decreases under high-frequency ultrasonic vibrations [7]. Fernando demonstrated that the drill bit drilling speed under high-frequency ultrasonic vibrations surpasses that of conventional drilling methods by constructing mechanical models and conducting test analyses [8,9]. The aforementioned studies validate the feasibility of the ultrasonic vibration-enabled rock-breaking method.
In recent years, an abundance of research has been conducted on the damage and fracture behavior of rocks under cyclic loading. However, the majority of these studies have been limited to frequencies below 100 Hz, with only a scarce number of investigations focusing on high-frequency ultrasonic vibrational rock fracture. To fill this gap, some researchers have developed specialized testing platforms. Laboratory experiments, theoretical analyses, and numerical computations have been employed to explore the failure properties and fracture laws of hard rocks subjected to high-frequency ultrasonic vibrations. Using electron microscopy scanning techniques, Zhao elucidated that the mechanism governing the propagation of granite microcracks under ultrasonic vibration excitation is tensile failure [10]. Zhang employed an infrared thermal imager to monitor the changes in the infrared radiation of the rock under ultrasonic vibration excitation, thereby categorizing the rock into fracture zones [11]. Han examined the properties of granite damage at varying amplitudes and discovered that stress waves generated by ultrasound vibrations attenuate with the increasing depth of the rock, and that augmenting the amplitude value results in amplified stress in the region [12]. Utilizing fragile red sandstone as the primary research specimen, Zhang conducted an investigation on the dynamic progression of rock pores under the influence of ultrasonic high-frequency vibration. Employing nuclear magnetic resonance (NMR) technology, he demonstrated that such vibration generates local tensile stress, encourages micropore inception, and expedites pore expansion [13]. Zhou conducted a thorough strain monitoring study on the rock sample during ultrasonic vibration excitation, and discovered that the rock experienced three distinct processes of elastic deformation, plastic deformation, and damage progression [14]. Zhang revealed the energy dissipation law of brittle red sandstone under ultrasonic vibration excitation with different static loads [15]. Zhou developed a constitutive model for fatigue damage in granite under ultrasonic vibrational stimulation, and its accuracy was validated via PFC2D numerical simulations [16]. Li employed numerical simulations to investigate the deformation and displacement characteristics of rocks subject to high-frequency harmonic dynamic loads, revealing that the fracture scope and degree of damage for rocks under combined dynamic and static loads are more extensive [17].
Currently, the majority of ultrasonic vibrational fracture tests are conducted on granite, as the lithology of this hard rock is relatively straightforward. Moreover, most studies have investigated the overall crushing effects of rock, employing drilling speed as an evaluation metric to examine the influence of ultrasonic vibration parameters on rock crushing efficiency. A few studies have also employed nuclear magnetic resonance to investigate the microscopic damage properties of rocks. The current research on ultrasonic vibration fracture is primarily based on granite, with the lithology of hard rock being relatively straightforward. Most studies evaluate the influence of ultrasonic vibration parameters on rock crushing efficiency by examining the macroscopic damage degree of the rock and the drilling rate of the bit. However, few studies have investigated the progressive damage and fracture process of rock under ultrasonic vibration load from a microscopic perspective. Although some scholars have analyzed the microscopic damage characteristics of rocks using nuclear magnetic resonance (NMR) technology, the NMR T2 spectrum can only display the overall distribution of pores of various sizes within rocks, but cannot accurately determine the pore development characteristics of specific rock regions. The research on the visual monitoring and quantitative analysis of pore and fracture development in different rock regions under ultrasonic vibration is currently limited. Moreover, rocks must be treated with water prior to the NMR test, which could degrade the rock’s mechanical properties due to long-term water-rock interaction, and potentially affect the test results. Computed tomography (CT) scanning technology can be employed to non-destructively monitor the rock’s micropore fracture structure under different vibration excitation stages without influencing the rock’s mechanical properties, thereby improving test accuracy. As such, this study focuses on hard and brittle red sandstone as the research object, performs ultrasonic high-frequency vibration excitation tests, and combines CT scanning and digital image processing techniques to conduct qualitative and quantitative analyses of pore and fracture evolution in various rock layers under ultrasonic high-frequency vibration load, ultimately revealing the non-uniform damage and fracture patterns within rock space under ultrasound.

2. Materials and Methods

2.1. Experimental Procedures

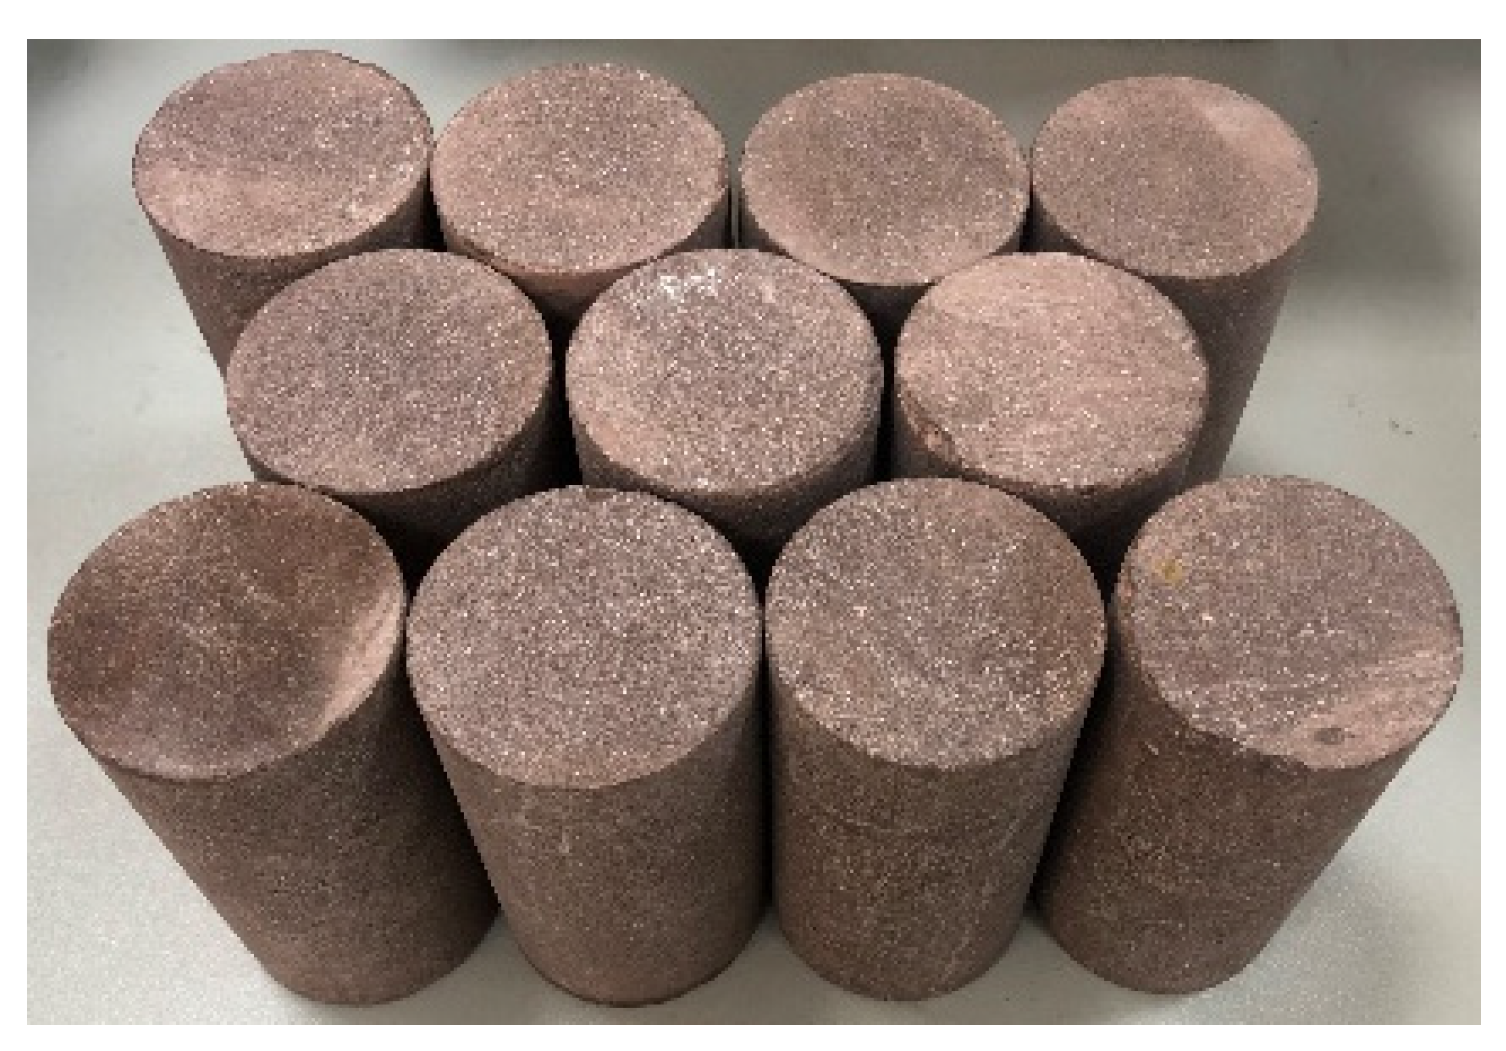
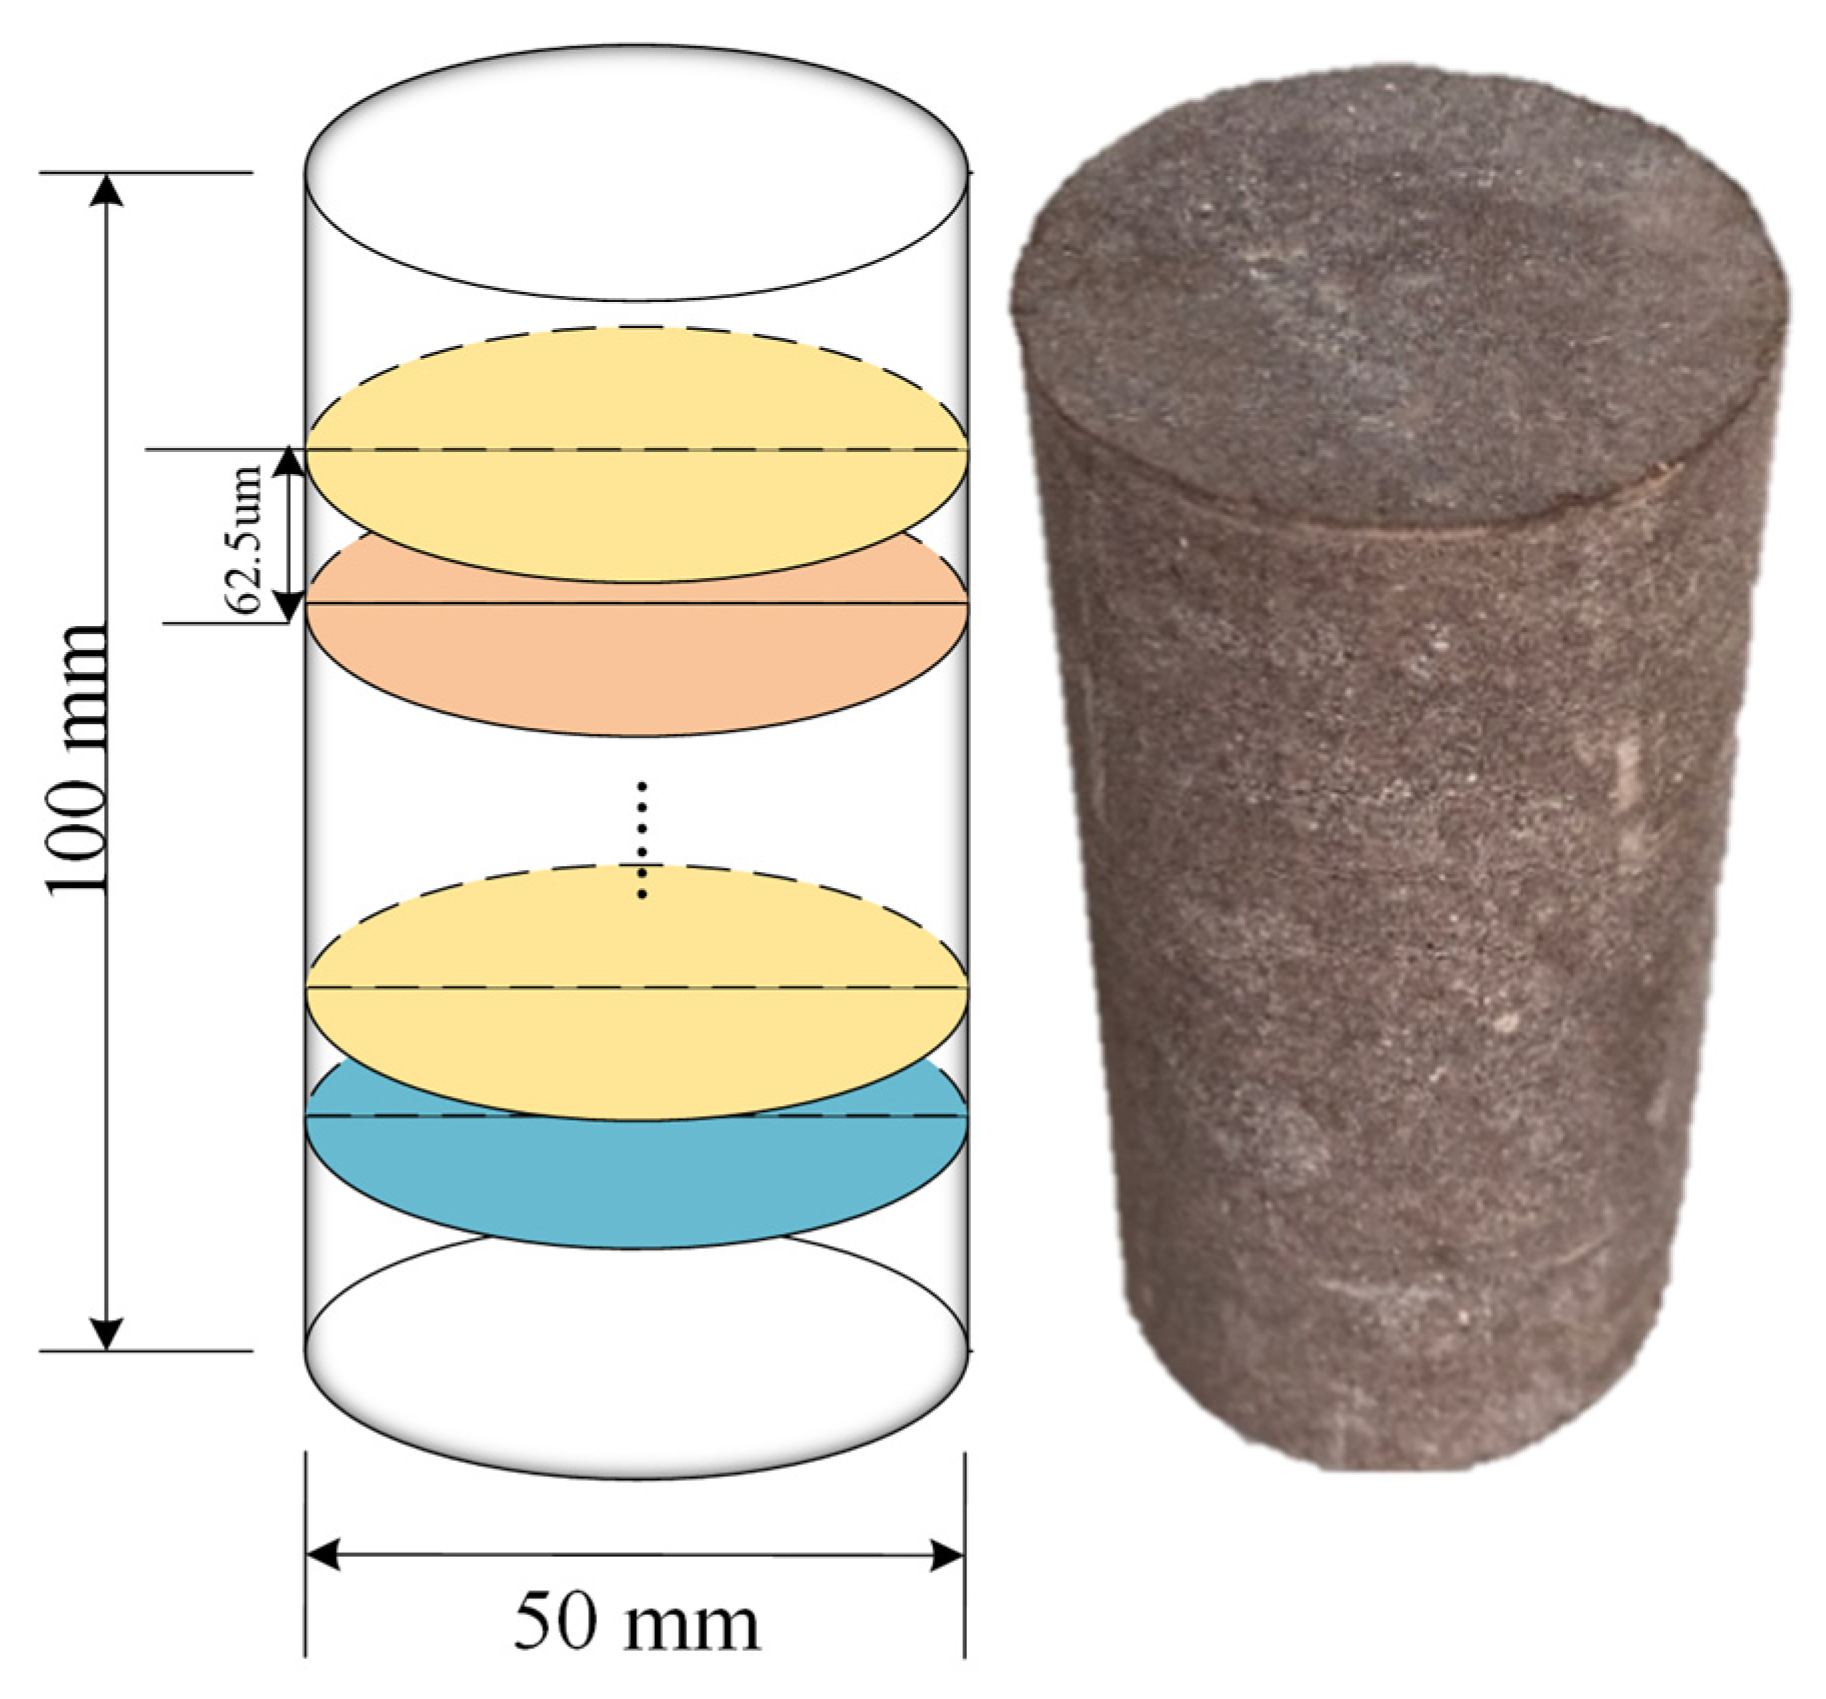
2.1.1. Sample Preparation

The fine-grained red sandstone, characterized by its hardness and brittleness, was selected for testing. The rock sample was extracted from Sichuan Province, China, and processed into a standard cylinder shape with a diameter of 50 mm and a height of 100 mm, as depicted in Figure 1. The dimensions, parallelism, and perpendicularity of the rock sample adhered to the ISRM standard (International Society of Rock Mechanics) [18]. Measurements of the physical parameters of the rock samples were conducted. The average density of the red sandstone samples, without ultrasonic vibration excitation, is 2.7 g/cm3, and the average P-wave velocity is 4110 m/s. The fundamental mechanical parameters of the rock samples were derived from the uniaxial compression test. The average uniaxial compressive strength and elastic modulus stand at 92.5 MPa and 5.4 GPa, respectively. The natural frequency of the rock samples, determined by the tapping method, is 11,625 Hz [15].
The three red sandstone samples were meticulously chosen and subjected to a saturation treatment for a duration of 48 h prior to undergoing nuclear magnetic resonance testing. As illustrated in Figure 2, the average porosity of the fragile red sandstone, before ultrasonic vibration excitation, was 6.4%. This finding can be employed subsequent to this study to corroborate the precision of the method of extracting rock pores via digital image processing techniques.

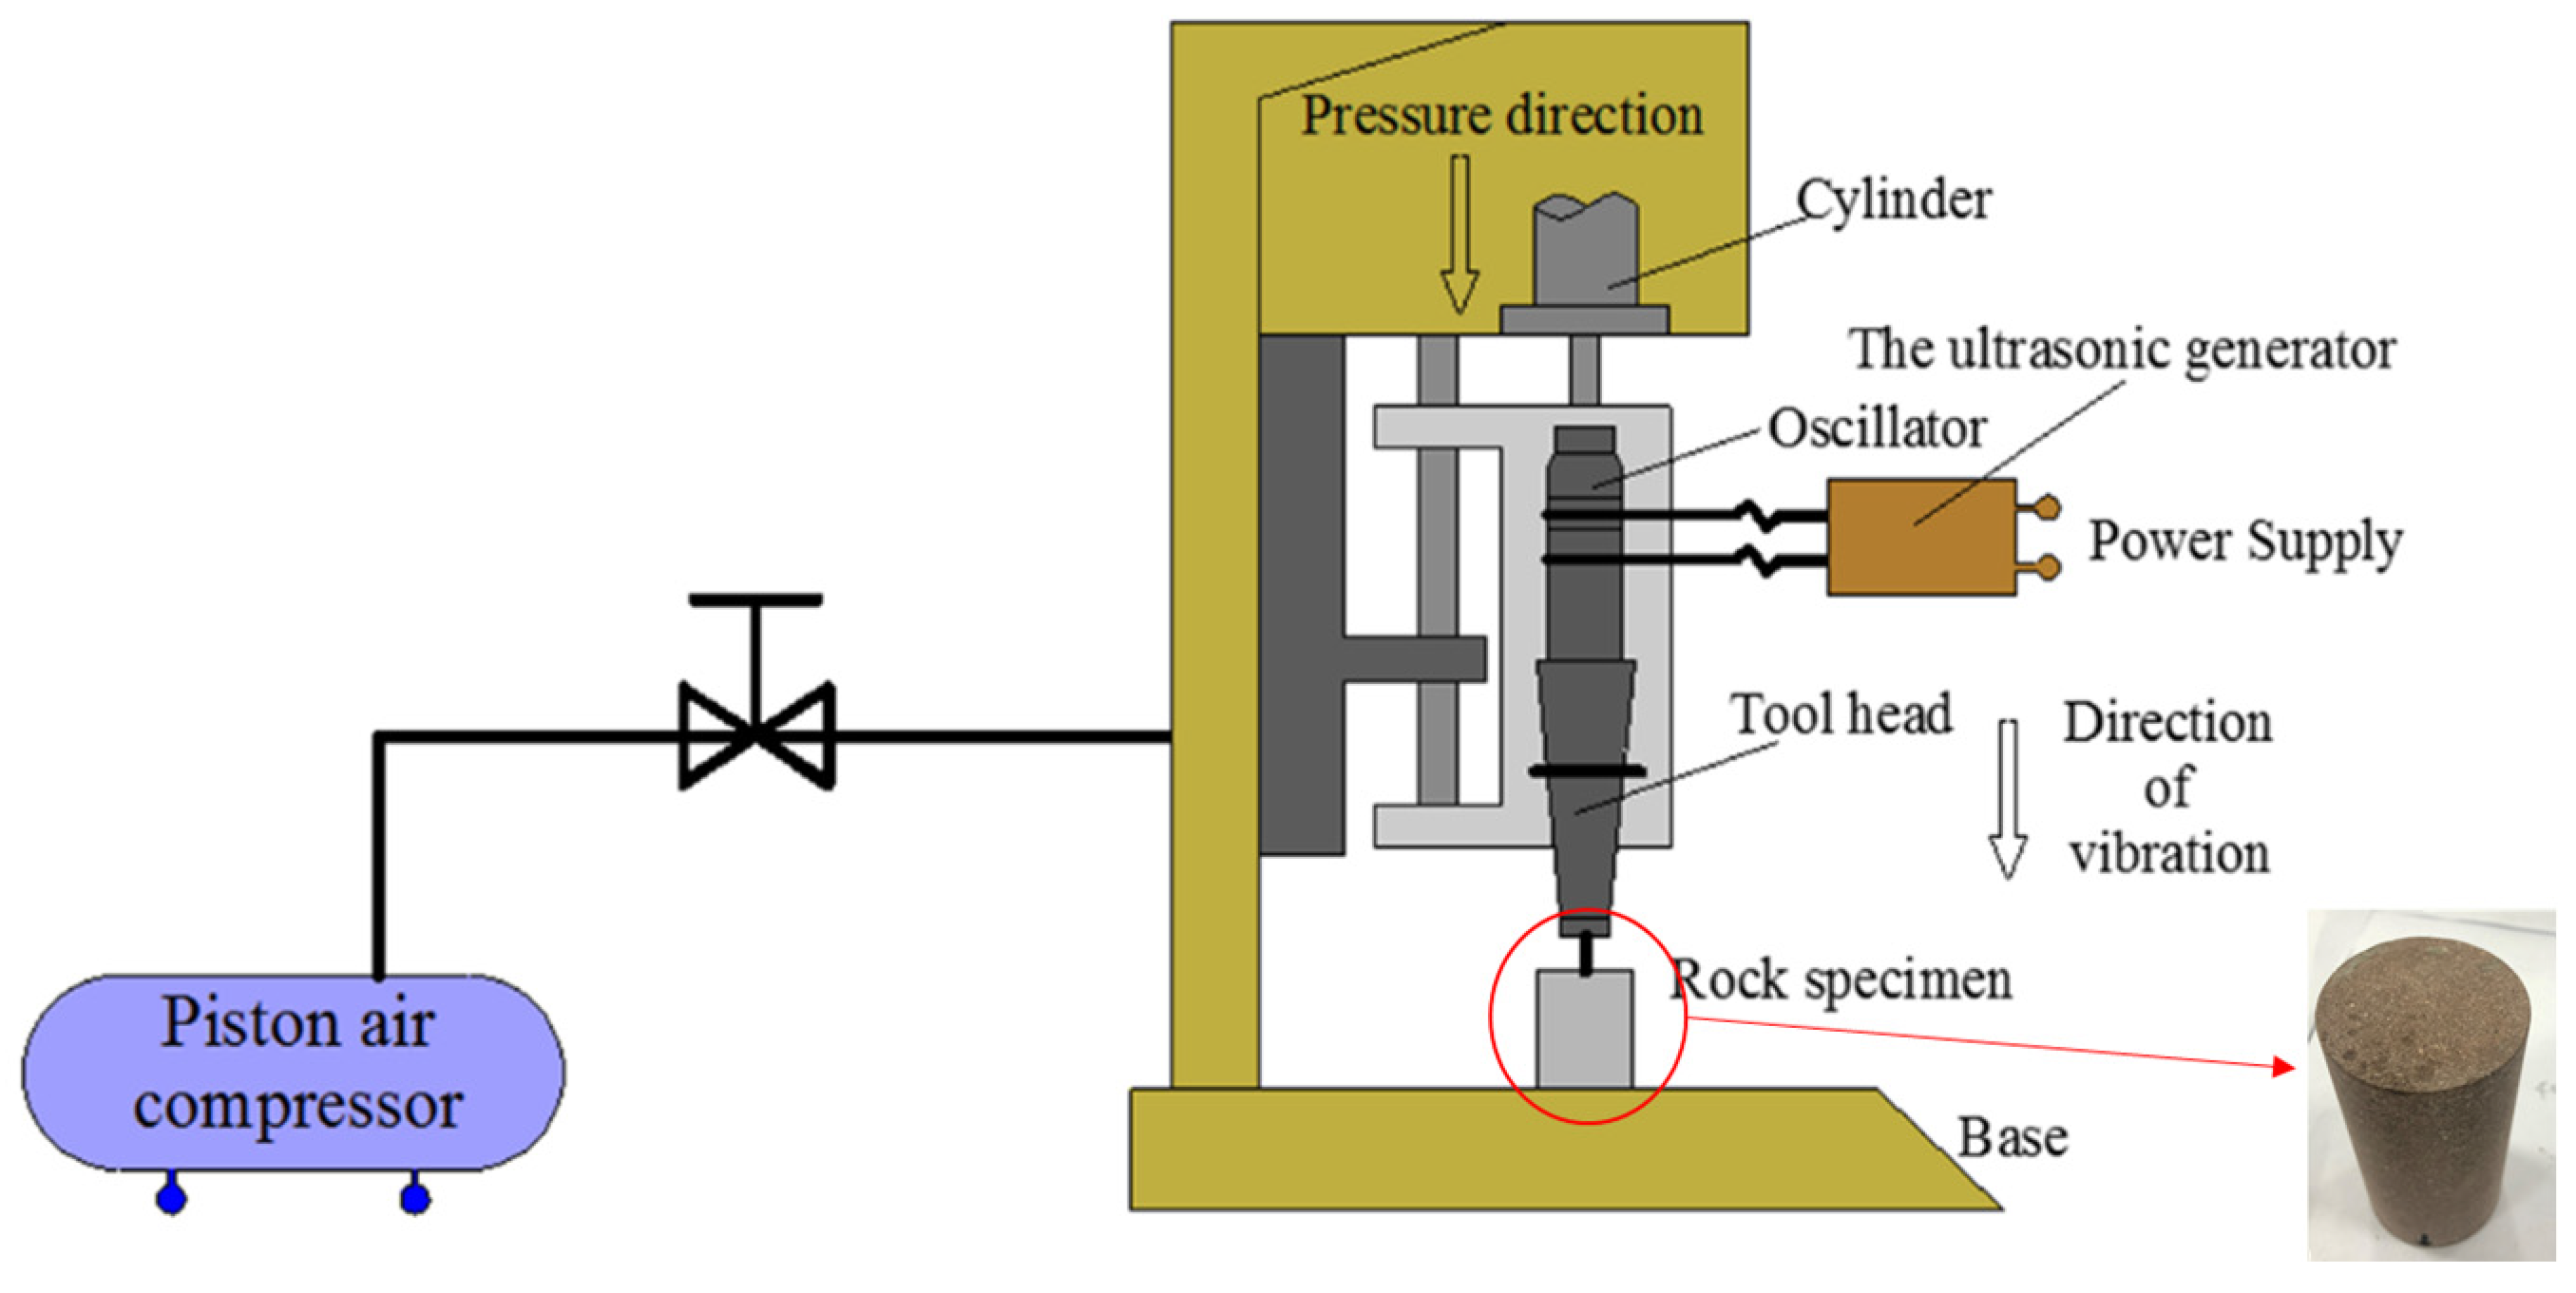
2.1.2. Test Facility

An independently designed ultrasonic high-frequency vibrational fracture testing system was employed to stimulate red sandstone samples through high-frequency vibrations. The schematic diagram of the device is presented in Figure 3. The high-frequency AC electrical signal generated by the ultrasound generator is transformed into a mechanical vibration signal by a transducer, and the amplitude of the vibration is amplified by an amplitude transformer, enabling the tool head connected to it to generate an axial vibration of the ultrasound frequency on the rock. A compressor applied an adjustable range of static loads to the rock, and the parameters for the ultrasonic vibration excitation of the rock were kept constant throughout this test. The specific parameters are provided in Table 1.
The Value Analysis and Calculation Center of China University of Mining and Technology was used to conduct the CT scanning of rock samples under high-frequency ultrasonic vibration excitation. The resolution of the tomography images is as high as 1003 × 1024. In this experiment, about 1600 CT sections (sample height 100 mm) were obtained from each CT scanning of the rock sample, and the thickness of a single CT image was 0.129 mm. The principle of the CT scanning device is illustrated in Figure 4. X-ray beams are used to scan layers of rock up to a certain thickness. The detector receives X-rays through the fault, converts the received signal into a digital signal via digital–analog conversion, and finally obtains a sectional image of the rock through computer processing.

2.2. Test Process

In this study, we performed real-time CT scanning on sandstone samples at various ultrasonic vibration excitation time points. To investigate the development process of internal damage and fracturing in rock, a CT scanning interval of 40 s was established. This entailed conducting real-time CT scanning of the same red sandstone sample every 40 s under vibration excitation until rock volume failure occurred and the test was terminated, as illustrated in Figure 5. Slices were scanned every 62.5 μm along the rock sample’s excitation end, with the acquired section images serving as the foundation for subsequent processing and analysis. Due to the substantial number of CT slices, the task of processing and analyzing each image is labor-intensive. Consequently, 16 CT images were selected for each vibrational excitation stage, i.e., 1 CT image was taken every 6.25 mm below the excitation surface for detailed processing and analysis.

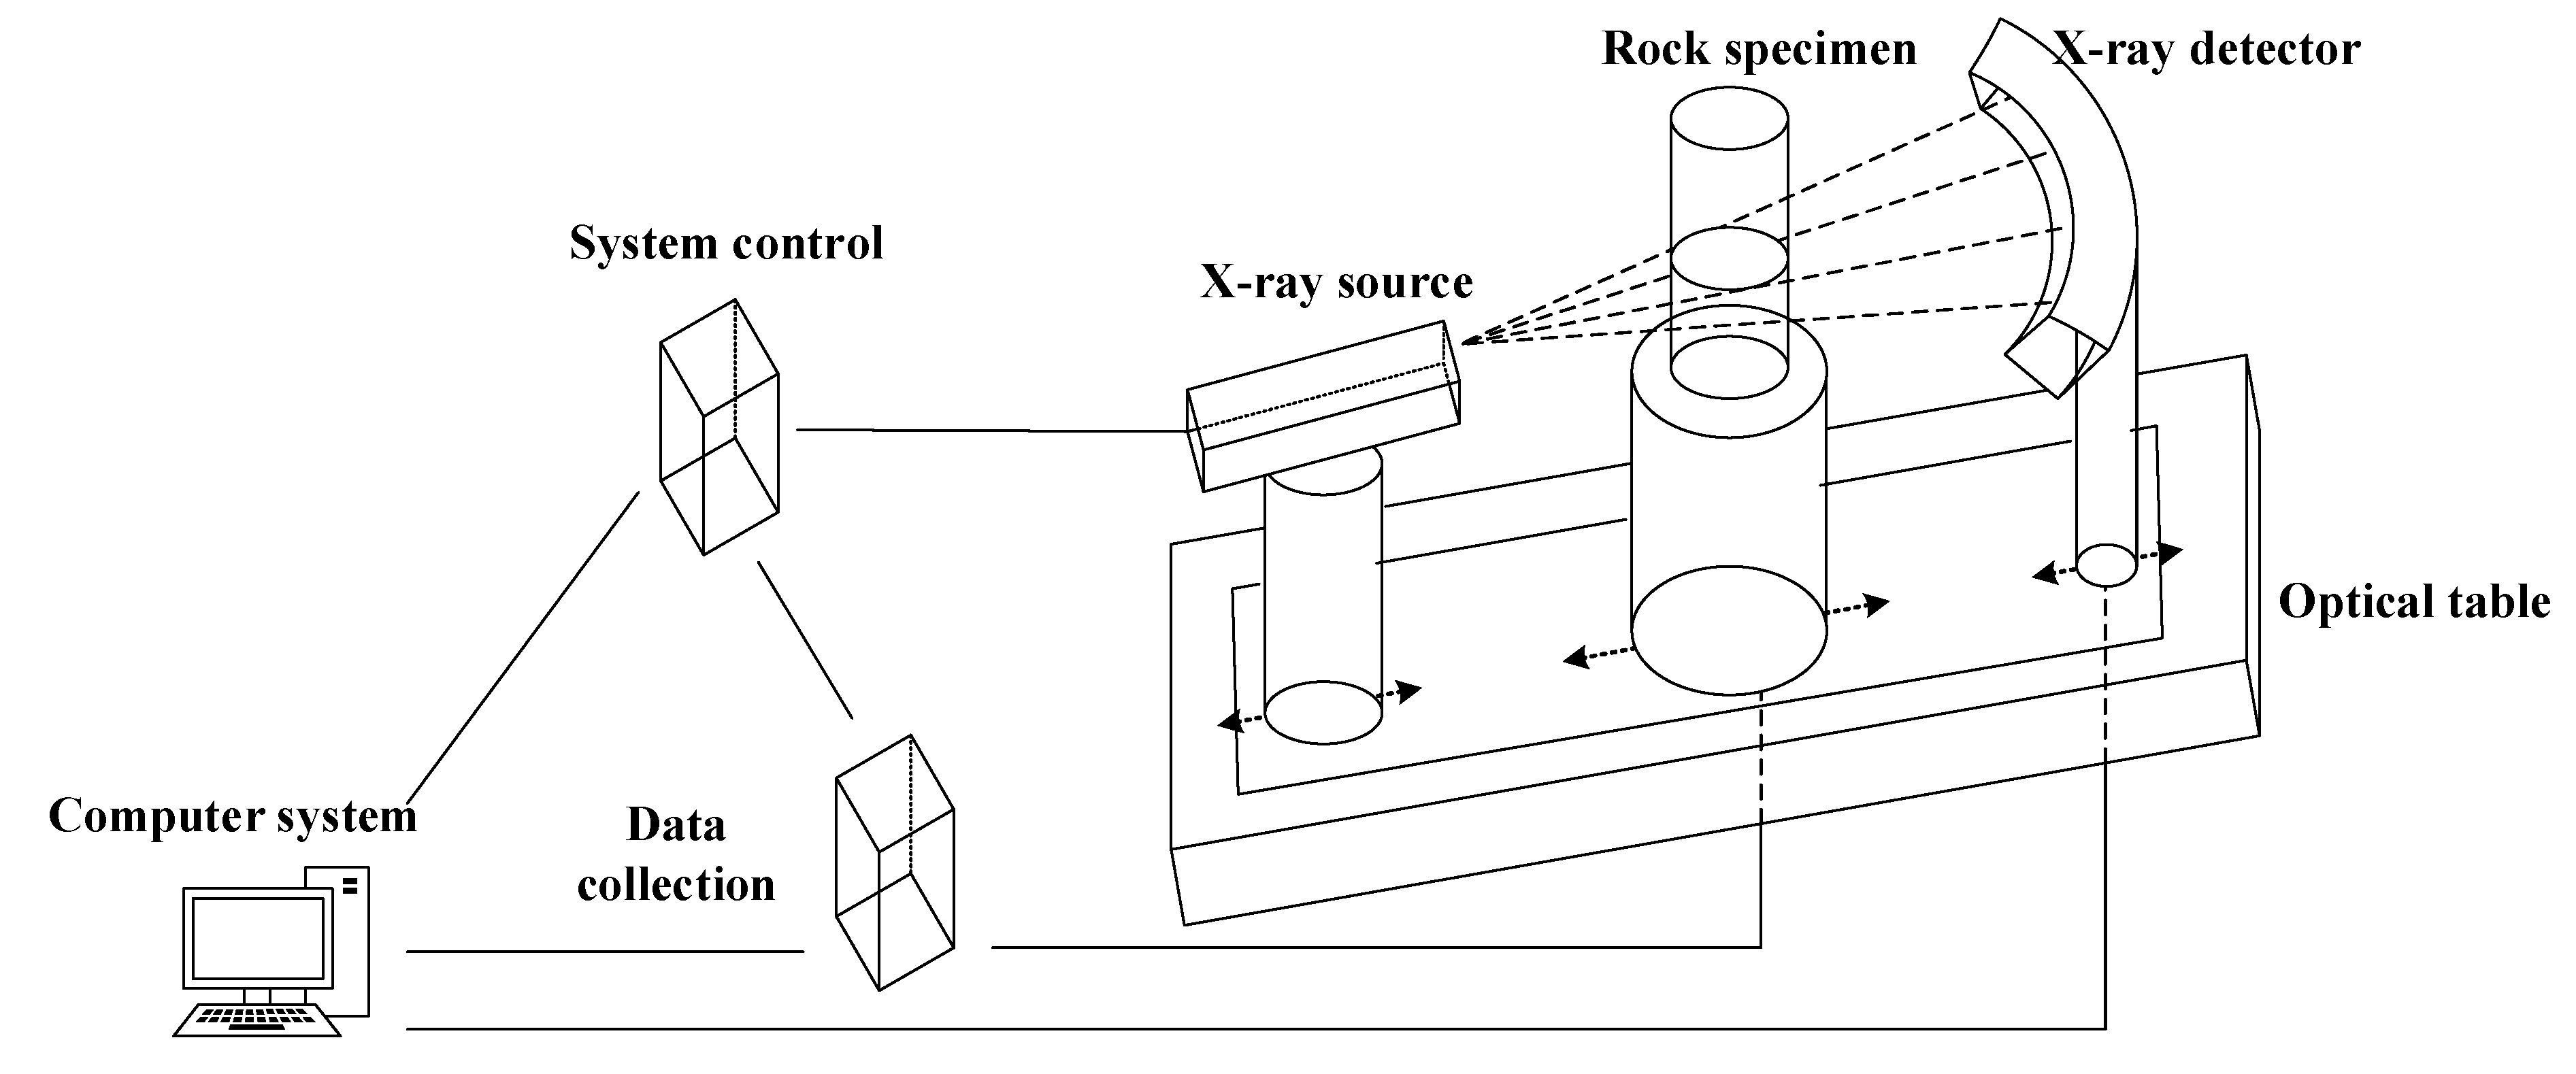
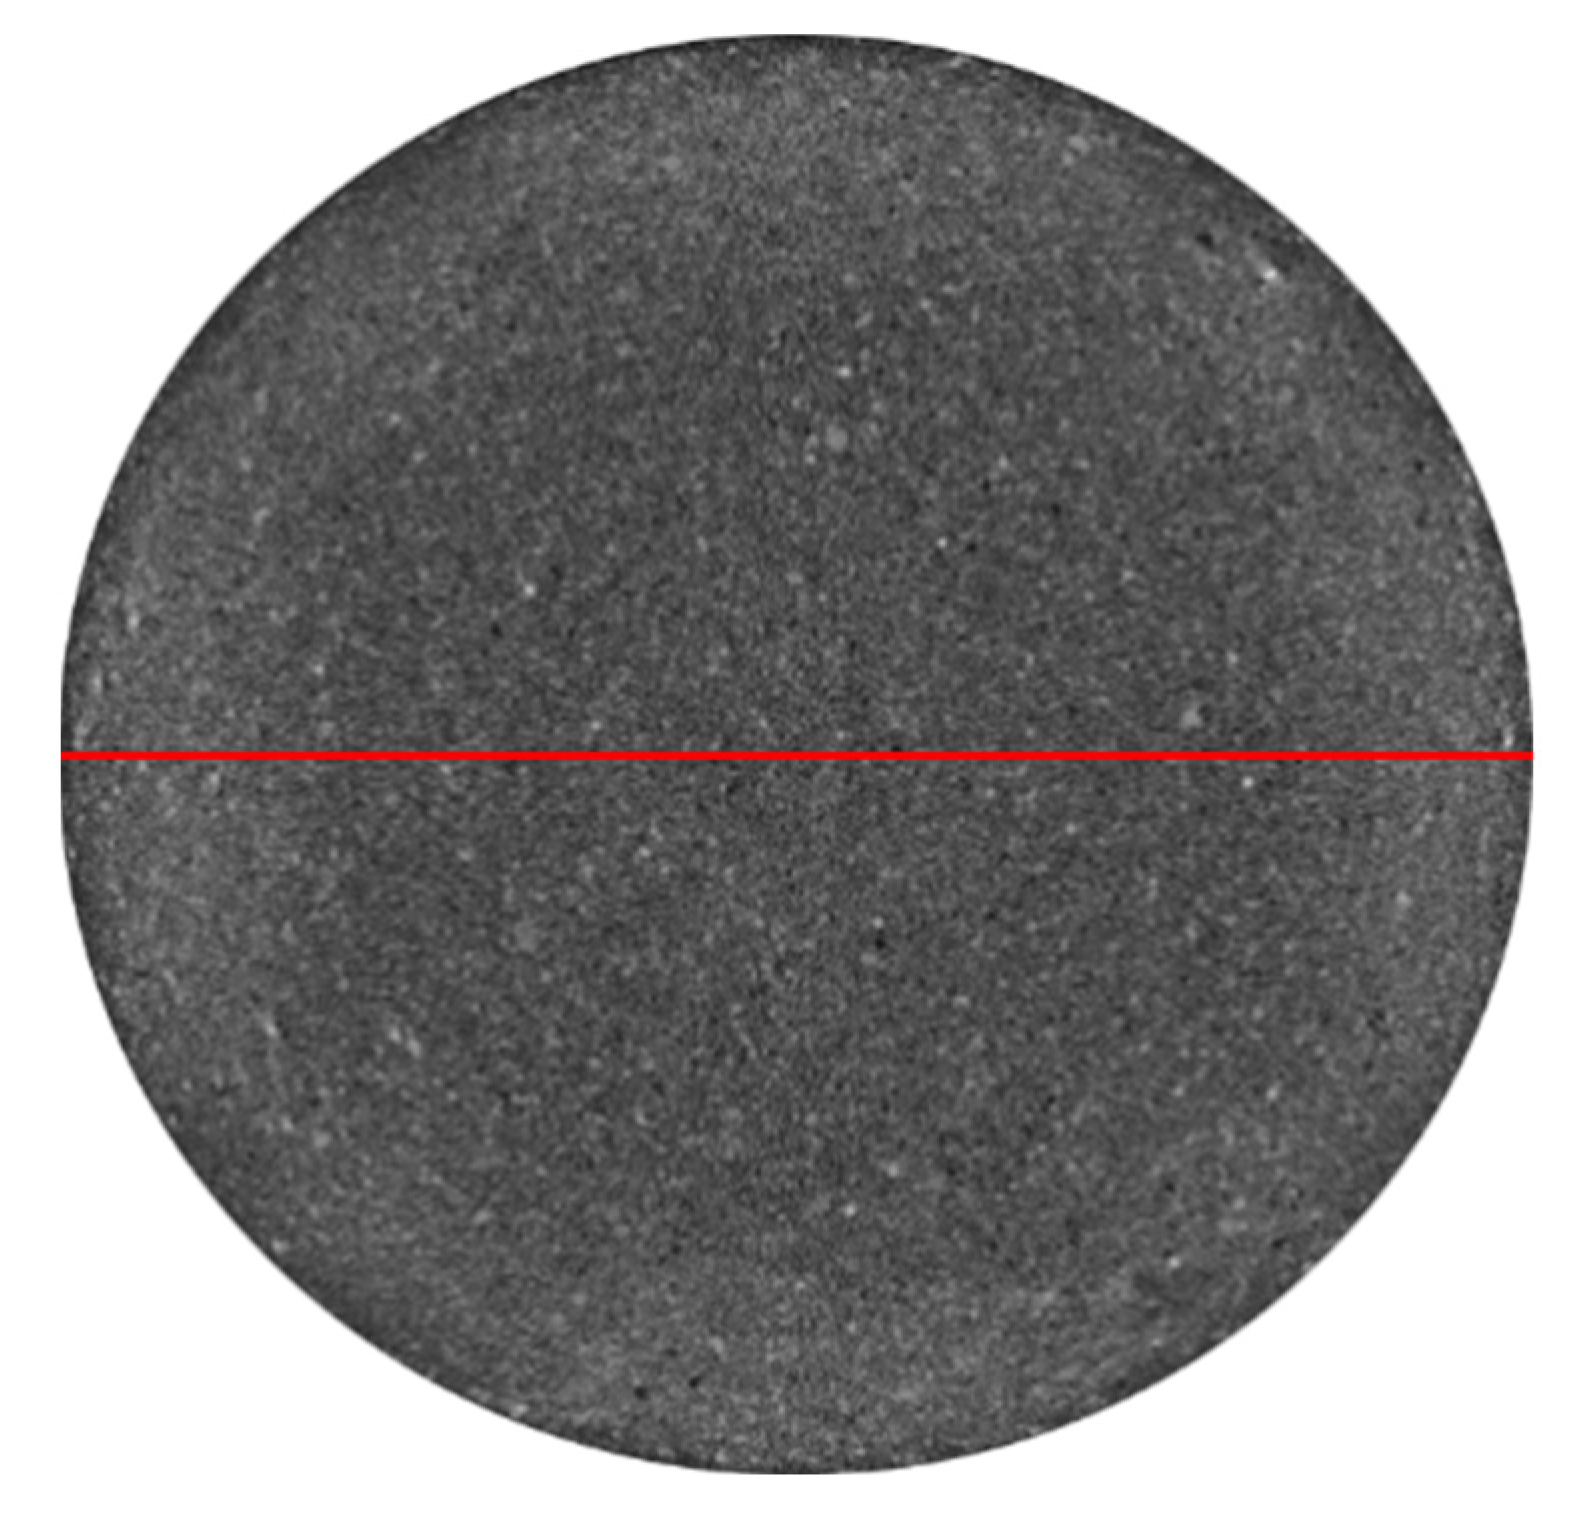
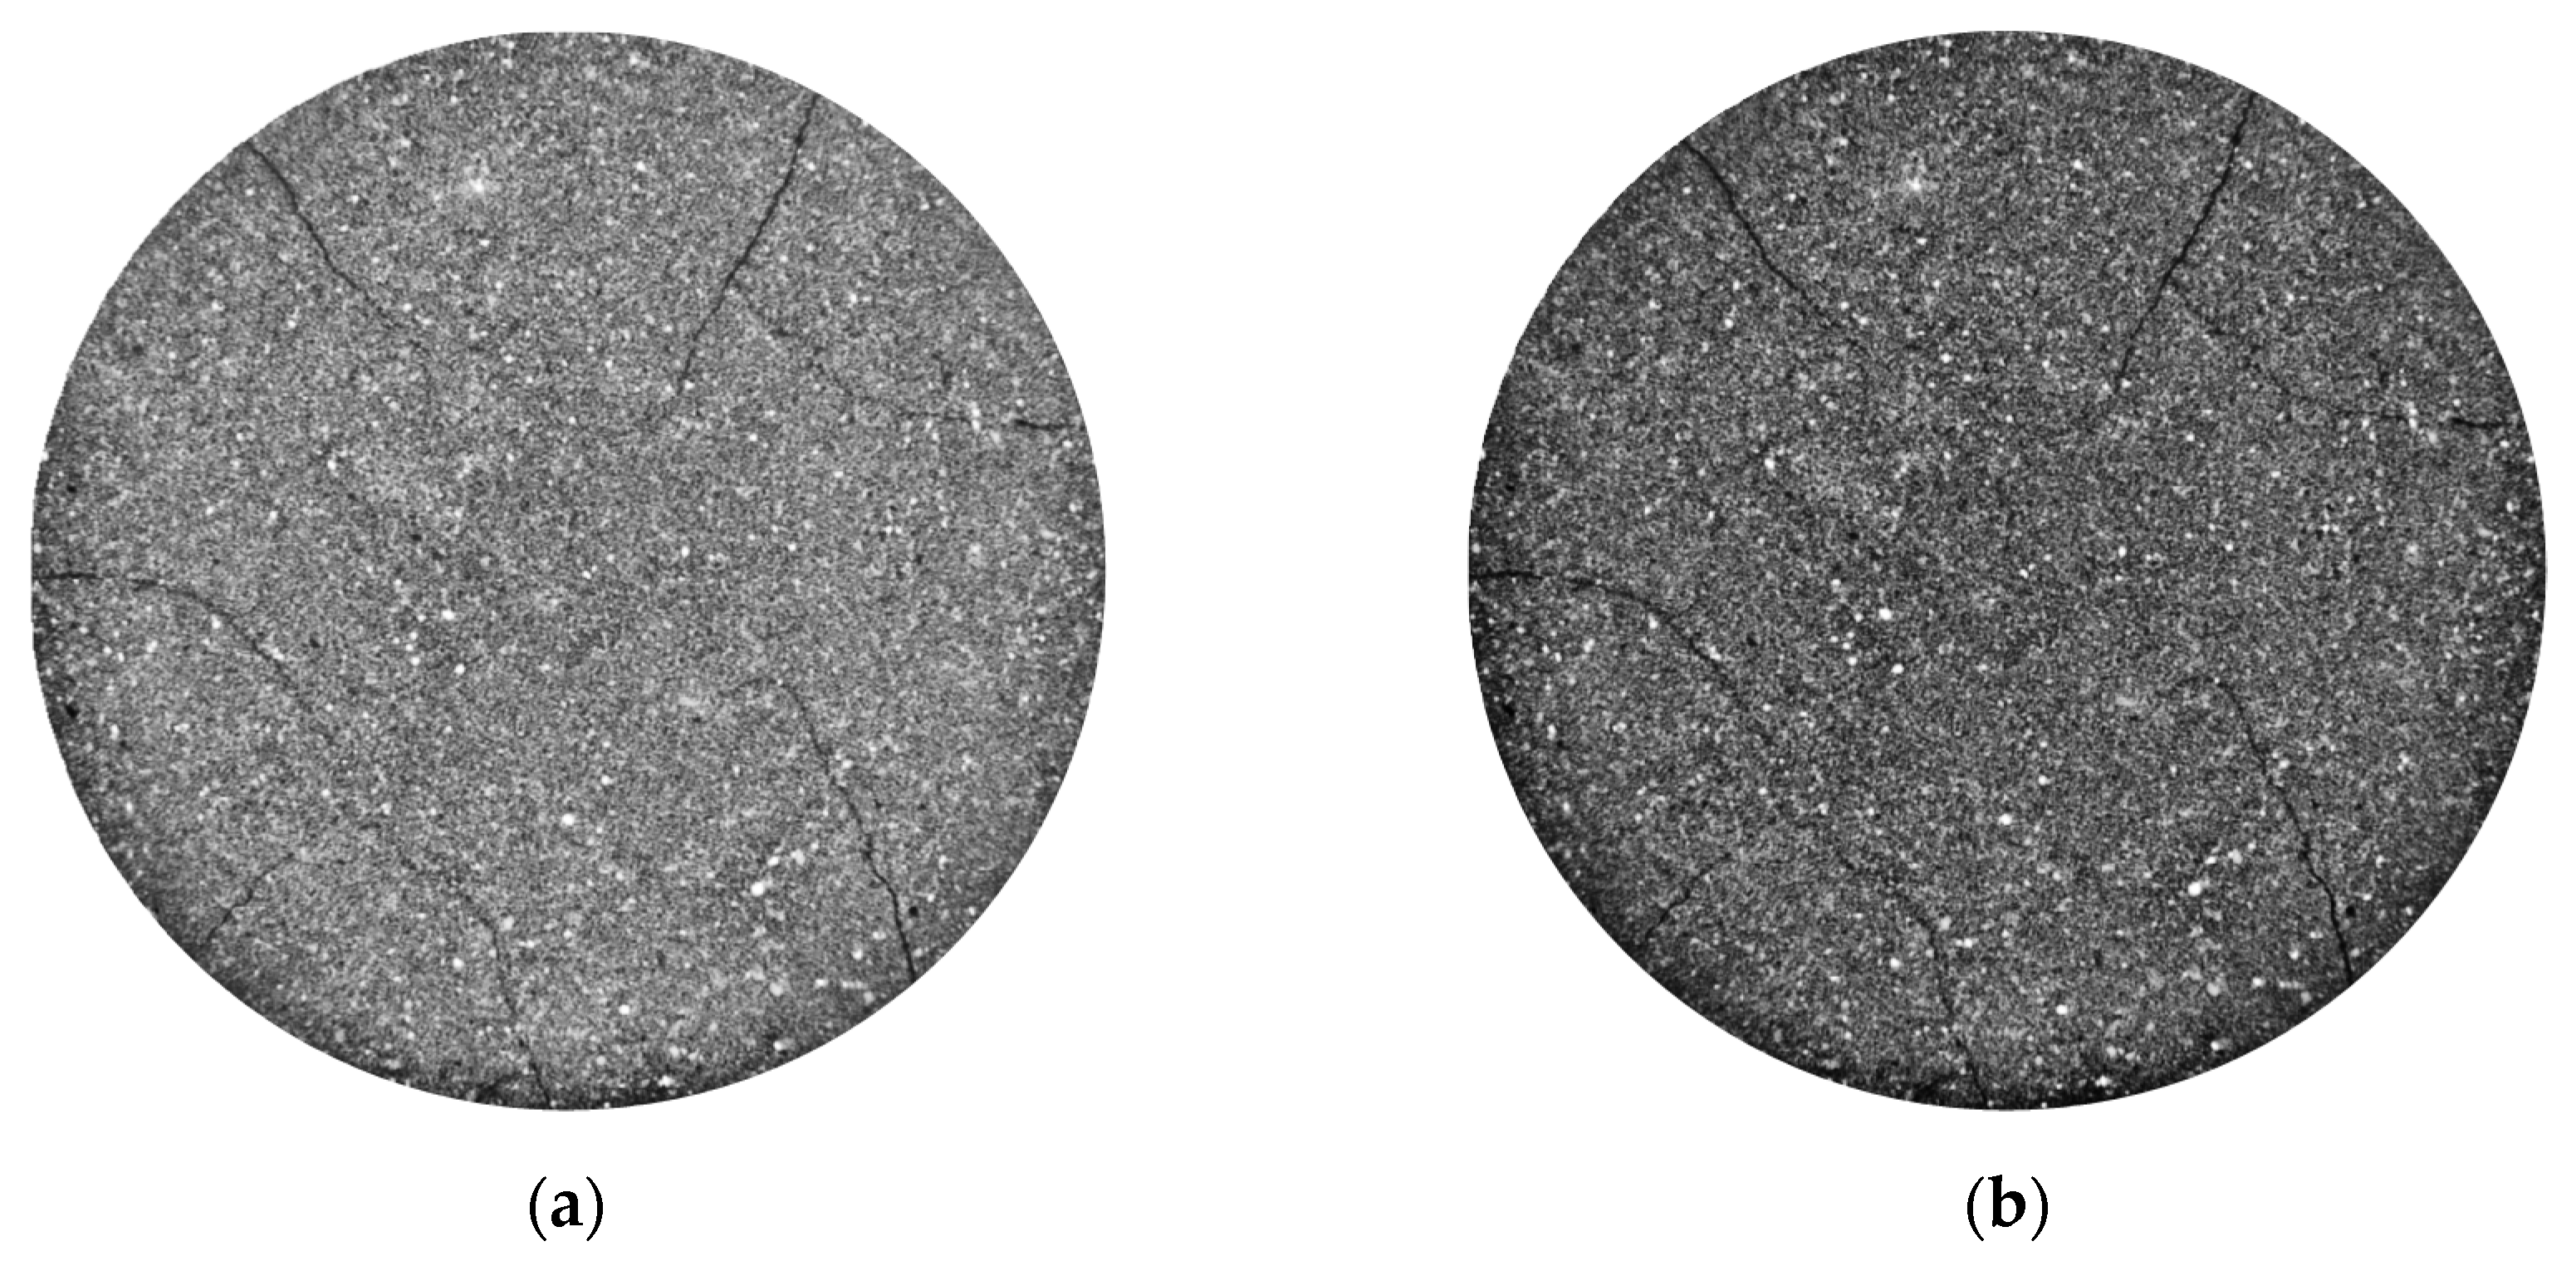
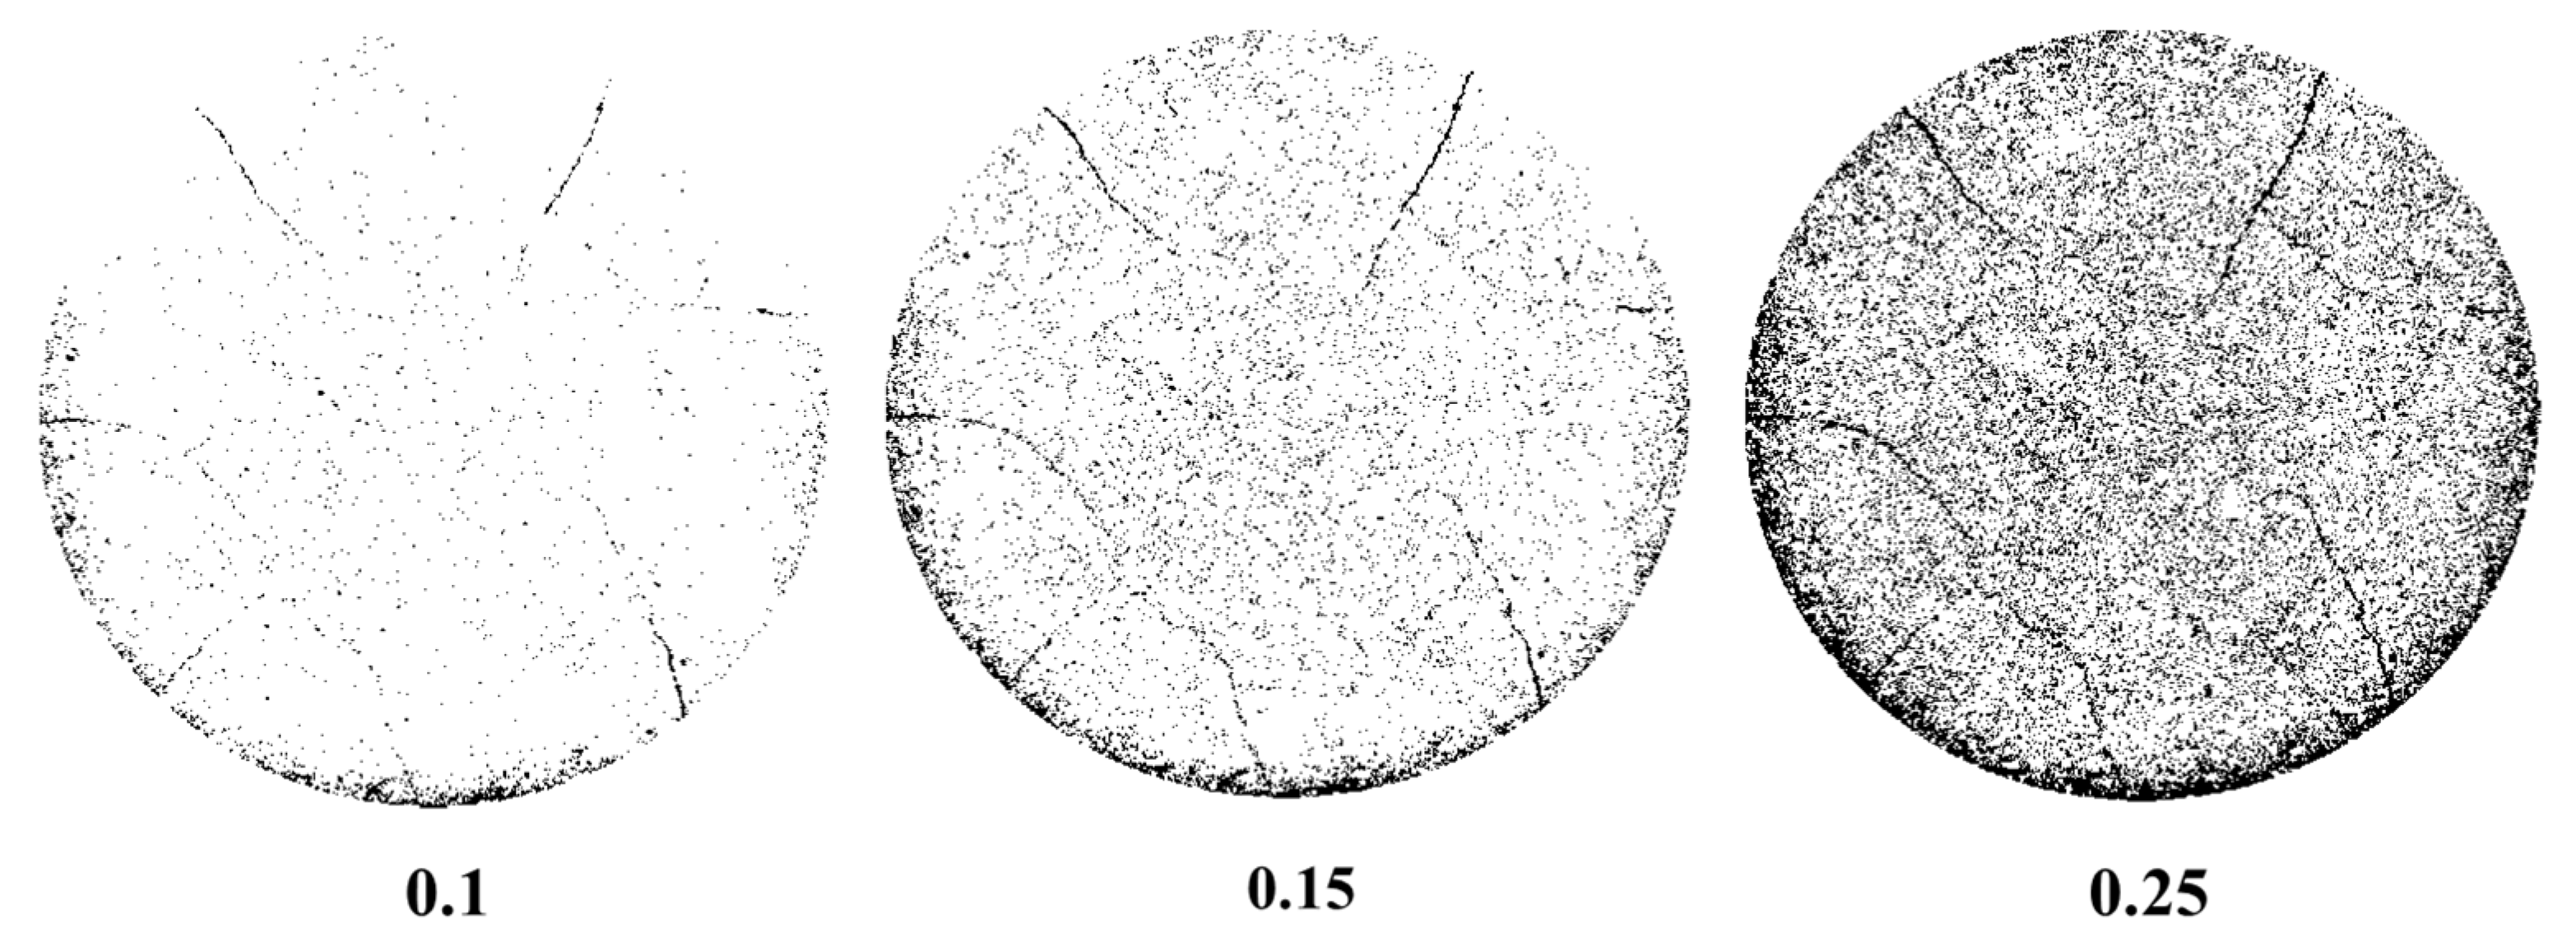
2.3. Extraction Method of Hole and Crack in CT Scanning Image

The initial CT scan image is a grayscale representation with pixel values ranging from 0 to 255, as illustrated in Figure 6. This image can be manipulated to visualize the mineral components (higher grayscale values), matrix (intermediate grayscale values), and pores (lower grayscale values). However, the precise dimensions of each element cannot be accurately determined, and some smaller pores may not be discernible by visual inspection alone. The overall grayscale distribution of the raw CT image, as well as the grayscale histogram of the line path, was acquired using MATLAB analysis (v.R2021a), and is presented in Figure 7. The majority of raw CT images exhibit grayscale values between 140 and 220, with relatively concentrated pixel values and minimal color contrast, making it challenging to distinguish certain pores and matrix elements via human visual inspection. Consequently, image processing techniques [19,20] are required to enhance the visual recognition of the original CT images, and to accurately extract characteristics of pore and fissure development. The specific method to achieve this is described below.
The histogram equalization method was used to nonlinearly stretch CT images, and the initial narrow concentrated gray interval was transformed into a uniform distribution throughout the gray interval (0–255), greatly improving image contrast. The specific algorithm proceeds as follows: First, the occurrence times of each pixel value in the CT image are counted and normalized to generate the original image histogram. Subsequently, the cumulative histogram distribution is calculated using the formula
C i = j = 0 i P j
The gray value is represented by i, Pj denotes the frequency of pixels with gray value j within the image, and Cj signifies the cumulative distribution function. Finally, the following formula is employed to determine the pixel values after equalization and substitute the pixel values in the original image:
H ( i ) = r o u n d ( C i C min M × N 1 × ( L 1 ) )
where H(i) denotes the pixel value following the mapping process; M and N correspond to the image width and height, respectively; L signifies the range of pixel values, and min refers to the smallest pixel point in the original image.
On the basis of the equalization of the gray histogram of CT images, the overall gray value of the image is nonlinearly stretched, so that the gray interval of the darker part of the image is enlarged, and the difference between the pores and the matrix in the image is more clear, as shown in Figure 8. Based on the equalization of the gray histogram of CT images, the overall gray value of the image undergoes nonlinear stretching, resulting in an enlarged gray interval for the darker regions of the image. This enhancement clarifies the distinction between the pores and the matrix in the image, as illustrated in Figure 8. Prior to this, a logarithmic transformation is applied to the original image to accentuate the contrast of prominent dark areas:
g ( x , y ) = n lg [ f ( x , y ) + 1 ]
where g(x, y) represents the grayscale value, f(x, y) denotes the pixel value, and n serves as the scaling coefficient that adjusts the dynamic range of the transformed grayscale value.
The application of thresholding was utilized to segment the CT image of the red sandstone and differentiate the pore component from the matrix component. The image binarization segmentation methodology was employed to establish a gray value threshold, resulting in the division of the image into two distinct parts. The gray value of the region exceeding the threshold was assigned as 1, while the gray value of the region below the threshold was assigned as 0. The threshold segmentation algorithm is articulated as follows:
g x , y = 1 f x , y T 1 0 f x , y T < 1
where T denotes the segmentation threshold. The results of binarized segmentation with different thresholds are shown in Figure 9. In this study, a manual empirical trial-and-error approach was used to select the most appropriate threshold for the current CT image by testing different thresholds.
Pores following binary segmentation are coloured and superimposed onto the original image. The distribution images of the pores are presented in Figure 10. The blue portion represents the pore region. The porosity Φ, which is the proportion of the pore component in the CT section relative to the total section, can be derived by quantifying the pore region in the figure. As illustrated in the figure, the dense pixelation at the periphery of the original CT image is not due to a high concentration of pores, but rather, it is an artifact resulting from the original CT image. This artifact leads to a lower grayscale value in the edge area, or even a grayscale value identical to that of the pores. To mitigate the impact of artifacts, circular regions of identical size are extracted from the same position in the original image. The edges with more artifacts are eliminated, and the alterations in the pores within the same region are examined.

3. Results

3.1. Microfracture Characteristics of Rock under Ultrasonic Vibration Excitation

The failure domain of a rock subject to ultrasonic vibration stimulation is a small region in the upper portion of the rock, proximal to the excitation surface. By determining the layers where cracks propagate downward under the influence of 0 s, 40 s, 80 s, and 120 s of ultrasonic vibration stimulation, it was found that the maximum depth of crack propagation within the rock was 0 mm, 24.16 mm, 29.78 mm, and 32.15 mm, respectively. In Figure 11, CT images of the rock damage zone at varying layers for different vibration stimulation durations are presented. The black portions denote the damaged areas. Under the influence of ultrasound vibration, the marginal region of the rock’s excitation surface initially fractures, giving rise to macroscopic cracks that propagate in a divergent manner towards both ends and depths.
The maximum failure depth in the central failure area reached 2.5 mm. By isolating the black portion representing the failure area in each layer and calculating the area of this portion, the failure range of rocks at different layers within the failure area was quantified and characterized. The variation curve of the damage area of the rock CT image section with depth after 120 s of vibration excitation is depicted in Figure 12. The failure area of the CT section in the rock exhibits an exponential decrease with depth, as demonstrated by the significant reduction from 148.17 mm2 at the top to merely 20.61 mm2 at a depth of 2.5 mm, corresponding to an 86.09% decrease in the failure area. Simultaneously, by analyzing the cracks at each layer and summing their total length, it can be discerned that the aggregate length of cracks generated at each rock layer following 120 s of vibration stimulation varies with depth, as illustrated in Figure 13. The proximity to the rock’s upper surface determines an increasing range of fragmentation, resulting in the generation of numerous cracks from the broken area. Eight distinct cracks are observed in the uppermost layer, with a total length of 119.63 mm and a maximum fracture aperture of 1.287 mm. In contrast, only a single crack appears in the rock layer at the maximum depth of crack propagation (32.15 mm), possessing a length of only 7.12 mm, which is 5.9% of the total crack length in the uppermost layer, and a maximum fracture aperture of 0.143 mm, which is 11.1% of the maximum crack opening in the upper layer.
The interaction between macroscopic rock fracture mode (illustrated in Figure 14) and the ultrasonic high-frequency vibration-induced fracture process is depicted in Figure 15. The initiation zone of the primary crack in the rock is situated at the perimeter of the excited surface, with the crack propagating radially towards the free surface, giving rise to a fracture surface. Under tensile stress, the two fracture surfaces exhibit downward expansion, indicating that macroscopic surface cracks propagate downward. When the two fracture surfaces reunite in the lower section, the macroscopic cracks on both surfaces concurrently converge, resulting in a failed block that detaches, leading to local failure.

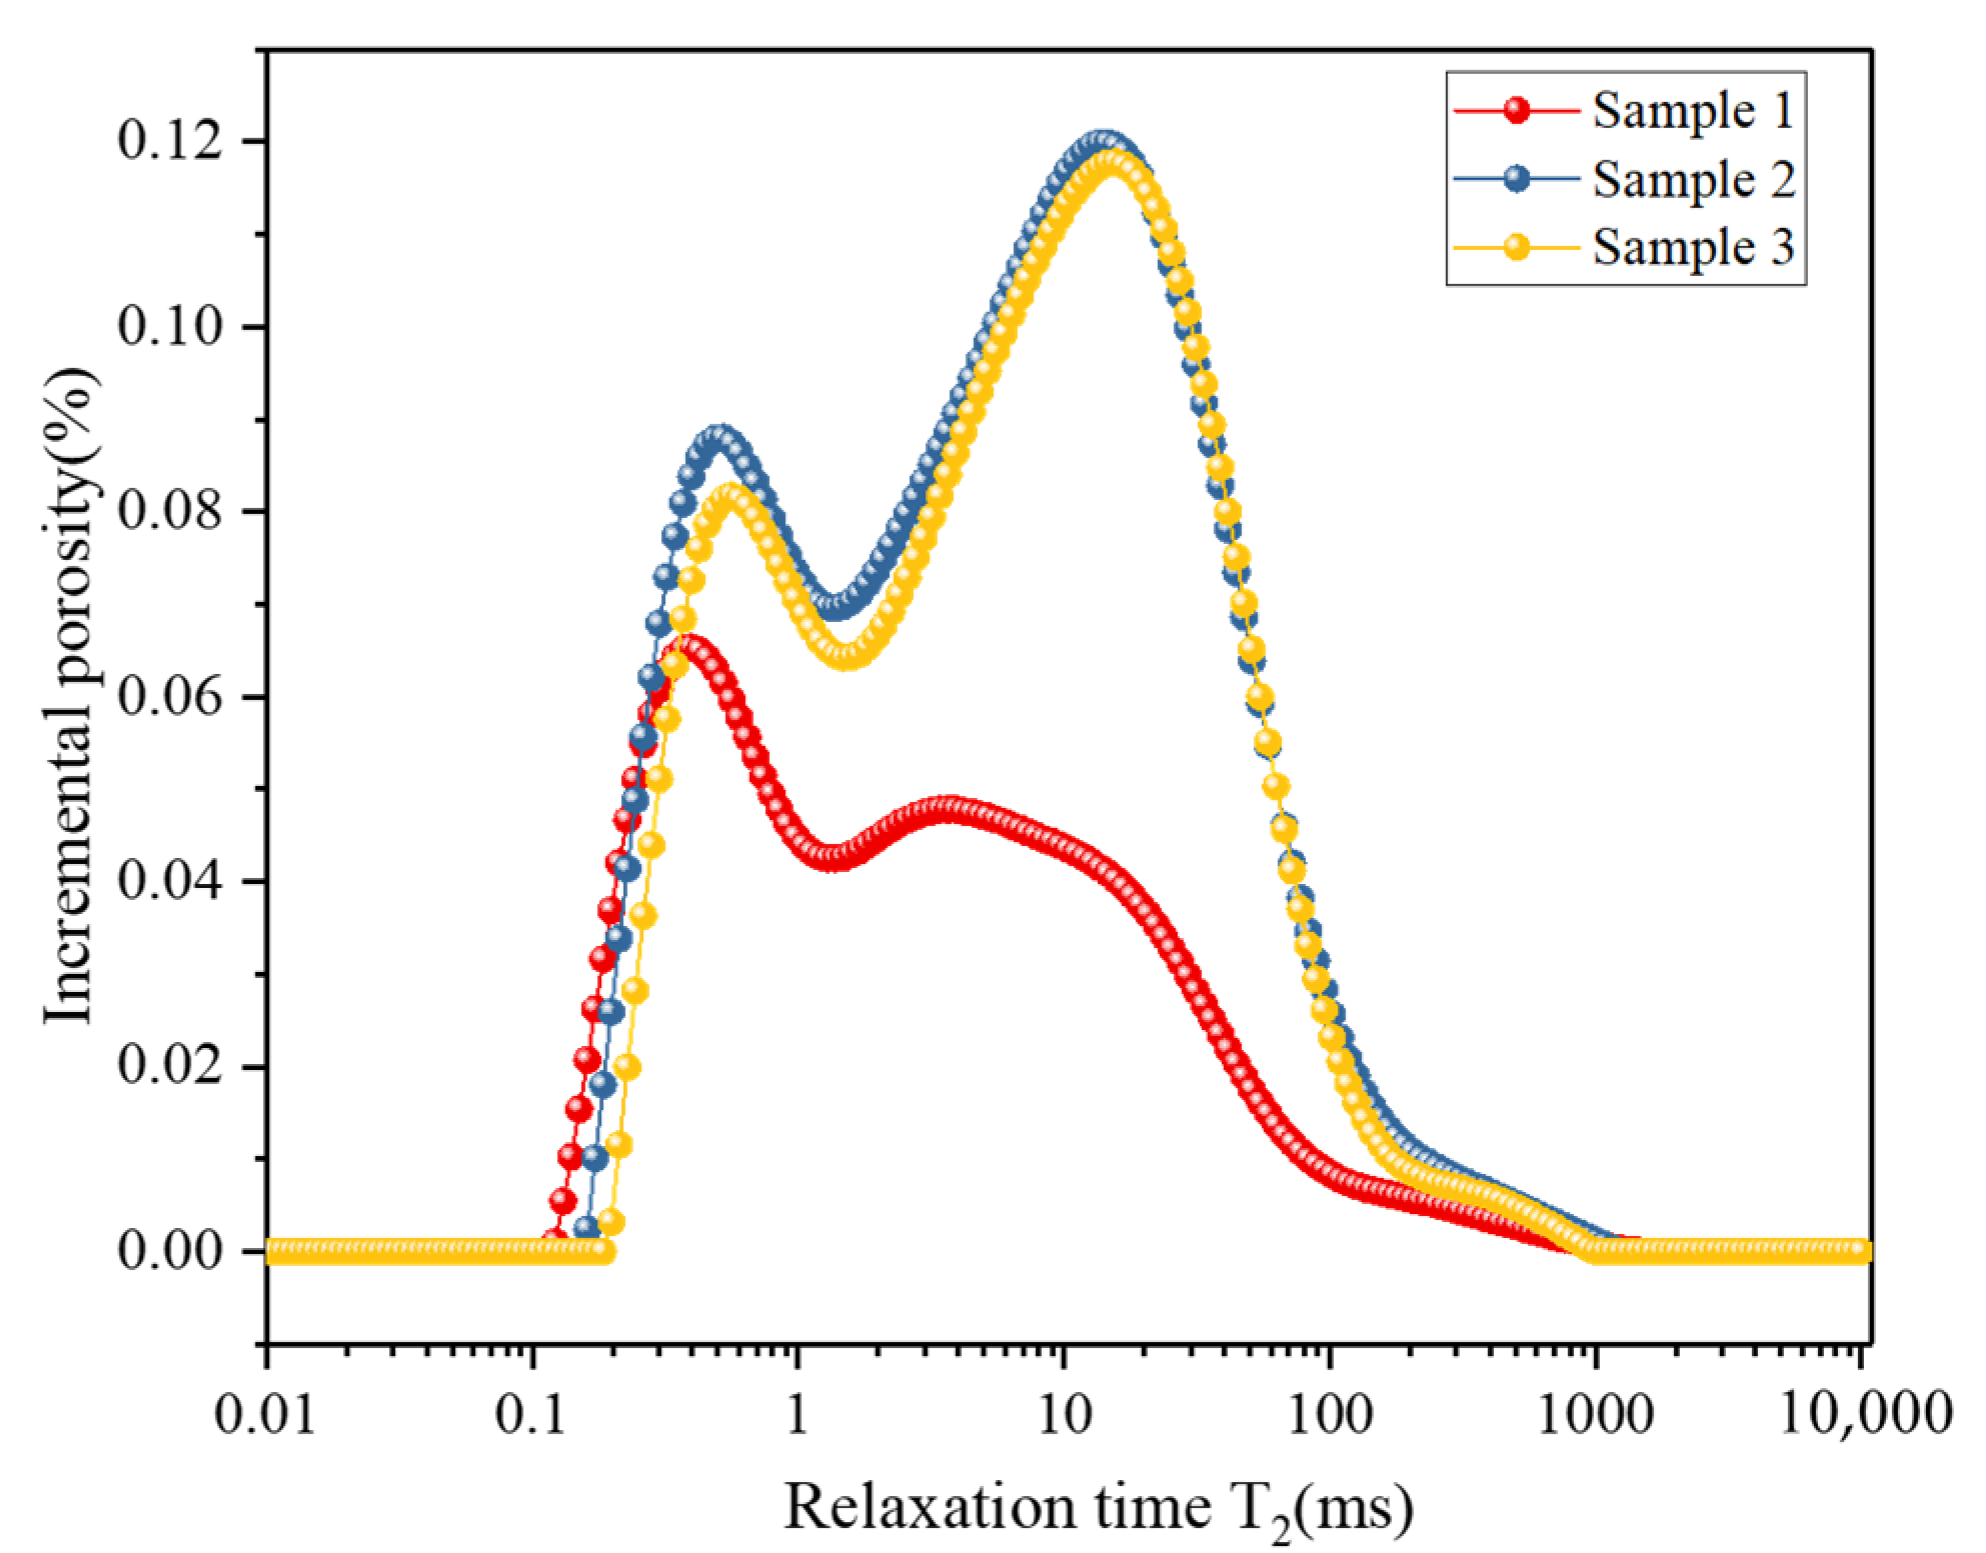
3.2. Characteristics of Pore Evolution

The application of digital image processing techniques was employed to extract pores from CT images of 16 distinct rock layers at varying excitation stages. A trial-and-error method was utilized to determine an optimal image segmentation threshold of 0.06. The specific method for determining the threshold is as follows: CT scans of each rock layer without ultrasonic vibration excitation were processed using various thresholds. The calculated porosity for each layer was averaged to obtain the overall porosity of the rock, which was then compared with the accurate porosity measured during petrophysical experiments. The threshold employed when the processed porosity is virtually indistinguishable from the actual porosity is the threshold selected in the present study.
The outcomes of the porosity quantification of the CT images of each layer at varying ultrasonic vibrational excitation stages are presented in Table 2, and the pore distribution of the rock at different excitation stages is visualized in Figure 16. The three-dimensional rock porosity can be approximately characterized by averaging the porosity of each layer. The initial porosity of the rock obtained via this method is approximately 6.18%, which is highly consistent with NMR measurements and confirms the accuracy of the pore extraction method. CT images of the 100th, 800th, and 1600th layers were chosen from the upper, middle, and lower layers of the sample, and the pore evolution of the rock within the target region was obtained via image processing, as illustrated in Figure 17. It can be discerned intuitively that the pore density of each layer in the rock increases to varying degrees with increasing excitation time. Figure 18 discloses the evolution of porosity in the three layers. The increment of porosity gradually decreases with increasing distance from the excitation plane. After 120 s of vibration excitation, the porosity increase of the transverse section of rock at 6.25 mm from the excitation plane (100 layers) reaches 170.42%. The cross-sectional porosity of rocks in the middle (800 layers) escalates by 45.51%, while that of rocks further away from the excitation surface (1600 layers) only increases by 0.22%. The bottom region of the rock remains virtually unaffected by the high-frequency ultrasonic vibration load. By fitting, the variation of the rock porosity increment with specimen height h under ultrasonic vibrational excitation can be derived as follows:
Δ ϕ = 20.52525 × 0.96404 h 0.24048
The increment of rock porosity decays exponentially as the distance from the excitation surface increases layer by layer.

4. Discussion

When considering the rock as a composite of numerous unit particles, for a cylindrical rock with cross-sectional area A and height h, the internal particles of the rock obey the following equations of motion subsequent to being excited by ultrasonic vibrations:
2 u t 2 = a 2 2 u x 2 + 1 ρ A q x , t
where u and q(x,t), respectively, represent the displacement and external force of particles inside the rock unit; a stands for rock wave velocity; t stands for time.
When the rock is freely vibrating, the equation of vibration of its internal particles should be expressed as:
2 u t 2 = a 2 2 u x 2
The solution of Equation (3) can be formulated as follows:
u ( x , t ) = U ( x ) ( A 1 cos ω t + B 1 sin ω t )
where U(x) represents the mode function; A1 and B1 denote constants; u(x, t) represents the displacement of section unit particles at height x of the rock.
The mode function can be obtained as follows:
U ( x ) = C 1 cos ω x a + D 1 sin ω x a
where both C1 and D1 denote constants. In the ultrasonic vibrational excitation test in this study, the rock is in a state where the lower end is fixed and the upper end is free, and the corresponding boundary condition is formulated as follows:
U ( 0 ) = 0 d U d x | x = h = 0
Combining this with Equation (5), we can obtain the following expression for the angular frequency of each order of the rock sample:
ω i = 2 i 1 4 h a , i = 1 , 2 ,
where i denotes the order of natural frequencies, and the principal modes corresponding to each order of angular frequency can be written as follows:
U i x = D i sin 2 i 1 π 2 h x , i = 1 , 2 ,
The above mode function is normalized according to Equation (9) and the regular mode is obtained as shown in Equation (10):
0 1 ρ A U i x 2 d x = 1
U ˜ i x = 2 m sin 2 i 1 π 2 l x , i = 1 , 2 ,
When the exciting force is applied to the rock, the motion equation of its vibration can be expressed by the regular equation shown in Equation (11):
η i .. + ω i 2 η i = 0 l q x , t U ˜ i x d x , i = 1 , 2 ,
In the ultrasonic vibrational excitation test, a longitudinal forced vibration of a rock can be induced by applying a simple harmonic excitation force to the central region of its upper free end. This can be considered as a concentrated force acting on the sample end and can be expressed in the form of the following impact function:
q x , t = F t δ x h
where F(t) represents the force applied to the rock, consisting of a simple harmonic excitation force and a static load force, as follows:
F ( t ) = F 0 sin ω t + F s
Here, F0 denotes the excitation force amplitude and Fs represents the static load force.
By solving Equation (11), the response equation of rock particles under regular coordinates can be obtained, as follows:
η i t = F 0 sin ω t ω i 2 ω 2 2 m sin ( 2 i 1 ) π 2 + F s ω i 2 2 m sin ( 2 i 1 ) π 2
The response of rock to the combination of static load and ultrasonic vibration load is as follows:
u x , t = 2 m 1 F 0 sin ω t ω i 2 ω 2 + F s ω i 2 sin 2 i 1 π 2 sin 2 i 1 π 2 h x
When the rock is assumed to be a single-degree-of-freedom model, Equation (15) can be converted as follows:
u x , t = 2 m F 0 sin ω t ω 0 2 ω 2 + F s ω 0 2 sin π 2 h x
Taking m = 1 kg, ω/ω0 = 1/2, Fs = 40 N, F0 = 8 kN, The variation curves of particle displacement at various section positions in rock with respect to excitation time under the influence of ultrasonic high-frequency vibration are presented in Figure 19. The figure indicates that the amplitude of particle displacement within the rock progressively decreases as the distance between the rock layer and the excitation surface increases. The vibration amplitude of particles at the excitation surface (height h) reaches 5.2 μm. When the layer height varies from h to 3/4 h, h/2, and h/4, the displacement amplitudes of rock particles in the corresponding horizons decrease by 0.076, 0.293, and 0.617, respectively. Furthermore, a larger distance from the excitation surface corresponds to a greater reduction in the maximum displacement amplitude.
In the vibrational regime, the force on the unit particle in different layers of rock is expressed as follows:
F p = m p a ( x , t ) = m p d u ( x , t ) d t
where mp stands for particle mass; a(x, t) represents particle acceleration.
The force experienced by particles within the rock is directly proportional to their displacement, as illustrated in Equation (17). Consequently, the closer the individual particle is to the excitation surface, the greater the force acting upon it, and the more likely it is to reach the rock’s fracture strength, thereby causing damage. Conversely, as particles move further away from the excited surface, the amplitude of the stress decay within the rock increases, making it more challenging for the rock to sustain damage. When the distance from the excitation surface surpasses a specific value, the rock in this region remains undamaged and undergoes only elastic deformation due to the vibrational load. This phenomenon elucidates why localized rock fractures occur under the influence of an ultrasonic vibration load.
Presently, the majority of mechanical models developed in pertinent studies consider the load force acting on the rock’s end face as a single harmonic force uniformly distributed along the rock’s axial direction, neglecting the static load effect. This holistic model fails to investigate the deformation and displacement distribution characteristics of the rock itself. This paper presents an optimized model. Firstly, the load force on the rock is considered as a concentrated force acting on the end face, which provides an explanation for the variation in the damage degree at different rock layers under vibratory load to some extent. However, this model is not without limitations. It assumes the rock to be an isotropic ideal viscoelastic body; thus, the model can only describe the elastic deformation stage of the rock during vibration excitation. In our future research agenda, we plan to integrate additional tests, including rock mechanical parameter determination and wave velocity measurements at varying vibration loading stages, to quantitatively assess the dynamic damage characteristics of rock. Based on these findings, we aim to further develop an elastic–plastic mechanical model of rock deformation and fracture under ultrasonic vibration excitation, in order to more effectively elucidate rock fracture behavior.

5. Conclusions

In this study, a uniaxial real-time CT scanning ultrasonic high-frequency vibration excitation test was conducted on a brittle fine-grained red sandstone sample. The test was designed to examine the properties of rock microfractures by analyzing real-time CT scans taken during vibrational excitation. Additionally, digital image processing techniques were utilized to examine the formation and growth of holes and cracks in the sample. The primary findings are as follows:
(1)
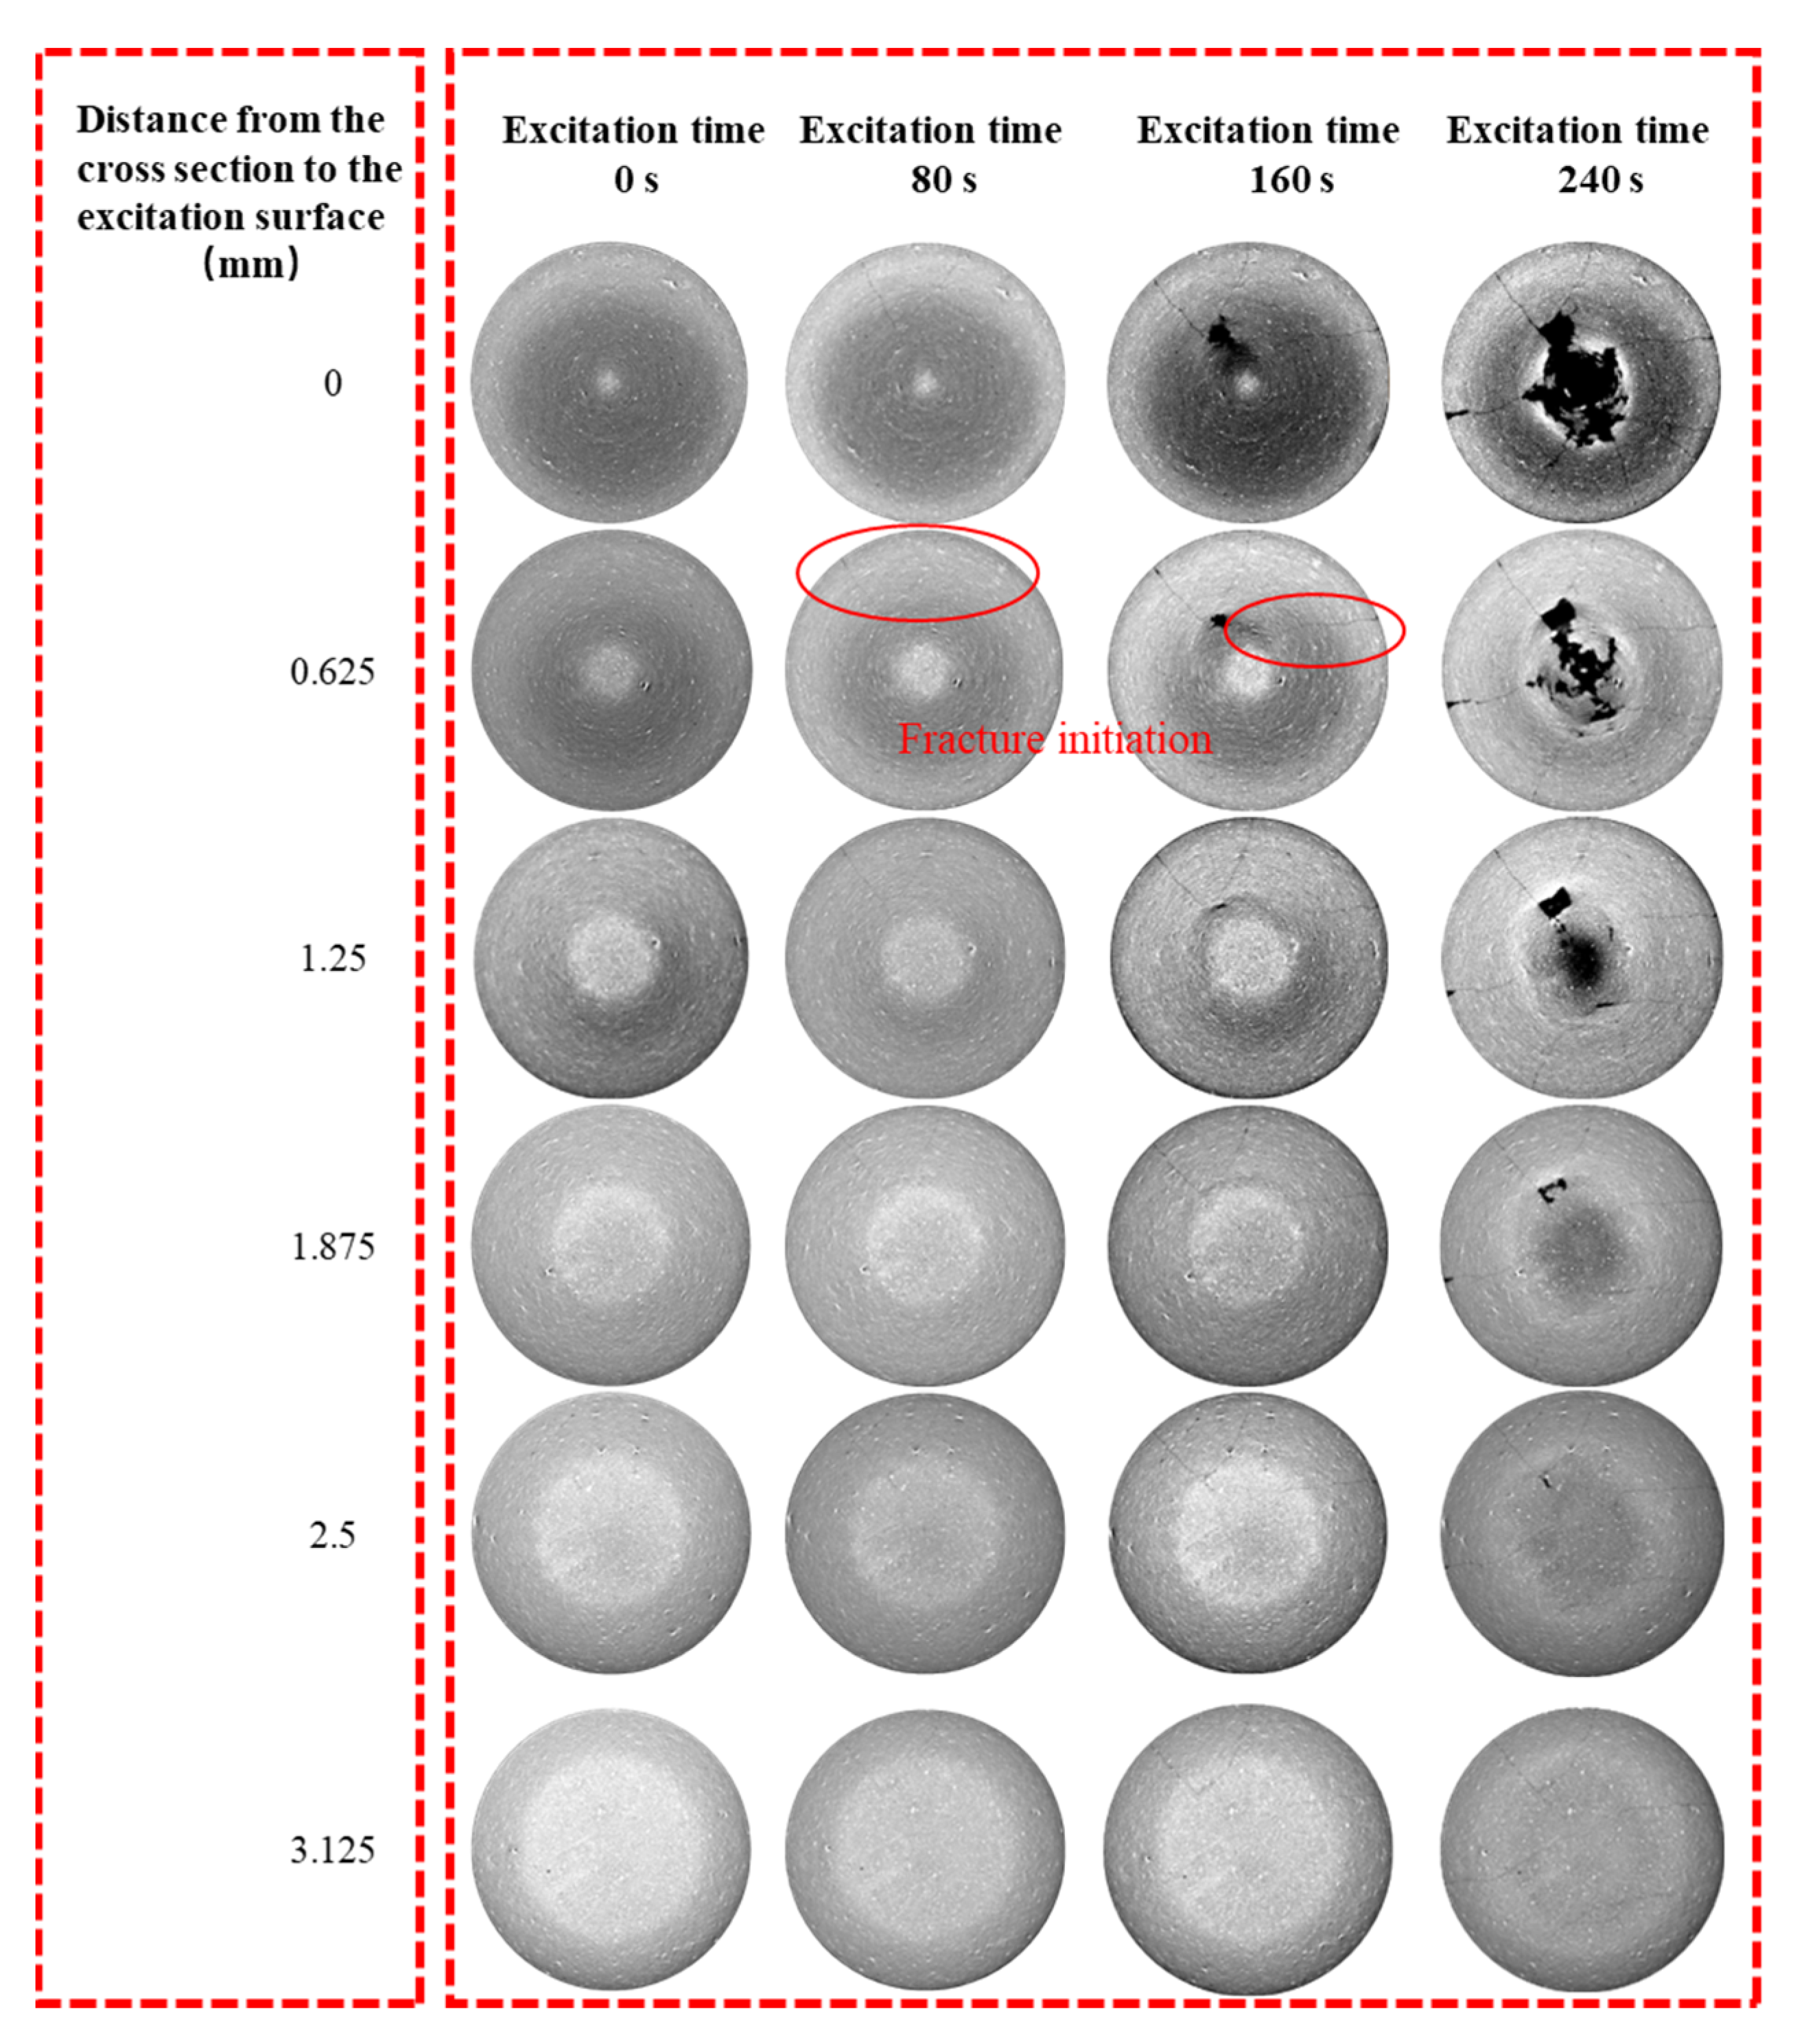
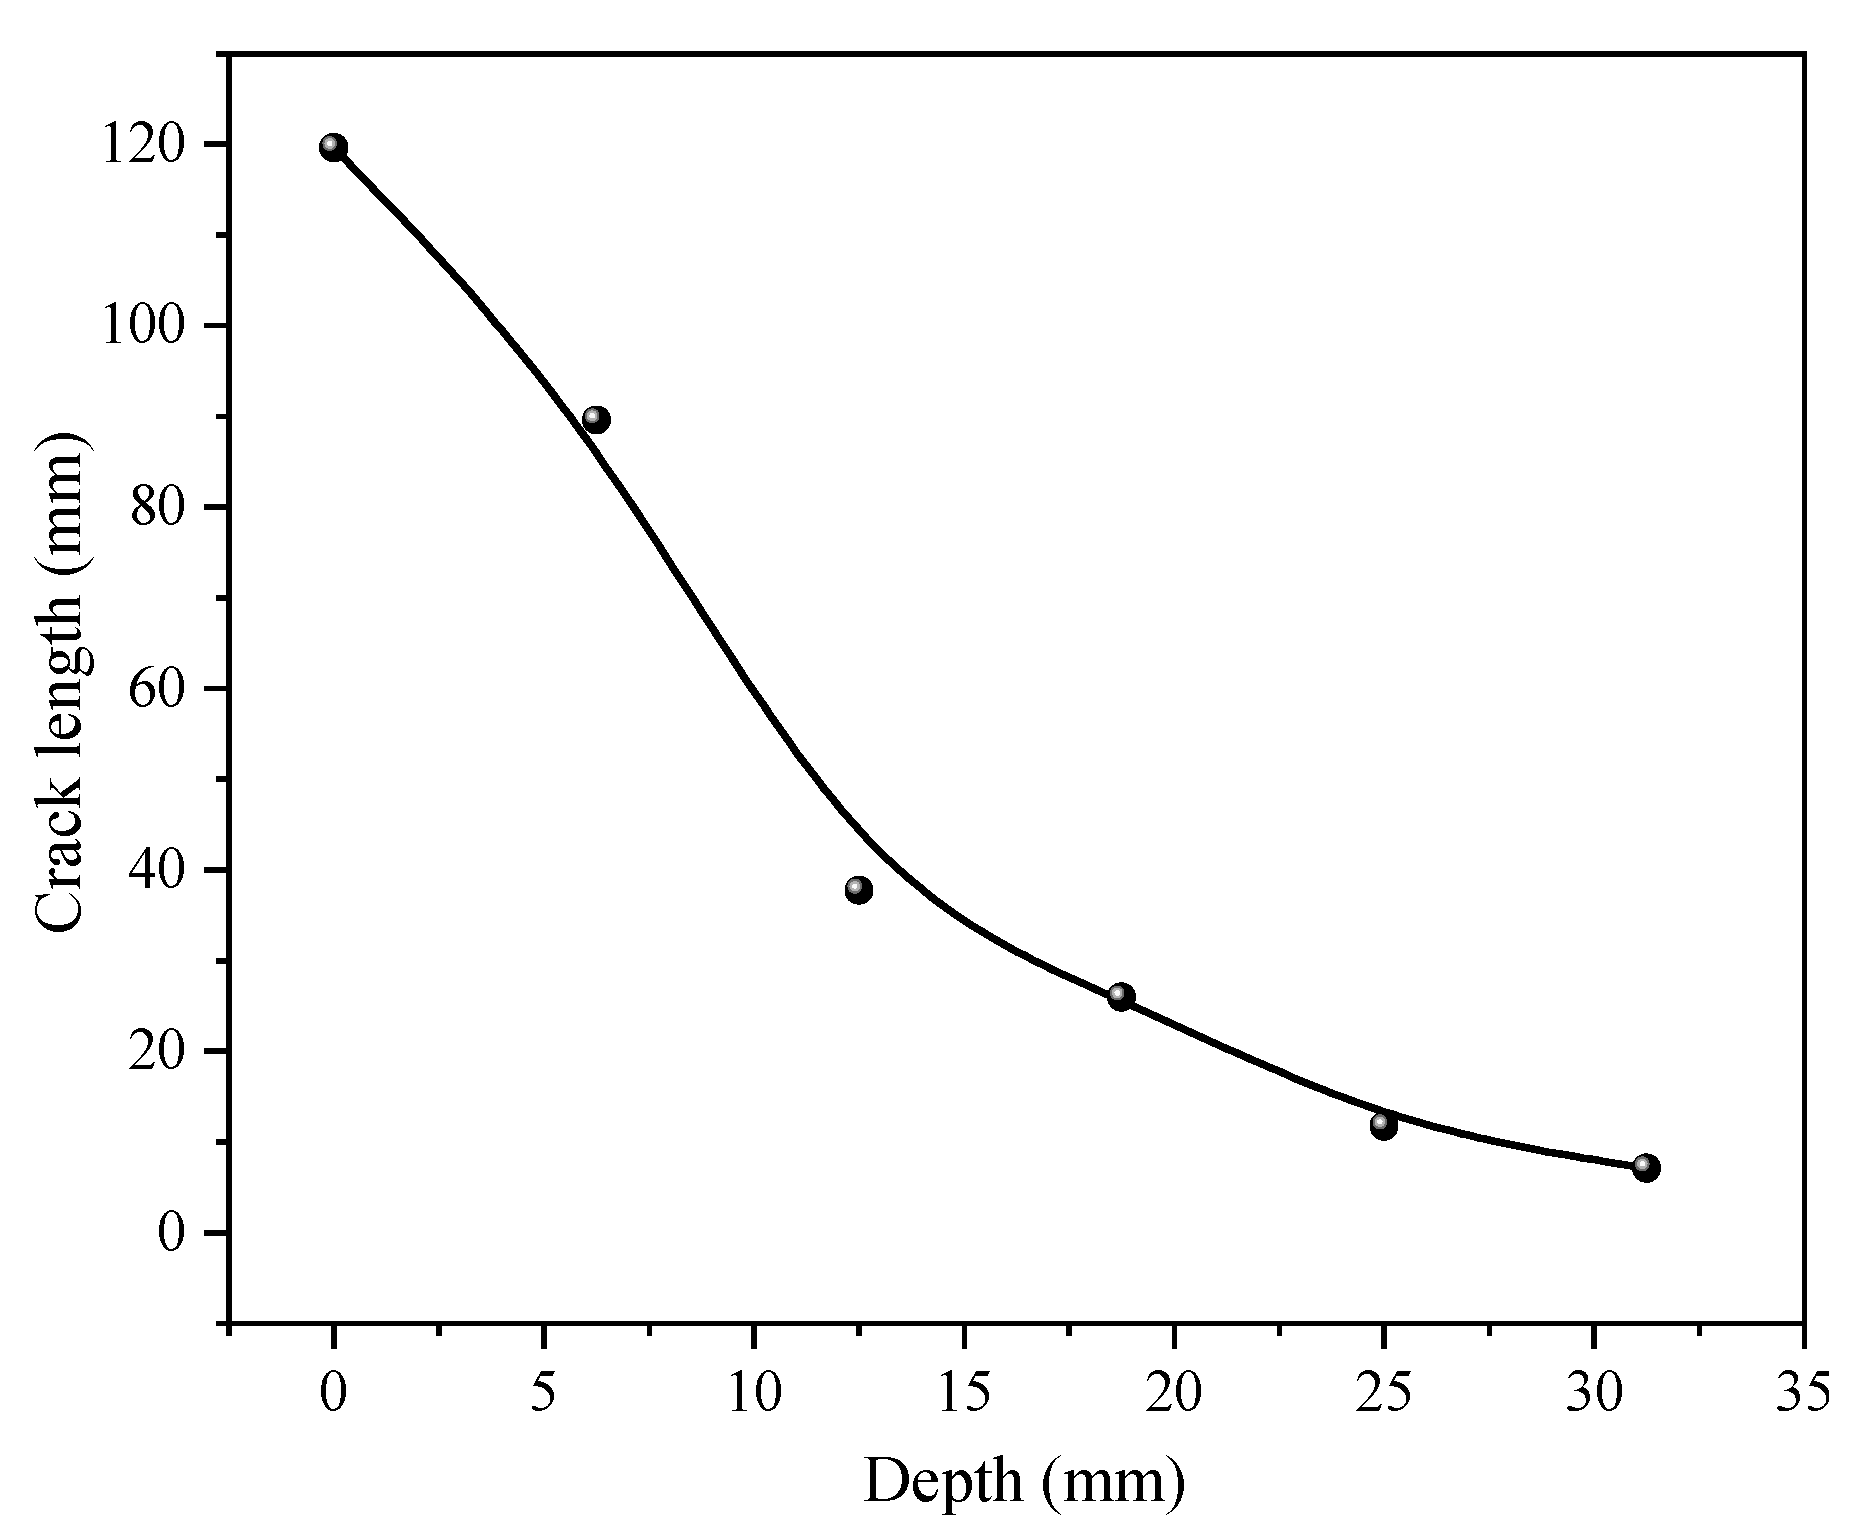
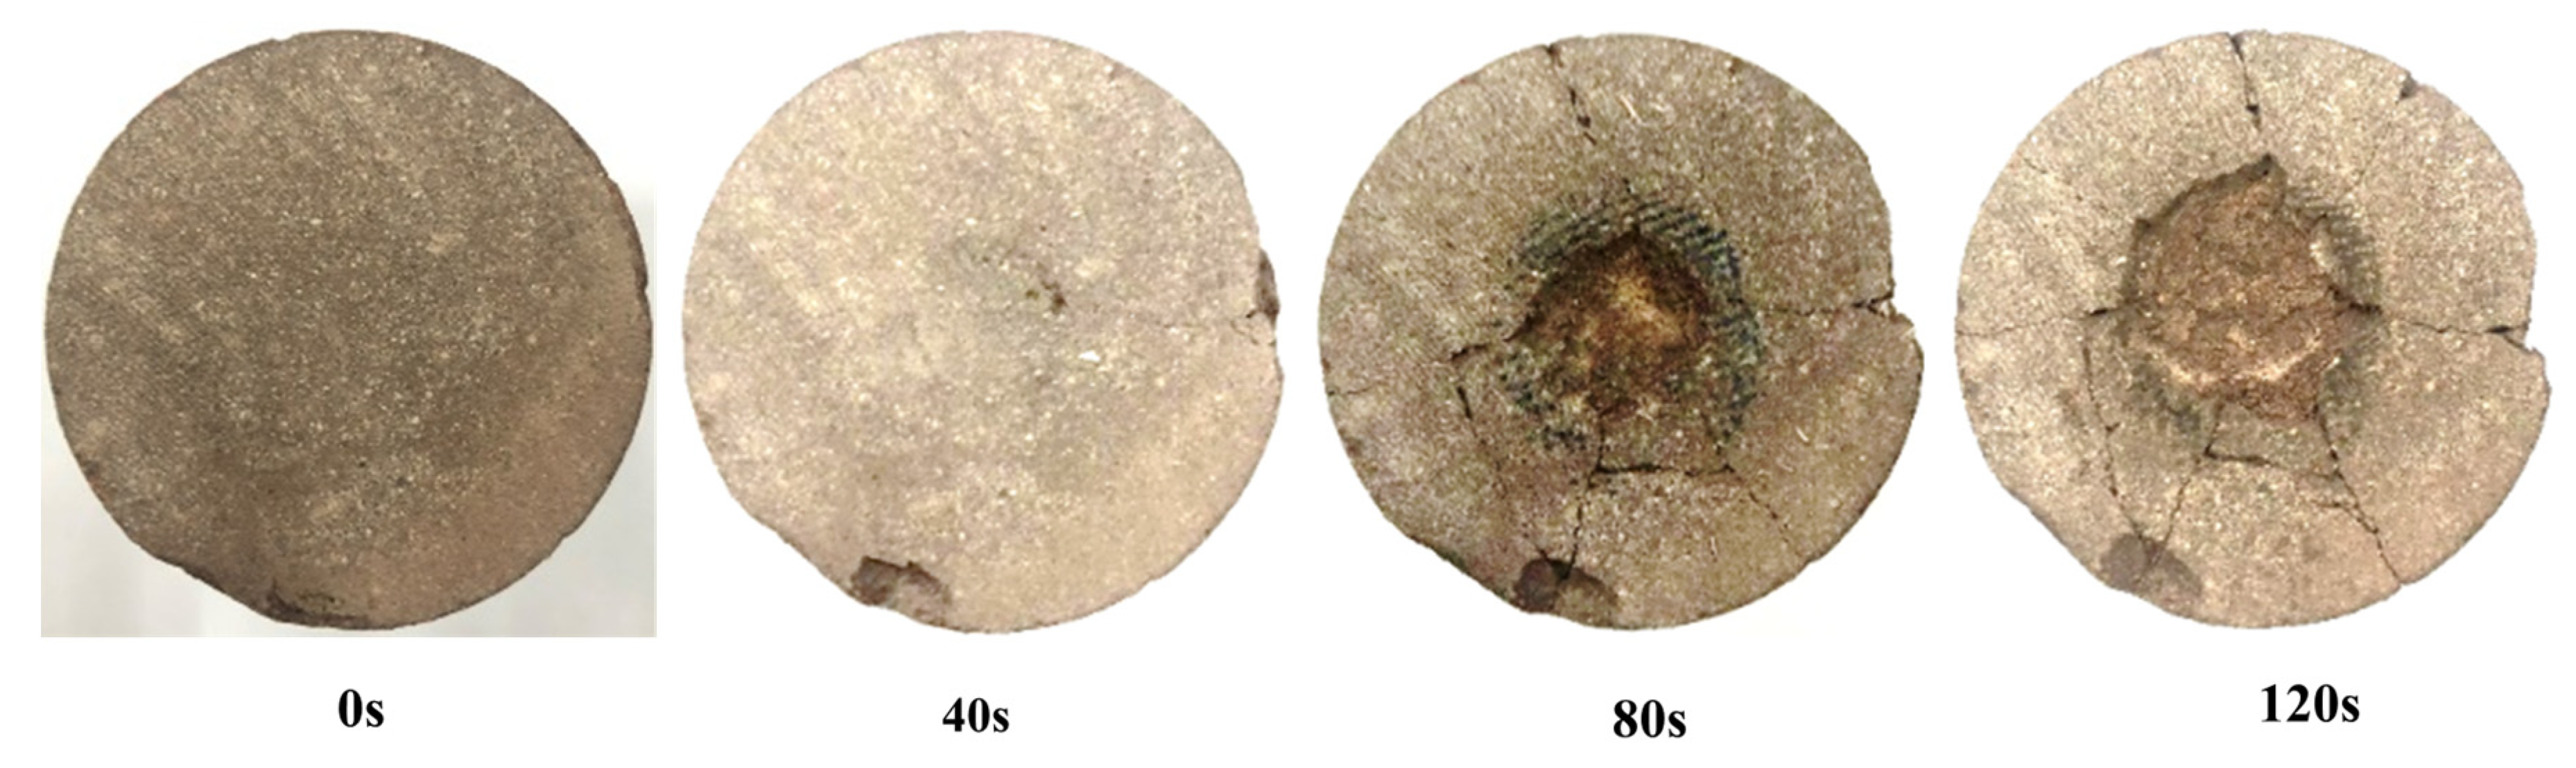
Under the stimulation of high-frequency ultrasonic vibration, the maximum crack propagation depth in red sandstone reaches 32.15 mm, with the highest crack development degree in the uppermost rock layer. The total crack length extends to 119.63 mm, and the maximum crack opening value reaches 1.287 mm. The excitation surface edge serves as the crack initiation zone, with the fracture propagating radially towards the free surface, forming a fracture surface. The adjacent fracture surfaces are connected, resulting in local rock failure;
(2)
The original CT image’s grayscale interval was equalized, and the image was nonlinearly stretched to enhance the contrast between the matrix and the pores and cracks within the rock. Subsequently, threshold segmentation of the processed image was performed using a trial-and-error method to isolate the pores and cracks in the CT image section. Ultimately, the solid porosity of the red sandstone was determined to be 6.18% when the image segmentation threshold was set at 0.06, which is consistent with the MRI test results;
(3)
The application of digital image processing technology was utilized to quantitatively determine the attenuation characteristics of the influence of ultrasonic vibration excitation on rock pore and fracture development with respect to rock depth. The porosity of the CT section in proximity to the excited surface demonstrated a significant increase of 170.42%, whereas that of the lowest CT section experienced a marginal increase of only 0.22%. This suggests a positive exponential relationship between the porosity increment and rock depth;
(4)
Incorporating the boundary conditions of the rock during testing, a mechanical model of rock fracture induced by ultrasonic high-frequency vibration, taking into account the effects of static load, is established. The model highlights a significant spatial disparity in the displacement of particles within the rock, with a greater reduction in the maximum displacement amplitude as the distance from the excitation surface increases. As the layer height varies from h to 3/4 h, h/2, and h/4, the displacement amplitudes of rock particles in the corresponding horizons decrease by 0.076, 0.293, and 0.617, respectively.

Author Contributions

All the authors contributed to publishing this paper. L.Z. and X.W. conceived and designed the research. L.Z. performed the experiments and wrote the original manuscript. L.Z. and Z.N. participated in the data analysis and manuscript modification. All authors have read and agreed to the published version of the manuscript.

Funding

This research was funded by the National Natural Science Foundation of China, (52374146, 51874282), and the Six Talent Peaks Project in Jiangsu Province (GDZB-052).

Institutional Review Board Statement

Not applicable.

Informed Consent Statement

Not applicable.

Data Availability Statement

Data is contained within the article.

Acknowledgments

Great appreciation goes to the editorial board and the reviewers of this paper.

Conflicts of Interest

The authors declare no conflict of interest.

References

  1. Huang, X.; Liu, Q.; Shi, K.; Pan, Y.; Liu, J. Application and prospect of hard rock TBM for deep roadway construction in coal mines. Tunn. Undergr. Space Technol. 2018, 73, 105–126. [Google Scholar] [CrossRef]
  2. Bar-Cohen, Y.; Bao, X.; Chang, Z.; Sherrit, S. An ultrasonic sampler and sensor platform for in-situ astrobiological exploration. In Smart Structures and Materials 2003: Smart Structures and Integrated Systems; SPIE: Bellingham, WA, USA, 2003; Volume 5056, pp. 457–465. [Google Scholar]
  3. Bagde, M.N.; Petros, V. Fatigue properties of intact sandstone samples subjected to dynamic uniaxial cyclical loading. Int. J. Rock Mech. Min. Sci. 2005, 42, 237–250. [Google Scholar] [CrossRef]
  4. Sherrit, S.; Chang, Z.; Bar-Cohen, Y.; Badescu, M. Integrated modeling of the ultrasonic/sonic drill/corer: Procedure and analysis results. In Smart Structures and Materials 2005: Smart Structures and Integrated Systems; Jet Propulsion Laboratory, National Aeronautics and Space Administration: Pasadena, CA, USA, 2005; Volume 5764, pp. 312–323. [Google Scholar]
  5. Feng, J.; Yan, T.; Cao, Y.; Sun, S. Ultrasonic-Assisted Rock-Breaking Technology and Oil and Gas Drilling Applications: A Review. Energies 2022, 15, 8394. [Google Scholar] [CrossRef]
  6. Wiercigroch, M.; Wojewoda, J.; Krivtsov, A.M. Dynamics of ultrasonic percussive drilling of hard rocks. J. Sound Vib. 2005, 280, 739–757. [Google Scholar] [CrossRef]
  7. Zhao, D.; Sangesland, S. Dynamical Analysis of Drill Bit With Ultrasonic Vibration. Pet. Technol. 2015, 10, 1–5. [Google Scholar]
  8. Fernando, P.; Zhang, M.; Pei, Z. Rotary ultrasonic machining of rocks: An experimental investigation. Adv. Mech. Eng. 2018, 10, 1–9. [Google Scholar] [CrossRef]
  9. Fernando, P.; Pei, Z.; Zhang, M. Mechanistic cutting force model for rotary ultrasonic machining of rocks. Int. J. Adv. Manuf. Technol. 2020, 109, 109–128. [Google Scholar] [CrossRef]
  10. Zhao, D.; Zhang, S.; Wang, M. Microcrack Growth Properties of Granite under Ultrasonic High-Frequency Excitation. Adv. Civ. Eng. 2019, 2019, 3069029. [Google Scholar] [CrossRef]
  11. Zhao, D.; Zhang, S.; Zhao, Y.; Wang, M. Experimental study on damage characteristics of granite under ultrasonic vibration load based on infrared thermography. Environ. Earth Sci. 2019, 78, 419. [Google Scholar] [CrossRef]
  12. Han, J.; Zhao, D.; Zhang, S.; Zhou, Y. Damage Evolution of Granite under Ultrasonic Vibration with Different Amplitudes. Shock Vib. 2022, 2022, 8975797. [Google Scholar] [CrossRef]
  13. Zhang, L.; Wang, X.; Wang, J.; Yang, Z. Mechanical characteristics and pore evolution of red sandstone under ultrasonic high-frequency vibration excitation. AIP Adv. 2021, 11, 055202. [Google Scholar] [CrossRef]
  14. Zhou, Y.; Tang, Q.; Zhang, S.; Zhao, D. The Mechanical Properties of Granite under Ultrasonic Vibration. Adv. Civ. Eng. 2019, 2019, 9649165. [Google Scholar] [CrossRef]
  15. Zhang, L.; Wang, X.; Wang, J.; Yang, Z.; Ma, T. Research on Fracture Characteristics and Energy Dissipation of Hard Rock under the Excitation of Ultrasonic Vibration. Geofluids 2022, 2022, 8351316. [Google Scholar] [CrossRef]
  16. Zhou, Y.; Zhao, D.; Tang, Q.; Wang, M. Experimental and numerical investigation of the fatigue behaviour and crack evolution mechanism of granite under ultra-high-frequency loading. R. Soc. Open Sci. 2020, 7, 200091. [Google Scholar] [CrossRef] [PubMed]
  17. Li, S.; Tian, S.; Li, W.; Ling, X.; Kapitaniak, M.; Vaziri, V. Numerical Study on the Elastic Deformation and the Stress Field of Brittle Rocks under Harmonic Dynamic Load. Energies 2020, 13, 851. [Google Scholar] [CrossRef]
  18. Bieniawski, Z.T.; Bernede, M.J. Suggested methods for determining the uniaxial compressive strength and deformability of rock materials. Int. J. Rock Mech. Min. Sci. Geomech. Abstr. 1979, 16, 138–140. [Google Scholar] [CrossRef]
  19. Chun, B.; Xiaoyue, L. The edge detection technology of CT image for study the growth of rock crack. In Proceedings of the 2009 ISECS International Colloquium on Computing, Communication, Control, and Management, Sanya, China, 8–9 August 2009; pp. 286–288. [Google Scholar]
  20. Wang, Y.; Hou, Z.Q.; Hu, Y.Z. In Situ X-Ray Computed Tomography Experiment on Mesodamage Evolution of Subgrade Bimsoil during Cycle Loading. J. Mater. Civ. Eng. 2019, 31, 04019198. [Google Scholar] [CrossRef]
Figure 1. Red sandstone specimens.
Applsci 13 12424 g001
Figure 2. Nuclear magnetic resonance T2 spectrum.
Applsci 13 12424 g002
Figure 3. Ultrasonic high-frequency vibration excitation testing system.
Applsci 13 12424 g003
Figure 4. Schematic illustration of X-ray CT scanning.
Applsci 13 12424 g004
Figure 5. Scheme of CT scanning.
Applsci 13 12424 g005
Figure 6. Cross-section CT images of red sandstone samples.
Applsci 13 12424 g006
Figure 7. (a) Gray value distribution of CT section images; (b) distribution of gray values on the specified path of the CT slice image.
Applsci 13 12424 g007
Figure 8. (a) Before gray stretching; (b) after gray stretching.
Applsci 13 12424 g008
Figure 9. Image binarization results under different segmentation thresholds.
Applsci 13 12424 g009
Figure 10. Pore distribution.
Applsci 13 12424 g010
Figure 11. Horizontal CT slices in different excitation stages.
Applsci 13 12424 g011
Figure 12. The damage area of CT section varies with rock depth.
Applsci 13 12424 g012
Figure 13. The total crack length varies with rock depth.
Applsci 13 12424 g013
Figure 14. Progressive failure process of rock.
Applsci 13 12424 g014
Figure 15. Meso fracture process of rock under ultrasonic vibration excitation.
Applsci 13 12424 g015
Figure 16. Porosity distribution in different excitation stages.
Applsci 13 12424 g016
Figure 17. (a) Pore distribution changes in different positions of rock slices; (b) porosity changes of rock sections at different positions.
Applsci 13 12424 g017
Figure 18. Relationship between porosity increment and sample height.
Applsci 13 12424 g018
Figure 19. The displacement of particles in different positions of rocks varies.
Applsci 13 12424 g019
Table 1. Test parameters of ultrasonic vibration rock breaking system.
Power
/W
Frequency
/kHz
Amplitude
/μm
Static Load
/MPa
Load Area
/mm2
150020700~1176.7
Table 2. Porosity in different formations with different excitation times.
Distance from the Cross-Section to the Excitation Surface (mm)Porosity(%)
0 s40 s80 s120 s
6.259.370213.36718.349425.3394
12.56.4439.992114.563519.9725
18.754.79496.54678.032614.4786
255.83136.91378.025613.5415
31.254.37986.28857.15359.9004
37.58.36619.322811.870813.3617
43.757.02547.91338.972310.435
507.03867.87858.888310.2421
56.254.14744.80416.62198.2626
62.56.70486.95027.87439.1163
68.754.84054.95785.31785.8661
755.43425.68756.05266.3329
81.256.14436.3226.99527.2805
87.53.83443.86643.90323.9473
93.757.27037.29857.39637.4475
1007.21527.22357.22917.2317
Disclaimer/Publisher’s Note: The statements, opinions and data contained in all publications are solely those of the individual author(s) and contributor(s) and not of MDPI and/or the editor(s). MDPI and/or the editor(s) disclaim responsibility for any injury to people or property resulting from any ideas, methods, instructions or products referred to in the content.

