
Instrumental Gait Analysis and Tibial Plateau Modelling to Support Pre- and Post-Operative Evaluations in Personalized High Tibial Osteotomy
 , , , , , and
Abstract
:Featured Application
Abstract
1. Introduction
2. Methods
2.1. Patient Cohort
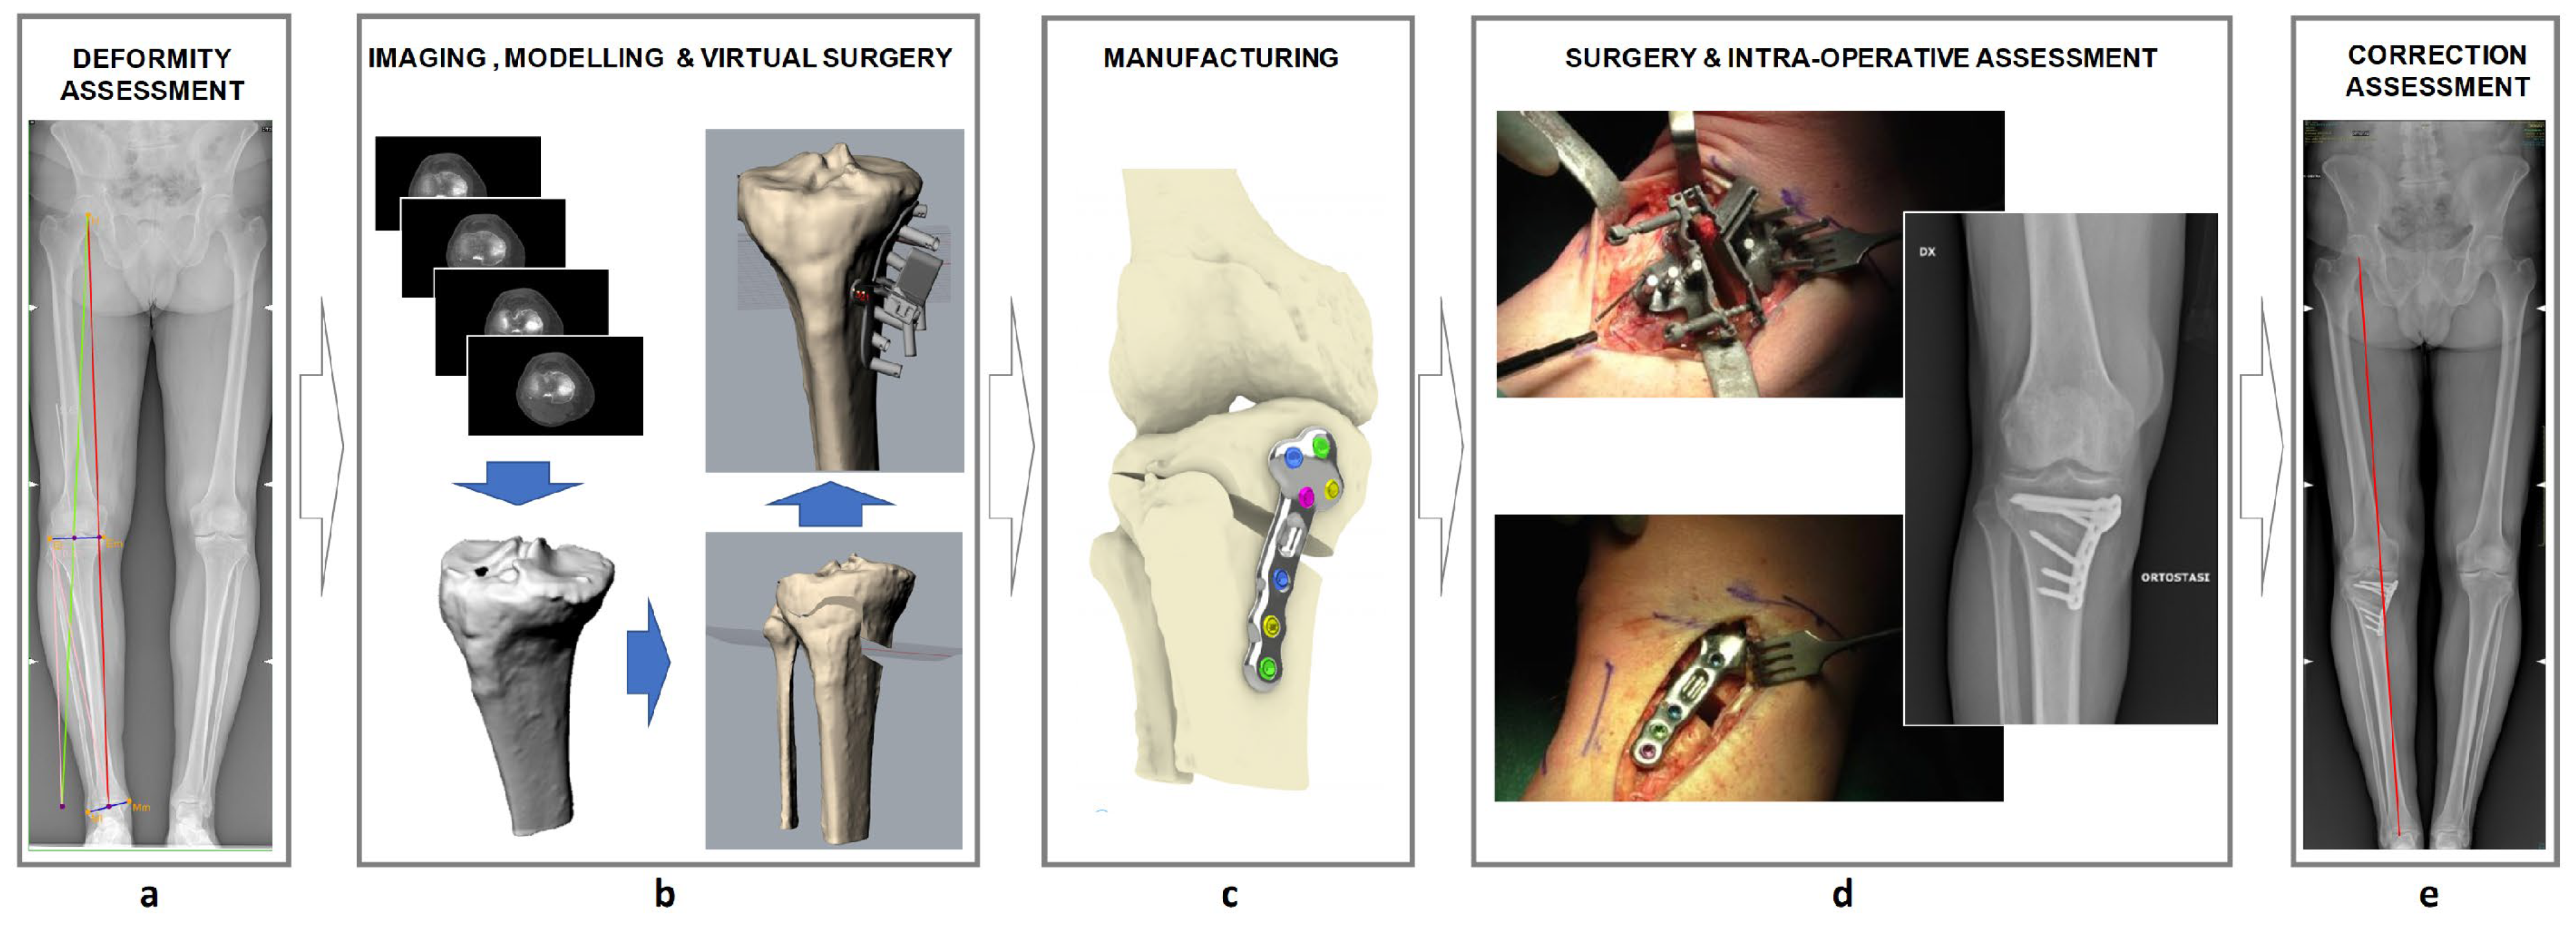
2.2. The Customized HTO Procedure
2.3. Surgery
2.4. Clinical, Functional and Radiological Analyses
2.5. Data Processing and Statistical Analysis
3. Results
3.1. Overview
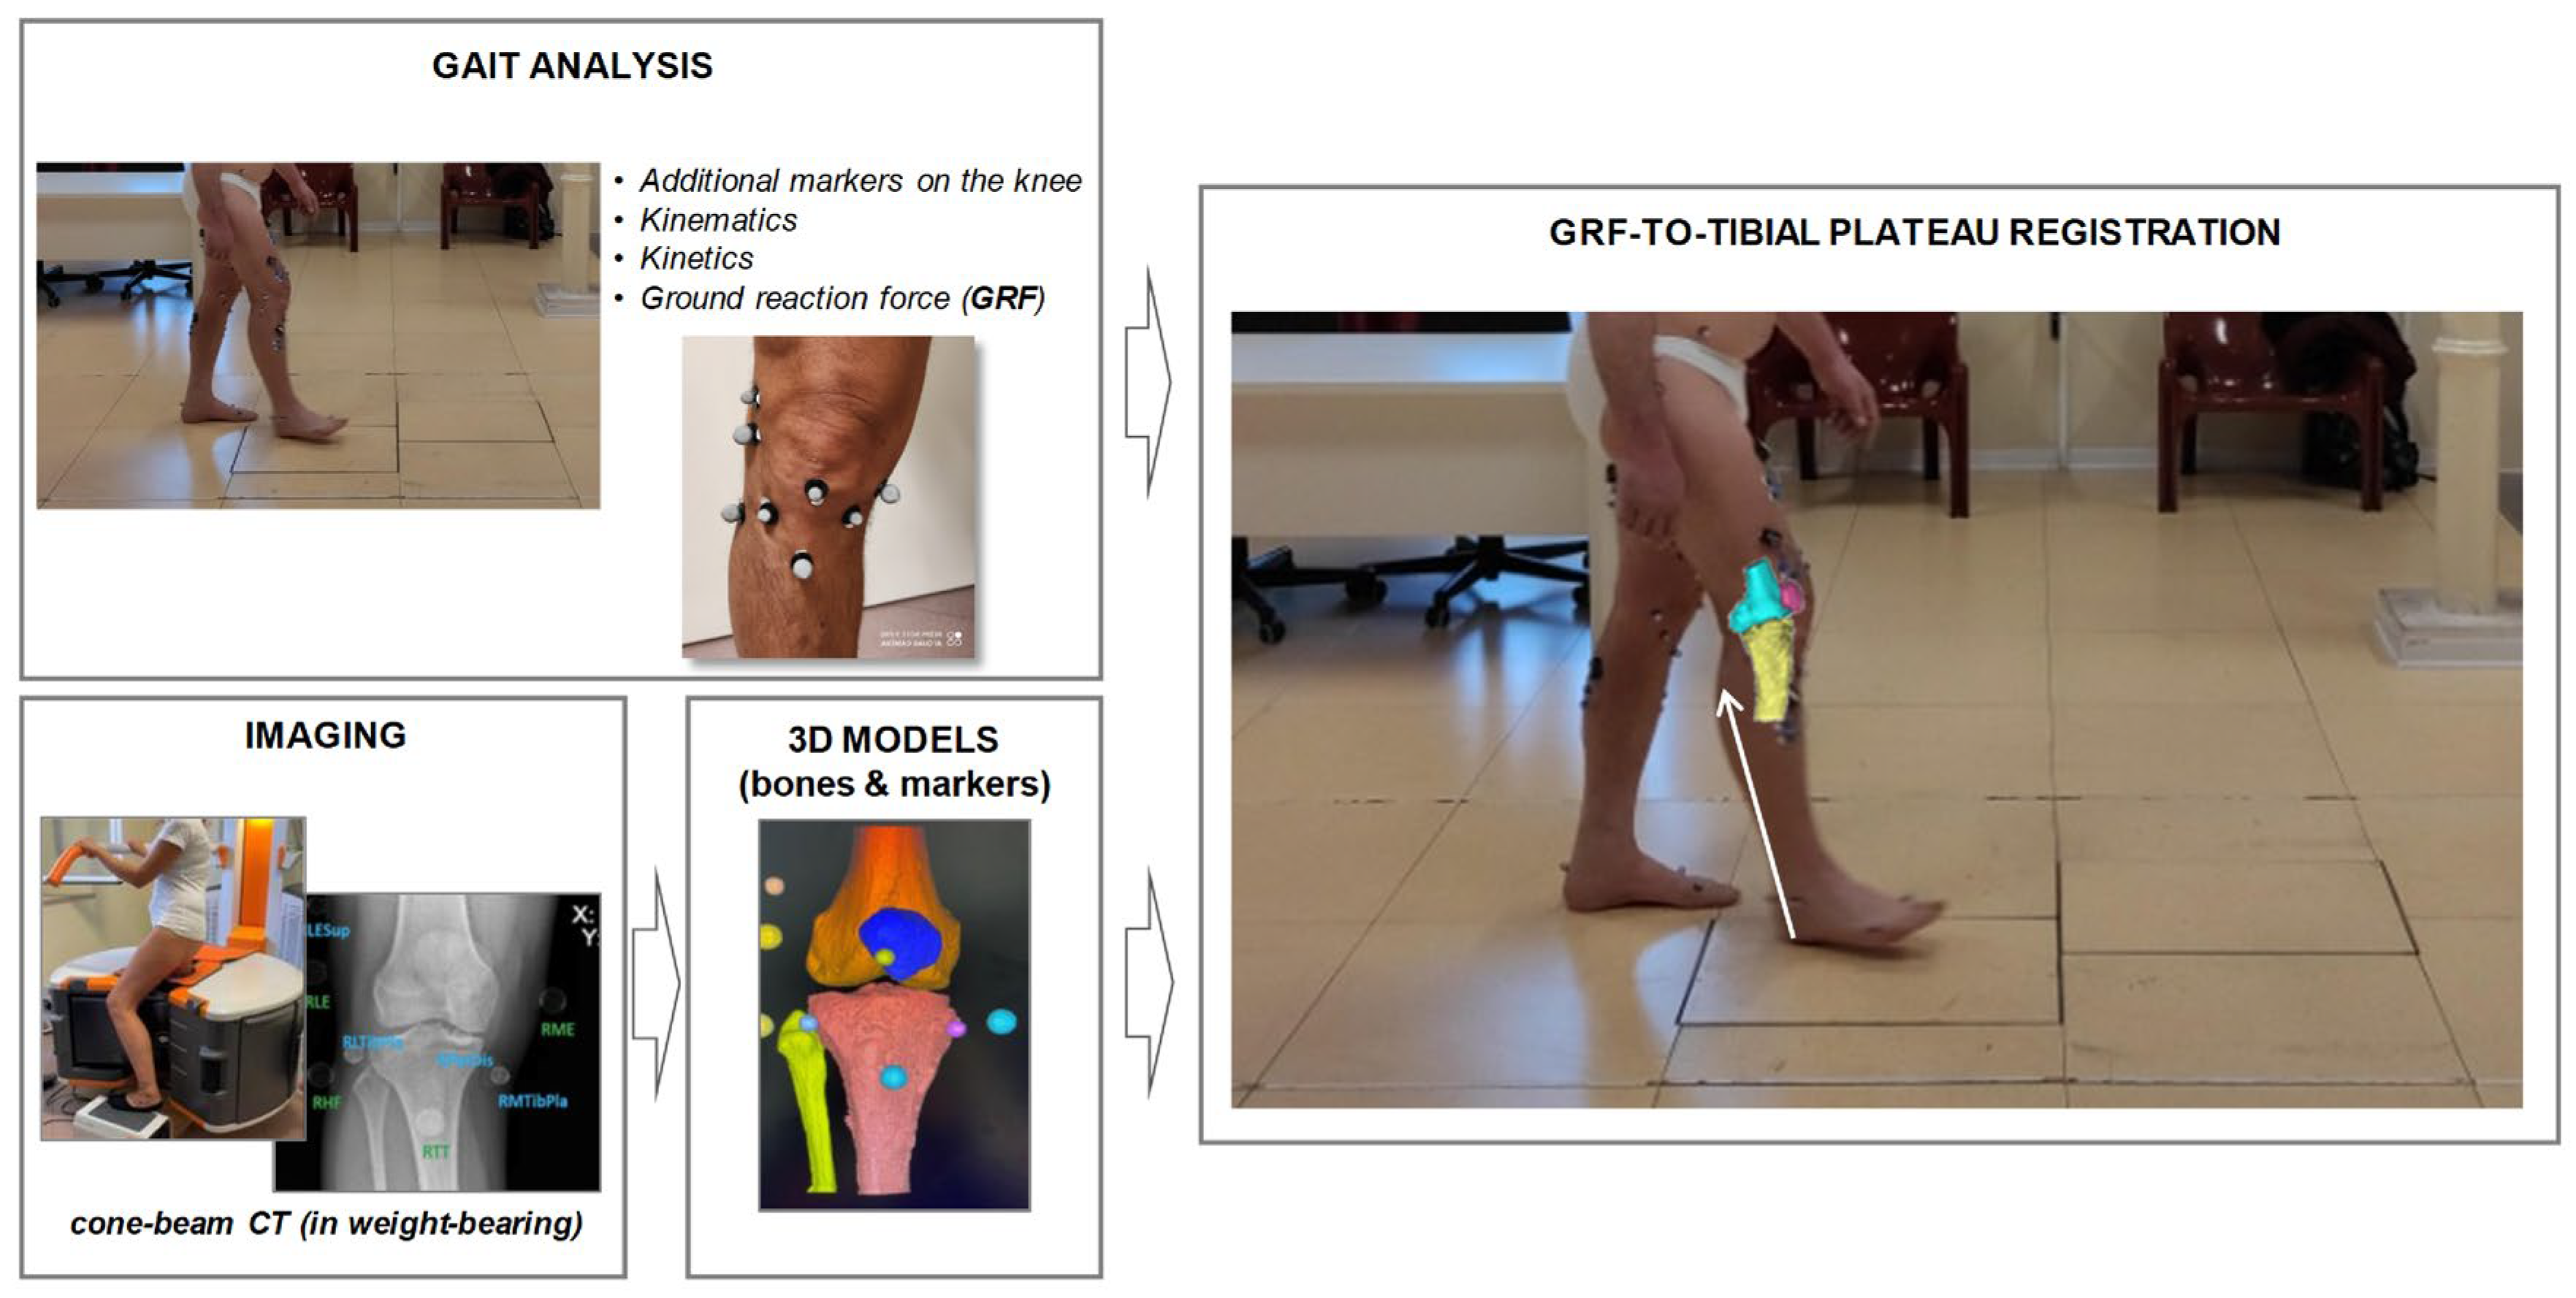
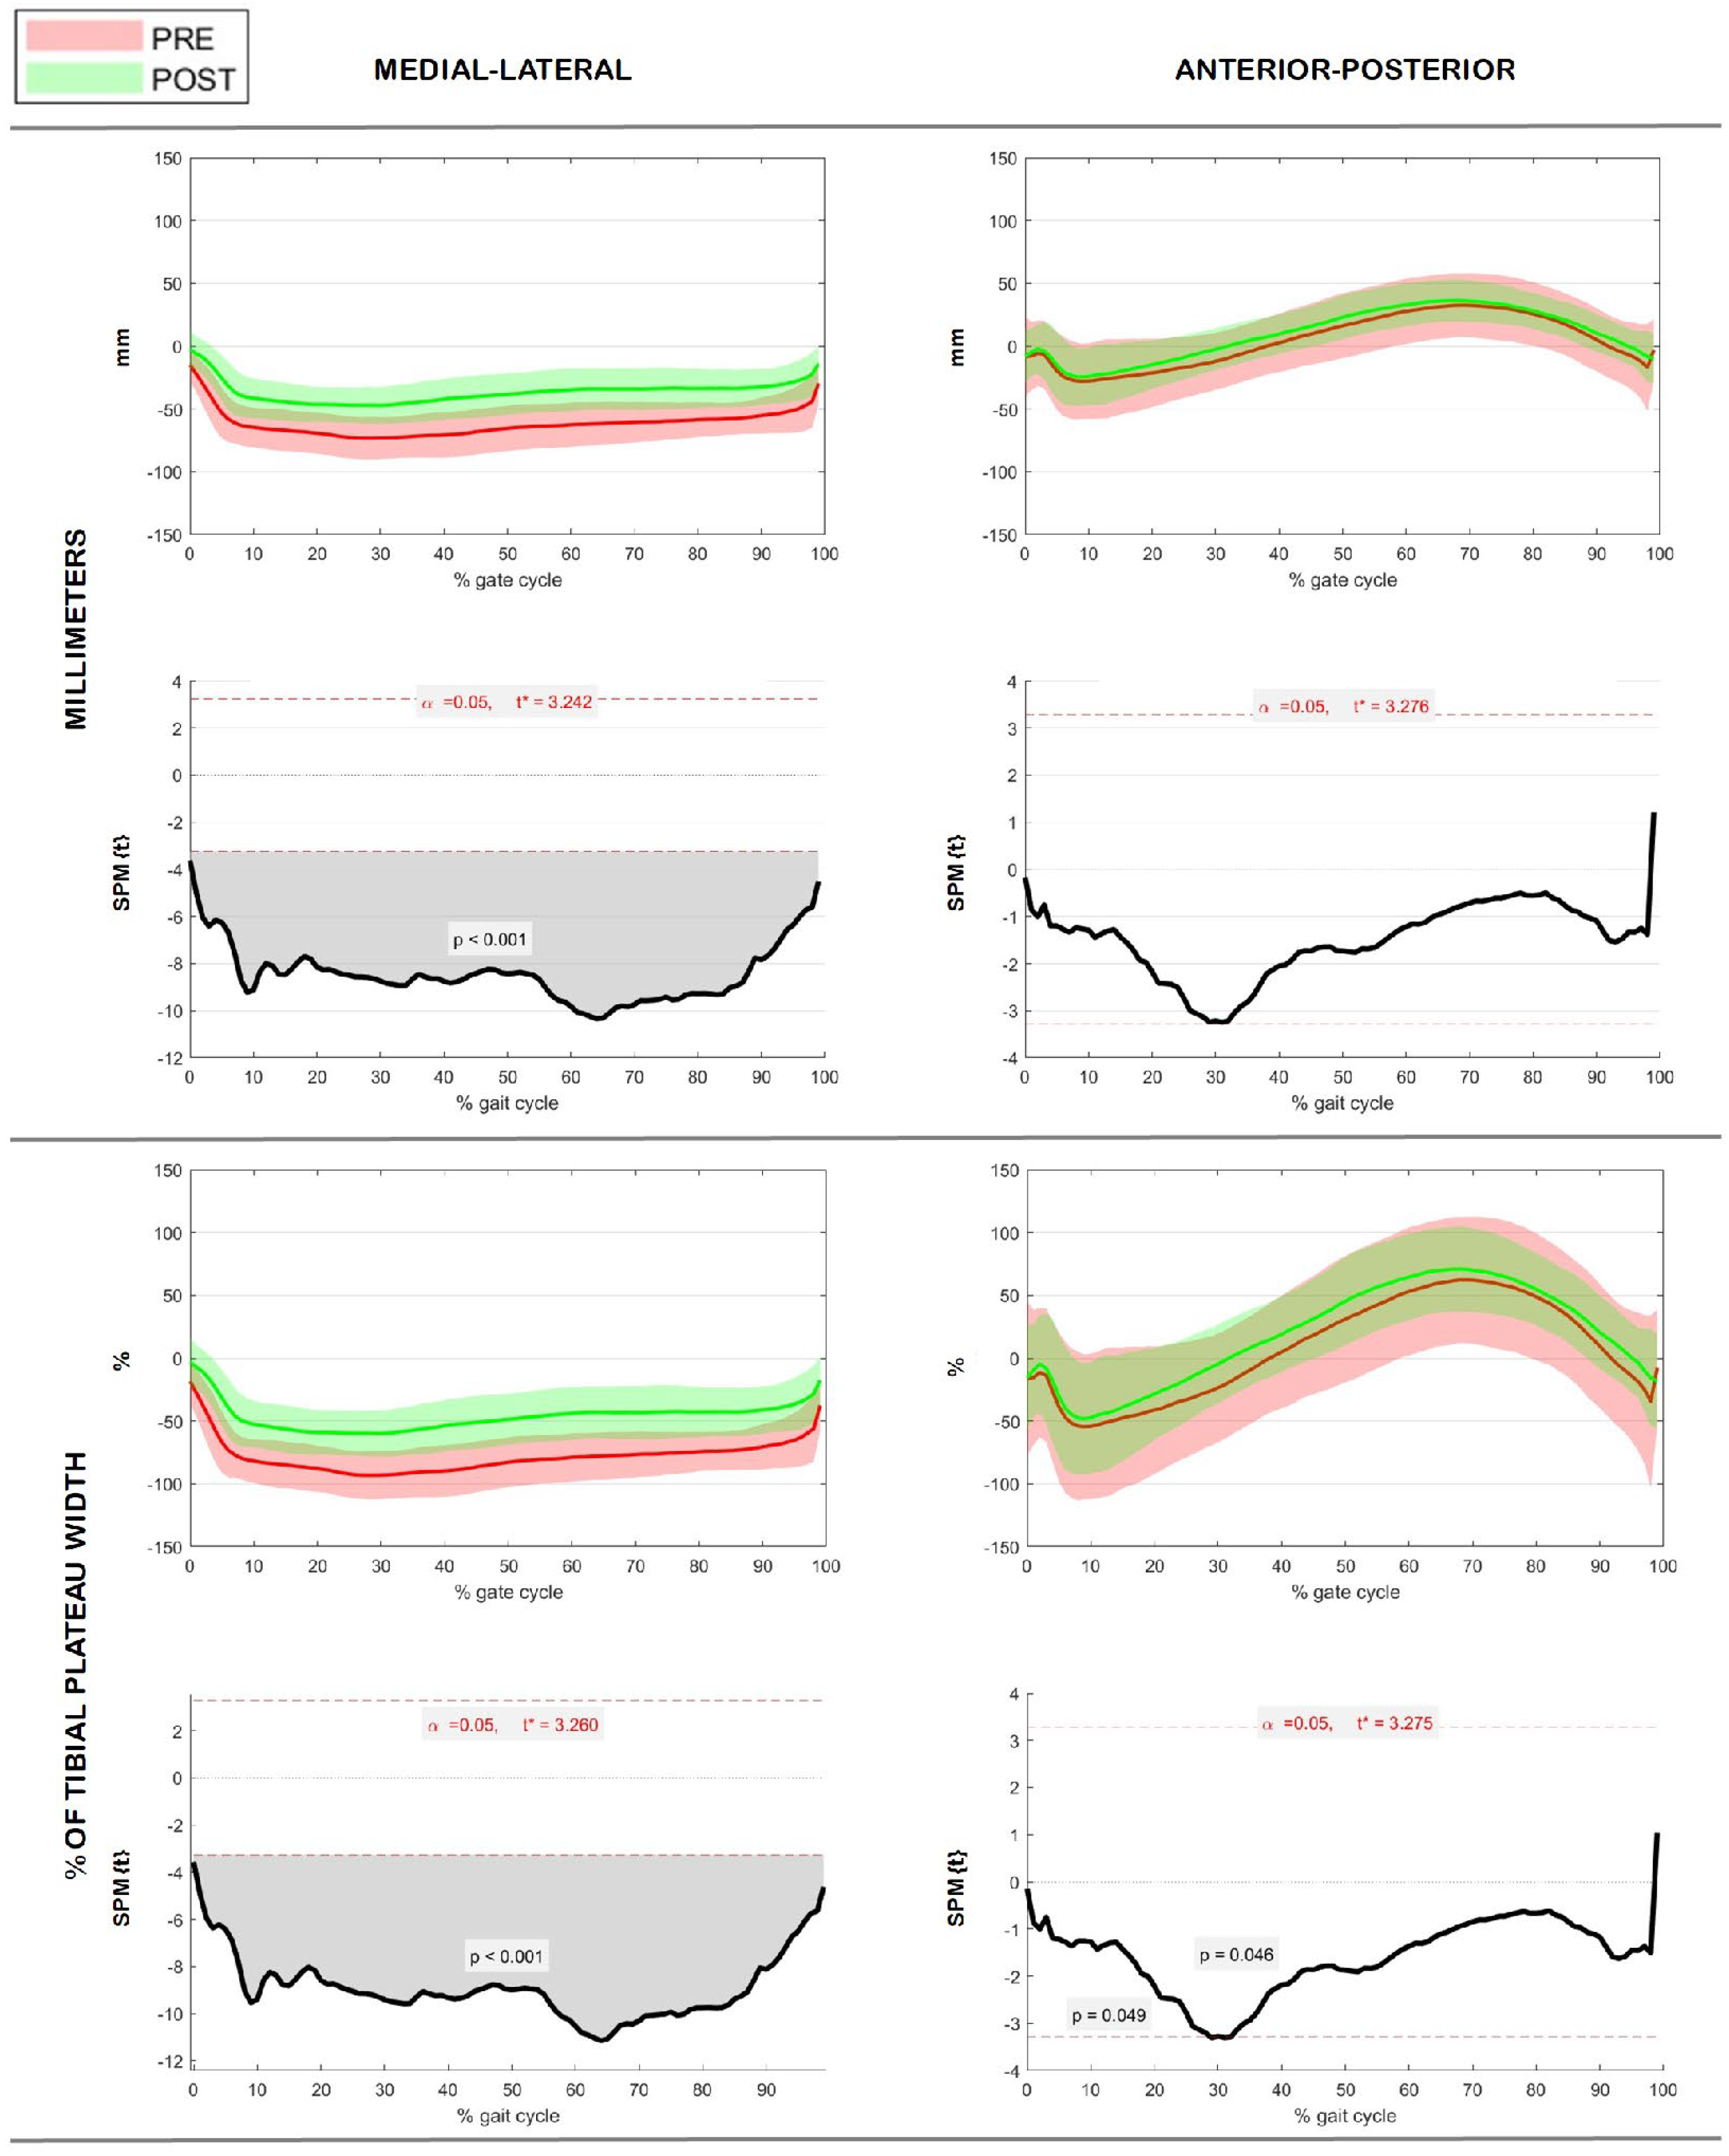
3.2. GRF Characterization on Tibial Plateau
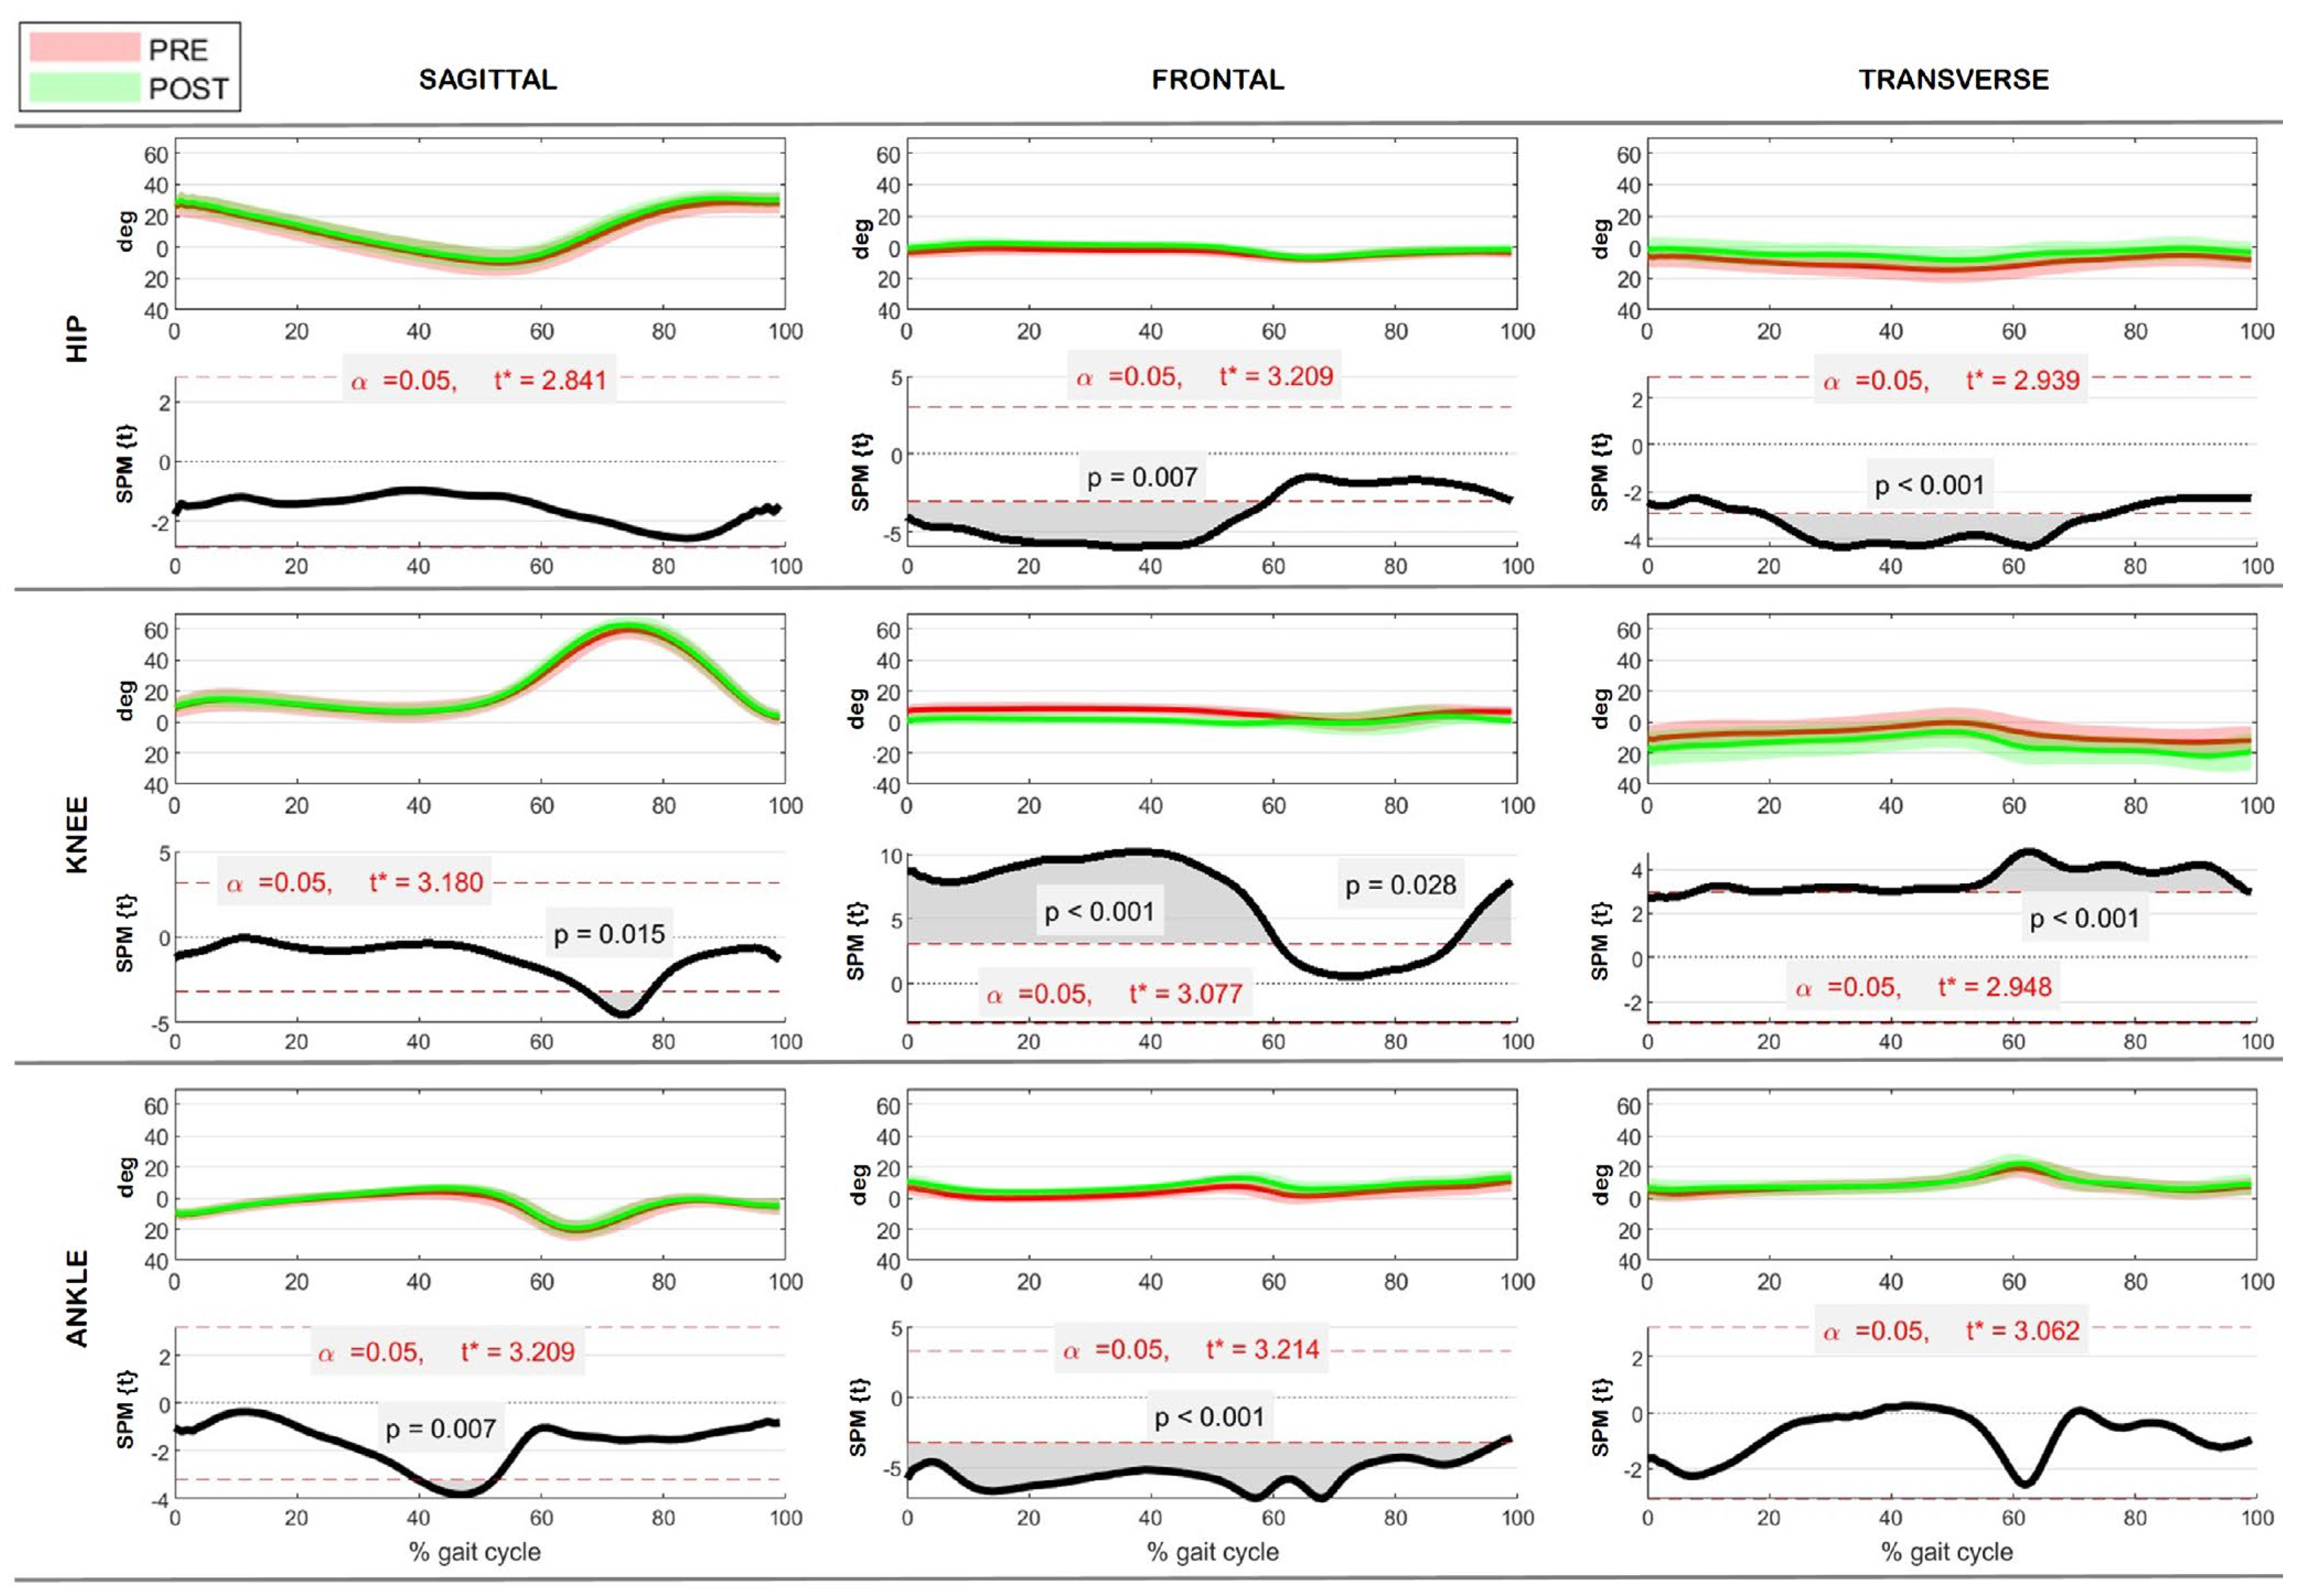
3.3. Kinematics
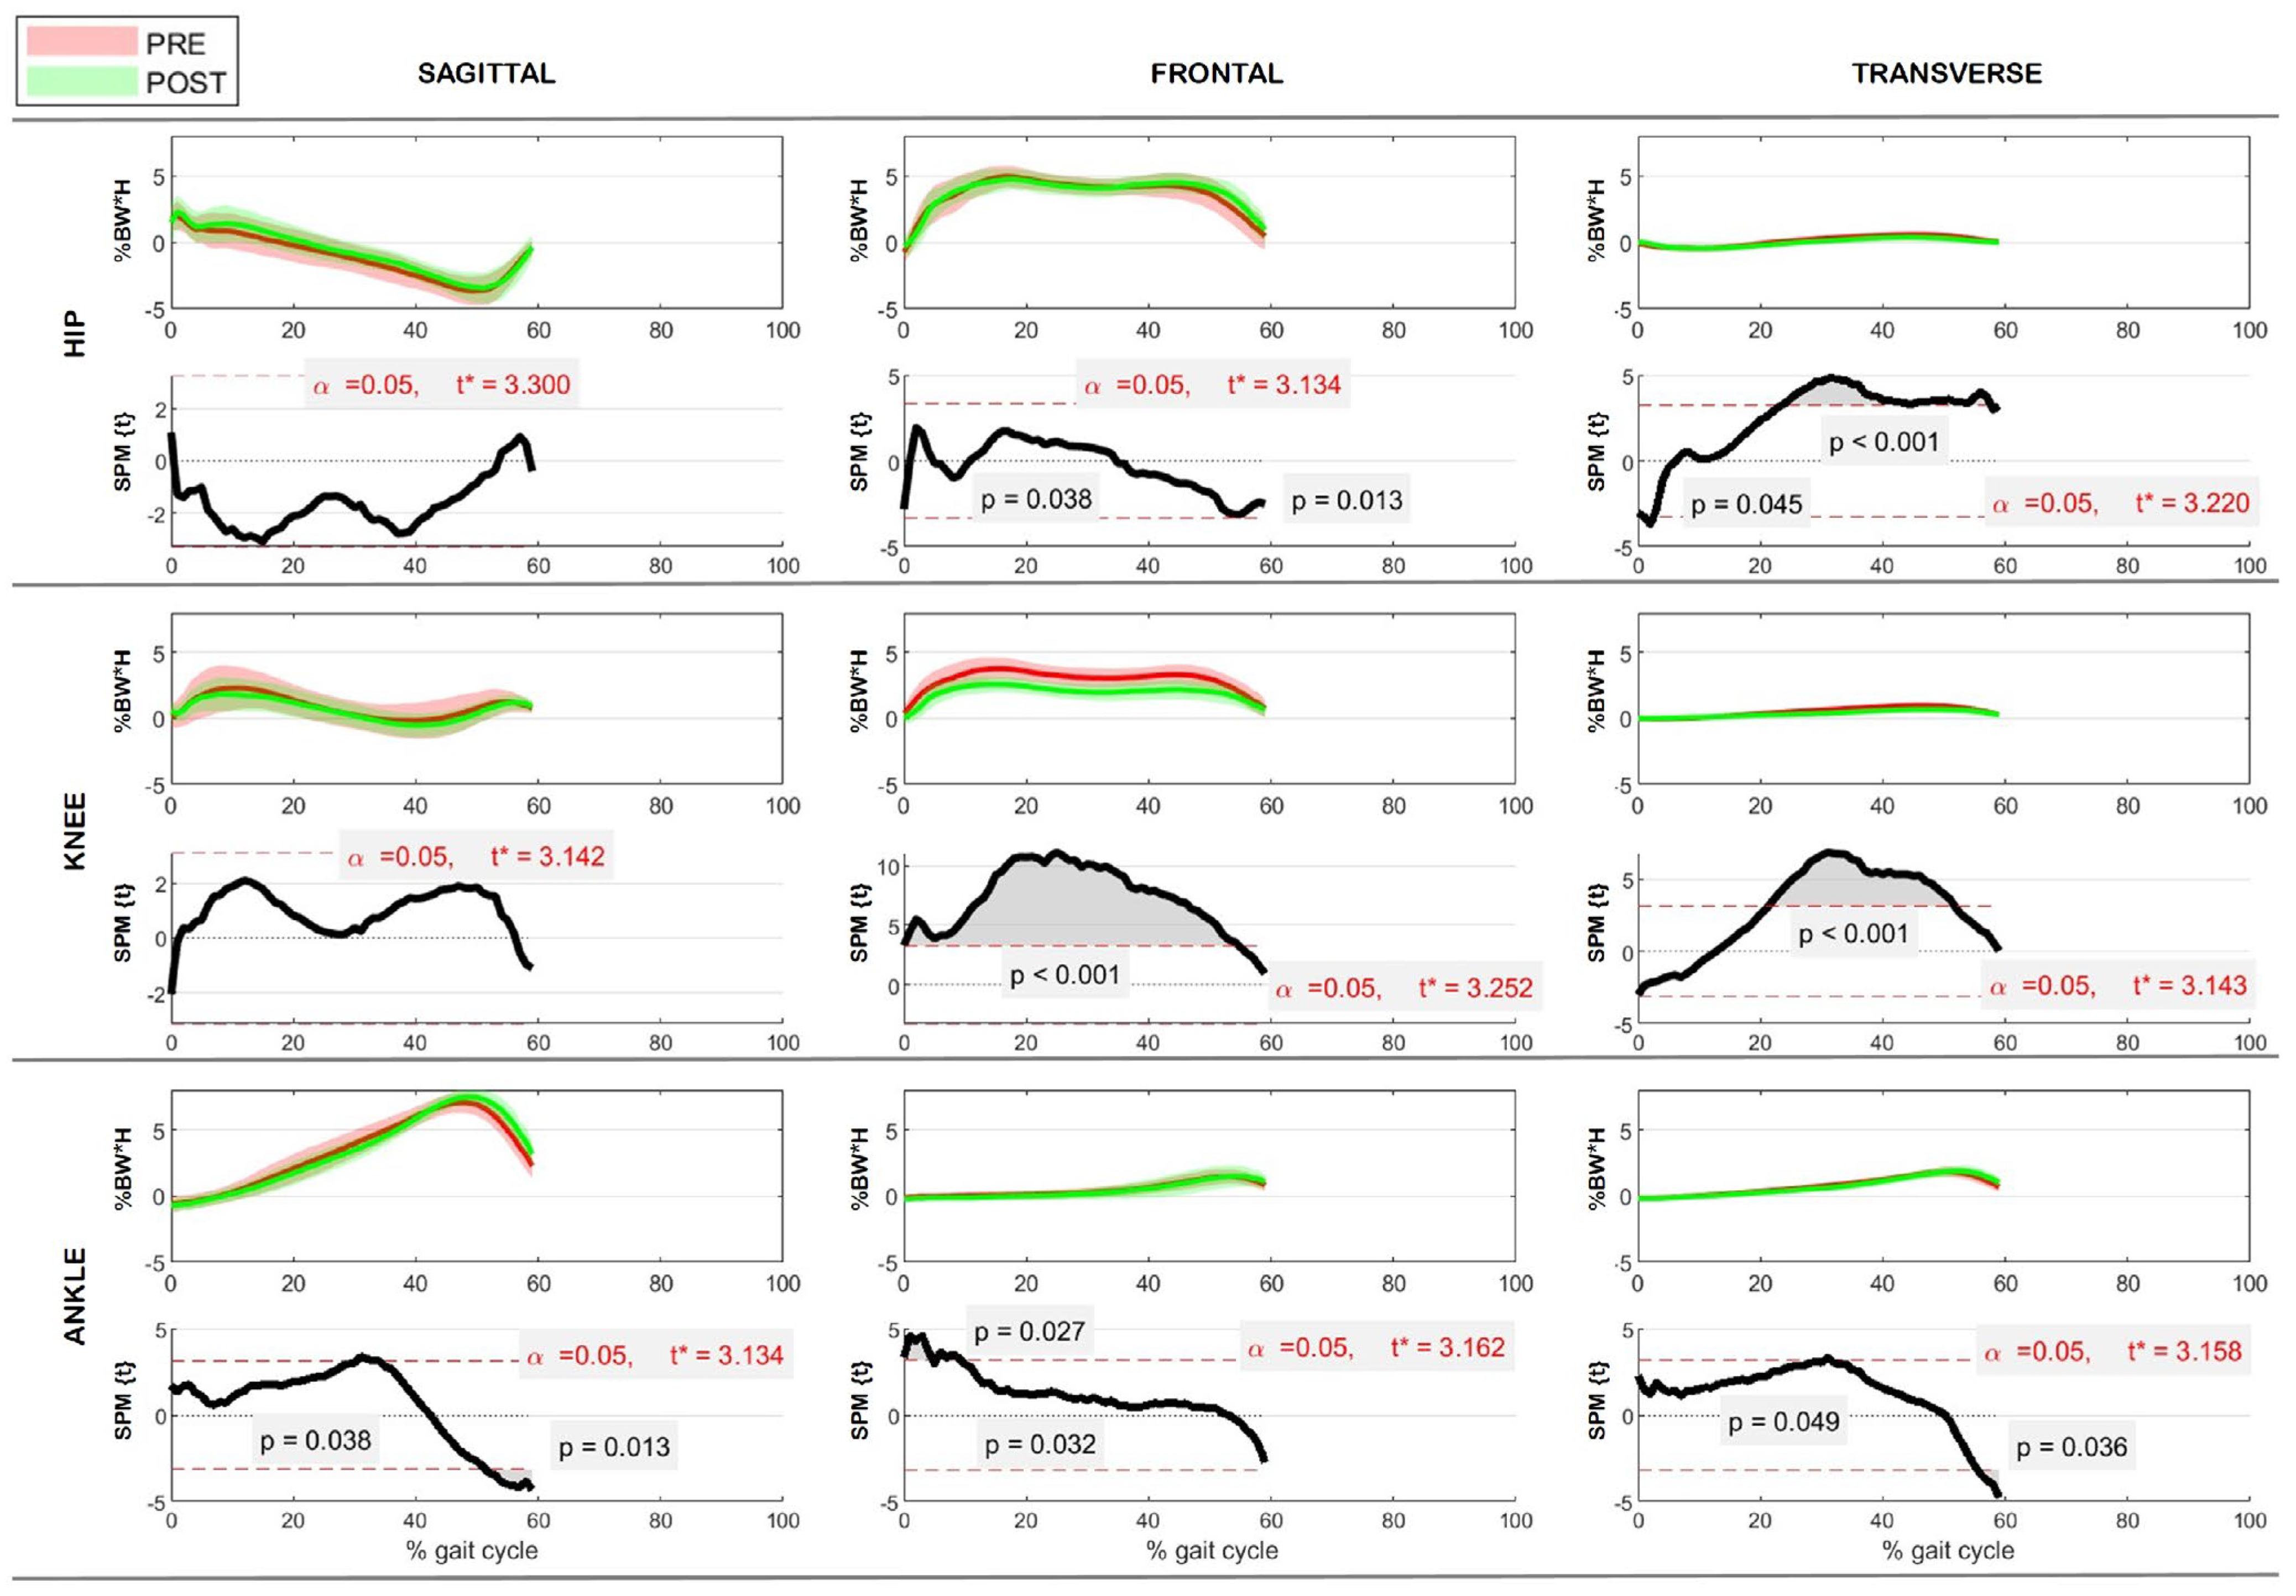
3.4. Kinetics
4. Discussion
5. Conclusions
Author Contributions
Funding
Institutional Review Board Statement
Informed Consent Statement
Data Availability Statement
Conflicts of Interest
References
- Baliunas, A.J.; Hurwitz, D.E.; Ryals, A.B.; Karrar, A.; Case, J.P.; Block, J.A.; Andriacchi, T.P. Increased knee joint loads during walking are present in subjects with knee osteoarthritis. Osteoarthr. Cartil. 2002, 10, 573–579. [Google Scholar] [CrossRef] [PubMed]
- Rajgopal, A.; Noble, P.C.; Vasdev, A.; Ismaily, S.K.; Sawant, A.; Dahiya, V. Wear Patterns in Knee Articular Surfaces in Varus Deformity. J. Arthroplast. 2015, 30, 2012–2016. [Google Scholar] [CrossRef]
- Sharma, L. The role of varus and valgus alignment in knee osteoarthritis. Arthritis Rheumatol. 2007, 56, 1044–1047. [Google Scholar] [CrossRef] [PubMed]
- Sharma, L.; Song, J.; Dunlop, D.; Felson, D.; Lewis, C.E.; Segal, N.; Torner, J.; Cooke, T.D.; Hietpas, J.; Lynch, J.; et al. Varus and valgus alignment and incident and progressive knee osteoarthritis. Ann. Rheum. Dis. 2010, 69, 1940–1945. [Google Scholar] [CrossRef]
- Khakha, R.S.; Bin Abd Razak, H.R.; Kley, K.; van Heerwaarden, R.; Wilson, A.J. Role of high tibial osteotomy in medial compartment osteoarthritis of the knee: Indications, surgical technique and outcomes. J. Clin. Orthop. Trauma 2021, 23, 101618. [Google Scholar] [CrossRef] [PubMed]
- Wolcott, M.; Traub, S.; Efird, C. High tibial osteotomies in the young active patient. Int. Orthop. 2010, 34, 161–166. [Google Scholar] [CrossRef]
- Jackson, J.P.; Waugh, W. Tibial osteotomy for osteoarthritis of the knee. J. Bone Jt. Surg. Br. 1961, 43-B, 746–751. [Google Scholar] [CrossRef]
- Lee, D.C.; Byun, S.J. High tibial osteotomy. Knee Surg. Relat. Res. 2012, 24, 61–69. [Google Scholar] [CrossRef]
- Rossi, R.; Bonasia, D.E.; Amendola, A. The Role of High Tibial Osteotomy in the Varus Knee. JAAOS J. Am. Acad. Orthop. Surg. 2011, 19, 590–599. [Google Scholar] [CrossRef]
- Fujisawa, Y.; Masuhara, K.; Shiomi, S. The effect of high tibial osteotomy on osteoarthritis of the knee. An arthroscopic study of 54 knee joints. Orthop. Clin. N. Am. 1979, 10, 585–608. [Google Scholar] [CrossRef]
- Primeau, C.A.; Birmingham, T.B.; Leitch, K.M.; Willits, K.R.; Litchfield, R.B.; Fowler, P.J.; Marsh, J.D.; Chesworth, B.M.; Dixon, S.N.; Bryant, D.M.; et al. Total knee replacement after high tibial osteotomy: Time-to-event analysis and predictors. CMAJ 2021, 193, E158–E166. [Google Scholar] [CrossRef] [PubMed]
- Zaffagnini, S.; Dal Fabbro, G.; Belvedere, C.; Leardini, A.; Caravelli, S.; Lucidi, G.A.; Agostinone, P.; Mosca, M.; Neri, M.P.; Grassi, A. Custom-Made Devices Represent a Promising Tool to Increase Correction Accuracy of High Tibial Osteotomy: A Systematic Review of the Literature and Presentation of Pilot Cases with a New 3D-Printed System. J. Clin. Med. 2022, 11, 5717. [Google Scholar] [CrossRef] [PubMed]
- Brehme, K.; Bartels, T.; Pyschik, M.; Jenz, M.; Delank, K.S.; Laudner, K.G.; Schwesig, R. Postural stability and regulation before and after high tibial osteotomy and rehabilitation. Appl. Sci. 2020, 10, 6517. [Google Scholar] [CrossRef]
- Kurz, E.; Brehme, K.; Bartels, T.; Pyschik, M.; Jenz, M.; Kadler, W.; Delank, K.S.; Schwesig, R. Standing Steadiness and Asymmetry after High Tibial Osteotomy Surgery: A 2 Year Follow-Up Study. J. Pers. Med. 2022, 12, 1594. [Google Scholar] [CrossRef] [PubMed]
- Laven, I.; Schroder, F.F.; de Graaff, F.; Rompen, J.C.; Hoogeslag, R.A.G.; van Houten, A.H. Accuracy, inter- and intrarater reliability, and user-experience of high tibial osteotomy angle measurements for preoperative planning: Manual planning PACS versus semi-automatic software programs. J. Exp. Orthop. 2022, 9, 44. [Google Scholar] [CrossRef]
- Hsu, R.W.; Himeno, S.; Coventry, M.B.; Chao, E.Y. Normal axial alignment of the lower extremity and load-bearing distribution at the knee. Clin. Orthop. Relat. Res. 1990, 255, 215–227. [Google Scholar] [CrossRef]
- Spahn, G. Complications in high tibial (medial opening wedge) osteotomy. Arch. Orthop. Trauma Surg. 2004, 124, 649–653. [Google Scholar] [CrossRef]
- Diffo Kaze, A.; Maas, S.; Waldmann, D.; Zilian, A.; Dueck, K.; Pape, D. Biomechanical properties of five different currently used implants for open-wedge high tibial osteotomy. J. Exp. Orthop. 2015, 2, 14. [Google Scholar] [CrossRef]
- Brouwer, R.W.; Bierma-Zeinstra, S.M.; van Raaij, T.M.; Verhaar, J.A. Osteotomy for medial compartment arthritis of the knee using a closing wedge or an opening wedge controlled by a Puddu plate. A one-year randomised, controlled study. J. Bone Jt. Surg. Br. 2006, 88, 1454–1459. [Google Scholar] [CrossRef]
- Woodacre, T.; Ricketts, M.; Evans, J.T.; Pavlou, G.; Schranz, P.; Hockings, M.; Toms, A. Complications associated with opening wedge high tibial osteotomy—A review of the literature and of 15 years of experience. Knee 2016, 23, 276–282. [Google Scholar] [CrossRef]
- Han, S.B.; In, Y.; Oh, K.J.; Song, K.Y.; Yun, S.T.; Jang, K.M. Complications Associated with Medial Opening-Wedge High Tibial Osteotomy Using a Locking Plate: A Multicenter Study. J. Arthroplast. 2019, 34, 439–445. [Google Scholar] [CrossRef] [PubMed]
- Murray, R.; Winkler, P.W.; Shaikh, H.S.; Musahl, V. High Tibial Osteotomy for Varus Deformity of the Knee. J. Am. Acad. Orthop. Surg. Glob. Res. Rev. 2021, 5, e21.00141. [Google Scholar] [CrossRef]
- Belvedere, C.; MacLeod, A.; Leardini, A.; Grassi, A.; Dal Fabbro, G.; Zaffagnini, S.; Gill, H.S. 3D medical imaging analysis, patient-specific instrumentation and individualized implant design, with additive manufacturing creates a new personalized high tibial osteotomy treatment option. J. Mech. Med. Biol. 2023, 23, 2340041. [Google Scholar] [CrossRef]
- MacLeod, A.; Belvedere, C.; Dal Fabbro, G.; Grassi, A.; Nervuti, G.; Leardini, A.; Casonato, A.; Zaffagnini, S.; Gill, H.S. First Clinical Experience of a Personalised 3D-Printed Osteotomy System for Knee Arthritis Treatment. In Proceedings of the British Orthopaedic Research Society Annual Meeting, Online, 13–14 September 2021. [Google Scholar]
- Ruggeri, M.; Gill, H.S.; Leardini, A.; Zaffagnini, S.; MacLeod, A.; Ortolani, M.; Faccia, F.; Grassi, A.; Fabbro, G.D.; Durante, S.; et al. Superimposition of ground reaction force on tibial-plateau supporting diagnostics and post-operative evaluations in high-tibial osteotomy. A novel methodology. Gait Posture 2022, 94, 144–152. [Google Scholar] [CrossRef] [PubMed]
- Li, O.L.; Pritchett, S.; Giffin, J.R.; Spouge, A.R.I. High Tibial Osteotomy: An Update for Radiologists. AJR Am. J. Roentgenol. 2022, 218, 701–712. [Google Scholar] [CrossRef]
- Lee, S.H.; Lee, O.S.; Teo, S.H.; Lee, Y.S. Change in gait after high tibial osteotomy: A systematic review and meta-analysis. Gait Posture 2017, 57, 57–68. [Google Scholar] [CrossRef]
- Whatling, G.M.; Biggs, P.R.; Elson, D.W.; Metcalfe, A.; Wilson, C.; Holt, C. High tibial osteotomy results in improved frontal plane knee moments, gait patterns and patient-reported outcomes. Knee Surg. Sports Traumatol. Arthrosc. 2020, 28, 2872–2882. [Google Scholar] [CrossRef]
- Marques Luis, N.; Varatojo, R. Radiological assessment of lower limb alignment. EFORT Open Rev. 2021, 6, 487–494. [Google Scholar] [CrossRef]
- Aalderink, K.J.; Shaffer, M.; Amendola, A. Rehabilitation following high tibial osteotomy. Clin. Sports Med. 2010, 29, 291–301. [Google Scholar] [CrossRef]
- Roos, E.M.; Lohmander, L.S. The Knee injury and Osteoarthritis Outcome Score (KOOS): From joint injury to osteoarthritis. Health Qual. Life Outcomes 2003, 1, 64. [Google Scholar] [CrossRef]
- Delgado, D.A.; Lambert, B.S.; Boutris, N.; McCulloch, P.C.; Robbins, A.B.; Moreno, M.R.; Harris, J.D. Validation of Digital Visual Analog Scale Pain Scoring with a Traditional Paper-based Visual Analog Scale in Adults. J. Am. Acad. Orthop. Surg. Glob. Res. Rev. 2018, 2, e088. [Google Scholar] [CrossRef]
- Leardini, A.; Sawacha, Z.; Paolini, G.; Ingrosso, S.; Nativo, R.; Benedetti, M.G. A new anatomically based protocol for gait analysis in children. Gait Posture 2007, 26, 560–571. [Google Scholar] [CrossRef]
- Manca, M.; Leardini, A.; Cavazza, S.; Ferraresi, G.; Marchi, P.; Zanaga, E.; Benedetti, M.G. Repeatability of a new protocol for gait analysis in adult subjects. Gait Posture 2010, 32, 282–284. [Google Scholar] [CrossRef] [PubMed]
- Benedetti, M.G.; Merlo, A.; Leardini, A. Inter-laboratory consistency of gait analysis measurements. Gait Posture 2013, 38, 934–939. [Google Scholar] [CrossRef] [PubMed]
- Friston, K.J.; Ashburner, J.T.; Kiebel, S.J.; Nichols, T.E.; Penny, W.D. Statistical Parametric Mapping: The Analysis of Functional Brain Images; Elsevier/Academic Press: Amsterdam, The Netherlands, 2007. [Google Scholar]
- Pataky, T.C. Generalized n-dimensional biomechanical field analysis using statistical parametric mapping. J. Biomech. 2010, 43, 1976–1982. [Google Scholar] [CrossRef]
- Lind, M.; McClelland, J.; Wittwer, J.E.; Whitehead, T.S.; Feller, J.A.; Webster, K.E. Gait analysis of walking before and after medial opening wedge high tibial osteotomy. Knee Surg. Sports Traumatol. Arthrosc. 2013, 21, 74–81. [Google Scholar] [CrossRef]
- Liu, X.; Chen, Z.; Gao, Y.; Zhang, J.; Jin, Z. High Tibial Osteotomy: Review of Techniques and Biomechanics. J. Healthc. Eng. 2019, 2019, 8363128. [Google Scholar] [CrossRef]
- Morin, V.; Pailhe, R.; Duval, B.R.; Mader, R.; Cognault, J.; Rouchy, R.C.; Saragaglia, D. Gait analysis following medial opening-wedge high tibial osteotomy. Knee Surg. Sports Traumatol. Arthrosc. 2018, 26, 1838–1844. [Google Scholar] [CrossRef]
- Leardini, A.; Durante, S.; Belvedere, C.; Caravaggi, P.; Carrara, C.; Berti, L.; Lullini, G.; Giacomozzi, C.; Durastanti, G.; Ortolani, M.; et al. Weight-bearing CT Technology in Musculoskeletal Pathologies of the Lower Limbs: Techniques, Initial Applications, and Preliminary Combinations with Gait-Analysis Measurements at the Istituto Ortopedico Rizzoli. Semin. Musculoskelet. Radiol. 2019, 23, 643–656. [Google Scholar] [CrossRef]
- Turmezei, T.D.; Low, S.B.; Rupret, S.; Treece, G.M.; Gee, A.H.; MacKay, J.W.; Lynch, J.A.; Poole, K.E.; Segal, N.A. Multiparametric 3-D analysis of bone and joint space width at the knee from weight bearing computed tomography. Osteoarthr. Imaging 2022, 2, 100069. [Google Scholar] [CrossRef]
- Dasari, S.P.; Hevesi, M.; Mameri, E.; Ferrer-Rivero, R.; Fortier, L.M.; Jackson, G.R.; Warrier, A.A.; Maheshwer, B.; Jawanda, H.; Khan, Z.A.; et al. Patient-specific instrumentation for medial opening wedge high tibial osteotomies in the management of medial compartment osteoarthritis yields high accuracy and low complication rates: A systematic review. J. ISAKOS 2023, 8, 163–176. [Google Scholar] [CrossRef] [PubMed]
- Pang, R.; Jiang, Z.; Xu, C.; Shi, W.; Zhang, X.; Wan, X.; Bahat, D.; Li, H.; Senatov, F.; Bulygina, I.; et al. Is Patient-Specific Instrumentation Accurate and Necessary for Open-Wedge High Tibial Osteotomy? A Meta-Analysis. Orthop. Surg. 2023, 15, 413–422. [Google Scholar] [CrossRef] [PubMed]
- Akamatsu, Y.; Kumagai, K.; Kobayashi, H.; Tsuji, M.; Saito, T. Effect of Increased Coronal Inclination of the Tibial Plateau After Opening-Wedge High Tibial Osteotomy. Arthroscopy 2018, 34, 2158–2169.e2. [Google Scholar] [CrossRef]
- Kim, C.W.; Seo, S.S.; Lee, C.R.; Gwak, H.C.; Kim, J.H.; Jung, S.G. Factors affecting articular cartilage repair after open-wedge high tibial osteotomy. Knee 2017, 24, 1099–1107. [Google Scholar] [CrossRef] [PubMed]
- Xie, T.; Brouwer, R.W.; van den Akker-Scheek, I.; van der Veen, H.C. Clinical relevance of joint line obliquity after high tibial osteotomy for medial knee osteoarthritis remains controversial: A systematic review. Knee Surg. Sports Traumatol. Arthrosc. 2023, 31, 4355–4367. [Google Scholar] [CrossRef] [PubMed]


| Mean ± SD | Min | Max | |
|---|---|---|---|
| No. of patients (gender: male/female; side: left/right) | 25 (19/6; 13/12) | - | - |
| Age (years) | 54.1 ± 7.4 | 39 | 65 |
| Weight (kg) | 80.6 ± 14.8 | 57 | 113 |
| Height (cm) | 172.8 ± 8.8 | 156 | 195 |
| Body mass index (kg/m2) | 26.9 ± 4.2 | 20.8 | 38.1 |
| Inclusion criteria | Exclusion criteria | ||
| Age 40–65 years | BMI ≥ 40 | ||
| BMI < 40 | Patients unable to provide informed consent | ||
| Varus deformity < 20° | Patients not compliant with post-operative rehabilitation and assessment schedules | ||
| Diagnosis of non-inflammatory degenerative joint disease | Patients with specific diseases or disorders or with extremely poor bone quality | ||
| Unicompartmental medial knee osteoarthritis | Other surgeries to the lower limbs | ||
Disclaimer/Publisher’s Note: The statements, opinions and data contained in all publications are solely those of the individual author(s) and contributor(s) and not of MDPI and/or the editor(s). MDPI and/or the editor(s) disclaim responsibility for any injury to people or property resulting from any ideas, methods, instructions or products referred to in the content. |
© 2023 by the authors. Licensee MDPI, Basel, Switzerland. This article is an open access article distributed under the terms and conditions of the Creative Commons Attribution (CC BY) license (https://creativecommons.org/licenses/by/4.0/).
Share and Cite
Belvedere, C.; Gill, H.S.; Ortolani, M.; Sileoni, N.; Zaffagnini, S.; Norvillo, F.; MacLeod, A.; Dal Fabbro, G.; Grassi, A.; Leardini, A. Instrumental Gait Analysis and Tibial Plateau Modelling to Support Pre- and Post-Operative Evaluations in Personalized High Tibial Osteotomy. Appl. Sci. 2023, 13, 12425. https://doi.org/10.3390/app132212425
Belvedere C, Gill HS, Ortolani M, Sileoni N, Zaffagnini S, Norvillo F, MacLeod A, Dal Fabbro G, Grassi A, Leardini A. Instrumental Gait Analysis and Tibial Plateau Modelling to Support Pre- and Post-Operative Evaluations in Personalized High Tibial Osteotomy. Applied Sciences. 2023; 13(22):12425. https://doi.org/10.3390/app132212425
Chicago/Turabian StyleBelvedere, Claudio, Harinderjit Singh Gill, Maurizio Ortolani, Nicoletta Sileoni, Stefano Zaffagnini, Fabio Norvillo, Alisdair MacLeod, Giacomo Dal Fabbro, Alberto Grassi, and Alberto Leardini. 2023. "Instrumental Gait Analysis and Tibial Plateau Modelling to Support Pre- and Post-Operative Evaluations in Personalized High Tibial Osteotomy" Applied Sciences 13, no. 22: 12425. https://doi.org/10.3390/app132212425