Abstract
In the interaction of the rolling stock and the upper structure of the railway track, intense dynamic loads occur. They have a destructive effect both on the parts of the rolling stock and on the elements of the superstructure of the track. In order to develop a durable, rational and reliably functioning design of cars and locomotives with good dynamic properties and good indicators of the impact of rolling stock on the railway track, along with theoretical computational studies, experimental studies are also required, which are usually the final stage in the design and implementation of rolling stock or the modernization of existing ones, such as locomotives and wagons, in order to improve their strength and dynamic performance. This article presents the results of field tests to determine the dynamic performance of the type CKD6e diesel locomotive. The description of the preparation of the CKD6e shunting locomotive for testing is given. An analysis of the dynamic performance of a diesel locomotive during the passage of turnouts, on a straight section of the track and in a curve with a radius of 400 m, was carried out. The studies performed showed that the minimum value of the stability factor against wheel derailment on a straight section of the track is significantly higher than the standard value. The experimentally obtained ratio of frame forces to the static load from the wheelset on the rails, the coefficients of vertical dynamics of the first and the second stages of suspension and the coefficient of stability against derailment of the wheel from the rail were registered on the track section in a curve with a radius of 400 m meet the current requirements. A calculation scheme and equations of vertical oscillations are proposed, an analysis is carried out according to the graphs of movements of bogies and a locomotive body when moving along irregularities of different lengths at different speeds.
1. Introduction
When the rolling stock interacts with the superstructure of the railway track, intense dynamic loads arise; these loads have a destructive effect on both the parts of the rolling stock and the elements of the superstructure of the track. When a wheel rolls over uneven tracks, additional vertical impact forces of the order of 150–300 kN arise, depending on the size of the unevenness and the type of locomotive. As a result of the increased level of vertical and longitudinal dynamics of the interaction between the rolling stock and the track, serious problems arise with the condition of the rails and track structure, wheels and cars of the rolling stock. In these circumstances, experimental studies of the dynamic characteristics of the interaction between rolling stock and track become particularly relevant. Dynamic running tests of railway vehicles make it possible to study the performance of a locomotive, carriage or their parts and assemblies under real operating conditions. Conducting such experimental studies is designed to ensure the required level of one or another load parameter (for example, payload, speed, acceleration and braking, operating mode of equipment, etc.) and external factors (characteristics of the railway track, position of the crew on the train, climatic conditions, etc.), ensuring that the above factors are aimed at obtaining a more reliable and comprehensive check of the reliability of the tested object. Experimental studies and full-scale tests are also carried out with the aim of further developing the design theory and studying the behavior of rolling stock in operating conditions, especially at high speeds [1]. Experimental research is also necessary in the development of new theoretical methods for studying the strength and dynamics of locomotives and cars, as well as in refining existing theoretical methods for studying rolling stock [2]. Dynamic train (running) tests are one of the main stages of working out the design of a locomotive and assessing its dynamic and strength qualities. Depending on the goals, they are generally dynamic and special [3]. General dynamic tests include the following:
- -
- Factory tests, which are carried out by the manufacturer [4]. Their purpose is to check the operation of individual units of the locomotive and its design as a whole; according to the results of these tests, the manufacturer refines the prototype locomotive [5].
- -
- Acceptance train tests, during which the compliance of the dynamic qualities of the locomotive with the requirements of the locomotive customers and all applicable standards for the calculation and operation of locomotives are checked [6]. During these tests, the driving characteristics of the locomotive are determined (running smoothness, stability against transverse overturning of the locomotive in curves, stability of the wheel on the rail), dynamic forces acting on the elements of the locomotive and the railway track and dynamic forces that determine the strength and reliability of the locomotive in long-term operation [7]. Our completed literature review shows that a number of works are devoted to testing railway rolling stock, which reveal many problems associated with full-scale testing of locomotives, cars and their individual components and parts [1,2,3]. To clarify various methods and approaches related to the experimental assessment of the interaction between track and rolling stock, studies of the dynamic characteristics of rolling stock and track are being conducted [4], reflecting the requirements of regulatory and technical documentation [5]. Separate studies are aimed at investigating the impact of moving vehicles on the railway infrastructure and nearby buildings [6] and issues of active and passive safety [7,8]. Various authors have analyzed the dynamic characteristics of rolling stock with increased load capacity [9,10], as well as the influence of operational factors and design features of railway vehicles on the interaction of rolling stock and track [11,12].
As a result of processing the experimental data of rolling stock tests, stable correlations were obtained between various indicators of the dynamics of the rolling stock, the state of the track and the indicators of the stressed state of the track. In general, in the interaction of the track and rolling stock, dynamic indicators are associated with a large number of factors [8]. In order to establish compliance of the operational characteristics of the CKD6e diesel locomotive with the requirements of regulatory and technical documentation and the possibility of safe operation on the railways of Kazakhstan, running and dynamic tests of the specified brand of diesel locomotive were performed.
2. Preparing the CKD6e Shunting Locomotive for Testing
The preparation of the CKD6E shunting locomotive included the following steps:
- -
- Installation of load cells;
- -
- Installation of displacement sensors;
- -
- Installation of acceleration sensors [9].
The location of the sensors on the locomotive is shown in Figure 1.
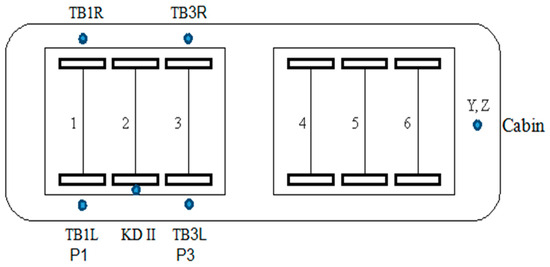
Figure 1.
Placement of sensors for registration of processes to determine the dynamic performance of the type CKD6e-2108 diesel locomotive.
Figure 1 shows the following elements:
P1, P3—frame forces of the first and third wheelset (transverse movements between the bogie frame and the wheelset);
TB1L, TB1R, TB3L, TB3R—vertical movements between the bogie frame and the axle box of the first and third wheelset on the left and right sides;
KD II—coefficient of vertical dynamics of the second stage of spring suspension (strain diagram);
Y, Z—accelerations on the floor in the cabin in the transverse and vertical directions.
Installation of load cells consists of five stages:
1—Marking the places of installation of sensors.
2—Cleaning the places where the sensors are installed.
3—Installation of sensors.
4—Assembly of circuits and verification.
5—Circuit isolation.
When marking the location of the installation of sensors on the bogie of the locomotive, the places most prone to deformation during the movement of the locomotive are considered. The locations of the sensors were chosen empirically [10]. The sensor installation sites are pre-cleaned with special equipment to a flat and smooth surface, and then the site is processed with sandpaper across the sensor installation to a slight roughness [11]. This work must be performed at all marked sites for installing sensors (see Figure 2).
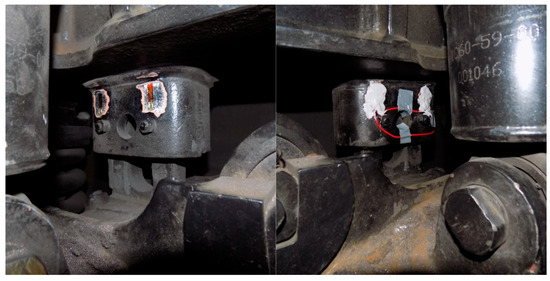
Figure 2.
Installation of strain gauges on the side bearings of the locomotive bogie.
Installation of sensors consists of the following steps:
- (a)
- Before installing the sensors on the cart, the sensor outputs are soldered to the blocks to prevent electrical contact with the surface of the cart.
- (b)
- The installation site is treated (wiped) with acetone in order to degrease the surface. It is also necessary to wipe the glued (lower part) surface of the sensor with acetone.
- (c)
- Glue is applied to the sensor (the second glue moment is universal).
- (d)
- Next, the sensor must be strongly pressed against the surface previously prepared for installation [12]. It is important to avoid the occurrence of air and bubbles between the sensor and the surface to be glued during the installation of the sensor; it is necessary to press the sensor completely against the surface and hold it for at least 30 s.
The dynamic performance of the diesel locomotive was measured simultaneously to determine the level of impact of the diesel locomotive on the track and turnouts [13].
3. Dynamic Performance of a Diesel Locomotive on Turnouts
The dynamic performance of the diesel locomotive on turnouts was determined with the measurements made when the diesel locomotive was passing turnout’s No. 13 of grade 1/9 and No. 29 of grade 1/11 on rails R65 located at the Belle station. The direction when the locomotive CKD6E-2108 moved forward with the first wheel pair from the station towards the entrance switches was taken as the direct course of the diesel locomotive [14]. Figure 3 shows the oscillograms of the primary measurements of dynamic processes recorded at turnouts. The frame forces were determined as the product of the transverse displacements of the wheelset relative to the bogie frame and the stiffness of their connection. During the processing of tasks, the quasi-static component was considered. The estimated values of the processed tasks were determined as the arithmetic average of the three largest measured values at one speed [15]. The dependence of the ratio of frame to the static load from the wheelset on the rails on the speed of movement is shown in Figure 3 and Figure 4.
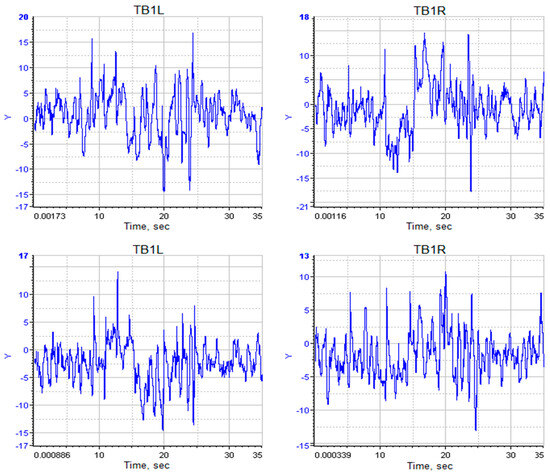
Figure 3.
Vertical movements of the bogie frame relative to the wheelset of the locomotive CKD6E-2108 when moving along turnouts, mm.
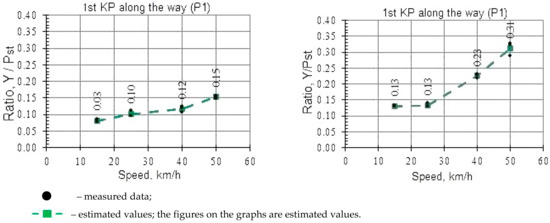
Figure 4.
The ratio of frame forces to the static load from the wheelset on the rails on the CKD6E-2108 diesel locomotive when driving on turnout’s P65 grade 1/9 and 1/11 on the side.
Figure 4 and Figure 5 show that the ratio of frame forces to the static load from the wheelset on the rails is within the allowable range [13]. In the considered range of speeds, when the CKD6e-2108 diesel locomotive passes the turnouts P65 of grade 1/9 and 1/11, this indicator does not exceed 0.31 when moving sideways nor 0.15 when moving in a straight line [16]. Thus, the frame forces of the diesel locomotive during the passage of turnouts P65 grades 1/9 and 1/11 meet the requirements in the entire range of speeds at which the tests were carried out. Based on the instantaneous values of the frame forces and the coefficient of vertical dynamics of the first stage of the spring suspension, the values of the stability factor against wheel derailment were calculated (hereinafter in Figures and Tables—KZU). The minimum value of the stability factor against wheel derailment when passing turnouts is summarized in Table 1 and Table 2.
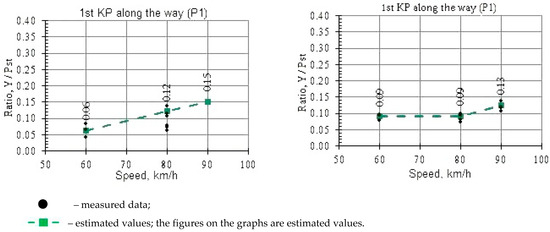
Figure 5.
The ratio of frame forces to the static load from the wheelset on the rails on the CKD6E-2108 diesel locomotive when driving on turnout’s P65 grades 1/9 and 1/11 in a straight line.

Table 1.
Stability factor against wheel derailment in turnouts with a 1/9 cross.
Table 2.
Stability factor against wheel derailment in turnouts with a crosspiece of brand 1/11.
The obtained dependencies of the stability factor against derailment of the wheel from the rail speed are shown in Figure 6 and Figure 7.
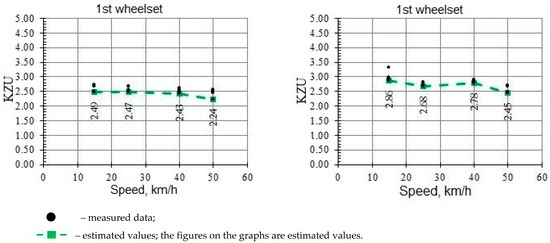
Figure 6.
Stability factor against wheel derailment when passing a turnout with a 1/9 and 1/11 crosspiece on its side.
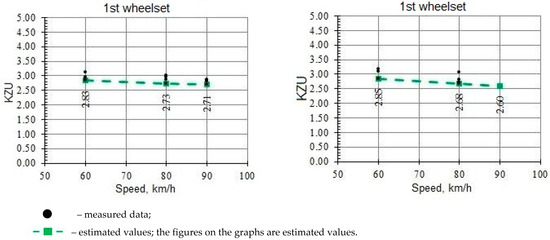
Figure 7.
Stability factor against wheel derailment when passing a turnout with a crosspiece of brand 1/9 and 1/11 in a straight direction.
The data given in Table 1 and Table 2 and Figure 6 and Figure 7 show that the stability factor against wheel derailment when the locomotive passes turnouts on its side up to a speed of 50 km/h and in a straight direction up to 90 km/h are in acceptable limits, i.e., they take values of at least 1.4. The results show that the dynamic performance of the diesel locomotive when passing turnouts meets the requirements of the “Norms for Permissible Speeds of Locomotives and Wagons on Railway Tracks of Gauge 1520 (1524) mm of Railway Transport of the Republic of Kazakhstan” (hereinafter referred to as the norms for permissible speeds) [17,18]. Consequently, the speed of movement on the turnouts in accordance with the norms for permissible speeds of movement according to the assessment of dynamic indicators is limited to 40 km/h when moving on the turnouts on the side and the design indicators when driving on the turnouts in the forward direction [19].
4. Dynamic Performance of a Diesel Locomotive on a Straight Section of the Track
Before testing, a track measuring car was passed through a straight section. Based on the results of the measurements, the maximum allowable speed was set to 90 km/h.
For the direct course of the diesel locomotive, the direction was taken when the CKD6E-2108 diesel locomotive moved forward with the first wheelset [20]. The coefficient of vertical dynamics of the first stage of the spring suspension was determined as the ratio of the dynamic vertical displacement of the bogie relative to the wheelset (axle box), registered during the movement of the diesel locomotive, and to the vertical static deflection of the first stage, which was 123 mm for the CKD6e diesel locomotive [21]. The coefficient of vertical dynamics of the second stage of the spring suspension was determined as the ratio of the values of the dynamic signal recorded with tensometric circuits relative to the value of the signal obtained during static tests (see Figure 8).
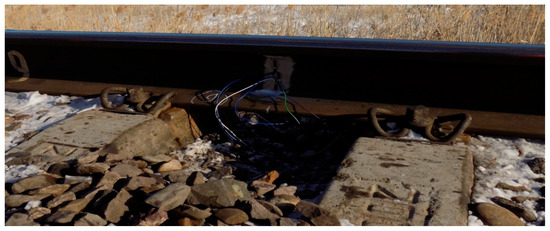
Figure 8.
Installation of tensometric on the side neck of the rail.
Based on the results of data processing at a given speed, separate data arrays were formed for each sensor (see Figure 9). According to these arrays, the estimated values of the coefficient of vertical dynamics of the first stage of the spring suspension were found [22]. Dynamic vertical movements were processed without considering the quasi-static component. All measurements were divided into speeds and directions of movement. In each race, one maximum amplitude value of the dynamic process was selected.
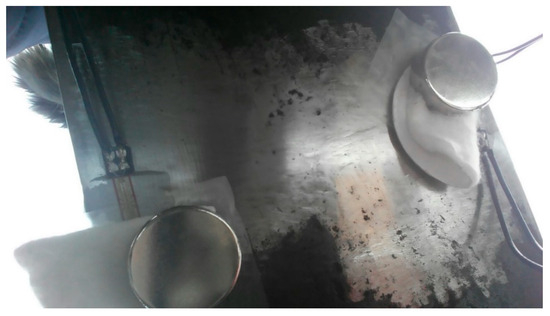
Figure 9.
Installation of load cells on the rail foot.
Similarly, data processing was carried out to determine the coefficient of vertical dynamics of the second stage of the spring suspension. Frame forces were processed by the method described earlier.
Figure 10, Figure 11 and Figure 12 show oscillograms of primary measurements of dynamic processes recorded while driving along a straight section.
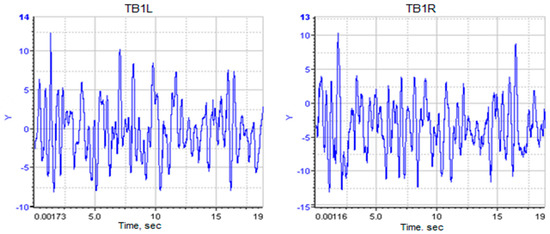
Figure 10.
Vertical movements of the bogie frame relative to the wheelset of the CKD6E-2108 diesel locomotive when moving along a straight section of track, mm.
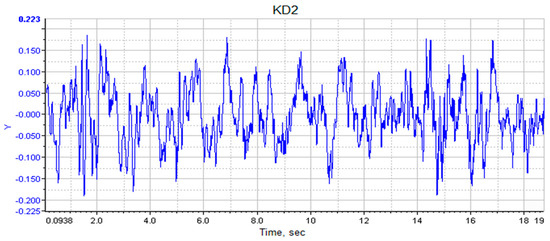
Figure 11.
The coefficient of vertical dynamics of the second stage of the spring suspension of the CKD6E-2108 diesel locomotive when moving along a straight section of the track.
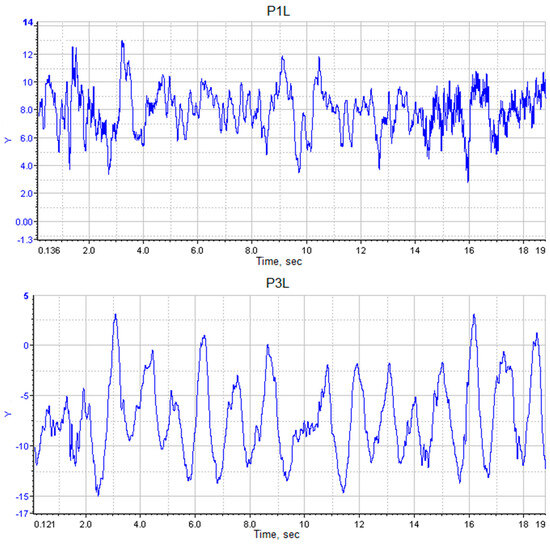
Figure 12.
Frame forces on a CKD6E-2108 diesel locomotive when moving along a straight section of track.
The data in Figure 13 and Figure 14 show that the values of the coefficients of vertical dynamics of the first and second stages of the spring suspension of the CKD6E-2108 diesel locomotive do not exceed the permissible limits [23]. The maximum values for the coefficients of vertical dynamics were 0.11 for the first stage and 0.25 for the second stage. Figure 14 shows the graphs of the dependence of the coefficient of vertical dynamics of the first stage of the spring suspension on the speed when the diesel locomotive passes along a straight section of the track.
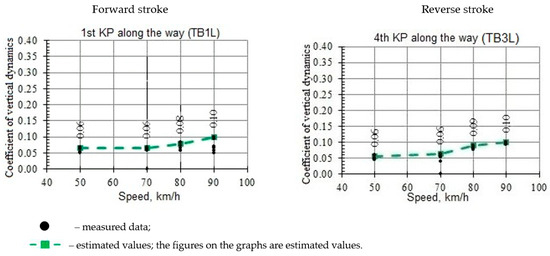
Figure 13.
Coefficient of vertical dynamics of the first stage of the spring suspension of the CKD6E-2108 diesel locomotive when moving along a straight section of the track.
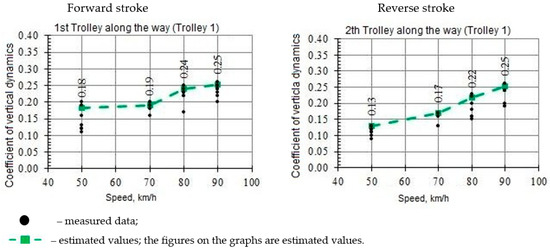
Figure 14.
The coefficient of vertical dynamics of the second stage of the spring suspension of the CKD6E-2108 diesel locomotive when moving along a straight section of the track.
Figure 15 shows the graphs of the dependence of the coefficient of vertical dynamics of the second stage of the spring suspension on the speed when the diesel locomotive passes along a straight section of the track.
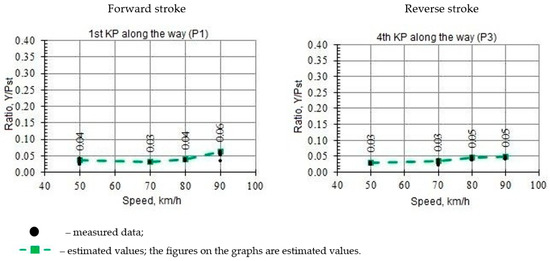
Figure 15.
The ratio of frame forces to the static load from the wheelset on the rails on the CKD6E-2108 diesel locomotive when moving along a straight section of track.
Figure 16 shows the graphs of the ratio of frame forces to the static load from the wheelset on the rails on the speed when the diesel locomotive passes along a straight section of the track.
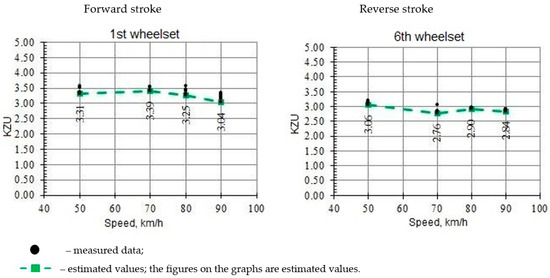
Figure 16.
Stability factor against wheel derailment on a straight section of the track.
It is worth noting that the limit value of 0.25 for the vertical dynamics coefficient of the second stage was obtained when driving at a speed of 90 km/h, i.e., 12.5% higher than the designated speed [24].
The maximum value of the ratio of frame forces to the static load from the wheelset on the rails was 0.08.
Figure 16 shows the dependence of the stability factor against derailment of the wheel from the speed of movement, built on the basis of the results given in Table 3. The minimum values of the stability factor against derailment calculated from the data recorded on the straight section of the track are shown in Table 3.
Table 3.
Stability factor against wheel derailment on a straight section of the track.
As can be seen from Figure 16 and Table 3, the minimum value of the stability factor against wheel derailment on a straight section of the track is significantly higher than the minimum value. Thus, the speed of movement along the straight sections is in accordance with the norms for permissible movement speeds according to the assessment of dynamic indicators limited by the designated speed [25].
5. Dynamic Performance in a Curve with a Radius of 400 m
Before testing, a track measuring car was passed through this section. According to the results of measurements, the maximum permissible speed of movement was set at 85 km/h.
For the data to determine the estimated values of the frame forces, the coefficients of vertical dynamics of the first and second stages of suspension were processed in the same way as in the previous sections [26]. Figure 17, Figure 18 and Figure 19 show oscillograms of primary measurements of dynamic processes recorded while moving in a curve with a radius of 400 m. The processing results are shown in Figure 20, Figure 21 and Figure 22.
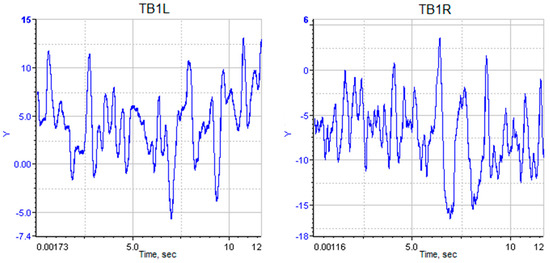
Figure 17.
Vertical movements of the bogie frame relative to the wheelset of the CKD6E-2108 diesel locomotive when moving in a curve with a radius of 400 m.
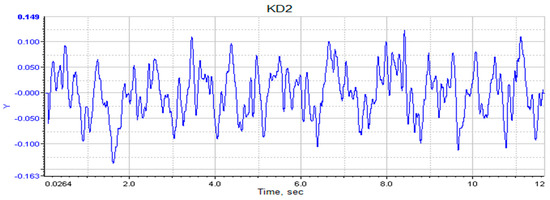
Figure 18.
The coefficient of vertical dynamics of the second stage of the spring suspension of the CKD6E-2108 diesel locomotive when moving in a curve with a radius of 400 m.
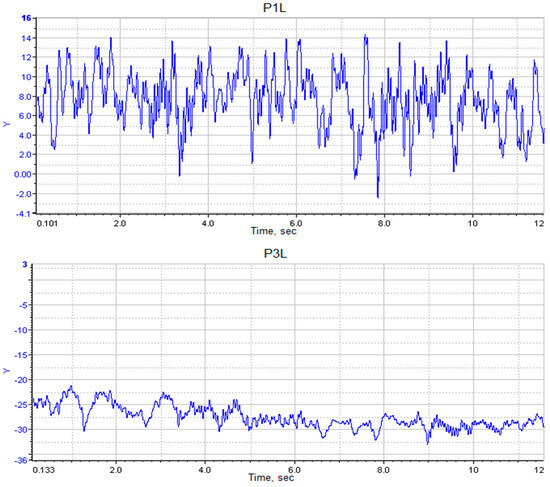
Figure 19.
Frame forces on a CKD6E-2108 diesel locomotive when moving in a curve with a radius of 400 m.
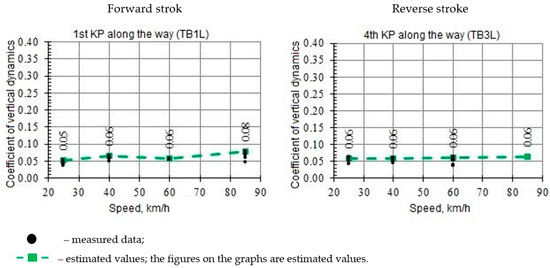
Figure 20.
The coefficient of vertical dynamics of the first stage of the spring suspension of the CKD6E-2108 diesel locomotive when moving in a curve with a radius of 400 m.
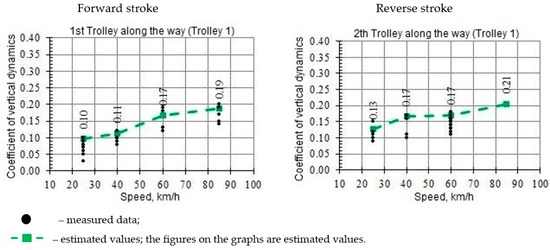
Figure 21.
The coefficient of vertical dynamics of the second stage of the spring suspension of the CKD6E-2108 diesel locomotive when moving in a curve with a radius of 400 m.
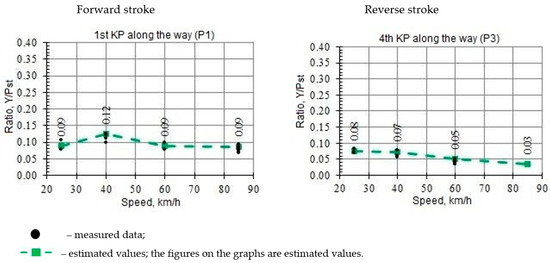
Figure 22.
The ratio of frame forces relative to the static load from the wheelset on the rails on the CKD6E-2108 diesel locomotive when moving in a curve with a radius of 400 m.
Figure 23 shows the dependence of the stability factor against wheel derailment in relation to the speed of movement [27].
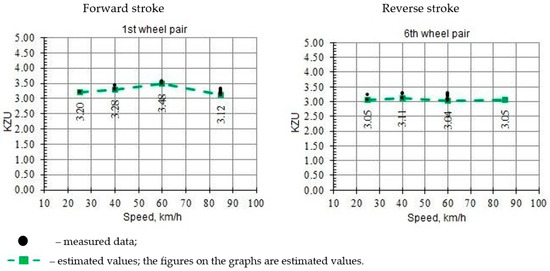
Figure 23.
Safety factor against wheel derailment in a curve with a radius of 400 m.
The minimum values of the stability factor against wheel derailment calculated from the data recorded when driving in a curve with a radius of 400 m are shown in Table 4.
Table 4.
Stability factor against wheel derailment when moving in a curve with a radius of 400 m.
The results shown in Figure 20, Figure 21 and Figure 22 show that the dynamic performance of the locomotive show that the following factors meet the requirements: the ratio of frame forces to the static load from the wheelset on the rails, the vertical dynamics coefficients of the first and second suspension stages and the stability factor against wheel derailment recorded on the track section in a curve with a radius of 400 m [28]. The speeds of movement along curves of a small radius in accordance with the norms for permissible movement speeds according to the assessment of dynamic indicators are limited based on the condition of not exceeding the outstanding acceleration of 0.7 m/s2, as well as the designated speed.
6. Drawing up Equations of Vertical Oscillations of a Diesel Locomotive
When compiling the mathematical model of oscillations of the undercarriage, a flat design scheme of the locomotive was adopted (see Figure 24). Equations of steady-state spatial vertical oscillations of the vehicle–track system under study, with respect to the complex amplitudes of generalized coordinates, compiled the accepted assumptions and described forced oscillations in the longitudinal vertical plane [29].
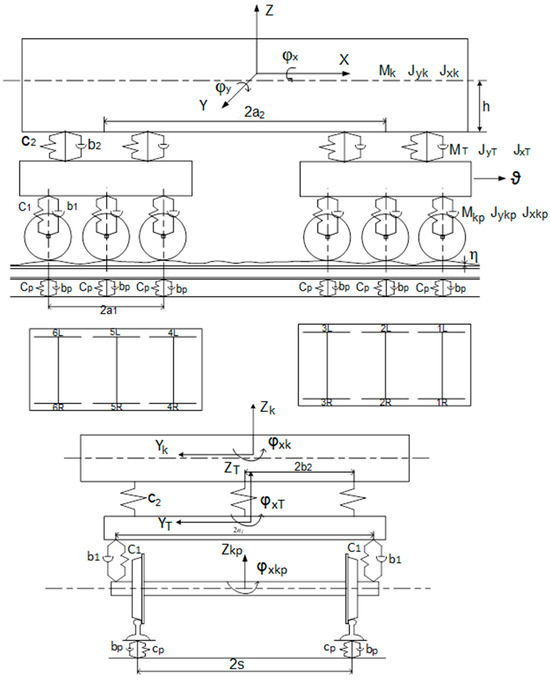
Figure 24.
Kinematic diagram of a diesel locomotive model.
It is convenient to compose differential equations of oscillations of rail vehicles using the general equation of system dynamics (1) as follows:
where is the generalized force from active forces; is the generalized force of inertia; K is the number of degrees of freedom of the system.
It is convenient to calculate the generalized inertial forces using the Lagrange operator, which in the problem of small oscillations is written as Equation (2) that follows.
where is kinetic energy of the system, depending only on generalized velocities.
The generalized forces from active forces can be found through the possible power of these forces according to Formula (3).
where the possible power of all given forces correspond to the generalized speed through which the possible speeds are expressed at each i-th point of application of the force is equal to
After substituting the values of the generalized inertial forces and the generalized active forces in Equation (4) and assuming that , a system of linear differential equations of small oscillations is obtained relative to the position of a stable rectilinear uniform motion of the vehicle, in which the gravity forces of individual bodies and external active forces are balanced with static values bond reactions [30]. The values of the generalized coordinates in this position are equal to zero. In translational motion, inertial forces act on the body; in rotational motion, the moments of inertial forces act on the body [2]. Consequently, the equations of the motion of the body in Cartesian coordinates will take the following form:
where , , are the force projections with number i on the x, y, z axes, respectively; , , are the projections of reactions of elastic (or elastoviscous) elements with number j on the x, y, z axes, respectively; , , are the moments of forces Pi about the x, y, z axes; , , are the moments of force about the axes; , , are the moments of inertia of a rigid body about the axes; , , are the acceleration of the body along the axes; , , are the angular accelerations of the body during its rotation around the axes.
In Equation (5), the summation of i and j is performed algebraically, considering the sign of the force and the moment. To determine the sign of the force and moment, it is convenient to use the following rule: if the direction of the force or moment coincides with the direction of the forces of inertia or the moment of the forces of inertia; hence, when summed, they take the “plus” sign; else, they take a “minus” sign.
The forces of inertia, according to Newton’s second law, are equal to the mass times the acceleration, and are directed in the direction opposite to the acceleration [1]. In our example, due to the arbitrary choice of the positive direction of coordinates, the positive acceleration is directed to the right, and the inertial force is the directed to the left. The same can be said about the direction of inertial forces () and moments of inertia forces (, , ).
Reactions on the design scheme are directed as if they acted with a positive deformation of elastic or elastic/viscous elements. For positive deformation, you can take either tension or compression at your discretion [5]. In the diagram, the reactions are directed as if the named elements are experiencing compressive deformations.
Equations within Equation (5) are differential equations for the equilibrium of a body as it moves in a space defined by six coordinates. External forces are, as a rule, functions of time ; reactions are functions of time, coordinates and their derivatives, i.e.,.
These equations are written for any small period of time during which it can be assumed that the inertia forces, external forces and reactions are constants. To determine the trajectory of a body in a given space under the action of external forces, it is necessary to find the functions of , which, under given initial conditions, would turn the system of differential equations into an identity [3,4]. Along with the d’Alembert–Lagrange equations written in the Cartesian coordinate system; another form of notation is often used in mechanics—in the so-called generalized coordinate system. In this case, the variational equations of analytical mechanics are called the Lagrange equations of the second kind [11].
The body and bogie of a diesel locomotive are solid bodies with two degrees of freedom and are connected by elastic and dissipative bonds. Wheel pairs move without separation from the rails. Perturbations from the right and left rails will be taken the same, which allows us to consider plane oscillations [6]. This formulation of the problem is quite sufficient to consider the main dynamic processes in the system [7,8,9].
Model six degrees of freedom. To study oscillations in the vertical longitudinal plane, we will compose a system of six second-order differential equations describing oscillations in the vertical longitudinal plane. After the transformation, we obtain Equations (6)–(8).
Body oscillation equations:
The oscillation equations of the first bogie:
Equations of vibrations of the second cart:
The equations of bogie oscillations Equations (6) and (7) on the right side contain expressions describing the side of the track [10].
The roughness of the path is an external perturbation of our system. The perturbation is fed to the inputs of the model with a displacement—the transport delay τ, which is determined by the geometric dimensions and the speed of movement as follows.
The choice of the type of perturbing action from the path—the roughness of the path depends on the formulation of the problem and the accuracy required for the mathematical model [16].
To analyze dynamic loads, it is necessary to obtain the acceleration values of the moving parts of the vehicle. Numerical integration subroutines used in the Mathcad package do not allow you to directly display the values of which derivatives are used [22]. To do this, we use the derived Equation (4). By substituting the parameters of the crew into the derivatives and the obtained values of the variables of the model, we obtain expressions for acceleration in the center of the body and in the drivers cab as follows:
To determine the relative displacements in the hydraulic vibration dampers of the second tier, we use the following relations:
To solve the resulting system of differential equations with numerical methods on a computer, it is necessary to bring the resulting equations in the Cauchy form [24]. To do this, we solve the equations with respect to the second derivatives, and then we change the variables.
Initial data:
m1 = 20; j1 = 37; c1 = 6100; a1 = 1,85; b1 = 20;
m2 = 72; j2 = 493; c2 = 1500; a2 = 6.85; b2 = 100;
n0 = 0.005; w = 2.
7. Results and Discussion
To display the results, new variables (vectors T, Z1, Z2, V1, V2) are introduced, which are assigned the value of the columns of the solution results matrix.
The results are presented in graphical form as follows:
- -
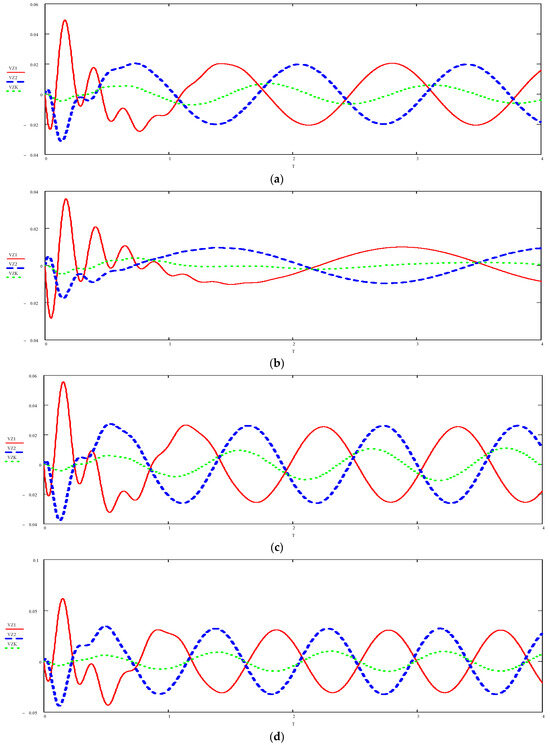 Figure 25. Graph of the speed of movement of the body and bogies when moving along a short unevenness (L = 30 mm) with different speeds. (a) ϑ = 40 km/h; (b) ϑ = 80 km/h; (c) ϑ = 100 km/h; (d) ϑ = 120 km/h.
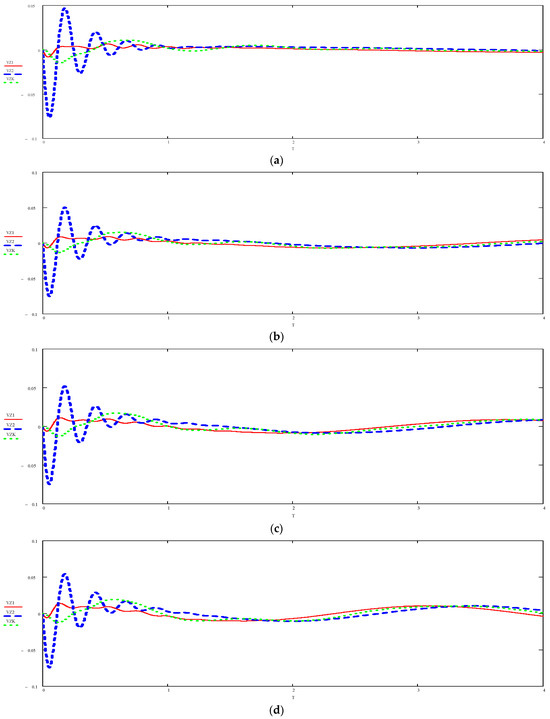 Figure 26. Graph of the speed of movement of the body and bogies when moving along a short unevenness (L = 100 mm) with different speeds. (a) ϑ = 40 km/h; (b) ϑ = 80 km/h; (c) ϑ = 100 km/h; (d) ϑ = 120 km/h.
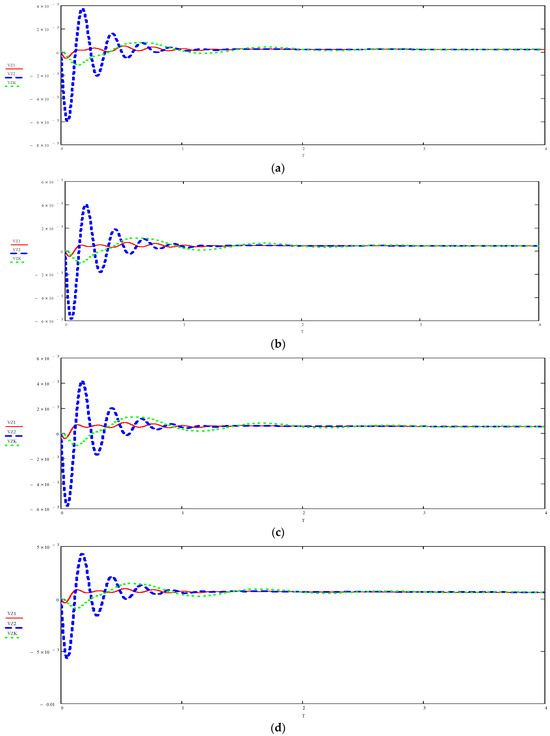 Figure 27. Graph of the speed of movement of the body and bogies when moving along a long unevenness (L = 1500 mm) with different speeds. (a) ϑ = 40 km/h; (b) ϑ = 80 km/h; (c) ϑ = 100 km/h; (d) ϑ = 120 km/h.
- -
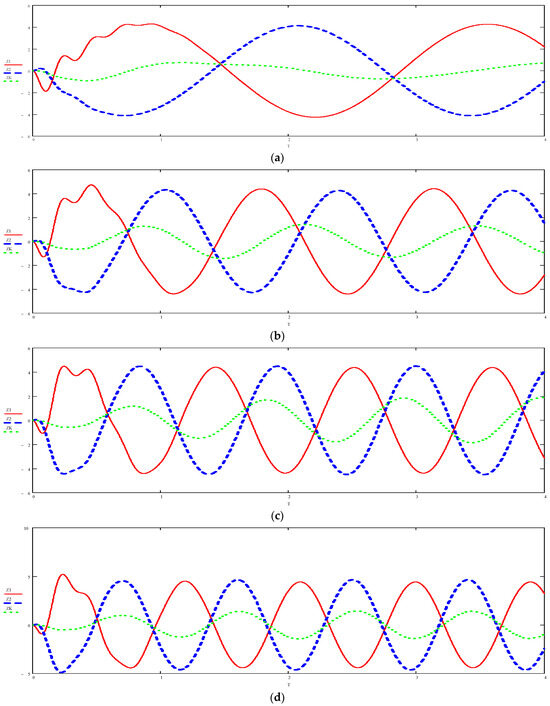 Figure 28. Graph of the movement of the body and bogies when moving along a short unevenness (L = 30 mm) with different speeds. (a) ϑ = 40 km/h; (b) ϑ = 80 km/h; (c) ϑ = 100 km/h; (d) ϑ = 120 km/h.
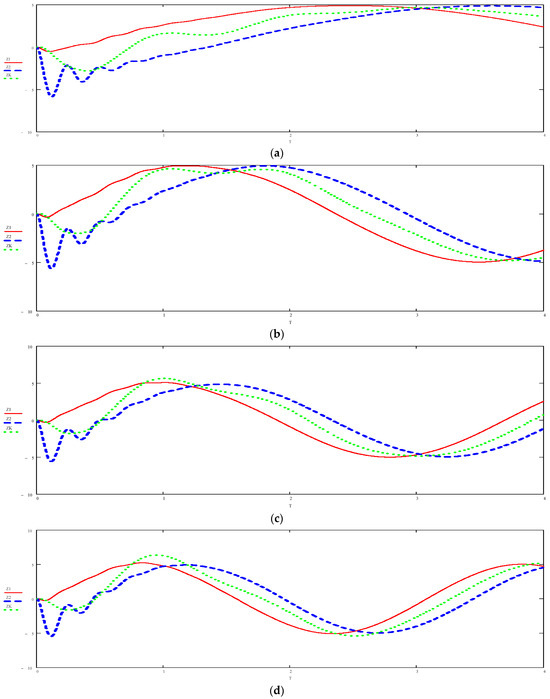 Figure 29. Graph of the movement of the body and bogies when moving along a short unevenness (L = 100 mm) with different speeds. (a) ϑ = 40 km/h; (b) ϑ = 80 km/h; (c) ϑ = 100 km/h; (d) ϑ = 120 km/h.
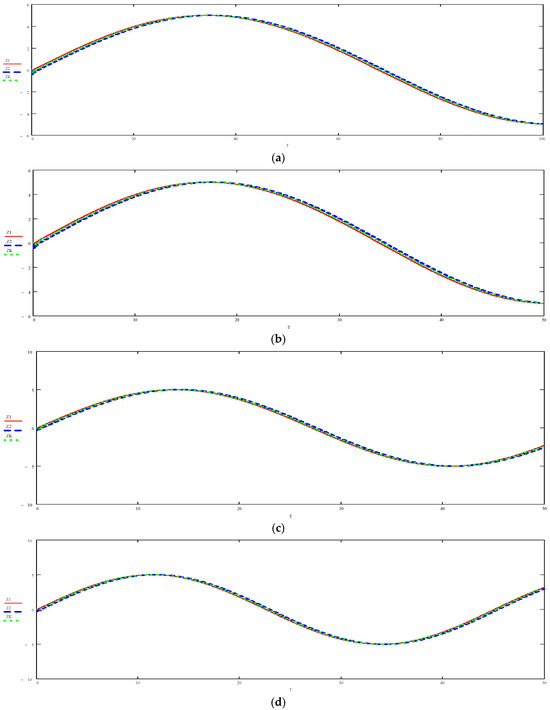 Figure 30. Graph of the movement of the body and bogies when moving along the length of the unevenness (L = 1500 mm) with different speeds. (a) ϑ = 40 km/h; (b) ϑ = 80 km/h; (c) ϑ = 100 km/h; (d) ϑ = 120 km/h.
Figure 25 shows the graphs of the speed of movement of the body and bogies when moving along a short unevenness (L = 30 mm) with different speeds [15]. As can be seen in the figure, the first bogie at a speed of ϑ = 40 km/h reaches a high oscillation amplitude of 0.05 m, and at a speed of ϑ = 120 km/h the oscillation reaches an amplitude of 0.07 m. Figure 26 shows the graphs of the speed of movement of the body and bogies when moving along a short unevenness (L = 100 mm) at different speeds. As can be seen in the figure, with an uneven path with a length of 100 mm and a speed of ϑ = 40 km/h, the oscillation amplitude reaches 0.017 m, and at a speed of ϑ = 120 km/h it reaches 0.023 m.
Figure 27 shows the graphs of the speed of movement of the body and bogies when moving along a long unevenness (L = 1500 mm) at different speeds [24]. As can be seen in the figure, at a low speed of ϑ = 40 km/h and a long roughness of the track, the locomotive bogie reaches a 0.0007 m amplitude, and at the maximum speed of ϑ = 120 km/h, the oscillation of the locomotive bogie reaches 0.001 m.
Based on the graphs obtained in Figure 25, Figure 26 and Figure 27, we can conclude that with an increase in speed from 40 km/h to 120 km/h, the bogie oscillation amplitude changes (increases), which has a negative effect on the dynamics of the locomotive. On short bumps with the highest speed, the dynamics of the locomotive worsens [26].
As can be seen in Figure 28, for a short roughness (L = 30 mm), the oscillation height reaches 5 mm. With an increase in speed, the frequency of amplitude oscillations increases, thereby deteriorating the smoothness of the movement of the locomotive.
In Figure 29, the height of the amplitude also reaches 5 mm, and the oscillation frequency decreases two-fold with a decrease in the speed of movement [27,28,29,30].
In Figure 30, at speeds of ϑ = 40 km/h and ϑ = 120 km/h, the height of the amplitude reaches 5 mm, and the oscillation frequency increases three times with increasing speed.
Based on the graphs obtained in Figure 28, Figure 29 and Figure 30, it can be concluded that with a long roughness of the track, the amplitude of oscillations decreases significantly and the smoothness of the locomotive movement increases, which does not affect the dynamics of the locomotive [31,32,33,34].
The obtained results of experimental studies and modeling of the dynamic characteristics of rolling stock can be used to optimize the design of locomotives when designing new ones. The experimentally determined dynamic characteristics of the rolling stock allow us to draw the main conclusions that follow.
8. Conclusions
The performed studies allow us to draw the following main conclusions:
- -
- Experimentally obtained values of the vertical dynamics coefficients of the first and second stages of the spring suspension of the tested diesel locomotive CKD6E-2108 did not exceed the permissible limits, and the maximum values for the vertical dynamics coefficients were 0.11 for the first stage and 0.25 for the second stage. In this case, it should be noted that the obtained limit value of 0.25 of the vertical dynamics coefficient of the second stage was recorded when moving at a speed of 90 km/h, which is 12.5% higher than the designated speed [18];
- -
- The experimentally obtained maximum value of the ratio of frame forces to the static load from the wheelset on the rails was 0.08;
- -
- The obtained minimum value of the stability factor against derailment of the wheel on the straight section of the track was much higher than the standard value;
- -
- Thus, the speed of movement along straight sections was in accordance with the norms for permissible movement speeds according to the assessment of dynamic indicators, which may be limited by the declared designated speed of the type of rolling stock under study [20];
- -
- Experimentally obtained dynamic performance of the investigated diesel locomotive CKD6E-2108 (the ratio of frame forces relative to the static load from the wheelset on the rails, the coefficients of vertical dynamics of the first and second stages of suspension and the stability factor against derailment of the wheel from the rail were registered on the track section in a curve with a radius of 400 m) meet current requirements;
- -
- The design scheme and the equation of vertical oscillations were developed.
Using the MathCAD application system:
- -
- An analysis was carried out according to the schedules of movements of the bogies and the body of the locomotive when moving along irregularities of different lengths at different speeds;
- -
- With an increase in speed from 40 km/h to 120 km/h, the amplitude of the bogie oscillation changed (increases), which had a negative effect on the dynamics of the locomotive. On short bumps with the highest speed, the dynamics of the locomotive worsened [3];
- -
- With a long roughness of the track, the amplitude of oscillations was significantly reduced and the smoothness of the movement of the locomotive increased, which did not affect the dynamics of the locomotive.
- -
- Further studies of the dynamic and operational characteristics of the studied diesel locomotive CKD6e can be supplemented as information related to the operation, repair and maintenance of the studied brand of diesel locomotive when it becomes available.
Author Contributions
Conceptualization, J.M.; methodology, J.M. and A.Z.; software, A.Z.; validation, A.Z. and J.M.; formal analysis, A.Z. and J.M.; investigation, A.Z. and J.M.; resources, S.Y. and S.I.; data curation, S.Y. and S.I.; writing—original draft preparation, A.Z.; writing—review and editing, A.Z. and J.M.; visualization, J.M.; supervision, J.M. All authors have read and agreed to the published version of the manuscript.
Funding
This research was funded by Academy of Logistics and Transport.
Institutional Review Board Statement
This study did not require ethical approval.
Informed Consent Statement
Not applicable.
Data Availability Statement
All data products generated in this study (velocity models, the performed studies) are available from the authors upon request.
Acknowledgments
This work received financial support from the Academy of Logistics and Transport and was performed at the Institute of Transport Engineering, which is gratefully acknowledged by the authors.
Conflicts of Interest
The authors confirm that they have no conflict of interest with respect to the work described in this manuscript.
References
- Tyrell, D.; Jacobsen, K.; Martinez, E.; Benjamin Perlman, A. Train-to-Train Impact Test of Crash Energy Management Passenger Rail Equipment: Structural Results. In Proceedings of the ASME 2006 International Mechanical Engineering Congress and Exposition, Atlanta, GA, USA, 2–4 May 2006; pp. 1–10. [Google Scholar]
- Murzakayeva, M.; Musayev, J.; Kvashnin, M.; Zhunisbekov, S.; Zhauyt, A.; Azilkiyasheva, M. Experimental Evaluation of Railway Crew Impact on Tension Rails. Int. J. Mech. Eng. Robot. Res. 2021, 10, 261–269. [Google Scholar] [CrossRef]
- Musayev, J.; Yelzhanov, Y.; Aliyarova, M.; Yelemanova, A.; Zhauyt, A. Shock-impulse diagnosis of railway. Eng. Rural. Dev. 2018, 17, 1618–1623. [Google Scholar]
- Zhu, T.; Xiao, S.; Lei, C.; Wang, X.; Zhang, J.; Yang, B.; Yang, G.; Li, Y. Rail vehicle crashworthiness based on collision energy management: An overview. Int. J. Rail Transp. 2020, 9, 101–131. [Google Scholar] [CrossRef]
- Liu, P.; Wang, K.; Zhang, D. Influence of Traction and Braking Operation on Wheel-Rail Dynamic Interaction for Heavy Haul Locomotive. China Railw. Sci. 2017, 38, 96–104. [Google Scholar]
- Zakeri, J.A.; Xia, H. Sensitivity analysis of track parameters on train-track dynamic interaction. J. Mech. Sci. Technol. 2008, 22, 1299–1304. [Google Scholar] [CrossRef]
- Musayev, J.; Abilkaiyr Zh Kaiym, T.; Alpeisov, A.; Alimbetov, A.; Zhauyt, A. The interaction of the freight car and way taking into account deformation of assembled rails and sleepers. Vibroeng. Procedia 2016, 8, 269–274. [Google Scholar]
- Musayev, J.; Solonenko, V.; Mahmetova, N.; Kvashnin, M.; Zhauyt, A.; Buzauova, T. Modeling of dynamic characteristics of freight car with optimized parameters of wedge-type shock absorber. J. Vibroeng. 2017, 19, 1197–1213. [Google Scholar]
- Wei, D.; Wei, X.; Jia, L. Automatic Defect Description of Railway Track Line Image Based on Dense Captioning. Sensors 2022, 22, 6419. [Google Scholar] [CrossRef] [PubMed]
- Bižić, M.B.; Petrović, D.Z.; Tomić, M.C.; Djinović, Z.V. Development of method for experimental determination of wheel–rail contact forces and contact point position by using instrumented wheelset. Meas. Sci. Technol. 2017, 28, 075902. [Google Scholar] [CrossRef]
- Dumitriu, M.; Fologea, D.; Cruceanu, I.C. Effects analysis of vertical track irregularities on bogie vibration—Method based on bogie modelling and wheelsets accelerations measurement. IOP Conf. Ser. Mater. Sci. Eng. 2021, 1018, 012001. [Google Scholar] [CrossRef]
- Gao, T.; Cong, J.; Wang, P.; Liu, J.; Wang, Y.; He, Q. Vertical track irregularity analysis of high-speed railways on simply-supported beam bridges based on the virtual track inspection method. Proc. Inst. Mech. Eng. Part F J. Rail Rapid Transit 2020, 235, 328–338. [Google Scholar] [CrossRef]
- GOST R 55050-2012 Railway Rolling Stock Norms of Permissible Impact on the Railway Track and Test Methods. Available online: https://pdf.standartgost.ru/catalog/Data2/1/4293787/4293787514 (accessed on 8 November 2012).
- Li, H.; Yang, W.G.; Liu, P.; Wang, M. Prediction method and experimental verification of vibration response caused by underground high-speed railways. J. Low Freq. Noise Vib. Act. Control 2022, 42, 452–469. [Google Scholar] [CrossRef]
- Olivier, B.; Verlinden, O.; Kouroussis, G. Comparison of X–T and X–X co-simulation techniques applied on railway dynamics. Multibody Syst. Dyn. 2022, 55, 39–56. [Google Scholar] [CrossRef]
- Bondarenko, I.; Keršys, R.; Neduzha, L. Analysis of Problem Related to Experimental Data Processing in the Study of the Rolling Stock Influence on the Track. In Proceedings of the 26th International Conference Transport Means, Kaunas, Lithuania, 5–7 October 2022; pp. 663–668. [Google Scholar]
- Doi, H.; Hondo, T.; Nishiyama, Y.; Kuniyuki, S.; Tanaka, T. Stationary Test Method for Evaluating Wheel Unloading of Railway Vehicle on Twisted Track Simulated with Spacers between Wheel and Rail. Proc. Transp. Logist. Conf. 2020, 29, 3801. [Google Scholar] [CrossRef]
- Wang, H.; Berkers, J.; Hurk, N.V.D.; Layegh, N.F. Study of loaded versus unloaded measurements in railway track inspection. Measurement 2020, 169, 108556. [Google Scholar] [CrossRef]
- De Souza, E.F.; Bittencourt, T.N.; Ribeiro, D.; Carvalho, H. Feasibility of Applying Mel-Frequency Cepstral Coefficients in a Drive-by Damage Detection Methodology for High-Speed Railway Bridges. Sustainability 2022, 14, 13290. [Google Scholar] [CrossRef]
- DSTU 7571:2014; Railway Rolling Stock Permissible Exposure Norms to the Railway Track Width 1520 m. Minekonomrozvitku: Kyiv, Ukraine, 2015.
- Spiroiu, M.A.; Nicolescu, M. On the estimation of the reliability probabilistic model of railway wheelset. IOP Conf. Ser. Mater. Sci. Eng. 2019, 682, 012001. [Google Scholar] [CrossRef]
- Wang, K.; Huang, C.; Zhai, W.; Liu, P.; Wang, S. Progress on wheel-rail dynamic performance of railway curve negotiation. J. Traffic Transp. Eng. (Engl. Ed.) 2014, 1, 209–220. [Google Scholar] [CrossRef]
- Ahmed, K.W.; Sankar, S. Steady-state curving performance of railway freight truck with damper-coupled wheelsets. Veh. Syst. Dyn. 1988, 26, 295–315. [Google Scholar] [CrossRef]
- Cherkashin, Y.M.; Pogorelov, D.Y.; Simonov, V.A. Influence of rolling stock and track parameters on train traffic safety. Vestn. VNIIZhT 2010, 2, 11–20. [Google Scholar]
- Chi, M.R.; Wang, K.W.; Fu, M.H.; Ni, W.; Zhang, W. Study on curving performance for bogie with magnetic fluid coupled wheel-sets. J. China Railw. Soc. 2002, 24, 28–33. [Google Scholar]
- Dukkipati, R.V.; Swamy, S.N. Lateral stability and steady state curving performance of unconvertional rail truck. Mech. Mach. Theory 2001, 36, 577–587. [Google Scholar] [CrossRef]
- Gialieonaido, E.D.; Braghin, F.; Biuni, S. The influence of track modeling options on the simulation of rail vehicle dynamics. J. Sound Vib. 2012, 331, 4246–4258. [Google Scholar]
- Huang, Y.H.; Li, F.; Fu, M.H. Research on curving performance of a bogie with independently rotating wheels. China Railw. Sci. 2001, 22, 7–11. [Google Scholar]
- Kurzeck, B. Combined friction induced oscillations of wheelset and track during the curving of metres and their influence on corrugation. Wear 2011, 271, 299–310. [Google Scholar] [CrossRef]
- Lee, S.Y.; Cheng, Y.C. Influences of the vertical and the roll motions of frames on the hunting stability of trucks moving on curved tracks. J. Sound Vib. 2006, 294, 441–453. [Google Scholar] [CrossRef]
- Lu, Z.G.; Zhao, H.X. Curve performance study and parameter design of flexible coupled single-wheelset running gears. China Railw. Sci. 2004, 25, 32–37. [Google Scholar]
- Ni, P.T.; Wang, K.W.; Chen, J. Influence of anti-hunting damper on critical velocity and high-speed curve negotiating performance of the vehicle with MRF coupled wheelsets. J. China Railw. Soc. 2007, 29, 34–39. [Google Scholar]
- Ren, Z.S.; Sun, S.G. Study on the influence of parameters to the dynamics of light rail vehicles with independently rotating wheel. Electr. Locomot. Mass Transit Veh. 2003, 26, 22–24. [Google Scholar]
- Bondarenko, I.; Lukoševičius, V.; Keršys, R.; Neduzha, L. Investigation of Dynamic Processes of Rolling Stock–Track Interaction: Experimental Realization. Sustainability 2023, 15, 5356. [Google Scholar] [CrossRef]
Disclaimer/Publisher’s Note: The statements, opinions and data contained in all publications are solely those of the individual author(s) and contributor(s) and not of MDPI and/or the editor(s). MDPI and/or the editor(s) disclaim responsibility for any injury to people or property resulting from any ideas, methods, instructions or products referred to in the content. |
© 2023 by the authors. Licensee MDPI, Basel, Switzerland. This article is an open access article distributed under the terms and conditions of the Creative Commons Attribution (CC BY) license (https://creativecommons.org/licenses/by/4.0/).