Article

Zn Doping Improves the Anticancer Efficacy of SnO2 Nanoparticles

1
Department of Physics, College of Science, Imam Mohammad Ibn Saud Islamic University, Riyadh 11642, Saudi Arabia
2
Department of Physics and Astronomy, College of Science, King Saud University, Riyadh 11451, Saudi Arabia
3
Department of Biochemistry, School of Life and Basic Sciences, Jaipur National University, Jaipur 302017, Rajasthan, India
4
Microelectronics and Semiconductors Institute, King Abdulaziz City for Science and Technology (KACST), Riyadh 11442, Saudi Arabia
5
King Abdullah Institute for Nanotechnology, King Saud University, Riyadh 11451, Saudi Arabia
*
Author to whom correspondence should be addressed.
Appl. Sci. 2023, 13(22), 12456; https://doi.org/10.3390/app132212456
Submission received: 14 October 2023 / Revised: 6 November 2023 / Accepted: 7 November 2023 / Published: 17 November 2023

Abstract

:
Tin dioxide (SnO2) nanoparticles (NPs) can be applied in several ways due to their low cost, high surface-to-volume ratio, facile synthesis, and chemical stability. There is limited research on the biomedical application of SnO2-based nanostructures. This study aimed to investigate the role of Zn doping in relation to the anticancer potential of SnO2 NPs and to enhance the anticancer potential of SnO2 NPs through Z doping. Pure SnO2 and Zn-doped SnO2 NPs (1% and 5%) were prepared using a modified sol–gel route. XRD, TEM, SEM, EDX, UV-Vis, FTIR, and PL techniques were used to characterize the physicochemical properties of produced NPs. XRD analysis revealed that the crystalline size and phase composition of pure SnO2 increased after the addition of Zn. The spherical shape and homogenous distribution of these NPs were confirmed using TEM and SEM techniques. EDX analysis confirmed the Sn, Zn, and O elements in Zn-SnO2 NPs without impurities. Zn doping decreased the band gap energy of SnO2 NPs. The PL study indicated a reduction in the recombination rate of charges (electrons/holes) in SnO2 NPs after Zn doping. In vitro studies showed that the anticancer efficacy of SnO2 NPs increased with increasing levels of Zn doping in breast cancer MCF-7 cells. Moreover, pure and Zn-doped SnO2 NPs showed good cytocompatibility in HUVECs. This study emphasizes the need for additional investigation into the anticancer properties of Zn-SnO2 nanoparticles in various cancer cell lines and appropriate animal models.

1. Introduction

Nanoparticles (NPs) have been applied in various ways, such as gas sensing, environmental remediation, and biomedical research, due to their unique physicochemical properties [1,2]. They are also utilized in developing biomaterials for tissue engineering and regenerative medicine. Moreover, NPs have emerged as promising candidates for therapeutic use in a wide range of disorders. Targeted treatments, such as photothermal therapy, photodynamic therapy, and gene therapy, may be facilitated by their applications. Different medications based on NPs have recently entered the market, and many of them are undergoing different phases of preclinical and clinical trials [3,4,5].
Among these NPs, metal oxide NPs (MONPs), such as Bi2O3, SnO2, TiO2, WO3, and In2O3, have received significant attention with regards to their potential application. They exhibited several advantageous properties that make them highly promising for biomedical applications due to their high stability, easy preparation, and the ability to easily control their size and shape [6,7,8,9]. Tin oxide (SnO2) is a semiconductor material with a broad band gap and n-type conductivity. It has a band gap of 3.6 eV and possesses good electrical, optical, and thermal properties [10,11]. These metal oxide NPs can be prepared using various approaches. Among these approaches, sol–gel [12], Co precipitation [13], hydrothermal methods [14], thermal decomposition [15], and microwave-assisted reactions [16] have been used to synthesize SnO2. Currently, researchers have applied several dopant metals, including Er3+, Mn, Co, Ni, and Fe, to enhance the physicochemical properties of SnO2 [17,18,19,20]. For example, Divya et al. [21] investigated that Cu and Fe dopants change the crystallite size and electrical conductivity of SnO2 NPs. Furthermore, Sharma et al. [22] reported that the reduction in band gap energy of SnO2 NPs observed with increasing the amount of Zn.
Studies suggested that tin oxide (SnO2 NPs) induces cytotoxicity, membrane damage, and oxidative stress in various biological systems. A study conducted by Ahamed et al. [23] showed that SnO2 NPs cause cytotoxicity in human breast cancer cells by triggering oxidative stress. Wang et al. [24] showed that SnO2 NPs induced oxidative stress with increasing intracellular ROS accumulation. Guo et al. [25] showed that SnO2 NPs, produced using laser ablation, suppressed the growth of MCF-7 breast cancer cells. Mahjouri et al. [26] found that SnO2 NPs caused high cytotoxicity and oxidative stress in tobacco cell cultures with Ag doping. Prasanth et al. [27] revealed that increasing Ce-dopant concentrations improved the anticancer activity of SnO2 NPs compared to pure SnO2 NPs. our previous study Alaizeri et al. [28] investigated that pure SnO2 NPs and SnO2/RGO NCs induce cytotoxicity against liver (HepG2) and lung (A549) cancer cells.
The objective of this study was to examine how the addition of Zn affects the ability of SnO2 NPs to inhibit the growth of cancer cells. A modified sol–gel process successfully prepared pure and Zn-doped SnO2 NPs. Various techniques, including XRD, TEM, FE-SEM, EDX, FTIR, UV-vis, and PL spectrometry, were carefully used to examine the properties of synthesized NPs. This biological study was focused on examining the anticancer properties of nanoparticles (NPs) against MCF-7 cells. The biocompatibility of produced NPs was also examined on HUVECs. These results suggest that the cytotoxicity of Zn-doped SnO2 NPs against MCF-7 cells were higher than pure SnO2, and they have good biocompatibility with normal HUVECs.

2. Experimental Part

2.1. Chemicals and Reagents

Tin (IV) chloride (SnCl4·5H2O), zinc acetate dihydrate (Zn(CH3COO)2·2H2O), polyvinyl alcohol (PVA), and MTT (3-(4,5-dimethylthiazol-2-yl)-2,5-diphenyltetrazolium bromide) dye were obtained from Sigma-Aldrich (Millipore-Sigma, St. Louis, MO, USA).

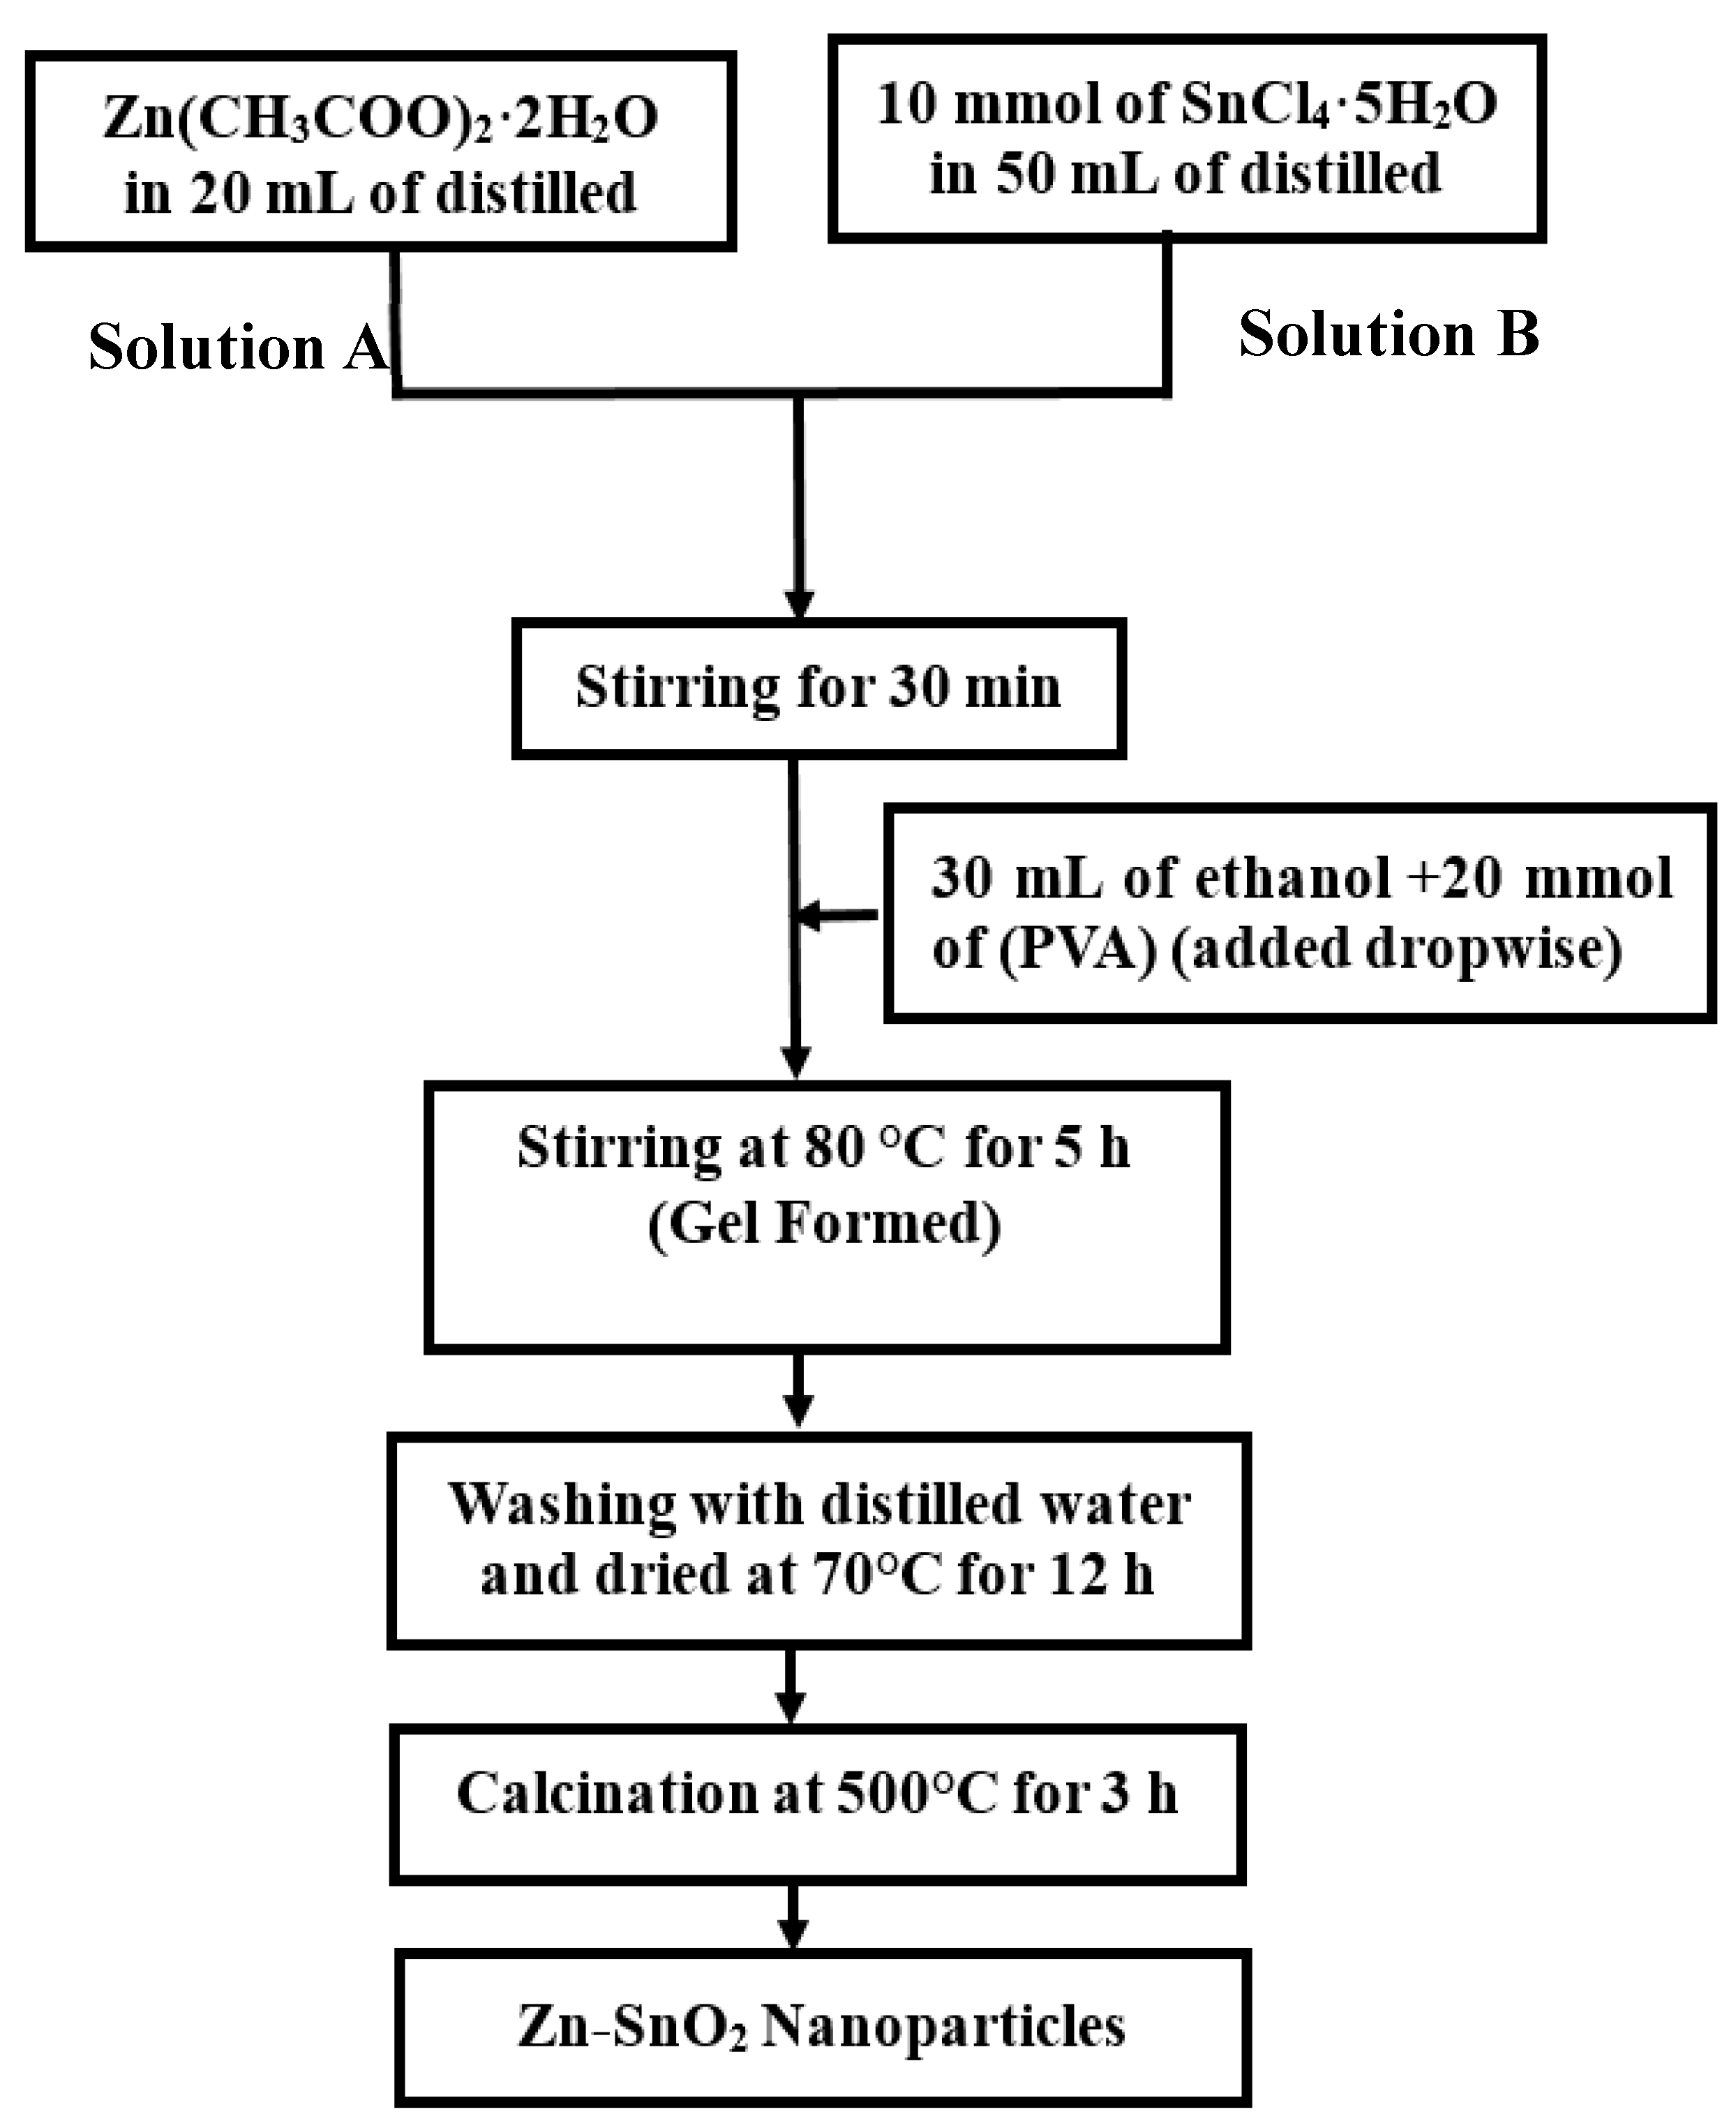
2.2. Synthesis of Zn-SnO2 Nanoparticles

A modified sol–gel process [29] was successfully applied to prepare Zn(1% and 5%)-doped SnO2 NPs. Firstly, 10 mmol of tin (IV) chloride (SnCl4·5H2O) was dissolved in 50 mL of distilled water with continuous stirring to obtain a transparent solution. Then, varying concentrations (1 and 5 mol%) of zinc acetate dehydrate (Zn(CH3COO)2·2H2O) was added dropwise under continuous stirring for 30 min for homogeneous dispersion. Subsequently, a total of 30 mL of 100% ethanol was added dropwise to the mixed solution with continuous stirring. Furthermore, 20 mmol of polyvinyl alcohol (PVA) was added dropwise to act as a stabilizing agent on a hotplate at 80 °C for 4 h for gel formation. The produced gel was further dried in an oven at 70 °C for 12 h. The dried gel was carefully crushed and annealed at 500 °C for 3 h. Pure SnO2 NPs were generated at the identical protocol without the addition of zinc acetate. The main steps of Zn-doped SnO2 NPs synthesis are provided in Scheme 1.

2.3. Characterization of Pure and Zn-SnO2 Nanoparticles

X-ray diffraction (XRD) analysis was conducted using the PanAnalytic X’Pert Pro instrument from Malvern Instruments, Malvern, UK. XRD examination was utilized to ascertain the crystal structure and level of impurities in the synthesized NPs. The morphologies and distribution of these NPs were examined using FE-SEM (JSM-7600F, JEOL, Inc.) and FE-TEM (200 kV, 2100F, JEOL, Inc., Tokyo, Japan). The elemental composition of samples was determined using energy-dispersive X-ray spectroscopy (EDX). Fourier transform infrared (FTIR) (PerkinElmer Paragon 500, Waltham, MA, USA) spectroscopy was performed in order to investigate the functional groups present in the nanoparticles (NPs). The optical study was carried out by applying a UV-visible spectrophotometer (Hitachi U-2600, Tokyo, Japan) and a photoluminescence (PL) spectrometer (Hitachi F-4600, Hitachi, Tokyo, Japan).

2.4. Cell Culture

The MCF-7 cancer cell lines were obtained from the ATCC (Manassas, WA, USA). The HUVEC cell line was given by the College of Science at King Saud University (KSU, Riyadh, Saudi Arabia). The cells were cultured in DMEM (Invitrogen, Carlsbad, CA, USA). DMEM consisted of 10% fetal bovine serum (FBS) and antibiotics, namely 100 µg/mL of streptomycin and 100 U/mL of penicillin. The cells were grown in an incubator set at a temperature of 37 °C while being supplied with 5% CO2. Upon reaching a confluency level of 90%, the cells were sub-cultured.

2.5. Exposure Protocol

A stock solution was prepared by dissolving 1 mg/mL of both pure SnO2 NPs and Zn-doped SnO2 NPs (1% and 5%) in DMEM. The solution was subsequently diluted to various concentrations (0, 1.125, 2.5, 5, 10, 25, 50, 100, 200, and 300 µg/mL) for each NPs. The NPs of various dilutions were subjected to sonication for a duration of 25 min at a power of 40 using sonicates before being exposed it to the cells. The cancer cells were exposed to different concentrations (0–300 µg/mL) after seeding cells in 96-well plates.

2.6. MTT Assay

In this study, the anticancer efficacy and biocompatibility of NPs were successfully assessed using the MTT assay with some modifications, as reported in our study [30]. Firstly, 20,000 cells were carefully seeded into each well of a 96-well plate and incubated for 24 h at 37 °C in a 5% supply. The next day, the cells/wells were treated to different concentrations (1, 5, 10, 25, 50, and 100 μg/mL) of these NPs. Subsequently, the cells were incubated for 24 h at a temperature of 37 °C. Then, 20 µL of MTT dye solution was added into each well with an incubation period of 4 h to facilitate the formation of blue formazan crystals. Cell viability was measured using a microplate reader at a wavelength of 570 nm.

2.7. Data Analysis

A one-way analysis of variance (ANOVA) (GraphPad Prizm 10) was used to identify any significant differences among groups with mean ± SD. The significance level was p < 0.05.

3. Results and Discussions
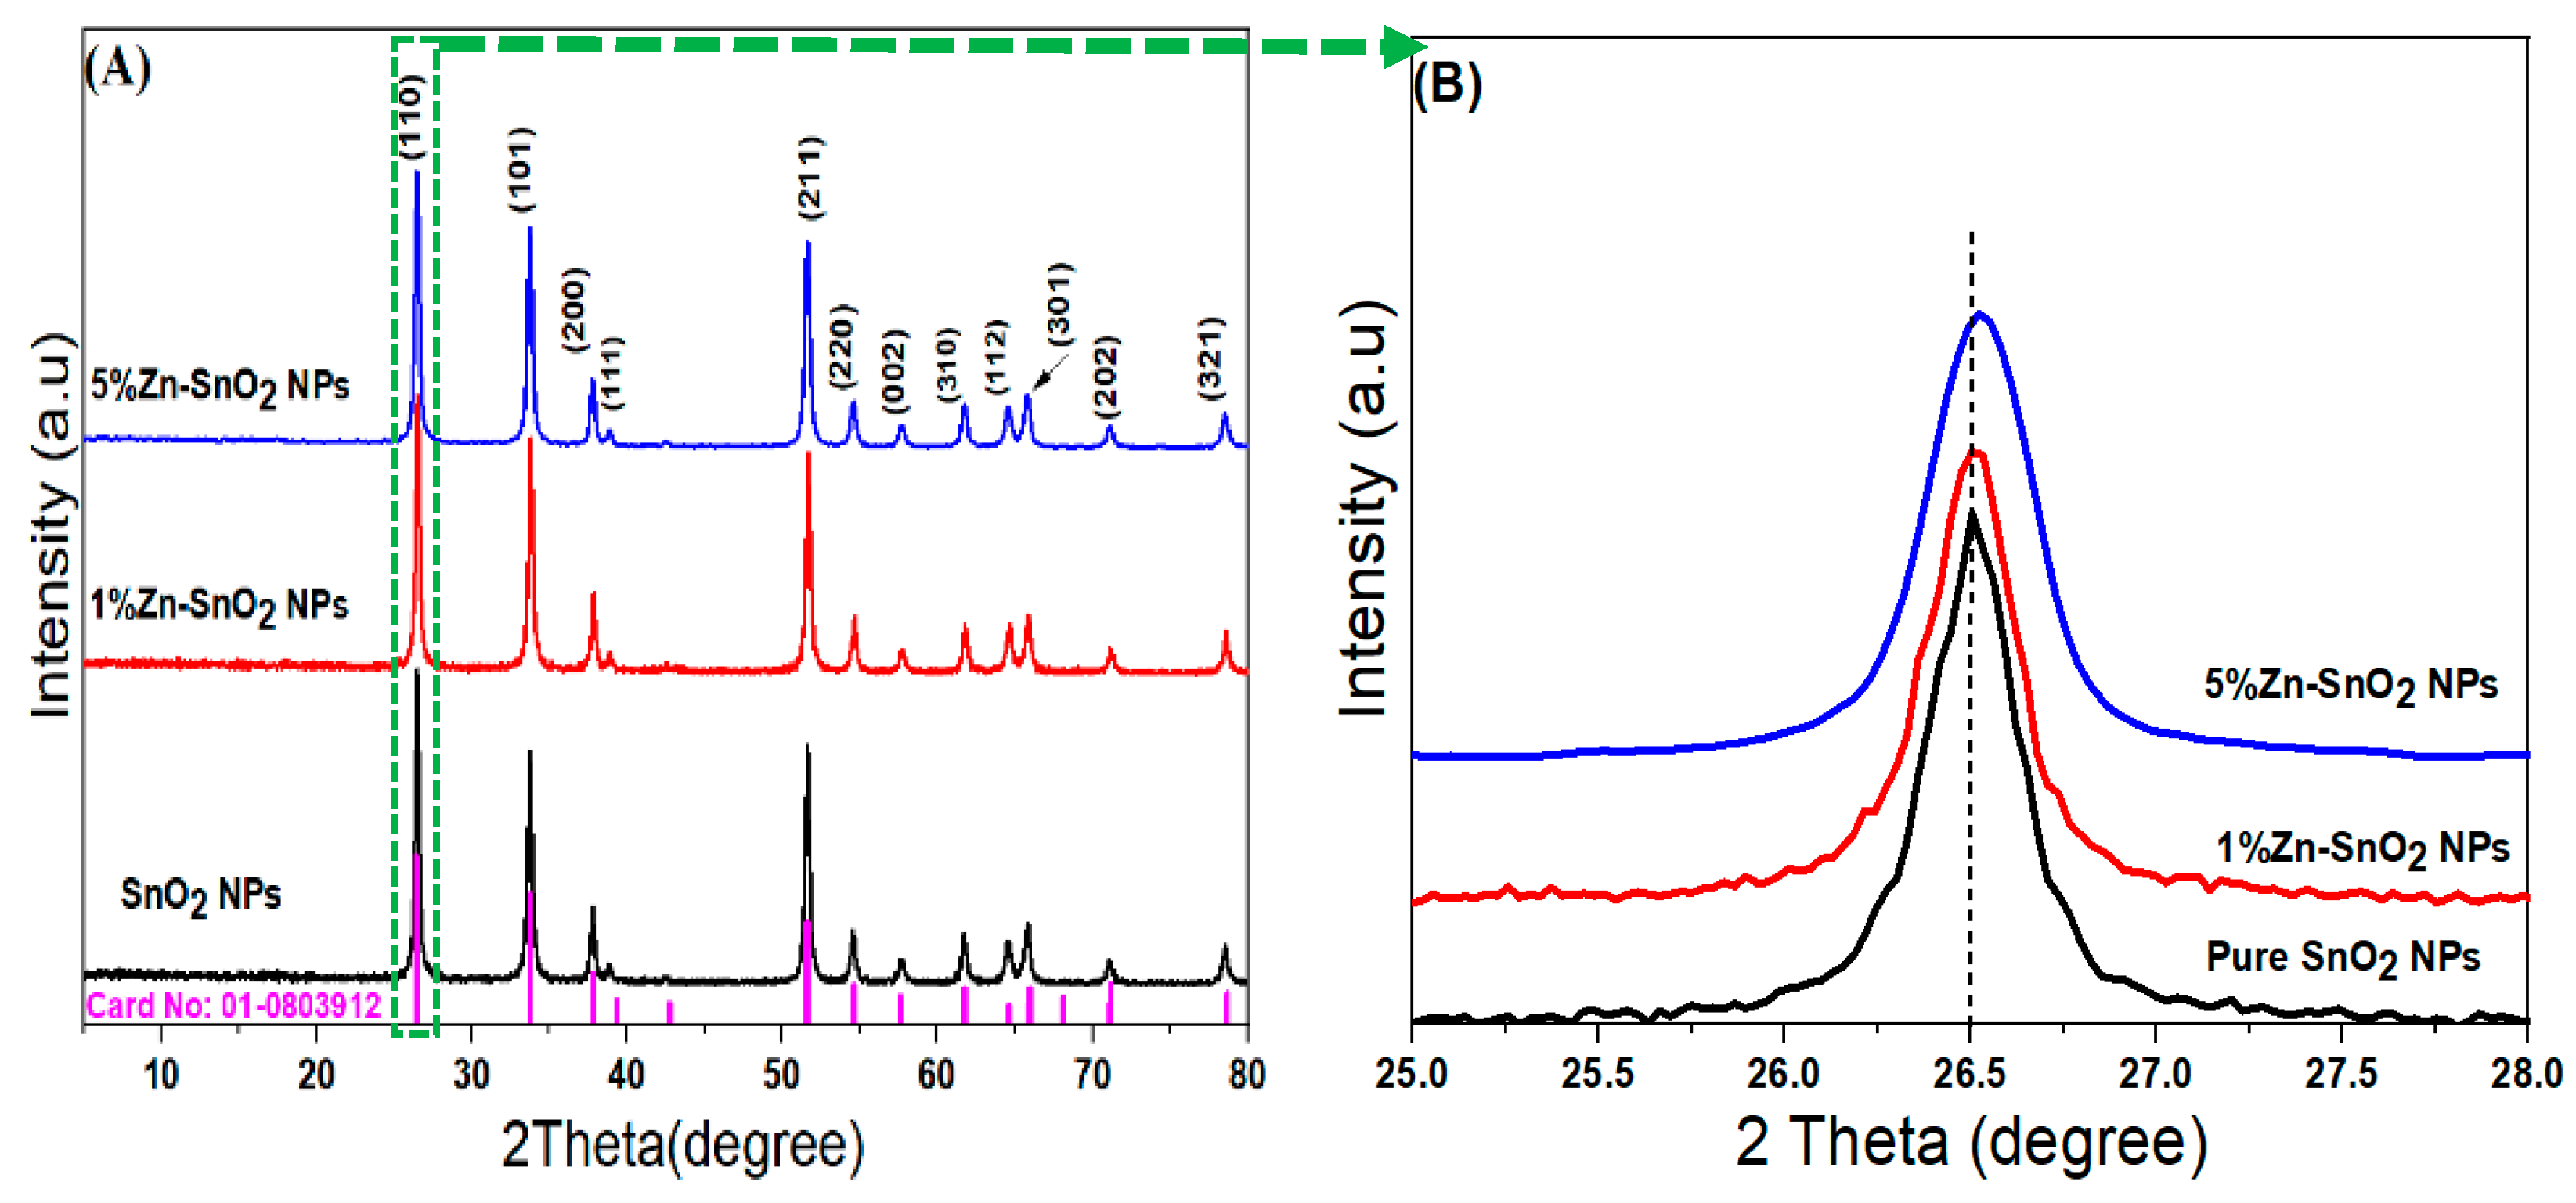
3.1. XRD Analysis

The determination of crystalline phases of synthesized materials was achieved via the use of X-ray diffraction (XRD) techniques. Figure 1A shows the XRD spectra of pure SnO2 NPs and Zn-doped SnO2 NPs (1% and 5%). The XRD peaks of pure SnO2 NPs (Figure 1A) were observed at 26.4°, 33.7°, 37.7°, 38.8°, 51.6°, 54.5°, 57.7°, 61.7°, 64.4°, 65.7°, 71.1°, and 87.5°. These peaks correspond with the (110), (101), (200), (111), (210), (211), (220), (002), (310), (112), (301), (202), and (321) planes, respectively. Moreover, we observed that these peaks matched with the standard SnO2 (JCPDS card no: 01-0803912). It can be seen in Figure 1A that the XRD spectra of Zn-doped SnO2 NPs were similar to those observed in pure SnO2 without impurity peaks associated with elemental zinc or other zinc compounds. This phenomenon signals the efficient incorporation of Zn atoms in SnO2 NPs [31]. Figure 1B reveals that there were slight shifts in the high angle for XRD peaks of Zn-doped SnO2 NPs (1% and 5%). However, the Scherer formula [32] was used to calculate the crystallite sizes of prepared NPs for diffraction peaks. Hence, the average crystallite sizes of pure SnO2 NPs and Zn-doped SnO2 NPs (1% and 5%) were 21.7 nm, 24.5 nm, and 26.2 nm, respectively as shown in Table 1. We observed that the crystallite sizes of SnO2 NPs increased with increasing Zn concentrations. This could be attributed to a higher ionic radii of Zn2+ (r = 0.74 Å) than Sn4+ (r = 0.71 Å), as shown in previous reports [31,33,34]. XRD results confirmed the successful synthesis of pure SnO2 NPs and Zn-doped SnO2 NPs with a tetragonal cassiterite structure. The presented results were in good agreement with previous reports [35,36,37].

3.2. TEM Analysis

The morphologies of prepared NPs were examined using transmission electron microscopy (TEM) techniques. The TEM images, HR-TEM images, and histogram distribution of the particle sizes of pure SnO2 NPs and Zn-doped SnO2 NPs are shown in Figure 2A–F. We observed that these NPs exhibited an almost spherical morphology and smooth surfaces with more agglomerate after Zn doping (Figure 2B,C), as shown in previous studies [38,39]. The d-spacing values of the lattice planes of pure SnO2 NPs and Zn-doped SnO2 NPs (1% and 5%) were 0.342 nm, 0.276 nm, and 0.241 nm, respectively (Figure 2D–F). These distances corresponded to the (101), (110), and (200) planes. Furthermore, these values were matched with XRD data (Figure 1). Figure 2G–I display a histogram distribution of the particle sizes of pure SnO2 NPs and Zn-doped SnO2 NPs. Table 1 shows the mean pure SnO2 NPs and Zn-doped SnO2 NPs (1% and 5%). We observed that the particle sizes of prepared NPs increased with increasing Zn concentrations. These results agreed with previous investigations [33,40,41,42].

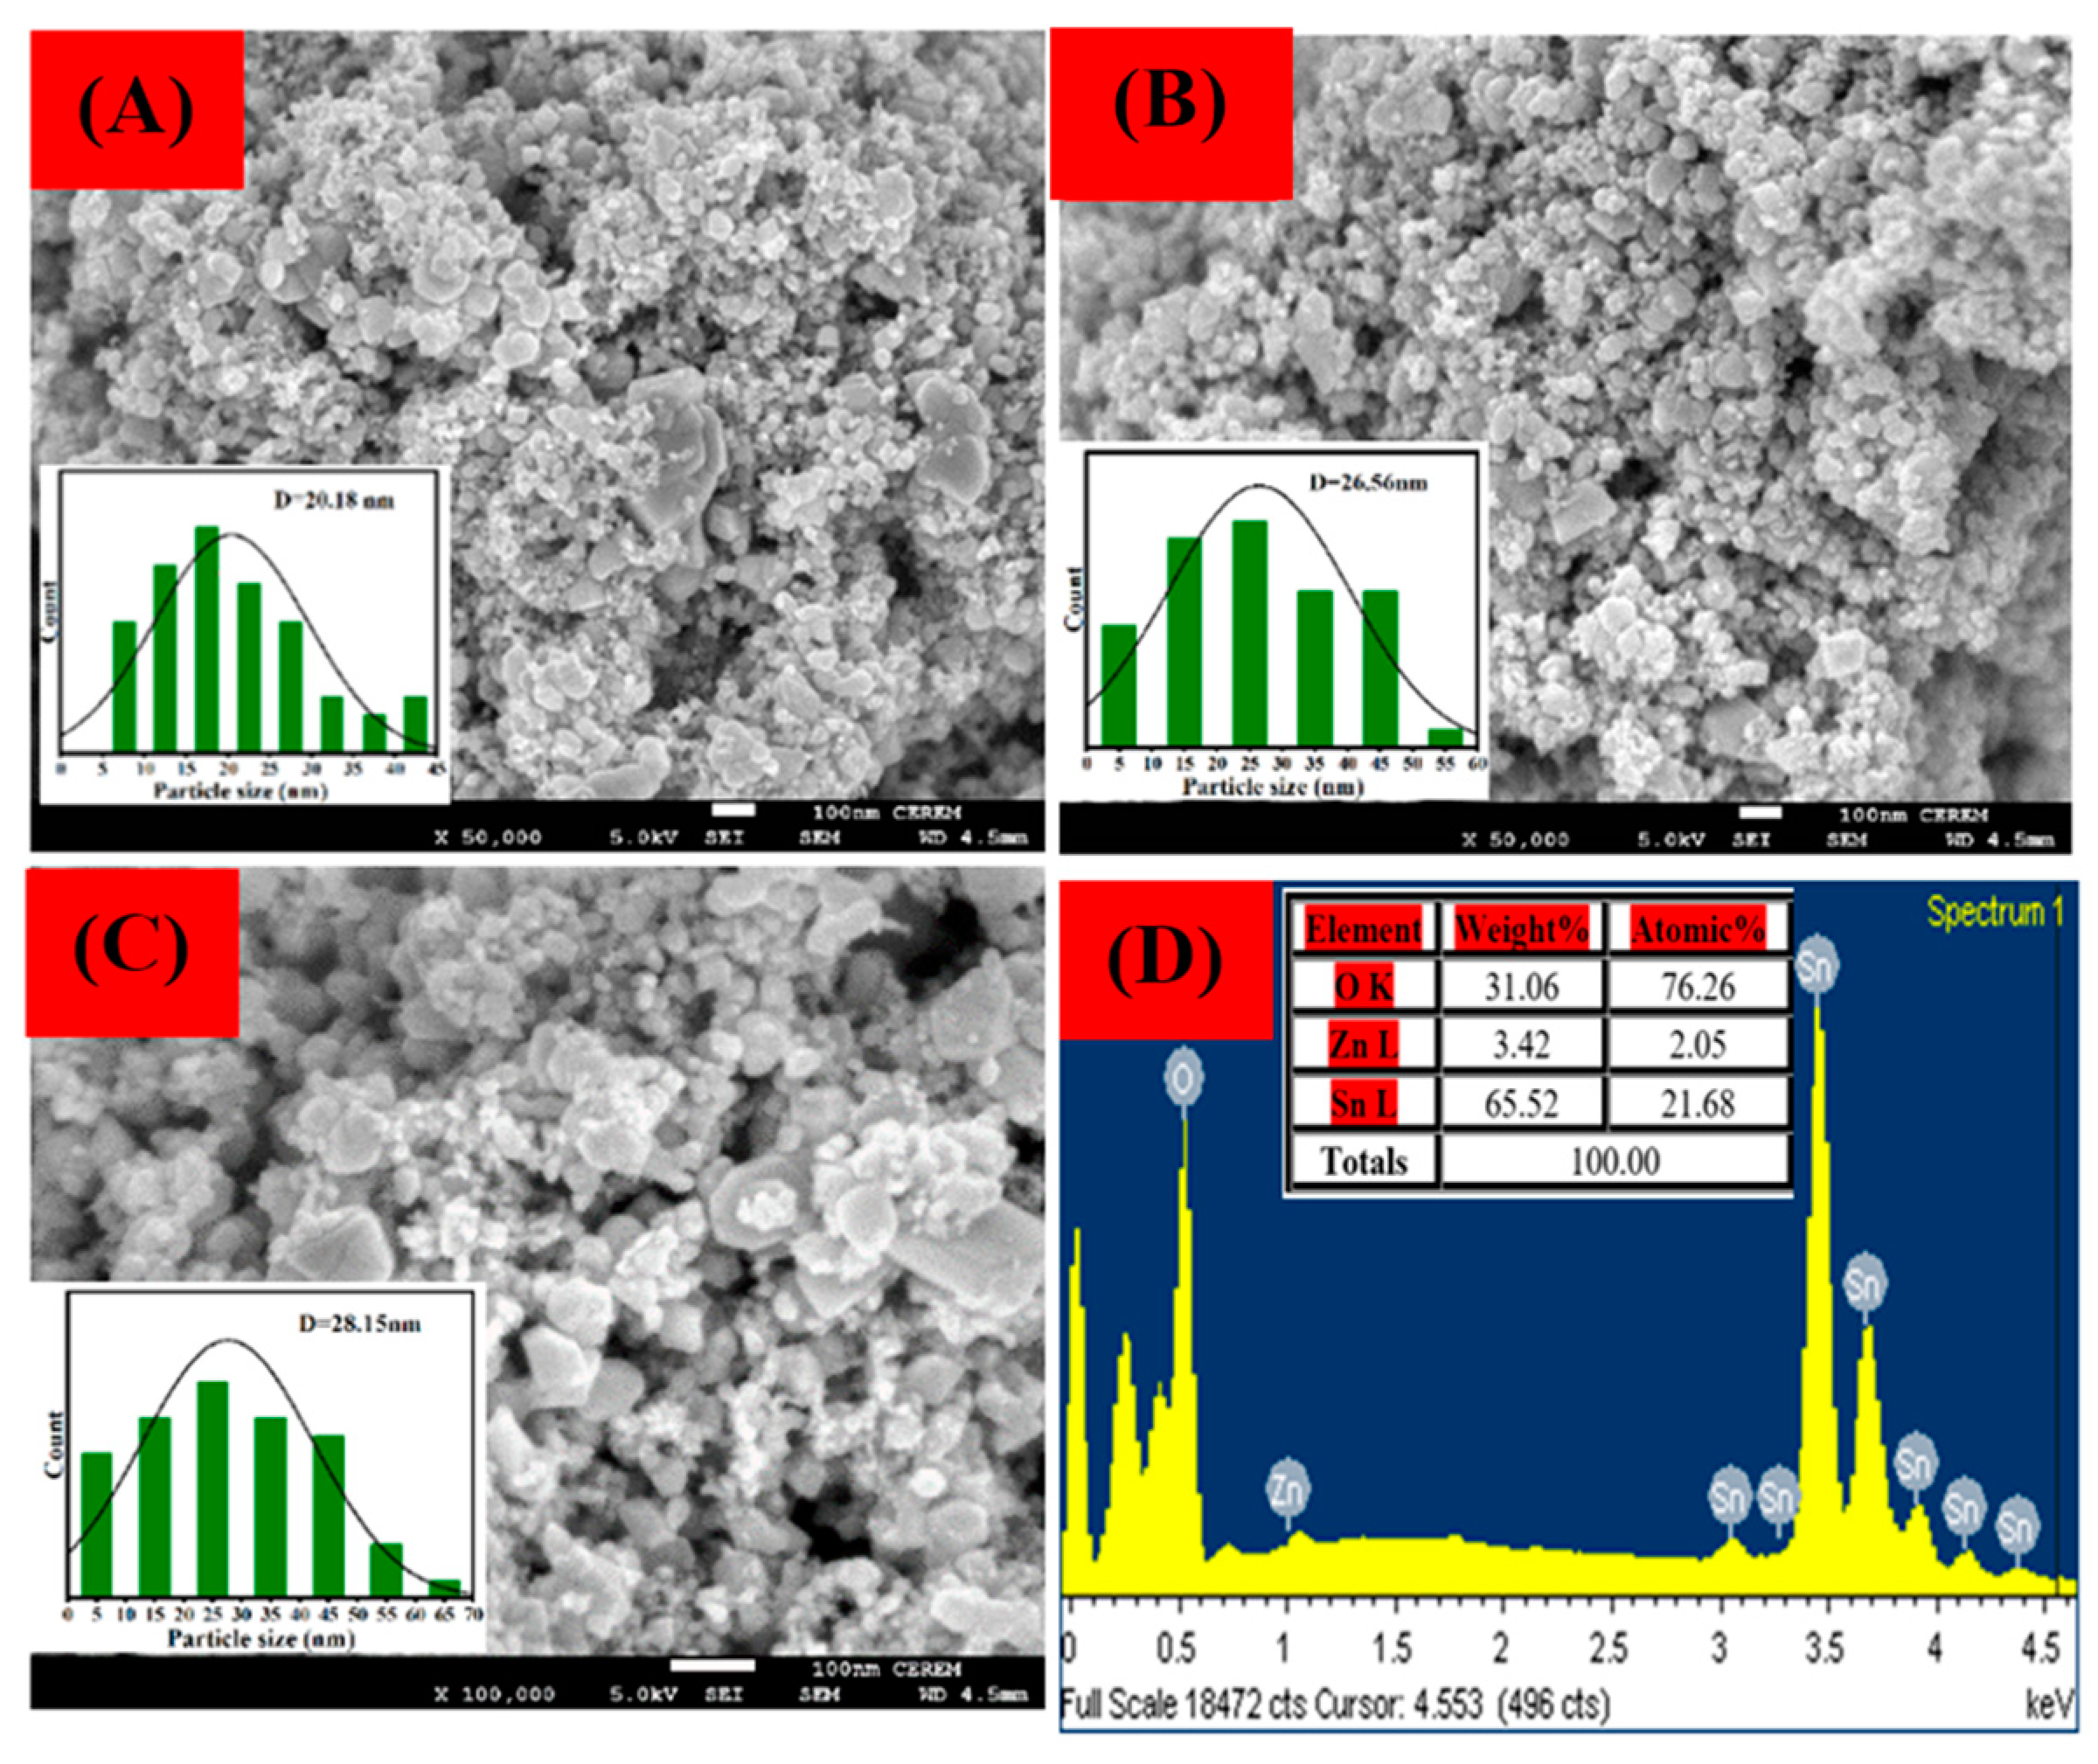
3.3. SEM with EDX Analysis
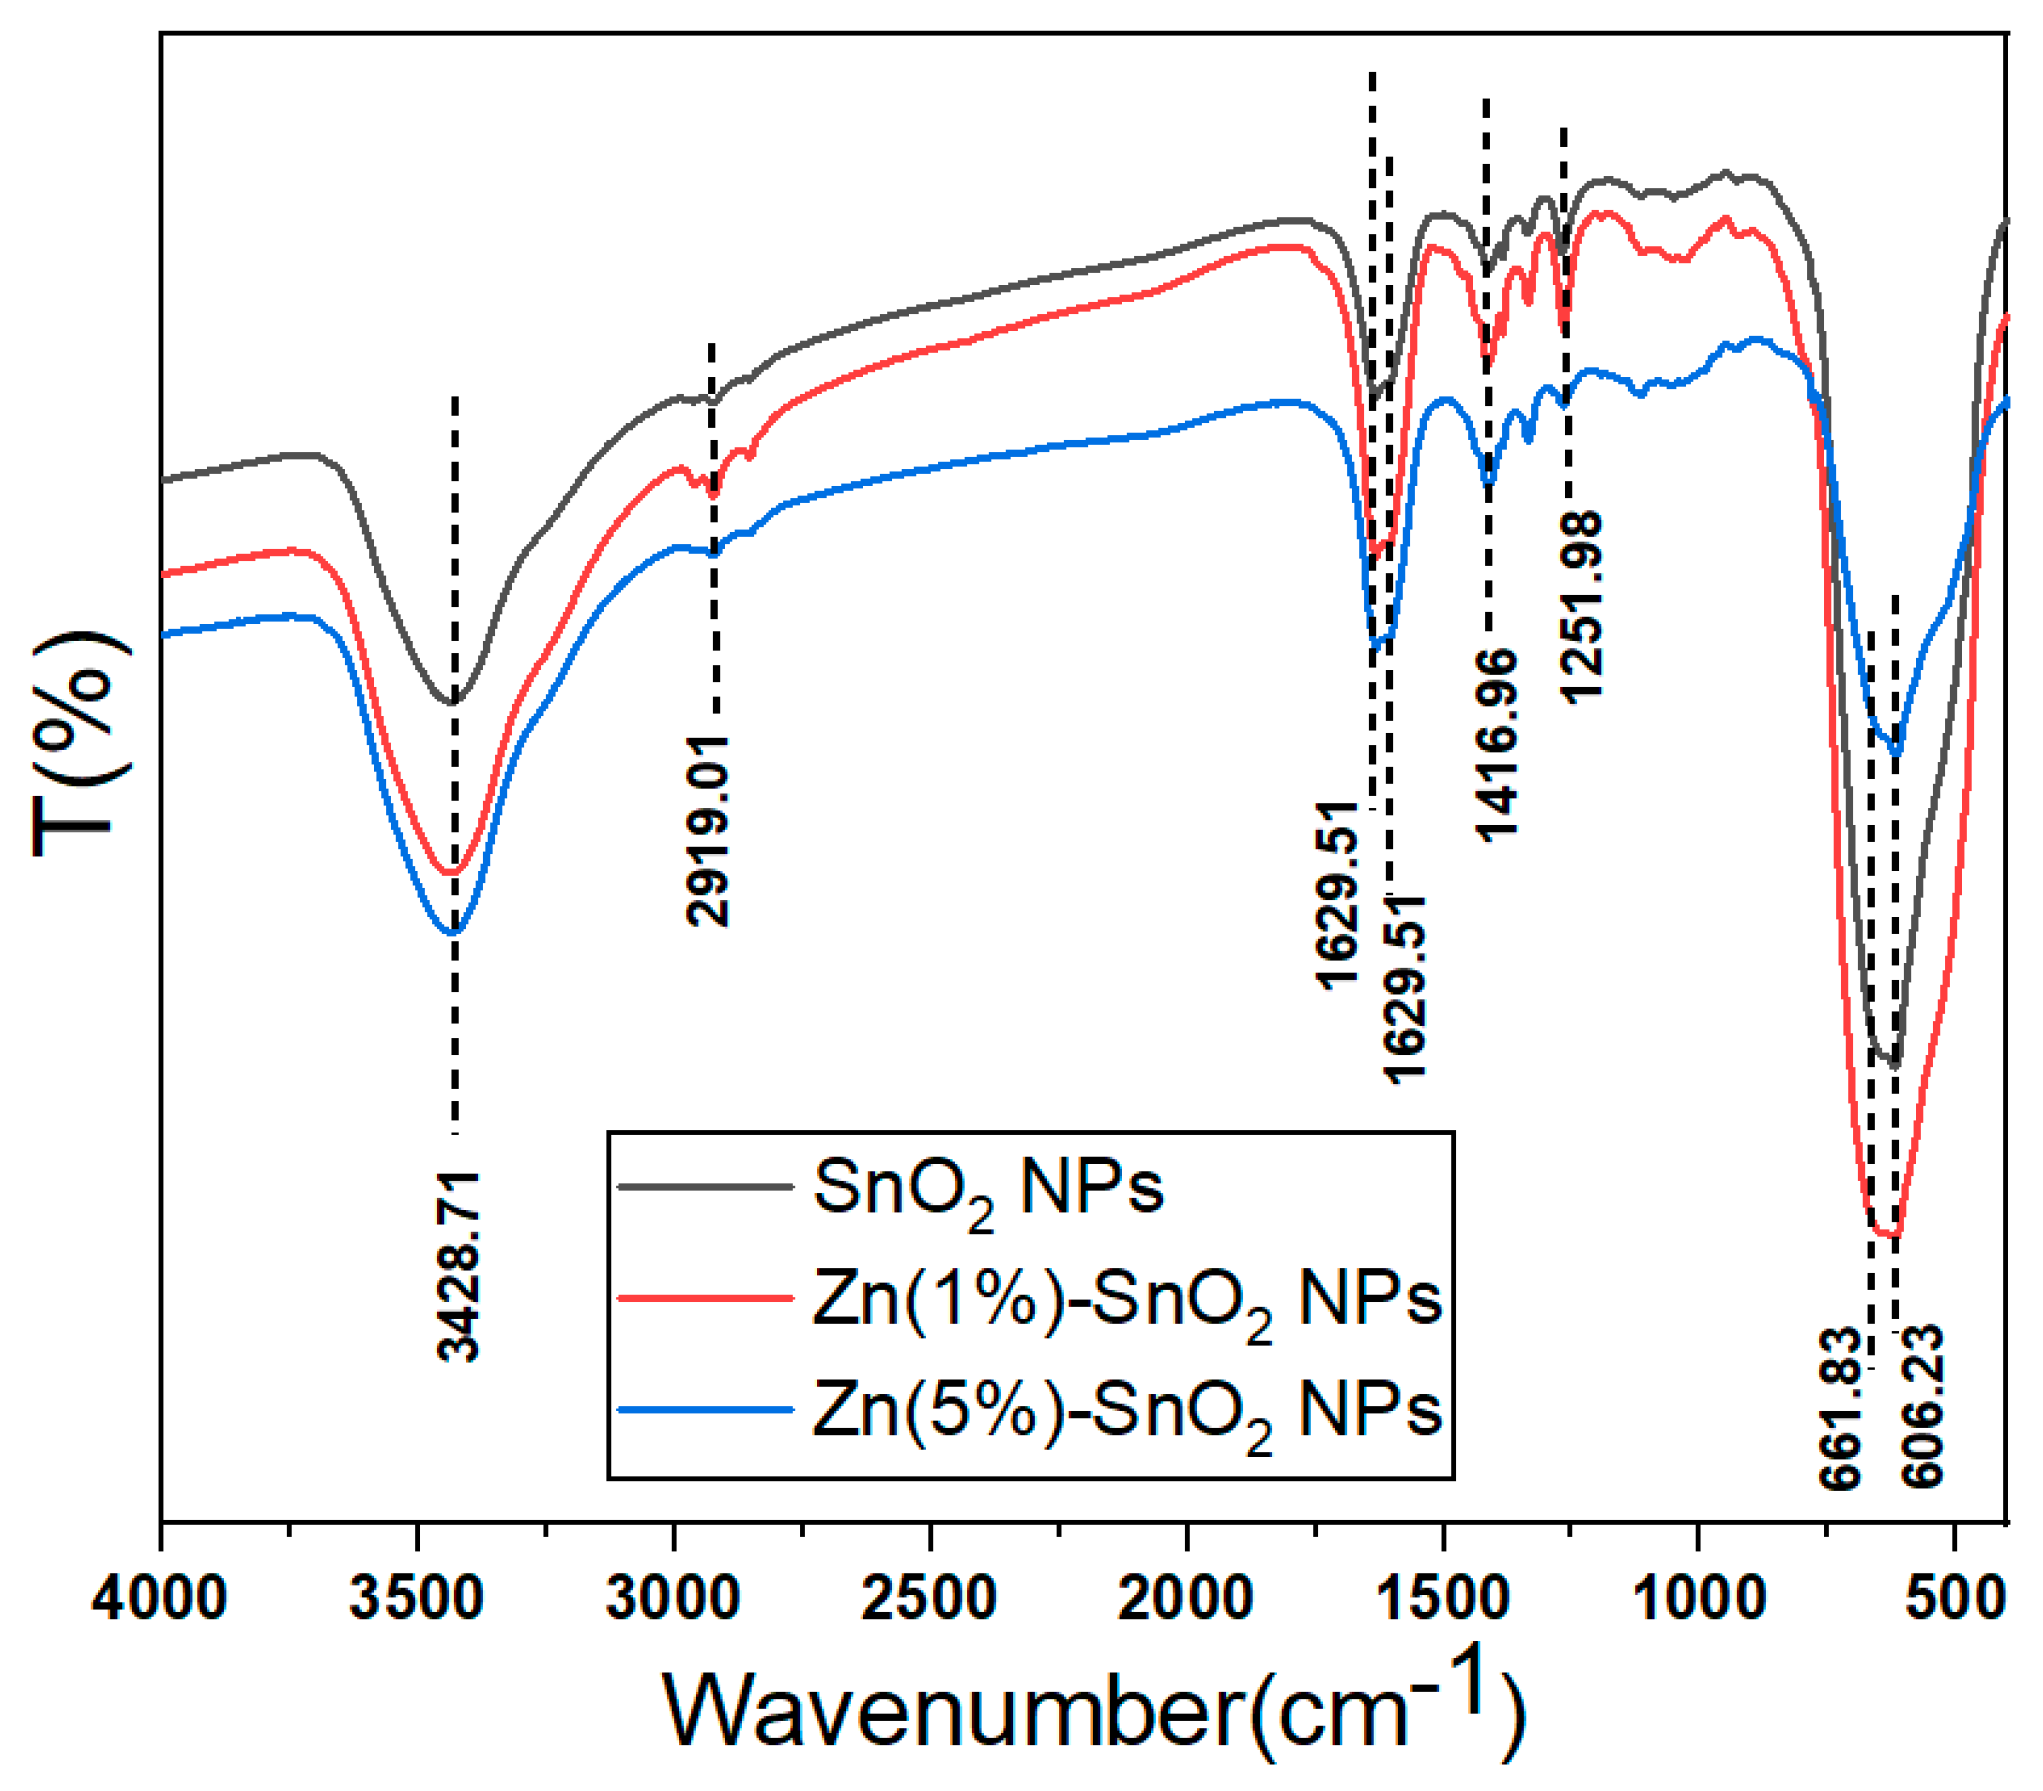
Figure 3A–C show the SEM images of pure SnO2 NPs and Zn-doped SnO2 NPs (1% and 5%). Furthermore, the EDX analysis of Zn-doped SnO2 NPs (5%) is presented in Figure 3D. SEM images (Figure 3A–C) showed that all synthesized samples were spherical in shape with uniform distribution. The results show that Zn-doped SnO2 NPs (1% and 5%) exhibited a morphology similar to pure SnO2 NPs. This indicates that the low concentration of Zn doping did not significantly alter the particle size or shape. Moreover, the prepared samples were found to have successfully passed an effective synthesis process because there was no agglomeration of NPs. Figure 3D shows that the EDX spectra of Zn-doped SnO2 NPs (5%) confirmed the existence of tin (Sn), oxygen (O), and zinc (Zn) elements. The percentages of these elements signaled good compatibility with the used proportions of elements in the synthesis process. The SEM and EDX results were excellent compared to those of previous studies [43,44].

3.4. FTIR Analysis

The FTIR spectra of pure SnO2 NPs and Zn-doped SnO2 NPs (1% and 5%) are shown in Figure 4. The presence of wide peaks ranging from 606.23 cm−1 to 661.83 cm−1 could be attributed to potential vibrations associated with Sn-O and O-Sn-O modes [33]. The presence of absorption peaks (1251.98 cm−1–1629.51 cm−1) could be attributed to the asymmetric and symmetric stretching of carboxyl groups (C–O). These peaks indicate that the adsorption of ambient CO2 onto the surface of the NPs occurred after it was removed from the furnace [40]. The absorption peak of all samples at approximately 3428.71 cm−1 showed that the hydroxyl groups (OH stretching mode) were produced from water molecules and adsorbed onto the surface of Zn-doped SnO2 NPs [41,42]. FTIR results were supported with XRD and TEM results (Figure 1 and Figure 2).

3.5. UV-Vis Analysis

The absorption spectra and bandgap energy (hv) of synthesized NPs are shown in Figure 5A,B. However, Figure 5A shows that the observed change in the absorption edge of the Zn-doped SnO2 NPs (1% and 5%) was linked to a higher wavelength compared to the pure SnO2 NPs. This phenomenon led to a decrease in the bandgap energy with the addition of Zn ions. Figure 5B displays the Tauc graphs from the plots of (αhυ)2 versus the photon energy (hυ) of the prepared NPs. Using Talc’s plot formula [45] (αhv = A (hν−Eg)n, where α, A, n, and Eg are the absorption coefficient, the energy-independent constant, the transition type, and the optical band gap (Eg)), the bandgap energies (hv) of synthesized NPs were calculated. Table 1 shows the band gap energies of SnO2 NPs (3.50 eV) and Zn-doped SnO2 NPs (1% and 5%) (3.42 eV and 3.34 eV). These band gap energies of theses NPs exhibited direct electronic transitions [46]. UV results showed that the Zn doping effects on the optical properties of SnO2 NPs due to the presence of stacking faults. Stacking faults are crystallographic defects or imperfections in the arrangement of atoms within a crystal lattice, as reported in a previous study [47].

3.6. PL Analysis

The crystalline quality and energy bands were examined using photoluminescence (PL) spectroscopy. Figure 6 shows the PL spectra emissions of pure SnO2 NPs and Zn-doped SnO2 NPs (1% and 5%) at room temperature at an excitation wavelength of 360 nm. Figure 6 reveals that all NPs showed the emission peaks at 433 nm, 456.13 nm, 504.37 nm, and 525.12 nm due to defect energy levels from oxygen vacancies and tin interstitials in the band gap of SnO2 NPs [22,31,48]. The results show that the emission peak intensity of SnO2 NPs decreased with increasing Zn doping. This effect indicates that the valance band electron recombination rate (electron holes) was reduced owing to oxygen vacancies [49,50,51]. PL analysis suggests that Zn-doped SnO2 NPs (1% and 5%) can be used in catalytic and biomedicine applications.

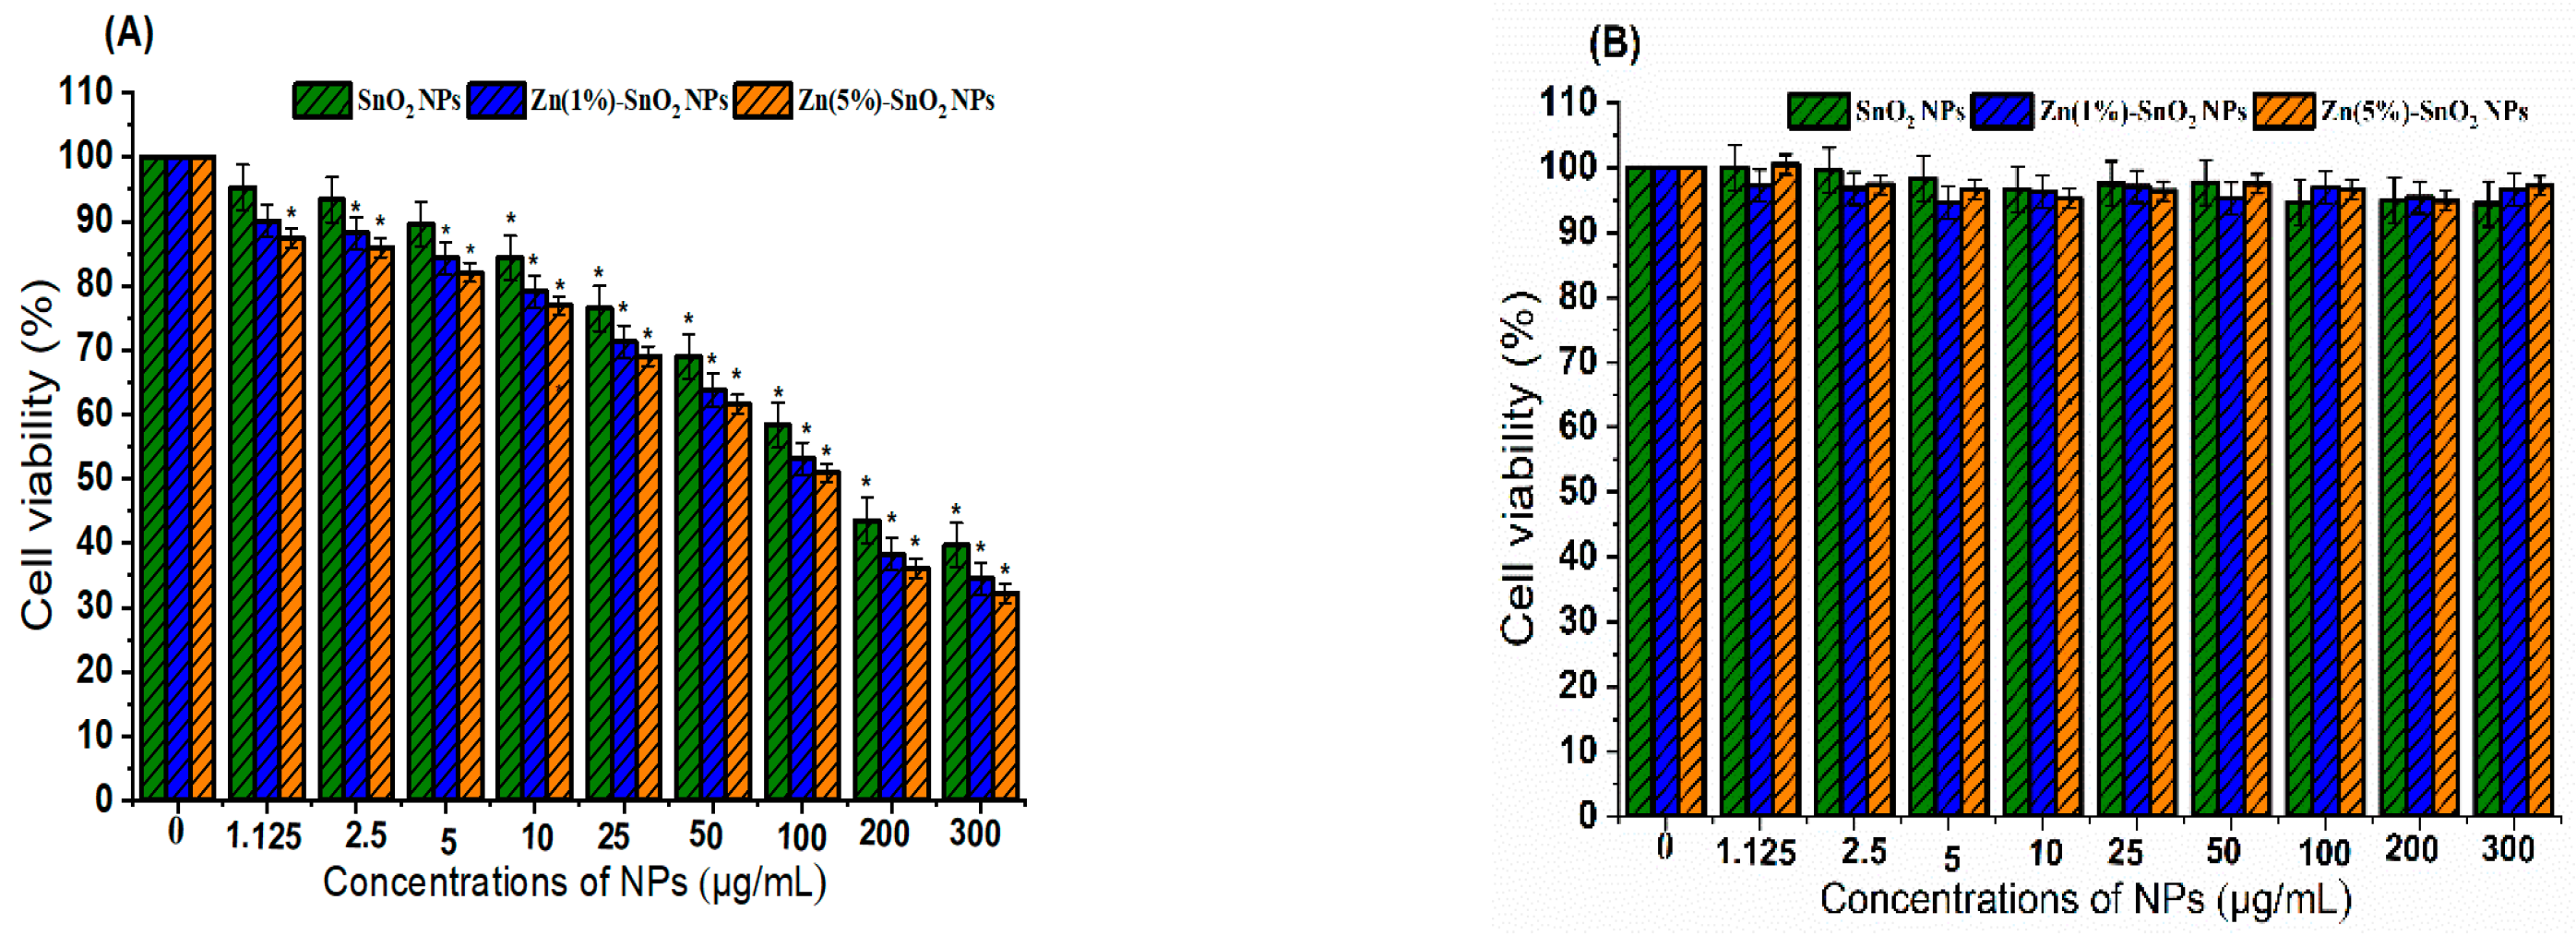
3.7. Anticancer and Biocompatibility Performance

Multiple studies have shown that the introduction of metal doping (e.g., Zn and Ag) into different metal oxide NPs exhibited increased cytotoxicity on human cells, as compared to pure metal oxide NPs. For example, Ahamed et al. [52] observed that Zn-doped TiO2 NPs induced cytotoxicity and oxidative stress in human breast (MCF-7) cancer cells, with the intensity of toxicity increasing following the increased concentration of Zn doping. In another instance, Mahjouri et al. [26] demonstrated that both SnO2 NPs and Ag-doped SnO2 NPs induced cytotoxicity and oxidative stress in tobacco cell cultures, with Ag doping playing a pivotal role in toxicity induction. Figure 7A illustrates the cell viability of MCF-7 cells following exposure to pure SnO2 NPs and Zn-doped SnO2 NPs (1% and 5%) for 24 h. At lower concentrations, prepared NPs did not affect the cell viability of MCF-7 cells. However, a significant decrease in cell viability was observed with increasing concentrations of NPs. These results reveal the potential dose-dependent cytotoxic effect of NPs on MCF-7 cells. Moreover, it was observed that Zn-doped SnO2 NPs (1% and 5%) had the most significant anticancer efficacy against MCF-7 cancer cell lines. This enhanced activity could be attributable to the synergistic effects of Zn doping on SnO2 NPs. In this context, Zn doping interacts with the SnO2 NPs, creating a synergistic effect. This interaction is likely to enhance the ability of NPs to inhibit the growth of MCF-7 cancer cells. Table 2 demonstrates the IC50 values of pure SnO2 NPs and Zn-doped SnO2 NPs (1% and 5%) of MCF-7 cancer cell lines.
Biocompatibility is an important aspect of anticancer materials. Our other results found that both pure and Zn-doped SnO2 NPs show good cytocompatibility when exposed to human umbilical vein endothelial cells (HUVECs) (Figure 7B).

4. Conclusions

In this study, we examine whether the anticancer efficacy of SnO2 NPs can be improved through Zn doping. Pure and Zn-doped SnO2 NPs (1% and 5%) were prepared using a modified sol–gel process and characterized by modern analytical tools. XRD data indicate that the crystallite size of SnO2 NPs increased with increasing levels of Zn doping. Structural characterization was further carried out by TEM, SEM, and EDX. The band gap energy of SnO2 NPs decreased with increasing dopant concentrations (3.5–3.34 eV). The PL study suggested that the recombination rate of electron holes was reduced with increasing levels of Zn doping. The biological results found that Zn doping improves the anticancer potential of SnO2 NPs against human breast cancer cells (MCF-7). Moreover, Zn-doped SnO2 NPs did not cause toxicity to human umbilical vein endothelial cells (HUVECs). This study warrants further research on the anticancer activity of Zn-doped SnO2 NPs in an appropriate in vivo model.

Author Contributions

Conceptualization, M.A.; Methodology, S.A., Z.M.A., R.L., N.M., A.A. and M.A.; Software, S.A., Z.M.A., R.L., N.M. and A.A.; Validation, Z.M.A., N.M., A.A. and M.A.; Formal analysis, S.A., Z.M.A., R.L., N.M., A.A. and M.A.; Investigation, S.A., Z.M.A., R.L., A.A. and M.A.; Resources, N.M. and M.A.; Data curation, M.A.; Writing—original draft, Z.M.A., R.L. and M.A.; Writing—review & editing, M.A. All authors have read and agreed to the published version of the manuscript.

Funding

Deputyship for Research and Innovation at the Ministry of Education in Saudi Arabia. IFP–IMSIU-2023059.

Institutional Review Board Statement

Not applicable.

Informed Consent Statement

Not applicable.

Data Availability Statement

The data presented in this study are available on request from the corresponding author. The data are not publicly available due to privacy.

Acknowledgments

The authors appreciate the Deputyship for Research and Innovation at the Ministry of Education in Saudi Arabia. This research was carried out through project number IFP–IMSIU-2023059. The authors also appreciate the Deanship of Scientific Research at Imam Mohammed Ibn Saud Islamic University (IMSIU) for their support and supervision in this project.

Conflicts of Interest

The authors declare no conflict of interest.

References

  1. Khan, I.; Saeed, K.; Khan, I. Nanoparticles: Properties, Applications and Toxicities. Arab. J. Chem. 2019, 12, 908–931. [Google Scholar] [CrossRef]
  2. Altammar, K.A. A Review on Nanoparticles: Characteristics, Synthesis, Applications, and Challenges. Front. Microbiol. 2023, 14, 1155622. [Google Scholar] [CrossRef] [PubMed]
  3. Skotland, T.; Iversen, T.G.; Sandvig, K. Development of Nanoparticles for Clinical Use. Nanomedicine 2014, 9, 1295–1299. [Google Scholar] [CrossRef]
  4. Malam, Y.; Lim, E.; Seifalian, A.M. Current Trends in the Application of Nanoparticles in Drug Delivery. Curr. Med. Chem. 2011, 18, 1067–1078. [Google Scholar] [CrossRef]
  5. Li, W.; Li, J.; Li, R.; Li, X.; Gao, J.; Hao, S.; Zhou, W. Study on Sodium Storage Properties of Manganese-doped Sodium Vanadium Phosphate Cathode Materials. Batter. Energy 2023, 2, 20220042. [Google Scholar] [CrossRef]
  6. Lin, S.; Du, W.; Tong, L.; Ji, T.; Jiao, X. Photocatalytic Degradation of 4-Chlorophenol by Gd-Doped β-Bi2O3 under Visible Light Irradiation. Chem. Res. Chin. Univ. 2019, 35, 120–124. [Google Scholar] [CrossRef]
  7. Huang, Z.; Zhu, J.; Hu, Y.; Zhu, Y.; Zhu, G.; Hu, L.; Zi, Y.; Huang, W. Tin Oxide (SnO2) Nanoparticles: Facile Fabrication, Characterization, and Application in UV Photodetectors. Nanomaterials 2022, 12, 632. [Google Scholar] [CrossRef]
  8. Jafari, S.; Mahyad, B.; Hashemzadeh, H.; Janfaza, S.; Gholikhani, T.; Tayebi, L. Biomedical Applications of TiO2 Nanostructures: Recent Advances. Int. J. Nanomed. 2020, 15, 3447–3470. [Google Scholar] [CrossRef] [PubMed]
  9. Sharker, S.M.; Kim, S.M.; Lee, J.E.; Choi, K.H.; Shin, G.; Lee, S.; Lee, K.D.; Jeong, J.H.; Lee, H.; Park, S.Y. Functionalized Biocompatible WO3 Nanoparticles for Triggered and Targeted In Vitro and In Vivo Photothermal Therapy. J. Control Release 2015, 217, 211–220. [Google Scholar] [CrossRef] [PubMed]
  10. Thamarai Selvi, E.; Meenakshi Sundar, S. Effect of Mn Doping on Structural, Optical and Magnetic Properties of SnO2 Nanoparticles by Solvothermal Processing. J. Mater. Sci. Mater. Electron. 2017, 28, 15021–15032. [Google Scholar] [CrossRef]
  11. Venugopal, B.; Nandan, B.; Ayyachamy, A.; Balaji, V.; Amirthapandian, S.; Panigrahi, B.K.; Paramasivam, T. Influence of Manganese Ions in the Band Gap of Tin Oxide Nanoparticles: Structure, Microstructure and Optical Studies. RSC Adv. 2014, 4, 6141–6150. [Google Scholar] [CrossRef]
  12. Duduman, C.N.; Pérez, M.I.B.; de Salazar, J.M.G.; Carcea, I.; Chicet, D.; Palamarciuc, I. Synthesis of SnO2 by Sol-Gel Method. Solid State Phenom. 2016, 254, 200–206. [Google Scholar] [CrossRef]
  13. Moghadam, L.N.; Karimabad, A.E.B.; Niasari, M.S.; Safardoust, H. Synthesis and Characterization of SnO2 Nanostructures Prepared by a Facile Precipitation Method. J. Nanostruct. 2015, 5, 47–53. [Google Scholar]
  14. Janardhan, E.; Reddy, M.M.; Reddy, P.V.; Reddy, M.J. Synthesis of SnO Nanopatricles—A Hydrothermal Approach. World J. Nano Sci. Eng. 2018, 8, 33–37. [Google Scholar] [CrossRef]
  15. Dadkhah, M.; Ansari, F.; Salavati-Niasari, M. Thermal Treatment Synthesis of SnO2 Nanoparticles and Investigation of Its Light Harvesting Application. Appl. Phys. A 2016, 122, 700. [Google Scholar] [CrossRef]
  16. Felcia, E.B.; Gnanam, K.D. Synthesis and Characterization of SnO2 Nanoparticle by Microwave Assisted Hydrothermal Method. J. Appl. Phys. 2017, 2278, 89–104. [Google Scholar] [CrossRef]
  17. Gopal, B.V.; Nandan, B.; Amirthapandian, S.; Panigrahi, B.K.; Thangadurai, P. Structural and Optical Studies of Mn Doped Tin Oxide Nanoparticles. In AIP Conference Proceedings, Proceedings of the National Conference on Physics and Chemistry of Materials: NCPCM2020, Indore, India, 14–16 December 2020; American Institute of Physics: College Park, MD, USA, 2021. [Google Scholar]
  18. Kar, A.; Patra, A. Optical and Electrical Properties of Eu3+-Doped SnO2 Nanocrystals. J. Phys. Chem. C 2009, 113, 4375–4380. [Google Scholar] [CrossRef]
  19. Espinosa, A.; Sánchez, N.; Sánchez-Marcos, J.; De Andrés, A.; Muñoz, M.C. Origin of the Magnetism in Undoped and Mn-Doped SnO 2 Thin Films: Sn vs Oxygen Vacancies. J. Phys. Chem. C 2011, 115, 24054–24060. [Google Scholar] [CrossRef]
  20. Supin, K.K.; George, A.; Kumar, Y. Ranjith Kumar, K.; Thejas, K.; Mandal, G.; Chanda, A.; Vasundhara, M. Structural, Optical and Magnetic Properties of Pure and 3d Metal Dopant-Incorporated SnO2 Nanoparticles. RSC Adv. 2022, 12, 26712–26726. [Google Scholar] [CrossRef]
  21. Divya, J.; Pramothkumar, A.; Hilary, H.J.L.; Jayanthi, P.; Prabakar, P.C.J. Impact of Copper (Cu) and Iron (Fe) Co-Doping on Structural, Optical, Magnetic and Electrical Properties of Tin Oxide (SnO2) Nanoparticles for Optoelectronics Applications. J. Mater. Sci. Mater. Electron. 2021, 32, 16775–16785. [Google Scholar] [CrossRef]
  22. Sharma, S.; Ritika; Singh, V.P.; Kumar, S.; Vohra, A. Sol-Gel Synthesis and Properties of Zinc Doped Tin Oxide (Zn-SnO2) Nanostructures. In AIP Conference Proceedings, Proceedings of the National Conference on Physics and Chemistry of Materials: NCPCM2020, Indore, India, 14–16 December 2020; American Institute of Physics: College Park, MD, USA, 2021. [Google Scholar]
  23. Ahamed, M.; Akhtar, M.J.; Khan, M.A.M.; Alhadlaq, H.A. Oxidative Stress Mediated Cytotoxicity of Tin (IV) Oxide (SnO2) Nanoparticles in Human Breast Cancer (MCF-7) Cells. Colloids Surf. B. Biointerfaces 2018, 172, 152–160. [Google Scholar] [CrossRef] [PubMed]
  24. Wang, Z.; Song, L.; Zhang, F.; Wang, D. Comparative Acute Toxicity and Oxidative Stress Responses in Three Aquatic Species Exposed to Stannic Oxide Nanoparticles and Stannic Chloride. Bull. Environ. Contam. Toxicol. 2020, 105, 841–846. [Google Scholar] [CrossRef] [PubMed]
  25. Guo, Y.; Zhao, Y.; Zhao, X.; Song, S.; Qian, B. Exploring the Anticancer Effects of Tin Oxide Nanoparticles Synthesized by Pulsed Laser Ablation Technique against Breast Cancer Cell Line through Downregulation of PI3K/AKT/MTOR Signaling Pathway. Arab. J. Chem. 2021, 14, 103212. [Google Scholar] [CrossRef]
  26. Mahjouri, S.; Kosari-Nasab, M.; Mohajel Kazemi, E.; Divband, B.; Movafeghi, A. Effect of Ag-Doping on Cytotoxicity of SnO2 Nanoparticles in Tobacco Cell Cultures. J. Hazard. Mater. 2020, 381, 121012. [Google Scholar] [CrossRef]
  27. Prasanth, M.I.; Muruganandam, G.; Ravichandran, K.; Jeyaleela, G.D.; Shanthaseelan, K.; Priyadharshini, B. Anticancer Activity of Tin Oxide and Cerium-Doped Tin Oxide Nanoparticles Synthesized from Ipomoea Carnea Flower Extract. Biomed. Biotechnol. Res. J. 2022, 6, 337–340. [Google Scholar] [CrossRef]
  28. Alaizeri, Z.M.; Alhadlaq, H.A.; Aldawood, S.; Akhtar, M.J.; Ahamed, M. One-Pot Synthesis of SnO2-RGO Nanocomposite for Enhanced Photocatalytic and Anticancer Activity. Polymers 2022, 14, 2036. [Google Scholar] [CrossRef]
  29. Winyayong, A.; Wongsaprom, K. Nanostructures of Tin Oxide by a Simple Chemical Route: Synthesis and Characterization. J. Phys. Conf. Ser. 2019, 1380, 012002. [Google Scholar] [CrossRef]
  30. Alaizeri, Z.M.; Alhadlaq, H.A.; Aldawood, S.; Akhtar, M.J.; Ahamed, M. Photodeposition Mediated Synthesis of Silver-Doped Indium Oxide Nanoparticles for Improved Photocatalytic and Anticancer Performance. Environ. Sci. Pollut. Res. Int. 2023, 30, 6055–6067. [Google Scholar] [CrossRef] [PubMed]
  31. Kumar, V.; Singh, K.; Sharma, J.; Kumar, A.; Vij, A.; Thakur, A. Zn-Doped SnO2 Nanostructures: Structural, Morphological and Spectroscopic Properties. J. Mater. Sci. Mater. Electron. 2017, 28, 18849–18856. [Google Scholar] [CrossRef]
  32. Minin, I.V.; Minin, O.V. Diffractional Optics of Millimetre Waves, 1st ed.; CRC Press: Boca Raton, FL, USA, 2004. [Google Scholar] [CrossRef]
  33. Sivakumar, S.; Manikandan, E. Novel Synthesis of Optical, Photoluminescence Properties and Supercapacitor Application on Zn2+ Doping Sn1-XZnxO2 Nanoparticles. Int. J. Sci. Res. Phys. Appl. Sci. 2018, 6, 1–13. [Google Scholar] [CrossRef]
  34. Enesca, A.; Andronic, L.; Duta, A. Optimization of Opto-Electrical and Photocatalytic Properties of SnO2 Thin Films Using Zn2+ and W6+ Dopant Ions. Catal. Lett. 2012, 142, 224–230. [Google Scholar] [CrossRef]
  35. Amutha, A.; Vigneswari, M.; Amirthapandian, S.; Panigrahi, B.K.; Thangadurai, P. Facile Synthesis and Characterization of Microstructure and Optical Properties of Pure and Zn Doped SnO2 Nanorods. J. Clust. Sci. 2021, 33, 1857–1863. [Google Scholar] [CrossRef]
  36. Baig, A.; Baig, A.; Rathinam, V.; Ramya, V. Facile Fabrication of Zn-Doped SnO2 Nanoparticles for Enhanced Photocatalytic Dye Degradation Performance under Visible Light Exposure. Adv. Compos. Hybrid Mater. 2021, 4, 114–126. [Google Scholar] [CrossRef]
  37. Yates, H.M.; Evans, P.; Sheel, D.W. The Influence of F-Doping in SnO2 Thin Films. Phys. Procedia 2013, 46, 159–166. [Google Scholar] [CrossRef]
  38. Jim, W.Y.; Liu, X.; Yiu, W.K.; Leung, Y.H.; Djurišić, A.B.; Chan, W.K.; Liao, C.; Shih, K.; Surya, C. The Effect of Different Dopants on the Performance of SnO2-Based Dye-Sensitized Solar Cells. Phys. Status Solidi Basic Res. 2015, 252, 553–557. [Google Scholar] [CrossRef]
  39. Suthakaran, S.; Dhanapandian, S.; Krishnakumar, N.; Ponpandian, N. Hydrothermal Synthesis of Surfactant Assisted Zn Doped SnO2 Nanoparticles with Enhanced Photocatalytic Performance and Energy Storage Performance. J. Phys. Chem. Solids 2020, 141, 109407. [Google Scholar] [CrossRef]
  40. Habte, A.G.; Hone, F.G.; Dejene, F.B. Zn Doping Effect on the Properties of SnO2 Nanostructure by Co-Precipitation Technique. Appl. Phys. A Mater. Sci. Process. 2019, 125, 402. [Google Scholar] [CrossRef]
  41. Tas Anli, S.; Ebeoglugil, M.F.; Celik, E. Effect of Dopant Elements on Structure and Morphology of SnO2 Nanoparticles. J. Aust. Ceram. Soc. 2020, 56, 403–411. [Google Scholar] [CrossRef]
  42. Yao, Q.; Xiao, F.; Lin, C.; Xiong, P.; Lai, W.; Zhang, J.; Xue, H.; Sun, X.; Wei, M.; Qian, Q.; et al. Regeneration of Spent Lithium Manganate into Cation-doped and Oxygen-deficient MnO2 Cathodes toward Ultralong Lifespan and Wide-temperature-tolerant Aqueous Zn-ion Batteries. Batter. Energy 2023, 2, 20220065. [Google Scholar] [CrossRef]
  43. Salah, N.; Habib, S.; Azam, A. The Influence of Transition Metal Doping on the Thermoelectric and Magnetic Properties of Microwave Synthesized SnO2 Nanoparticles. J. Mater. Sci. Mater. Electron. 2017, 28, 435–445. [Google Scholar] [CrossRef]
  44. Ahmed, A.; Tripathi, P.; Naseem Siddique, M.; Ali, T. Microstructural, Optical and Dielectric Properties of Al-Incorporated SnO2 Nanoparticles. IOP Conf. Ser. Mater. Sci. Eng. 2017, 225, 012173. [Google Scholar] [CrossRef]
  45. Davis, E.A.; Mott, N.F. Conduction in Non-Crystalline Systems V. Conductivity, Optical Absorption and Photoconductivity in Amorphous Semiconductors. Philos. Mag. 1970, 22, 903–922. [Google Scholar] [CrossRef]
  46. Chen, X.; Huang, B.; Zhang, C.; Li, P.; Wang, P. Tunable SnO2 Nanoribbon by Electric Fields and Hydrogen Passivation. J. Nanomater. 2017, 2017, 1–12. [Google Scholar] [CrossRef]
  47. Singh, P.; Kaur, G.; Singh, K.; Singh, B.; Kaur, M.; Kaur, M.; Krishnan, U.; Kumar, M.; Bala, R.; Kumar, A. Specially Designed B4C/SnO2 Nanocomposite for Photocatalysis: Traditional Ceramic with Unique Properties. Appl. Nanosci. 2018, 8, 1–9. [Google Scholar] [CrossRef]
  48. Veerasubam, R.; Muthukumaran, S. Tuning of Energy Gap, Structural, FTIR and Photoluminescence Examination of Ni, Sn Dual Doped ZnO Nanoparticles. Mater. Res. Express 2019, 6, 045006. [Google Scholar] [CrossRef]
  49. Wang, H.; Qi, J.; Yang, N.; Cui, W.; Wang, J.; Li, Q.; Zhang, Q.; Yu, X.; Gu, L.; Li, J.; et al. Dual-Defects Adjusted Crystal-Field Splitting of LaCo1−xNixO3−δ Hollow Multishelled Structures for Efficient Oxygen Evolution. Angew. Chem. Int. Ed. 2020, 59, 19691–19695. [Google Scholar] [CrossRef]
  50. Wang, Q.; Zhang, L.; Guo, Y.; Shen, M.; Wang, M.; Li, B.; Shi, J. Multifunctional 2D Porous G-C3N4 Nanosheets Hybridized with 3D Hierarchical TiO2 Microflowers for Selective Dye Adsorption, Antibiotic Degradation and CO2 Reduction. Chem. Eng. J. 2020, 396, 125347. [Google Scholar] [CrossRef]
  51. Zhou, G.; Xiong, S.; Wu, X.; Liu, L.Z.; Li, T.; Chu, P.K. N-Doped SnO2 Nanocrystals with Green Emission Dependent upon Mutual Effects of Nitrogen Dopant and Oxygen Vacancy. Acta Mater. 2013, 61, 7342–7347. [Google Scholar] [CrossRef]
  52. Ahamed, M.; Khan, M.A.M.; Akhtar, M.J.; Alhadlaq, H.A.; Alshamsan, A. Role of Zn Doping in Oxidative Stress Mediated Cytotoxicity of TiO2 Nanoparticles in Human Breast Cancer MCF-7 Cells. Sci. Rep. 2016, 6, 30196. [Google Scholar] [CrossRef]
Scheme 1. The synthesis procedures of Zn-doped SnO2 NPs.
Applsci 13 12456 sch001
Figure 1. XRD spectra of pure SnO2 NPs and Zn-doped SnO2 NPs (1% and 5%) (A). The high resolution of XRD spectra for (110) peak of pure SnO2 NPs and Zn-doped SnO2 NPs (1% and 5%) (B).
Applsci 13 12456 g001
Figure 2. TEM images, HR-TEM images, and histogram distribution of the particle sizes of pure SnO2 NPs (A,D,G), Zn-doped SnO2 NPs (1%) (B,E,H), and Zn-doped SnO2 NPs (5%) (C,F,I).
Applsci 13 12456 g002
Figure 3. SEM micrographs of pure SnO2 NPs (A), Zn-doped SnO2 NPs (1%) (B), Zn-doped SnO2 NPs (5%) (C), and EDX spectra of Zn-doped SnO2 NPs (5%) (D).
Applsci 13 12456 g003
Figure 4. FTIR spectra of pure SnO2 NPs and Zn-doped SnO2 NPs.
Applsci 13 12456 g004
Figure 5. UV-vis spectra of pure SnO2 NPs and Zn-doped SnO2 NPs (1% and 5%) (A). Band gap evaluation from the plots of (αhυ)2 versus photon energy (hυ) of pure SnO2 NPs and Zn-doped SnO2 NPs (1% and 5%) (B).
Applsci 13 12456 g005
Figure 6. PL emission spectra of pure SnO2 NPs and Zn-doped SnO2 NPs (1% and 5%).
Applsci 13 12456 g006
Figure 7. Cell viability based on the MTT assay on MCF-7 cells exposed to NPs at concentrations (0–300) for 24 h (A), based on the biocompatibility of prepared NPs in human umbilical vein endothelial cells (HUVECs) (B). * indicates significant differences in treated cells with respect to controls.
Applsci 13 12456 g007
Table 1. Structural and optical characteristics of NPs.
Synthesized NPsXRD (nm)SEM (nm)TEM (nm)Bandgap (eV)
Pure SnO2 NPs21.720.1815.253.50
Zn(1%)-SnO2 NPs24.526.5625.923.42
Zn(5%)-SnO2 NPs26.228.1526.633.34
Table 2. IC50 ± SD values of prepared samples in MCF-7 cancer cell lines.
Synthesized NPsMCF-7 Cancer Cells
SnO2 NPs184.69 ± 0.05
Zn (1%)-SnO2 NPs111.68 ± 0.12
Zn (5%)-SnO2 NPs90.74 ± 0.09
Disclaimer/Publisher’s Note: The statements, opinions and data contained in all publications are solely those of the individual author(s) and contributor(s) and not of MDPI and/or the editor(s). MDPI and/or the editor(s) disclaim responsibility for any injury to people or property resulting from any ideas, methods, instructions or products referred to in the content.

