Abstract
This paper focuses on a 1000 MW Francis turbine and conducts a numerical analysis of the entire flow passage using computational fluid dynamics (CFD) under steady-state conditions. Building upon prior research, we further investigate the impact of an uneven gap distribution caused by radial co-directional installation deviations of 0.1 mm, 0.3 mm, 0.5 mm, 1.5 mm, and 2.5 mm on the pressures and radial forces at various locations of the turbine, including the upper crown chamber, the vaneless zone, and the bottom ring chamber, all under steady-state rated operating conditions. By examining the maximum and minimum pressure values under different conditions, we determined that different pressure reading methods should be applied to distinct surfaces. Additionally, we derived the patterns illustrating how different components are affected by radial installation deviations. The significance of this study lies in its comprehensive exploration of the influence of radial installation deviations on the performance of a Francis turbine, particularly under steady-state rated conditions. Through numerical analysis, we elucidated the specific effects of various deviation magnitudes on the pressures and radial forces at different turbine locations. These findings provide valuable insights for the optimization of turbine design and operation. The novelty of this work stems from its in-depth investigation of radial co-directional installation deviations and the extensive results obtained through numerical simulations. These results hold significant implications for improving turbine performance and reliability, surpassing previous efforts in the literature.
1. Introduction
In recent years, the increasing capacity and size of large Francis turbines have given rise to a variety of operational challenges. These challenges include significant vibration and blade cracks observed in various turbine installations. Notably, the vibration, resonance, and noticeable noise resulting from high partial load pressure pulsations directly endanger the secure operation of power stations. Consequently, these issues have garnered substantial attention from power station operators and manufacturing industries alike as indicated by numerous studies (e.g., [,]). The primary root cause of these challenges can be attributed to clearances within the fluid domain, with installation deviations being a significant factor.
The gap between the turbine runner that connects the vaneless zone to both the crown chamber and the bottom ring chamber plays a pivotal role in shaping the hydraulic characteristics of the vaneless zone. This connection has a profound impact on the hydraulic behaviors of the crown chamber and the bottom ring chamber ([]). Variations in installation deviations result in changes in clearance dimensions, subsequently influencing the flow characteristics near the turbine runner ([]). These alterations in flow patterns around the runner can lead to fluctuations in power output, increased structural vibrations, and fatigue failure. Collectively, these factors pose substantial risks to the safe and stable operation of power stations ([]).
Zhou et al. [] conducted systematic investigations into turbine leakage and cavity pressure while varying seal clearance sizes and drain hole parameters. Their research provided valuable insights for determining seal clearance sizing and drain hole parameters. The work by Shao et al. [] delved into the structural vibration characteristics stemming from uneven clearances in the labyrinth ring of the turbine runner. Their research highlights the significant influence of uneven clearance distribution on the overall unit’s vibration. Feng et al. [,] demonstrated that, under optimal unit speed conditions and accounting for disc loss, numerical simulations yielded turbine efficiency results consistent with model test outcomes. However, they observed that under non-optimal working conditions, the flow field exhibited numerous vortices and shedding phenomena, resulting in numerical simulation efficiency values falling below those observed in model tests.
Fundamentally, the uneven flow within the clearance affects the runner and other components in two main ways: axial and radial forces. Axial forces in hydraulic machinery encompass several components, such as the rotating part’s mass, water buoyancy on the runner, forces acting on the blades during hydraulic machinery operation, hydrostatic forces at the shaft end, and axial forces due to water pressure in the crown chamber and bottom ring chamber ([]). On the other hand, radial water thrust can be categorized as frequency radial forces and other radial forces. Frequency radial forces stem from imbalances in the runner’s mass, uneven water distribution within the runner’s inner cavity, inconsistencies in blade profiles and installation angles, and dynamic blade deformations ([]). These frequency radial forces primarily contribute to partial shaft wear and uniform bearing bush wear. Additionally, there are other factors, such as radial forces with fixed directions due to inlet and outlet flow asymmetry, resulting in uniform shaft wear and partial bearing bush wear.
Regarding the study of axial forces, Wang et al. [] challenged the conventional assumption that the water flow rotation speed is half of the runner speed when calculating axial water thrust, offering alternative approaches. You et al. [] developed a mathematical model for predicting axial forces in pump turbines, providing insights into their characteristics. Furthermore, Anderson [], Zhou et al. [] and Weidong Shi [] all endorsed the use of computational fluid dynamics (CFD) technology for assessing axial force characteristics. Shi et al. [] emphasized that axial forces on the runner’s inner surface significantly contribute to hydraulic mechanical axial forces, a finding echoed by Zhou et al. []. The latter concluded that hydraulic design mitigates axial forces on the runner’s inner surface, primarily by balancing pressure differences between the runner’s front and rear cover plates. Balancing axial forces typically involves methods like adding balance holes, a strategy supported by Pehlivan et al. []. Additionally, alternative approaches include balance tubes [], balance holes, and balance tube combinations [,], as well as balance plates or drums [,,].
Concerning radial force research, Wu et al. [], using computational fluid dynamics (CFD) (a method) software ANSYS CFX5., simulated various working conditions before and after optimization. Adkins et al. [,] identified significant deviations in the radial force of centrifugal pump runners compared to design conditions. They concluded that elevated radial forces, along with intense pressure pulsations and fluctuations, exert larger and less stable dynamic unbalanced forces on the volute and rotor system, leading to increased pump vibrations. Strategies to mitigate radial forces, as outlined in various papers (e.g., [,,]), include techniques such as employing double volutes, optimizing guide vane and vortex chamber designs, and implementing a staggered arrangement of adjacent stages of spiral water pressure chambers by 180 degrees. Additionally, due to water viscosity, it is crucial to consider the presence of fluid with speeds close to that of the runner within the clearance, challenging the conventional practice of exclusively focusing on the runner’s speed ([]).
The comprehensive analysis of the above studies [,] makes it clear that there has already been a certain scale of research on the clearances between water turbines. However, research on uneven clearances caused by practical installation and other issues is relatively lacking. This article, based on [] and [], makes changes to the calculation boundary conditions and further processes the calculation results. It calculates the radial deviations of 0.1 mm, 0.3 mm, 0.5 mm, 1.5 mm, and 2.5 mm under rated operating conditions and plots line graphs of pressure and radial force. It provides a more detailed analysis of the pressure and radial force distribution characteristics in the upper crown, bladeless area, and lower ring under various operating conditions under steady-state conditions.
2. Research Object and Methodology
The studied 1000 MW Francis turbine and its unit layout are depicted in Figure 1, and Table 1 lists the parameters of the unit.
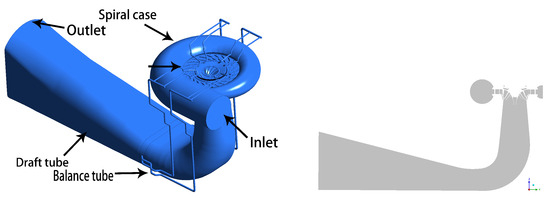
Figure 1.
The flow channel of the 1000 MW Francis turbine (left) and a cross-sectional view (right).

Table 1.
The parameters of the 1000 MW Francis turbine unit.
To analyze the flow characteristics, we constructed a three-dimensional model encompassing the entire flow channel of the unit (Figure 2), which was then subjected to meshing. The boundary conditions were established based on measured data, and we conducted flow calculations for the runner to evaluate the impact of radial deviation clearances on the turbine unit’s flow characteristics.
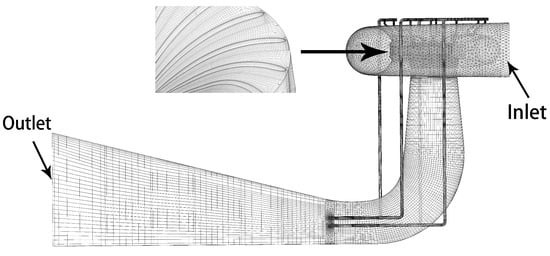
Figure 2.
Mesh of the entire flow domains.
To ensure clarity for subsequent understanding, an explanation is provided here. For reasons of confidentiality and other considerations, certain calculation data were subjected to correlation or normalization processing. The formulas for this are organized as follows:
where represents the normalized or relativized calculation results, represents the computed simulated experimental data, and represents the data obtained from actual engineering.
To ascertain mesh independence, we generated meshes for the entire flow domains in Figure 3 while applying the boundary conditions corresponding to rated working conditions. As indicated in Table 2, there was no significant difference in efficiency between the two cases. Consequently, we chose to utilize the mesh with 5 million elements for subsequent calculations to reduce the computation time. For a more comprehensive validation of grid independence and parameter comparison, we refer readers to another article [] authored by our team, which specifically validates grid numbers under unbiased ideal conditions. The radial deviation grid examined in this article is built upon this foundation, ensuring that the total number of deviation grids, after adjustment, closely aligns with the total number of grids in the unbiased ideal model.
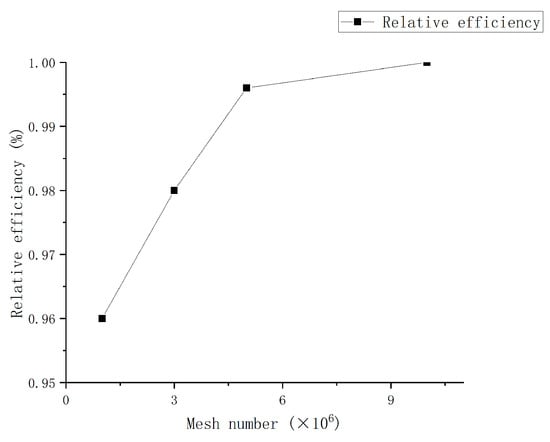
Figure 3.
Mesh independence test.
Table 2.
Mesh independence test.
The element counts in each flow domain for the 5 million element mesh are detailed in Table 3.
Table 3.
Number of elements in the flow domains.
For the numerical simulations, we utilized the Reynolds time-averaging (RANS) Equation (4), which are built upon the Navier–Stokes (N-S) Equations (2) and (3). Our chosen turbulence model was the SST k– turbulence model, described by Equation (5). Using the finite volume method, we discretized and solved the three-dimensional flow domains of the unit to obtain the turbulent flow field within it:
In the equations, the variables are defined as follows: (with n representing i, j, k in Cartesian coordinates) for the three velocity direction components, for the coordinates, for the body force, for the dynamic viscosity, t for the time, p for the pressure, and for the water density. To close the equation system, the RANS equations introduce a new variable, Reynolds stress, which links the Reynolds stress to the turbulent mean values:
where k, , and represent the turbulent kinetic energy, the turbulent frequency and the turbulence scale, respectively. P is the turbulence generation term, denotes the turbulent viscosity coefficient, is the production term coefficient, is a mixing function, and , and are the empirical coefficients.
In order to create the model with radial deviations, we made adjustments to the crown chamber, bottom ring chamber, and vaneless space models based on the ideal model (Figure 4). Specifically, we displaced the runner in the negative Y-axis direction by increments of 0.1 mm, 0.3 mm, 0.5 mm, 1.5 mm, and 2.5 mm, respectively. The mesh we employed is structured and consists of approximately 830,000 elements (Figure 5).
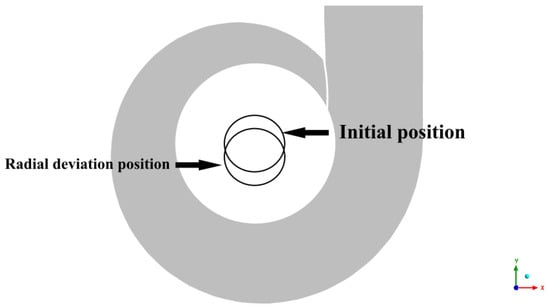
Figure 4.
Radial installation deviation indication.
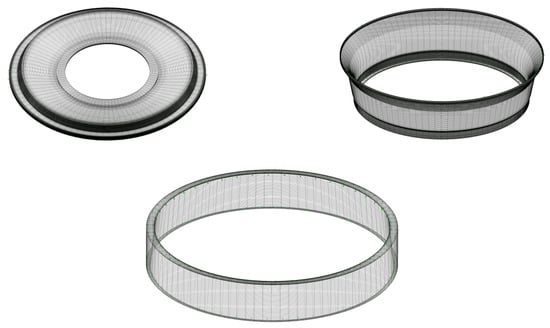
Figure 5.
The radial installation deviation mesh of the upper crown chamber (top-left), the bottom ring chamber (top-right) and the vaneless zone (bottom).
3. Calculation Setup and Results Analysis
3.1. Steady-State Calculation
The inlet and outlet boundary conditions were set as follows, in accordance with []:
- Computational fluid dynamics (CFD) simulations were conducted using a mesh comprising five million elements by using ANSYS. Mesh independence verification had been previously performed, and the subsequent deviation model made adjustments to the clearance mesh division and size based on this foundation.
- Because in the actual operation of the unit, only pressure data can be obtained, the pressure measurement data obtained during the operation of the unit are directly used here, that is, pressure–pressure conditions: inlet, 2459 kPa; outlet, 480 kPa. Due to practical engineering constraints, the inlet boundary was set as the total pressure conditions, while the outlet was set as the static pressure conditions.
- As in the prior literature, owing to the immense size of the turbine unit and the small clearance dimensions, achieving convergence in calculations posed challenges compared to earlier units. Therefore, a time step of 2000 steps and a convergence criterion of 10 were employed. Similar to previous studies, wall velocity was included in this analysis, and its validity has also been explained in the literature.
Pressure Distribution
In this section, we take into account the influence of wall velocity on the upper crown, vaneless zone, and lower ring. Thus, it was decided to separately record both the total pressure and static pressure to further assess the impact of the wall velocity. However, prior to this, it is necessary to consider whether the influence of deviations on other components can be neglected.
From Figure 6, it can be seen that under these five deviations, the pressure distribution in the runner, vaneless zone, and spiral casing is hardly changed. This further illustrates that the impact of radial deviations is limited to the vicinity of where the deviations occur. Therefore, in the subsequent analysis, only these localized components will be analyzed, and not the entire turbine unit.
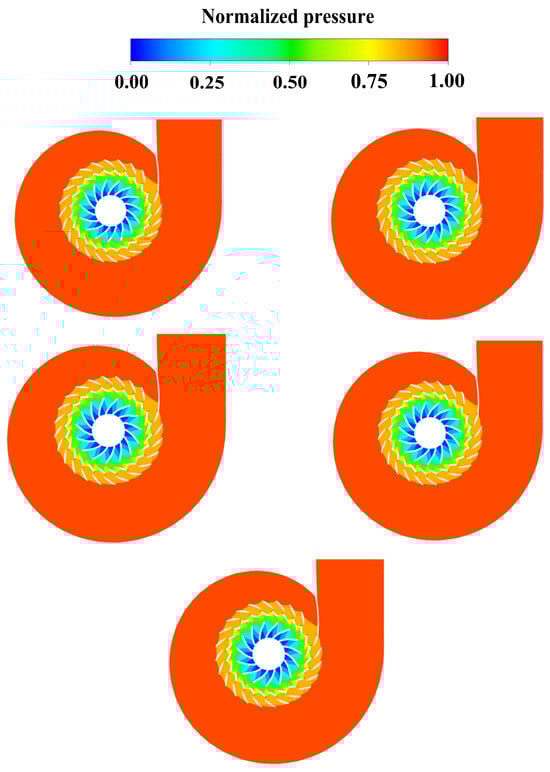
Figure 6.
Cross-sectional full-channel pressure distribution in the XOY plane: 0.1 mm (top-left), 0.3 mm (top-right), 0.5 mm (middle-left), 1.5 mm (middle-right), 2.5 mm (bottom).
Furthermore, in terms of hydraulic performance, we extracted the hydraulic efficiency under five different deviations and compared it with data obtained from physical measurements (Figure 7). It is evident that deviations have little influence on the overall performance of the unit. Consequently, as previously mentioned, our subsequent analysis will concentrate on the regions affected by deviations.
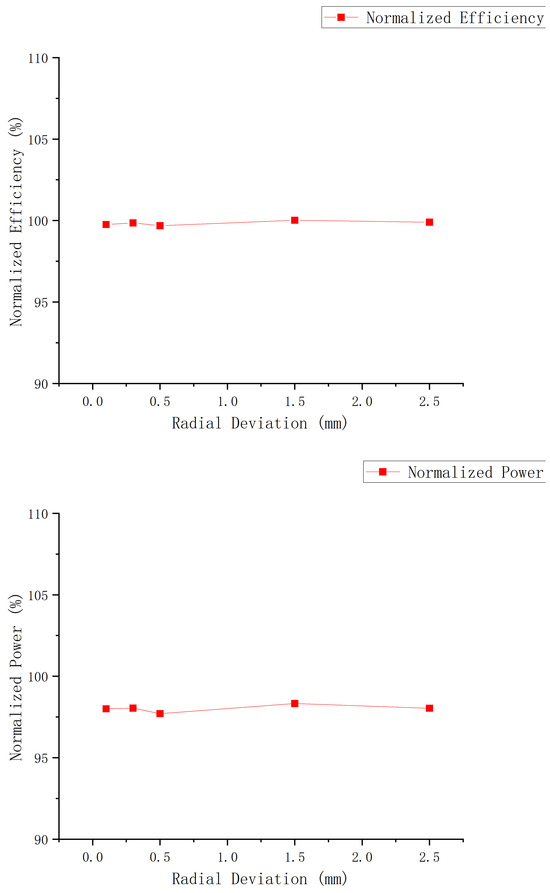
Figure 7.
Hydro efficiency (top) vs. output (bottom) comparison chart.
Static pressure distribution on the outer surface of the upper crown cavity was extracted for analysis as shown in Figure 8.
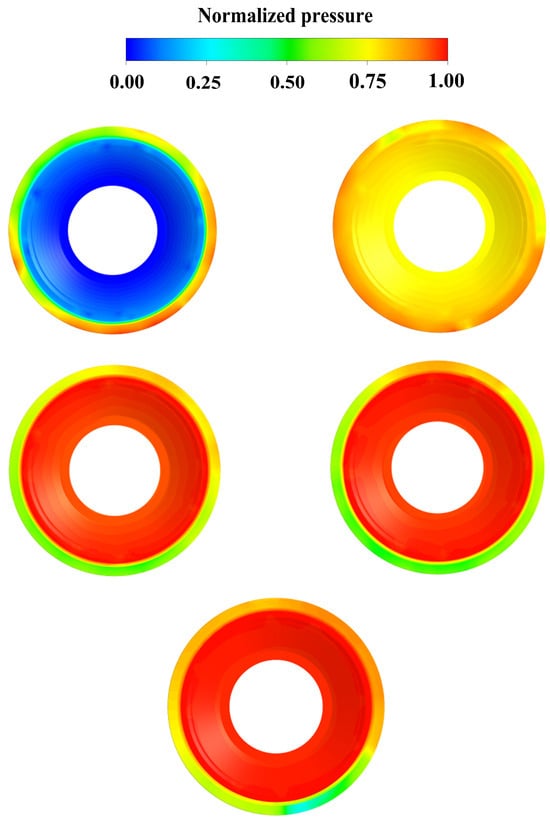
Figure 8.
Radial deviation-induced static pressure distribution on the upper crown chamber outer surface of the runner at different levels, 0.1 mm (top-left), 0.3 mm (top-right), 0.5 mm (middle-left), 1.5 mm (middle-right), 2.5 mm (bottom).
Total pressure distribution on the outer surface of the upper crown cavity was extracted for analysis as shown in Figure 9.
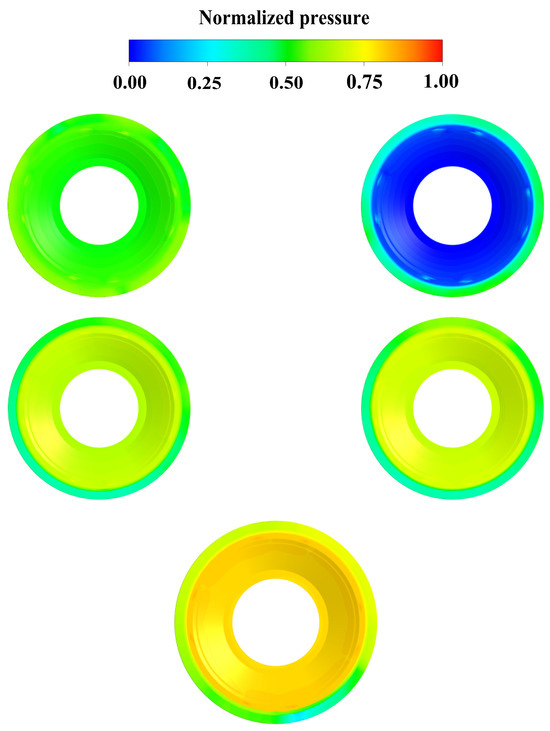
Figure 9.
Radial deviation-induced total pressure distribution on the upper crown chamber outer surface of the runner at different levels, 0.1 mm (top-left), 0.3 mm (top-right), 0.5 mm (middle-left), 1.5 mm (middle-right), 2.5 mm (bottom).
Drawing from Figure 8 and Figure 9, it is evident that, regardless of whether dynamic pressure is considered, a common trend emerges—as the clearance increases, there is a transition from pressure rise to pressure drop occurring at the location with the most significant clearance variation. This implies that when the deviation is less than 0.5 mm, reducing the clearance leads to increased pressure at that point. However, beyond 0.5 mm, due to the extremely small clearance size, fluid ingress becomes difficult, resulting in a shift towards lower pressure. This effect is particularly pronounced in the case of a 2.5 mm deviation.
In contrast to static pressure, total pressure accounts for dynamic pressure effects. Consequently, we observe that the impact arising from circumferential non-uniformity in the clearance is significantly mitigated. Differences in total pressure distributions among the five deviation values are only discernible at the location with the smallest clearance. This clarifies why deviations have minimal overall effects on the pressure distribution and hydraulic performance of the unit.
Proceed by examining the static pressure distribution on the inner surface of the upper crown cavity in Figure 10.
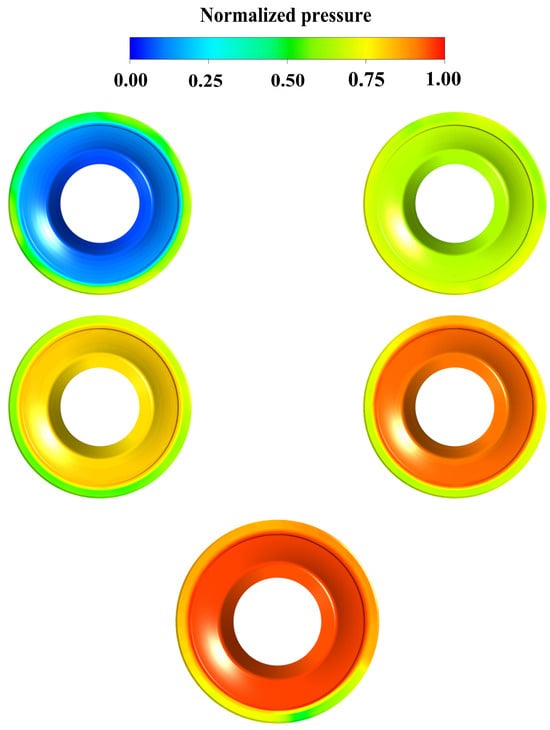
Figure 10.
Radial deviation-induced static pressure distribution on the upper crown chamber inner surface of the runner at different levels, 0.1 mm (top-left), 0.3 mm (top-right), 0.5 mm (middle-left), 1.5 mm (middle-right), 2.5 mm (bottom).
Proceed by examining the total pressure distribution on the inner surface of the upper crown cavity in Figure 11.
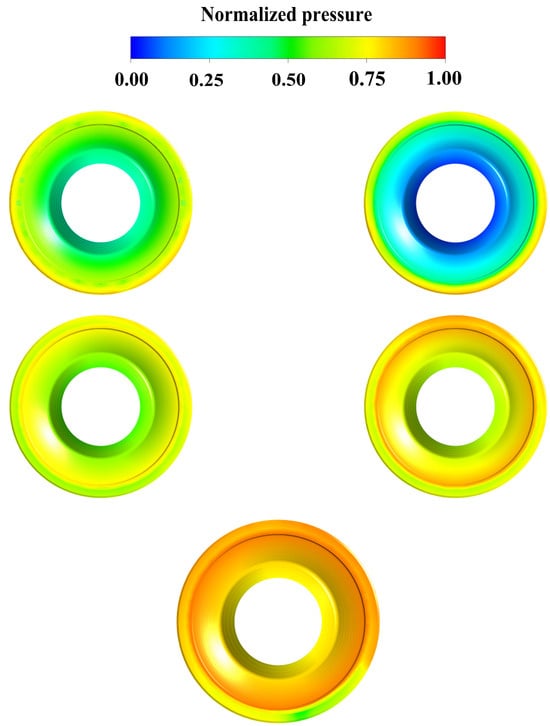
Figure 11.
Radial deviation-induced total pressure distribution on the upper crown chamber inner surface of the runner at different levels, 0.1 mm (top-left), 0.3 mm (top-right), 0.5 mm (middle-left), 1.5 mm (middle-right), 2.5 mm (bottom).
Combining the static pressure and total pressure distributions from Figure 10 and Figure 11, it can be observed that, in terms of the overall pressure distribution, whether it is on the inner surface or the outer surface, whether it is static pressure or total pressure, the pressure distribution characteristics are nearly identical: they exhibit distinct features at the maximum and minimum points within the clearance compared to other areas. For the outer surface, static pressure better reflects its characteristics. It shows that, before 0.5 mm, a reduction in clearance leads to the generation of a high-pressure zone, while after 0.5 mm, due to the extremely narrow clearance, it transitions into a low-pressure zone. This aligns with the results of []. Meanwhile, the total pressure also exhibits similar features but is less pronounced than static pressure. On the other hand, for the inner surface, due to the application of wall velocity, the pressure distribution is more evident under total pressure conditions. This better illustrates the pressure distribution, and it is also noticeable how the pressure changes significantly as the fluid passes through the sealing area before and after.
Regarding the lower ring section, since the distribution patterns on the inner and outer surfaces align with those of the upper crown, we focus our analysis solely on the inner surface.
As for the pressure distribution in the bottom ring chamber, it is illustrated in Figure 12. Upon comparing the five radial deviations, it becomes evident that there is no significant alteration in their pressure distribution. The only notable difference is observed in the low-pressure region at the minimum clearance, where the pressure is slightly higher than at the maximum clearance. This discrepancy arises because the clearance in the bottom ring chamber is approximately 0.2 mm smaller than that in the upper crown chamber. Consequently, the bottom ring chamber does not exhibit a transition from a high-pressure region to a low-pressure region as seen in the upper crown chamber at its minimum clearance.
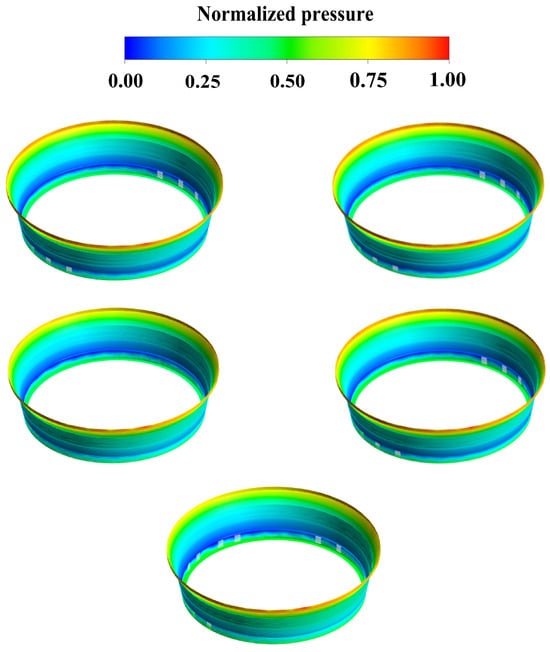
Figure 12.
Radial deviation-induced static pressure distribution on the bottom ring chamber of the runner at different levels, 0.1 mm (top-left), 0.3 mm (top-right), 0.5 mm (middle-left), 1.5 mm (middle-right), 2.5 mm (bottom).
Moving forward, we analyze the numerical values of pressure and radial forces for components under various deviations to further investigate how these deviations affect the magnitude and direction of pressure and radial forces.
3.2. Pressure Plot Analysis
By combining the maximum and minimum pressures of the three components, as well as their pressure differentials (Figure 13), it can be observed that an increase in radial installation deviation leads to higher pressure values for each component. However, the differentials between pressures do not undergo significant changes. In contrast, the upper crown chamber exhibits substantial pressure fluctuations at 1.5 mm and 2.5 mm deviations. This aligns with previous findings, confirming that the upper crown chamber is more affected than other components, resulting in increased instability in pressure with increasing deviation.
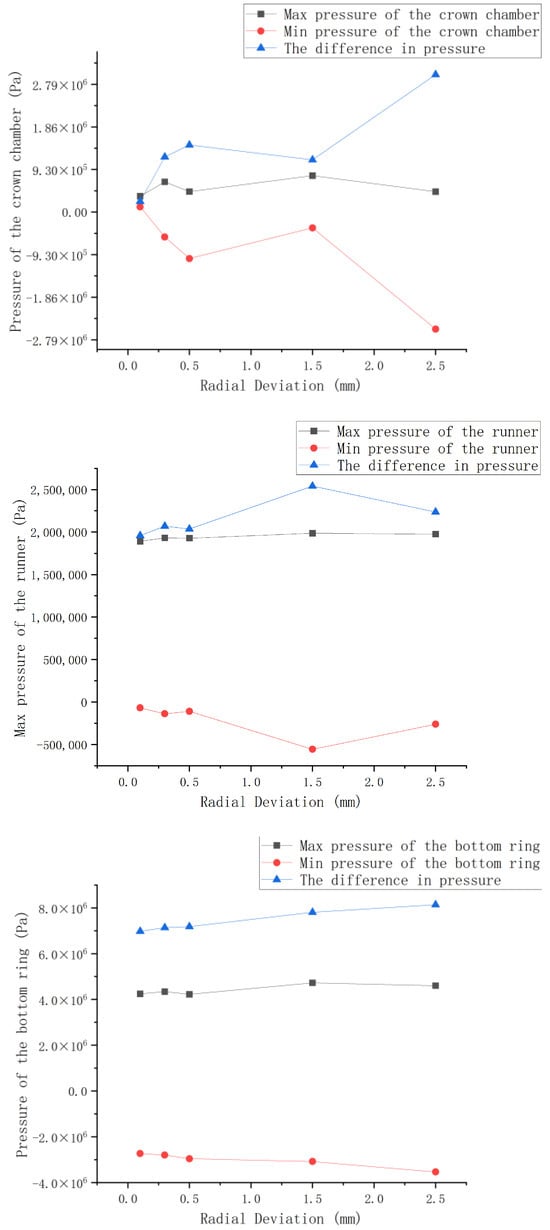
Figure 13.
The maximum and minimum pressures of each component and their pressure differences.
In the final section, we examine the magnitude and direction of the radial forces on the upper crown, impeller front cover plate, blades, rear cover plate, and lower ring to analyze their response to radial deviations.
The Upper Crown Chamber
From Figure 14, it can be observed that the magnitude of the radial force on the upper crown remains relatively stable in the first four scenarios. However, in the case of a 2.5 mm deviation, there is a sudden increase in this force. By examining the pressure distribution, it can be inferred that in the 2.5 mm deviation scenario, there is a notably low-pressure zone in the lower part of the upper crown (depicted in light blue) compared to other scenarios. This leads to excessively high pressures on the corresponding side, resulting in an increased radial force. The radial force angle plot further confirms this situation.
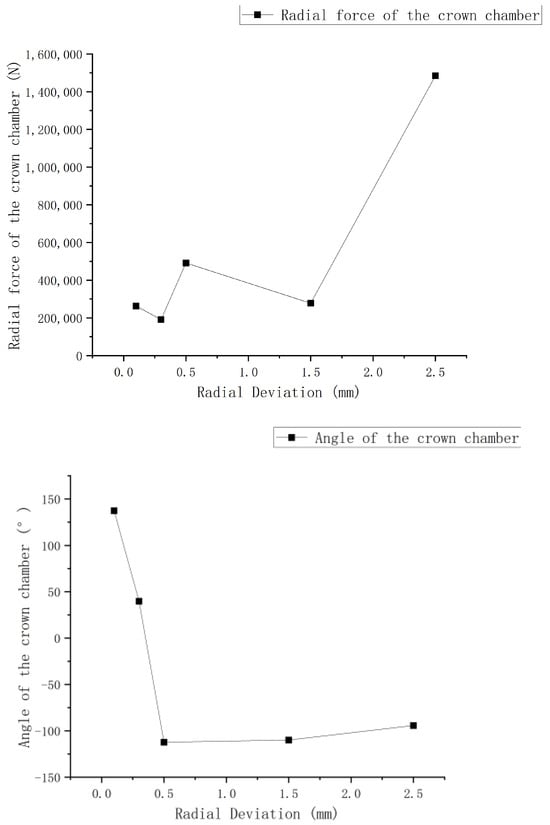
Figure 14.
Radial force and angle of the upper crown chamber.
The Runner
For the impeller section, we divided it into three parts for analysis: the front cover plate, the blades, and the rear cover plate. By considering the radial force characteristics of these three components collectively, we can gain a comprehensive understanding.
Through the comparison of these three components (Figure 15), we observe that, in terms of radial force magnitude, the blades experience the highest radial force, followed by the rear cover plate, with the front cover plate experiencing the lowest radial force. This discrepancy arises from differences in the surface area subjected to force.
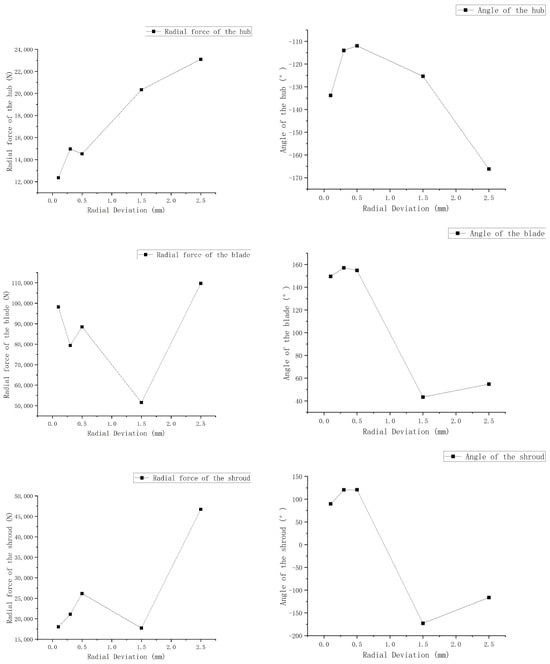
Figure 15.
Radial force and angle of the impeller.
Regarding the direction of radial forces, the front cover plate consistently experiences radial forces in the negative y-axis direction, while the blades consistently encounter radial forces in the positive y-axis direction. The rear cover plate, on the other hand, exhibits both positive and negative radial forces, yet the resultant force direction aligns with the pressure distribution.
Furthermore, it is noteworthy that beyond the 0.5 mm deviation, the characteristics of these scenarios become more unstable compared to the earlier conditions, particularly at 1.5 mm, where significant fluctuations are observed.
The Bottom Ring Chamber
As shown in Figure 16, it exhibits a relatively straightforward pattern compared to other components. As the deviation increases, the radial force gradually grows, almost in a linear fashion. Simultaneously, the angle shifts from the left side of the clearance to the right side, yet consistently remains in the negative half of the y-axis. When considering the magnitude of radial forces across all components, it becomes evident that the lower ring experiences the highest radial force, with a substantial difference in magnitude compared to other components.
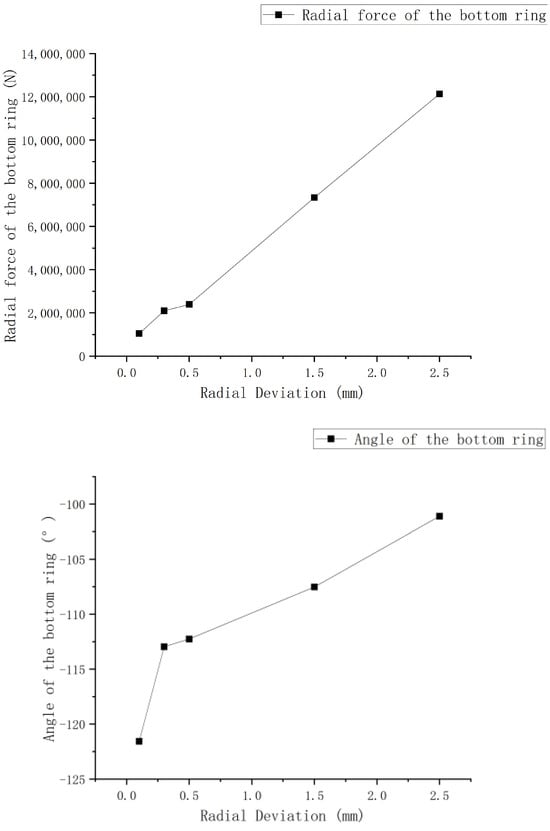
Figure 16.
Radial force and angle of the bottom ring chamber.
Resultant Force
Finally, by examining the resultant force (Figure 17), we can conclude that radial forces increase with the expansion of radial clearances. Notably, beyond 0.5 mm, the increase becomes nearly linear. Additionally, the direction of the force gradually shifts from the left side of the clearance to the right.
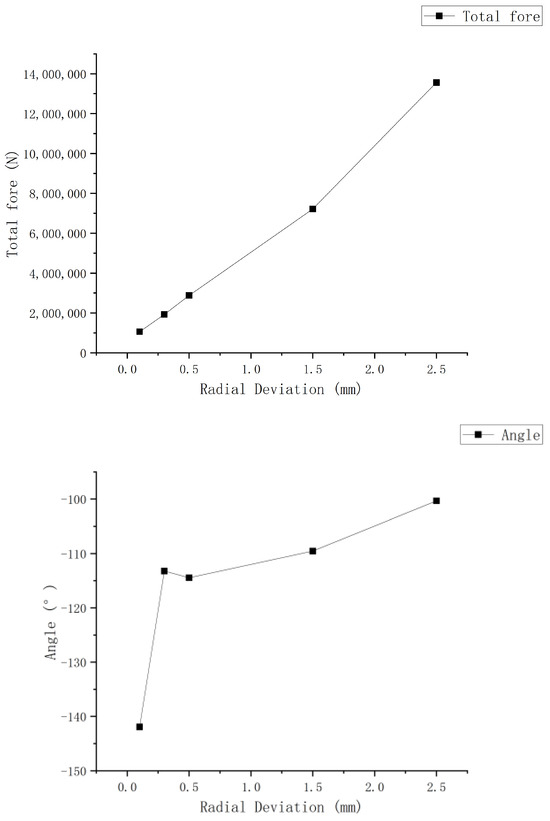
Figure 17.
Total radial force and angle.
Furthermore, the distribution pattern of radial forces on the bottom ring chamber is more distinct. However, since the bottom ring chamber experiences the most significant radial force, the overall trend of the resultant force aligns with the radial force trend observed on the bottom ring chamber.
4. Conclusions
In this paper, we conducted a comprehensive investigation into the impact of radial installation deviations on the pressure pulsations caused by the rotor–stator interaction of the giant turbine. The following are the conclusions drawn from our study:
- In analyzing the pressure distribution, we found that total pressure readings should be used near rotating components, while static pressure readings are suitable for more distant regions. However, overall, whether static or total pressure is considered, the distribution remains consistent. Dynamic pressure weakens clearance effects on external surfaces but accentuates them on the internal surfaces due to wall velocity. Initially, static pressure minimally impacts clearances, resulting in a consistent overall distribution, but dynamic pressure exacerbates this influence.
- The clearance size’s minimum point relates closely to high- or low-pressure zones. Smaller clearances do not necessarily lead to higher pressures; there is an optimal size (0.5 mm). Beyond this, fluid cannot flow in, creating a low-pressure zone.
- Radial forces most affect the lower ring and blades due to their larger projected areas. Influence patterns on the upper crown and runner are less stable than on the lower ring. In practice, it is advisable to focus on the upper crown and lower ring. Runner radial forces vary significantly in direction but are small in magnitude, making the upper crown more critical.
- While we computed extreme cases with deviations of up to 1.5 mm to understand patterns and fit curves, it is crucial to note that such deviations can be dangerous. For example, at 1.5 mm, the radial force exceeds 700 t and surpasses 1000 t later, posing a severe risk to the turbine unit in practical engineering.
Author Contributions
Conceptualization, Y.W. and K.J.; methodology, X.H.; investigation, Y.W., K.J. and F.G., validation, X.H. and X.L.; writing—original draft preparation, Y.W.; writing—review and editing, Y.W. and X.H.; supervision, Z.W. and L.Z. All authors have read and agreed to the published version of the manuscript.
Funding
This research received the research project: “Multi-field coupling study on dynamic characteristics of 1000 MW hydrogenerator unit” supported by China Three Gorges Construction Group Co., LTD. (Contract No.: JGJD0322003).
Institutional Review Board Statement
Not applicable.
Informed Consent Statement
Not applicable.
Data Availability Statement
Not applicable.
Conflicts of Interest
Author Kun Jin, Fei Gai and Xingmin Liu are employed by the company Baihetan Engineering Construction Department. The remaining authors declare that the research was conducted in the absence of any commercial or financial relationships that could be construed as a potential conflict of interest. And The authors declare that this study received funding from China Three Gorges Construction Group Co., LTD. (Contract No.: JGJD0322003). The funder had the following involvement with the study: Providing the basic model and the referable boundary conditions.
References
- Mei, Z. Pumped Storage Power Generation Technology; China Machine Press: Beijing, China, 2000; p. 7. [Google Scholar]
- Smith, A. Turbine Clearance Flow and Force Characteristics. Int. J. Hydropower Dams 2020, 30, 45–56. [Google Scholar]
- Lei, C.; Shoudao, L.I. Comparative Analysis and Research on Hydraulic Characteristics of narrow-seam energy dissipator. Water Resour. Hydropower Technol. 2019, 50, 126–131. [Google Scholar]
- Song, B. Study on Shafting Instability Induced by Crown Clearance Flow in the Runner of a Hybrid Turbine; Dalian University of Technology: Dalian, China, 2010. [Google Scholar]
- Song, B.; Ma, Z.; Kojiro, H.; Yoshinobu, T. Analysis of Flow Field Characteristics in the Upper Crown Gap during the Start-up Process of a Mixed-Flow Pump-Turbine. Hydropower Energy Sci. 2010, 28, 112–116. [Google Scholar]
- Zhou, D.; Chen, Y. Numerical simulation of clearance flow in hybrid turbine with drain hole. Trans. Chin. Soc. Agric. Mach. 2015, 1, 53–58. [Google Scholar]
- Shao, L.; Wang, W. Study on structural vibration characteristics induced by uneven clearance of turbine labyrinth ring. J. Hydraul. Eng. Civ. Eng. 2013, 11, 141–144. [Google Scholar]
- Wu, Y.; Feng, J. Research on the influence of hub clearance on the performance of axial-flow propeller turbine. J. Hydroelectr. Power 2014, 33, 185–190. [Google Scholar]
- Feng, J.; Luo, X. Effect of gap flow on efficiency prediction of hybrid turbine. Trans. Chin. Soc. Agric. Eng. 2015, 31, 53–58. [Google Scholar]
- Dai, Y.; Wang, H.; Zhang, K.; Zheng, L.; You, G.; Kong, L.; Zhu, X. Research on Axial Water Thrust of Mixed-Flow Reversible Wheel. J. Hydraul. Power Gener. 2005, 24, 105–113. [Google Scholar]
- Liu, D.; You, G.; Wang, F.; Zhang, J. Calculation and analysis of axial water thrust of mixed-flow reversible turbine. J. Hohai Univ. (Natural Sci. Ed.) 2004, 32, 557–561. [Google Scholar]
- Anderson, J.D. Computational Fluid Mechanics; McGraw Hill: New York, NY, USA, 1995. [Google Scholar]
- Zhou, L.; Shi, W.; Li, W.; Ramesh, A. Numerical and experimental study of axial force and hydraulic performance in a deep-well the concurrent pump with different reorganization radius. J. Fluids Eng. 2013, 135, 104501. [Google Scholar] [CrossRef]
- Shi, W.; Li, Q.; Lu, W.; Zhang, D. Calculation and Test of Axial Force in Centrifugal Pump Based on CFD. Trans. Chin. Soc. Agric. Mach. 2009, 40, 60–63. [Google Scholar]
- Pehlivan, H.; Parlak, Z. Investigation of Parameters Affecting Axial Load in an End Suction Centrifugal Pump by Numerical Analysis. J. Appl. Fluid Mech. 2019, 12, 1615–1627. [Google Scholar] [CrossRef]
- Zhu, Z. Research on Axial Force Balance Method of High Speed Centrifugal Pump. J. Eng. Thermophys. 2000, 6, 713–715. [Google Scholar]
- Liu, Z.; Chen, T.; Lu, W. Experiment and Analysis of Influence of Impeller Back Blade on axial Force of Centrifugal Pump. J. Drain. Irrig. Mach. Eng. 2019, 37, 1013–1018. [Google Scholar]
- Johnson, B. Impact of Turbine Runner Clearance on Power Station Performance. Hydropower Eng. 2020, 22, 115–128. [Google Scholar]
- Ruan, Z.; Zhou, S. Principle and Practice of Floating Impeller Automatic Balancing axial Force of Centrifugal Pump. Water Pump Technol. 2002, 5, 29–32. [Google Scholar]
- Lu, X.; Fan, Z.; Xue, J. Balancing the axial Force of single stage single suction centrifugal Pump by Increasing the sealing ring method. Water Pump Technol. 1998, 5, 3–9. [Google Scholar]
- Brown, C. Fluid Clearance Discrepancies and Their Effects on Hydraulic Machinery. J. Fluid Mech. 2021, 40, 297–310. [Google Scholar]
- Adkins, D.R.; Brennen, C.E. Analyses of Hydrodynamic Radial Forces on Centrifugal Pump Impellers. J. Fluids Eng. 1988, 110, 20–28. [Google Scholar] [CrossRef]
- Barrio, R.; Fernandez, J.; Blanco, E.; Parrondo, J. Estimation of Radial Load in Centrifugal Pumps Using Computational Fluid Dynamics. Eur. J. Mech. B/Fluid 2011, 30, 316–324. [Google Scholar] [CrossRef]
- Guan, X. Modern Pump Theory and Design; China Aerospace Press: Beijing, China, 2011. [Google Scholar]
- Jo, S.-H.; Shin, D. Reduction of the Axial Force of Water Pump Using CFD. Trans. Korean Soc. Automot. Eng. 2012, 20, 83–87. [Google Scholar] [CrossRef]
- Chen, D. Radial Force Balancing Techniques in Centrifugal Pumps. Mech. Eng. Rev. 2017, 55, 78–91. [Google Scholar]
- Li, H.; Geng, B.; Liu, D. Influence of Radial Clearance on surrounding Flow field characteristics of the turbine runner of a mixed-flow pump. Water Resour. Hydropower Technol. 2020, 51, 136–142. [Google Scholar]
- Zhu, D.; Xiao, R.; Yao, Z.; Yang, W.; Liu, W. Optimization design for reducing the axial force of a vaned mixed-flow pump. Eng. Appl. Comput. Fluid Mech. 2020, 14, 882–896. [Google Scholar] [CrossRef]
- Wang, P. Advancements in Turbine Hydraulic Efficiency Modeling. J. Power Energy Eng. 2023, 12, 187–202. [Google Scholar]
- Liu, Y.; Liu, C.; Zhang, Y.; Huang, X.; Guo, T.; Zhou, L.; Wang, Z. Influence of Axial Installation Deviation on the Hydraulic Axial Force of the 1000 MW Francis Runner in the Rated Operating Condition. Energies 2023, 16, 1878. [Google Scholar] [CrossRef]
- Wang, Y.; Jin, K.; Huang, X.; Lin, P.; Wang, Z.; Wang, W.; Zhou, L. Influence of Radial Installation Deviation on Hydraulic Thrust Characteristics of a 1000 MW Francis Turbine. Water 2023, 15, 1606. [Google Scholar] [CrossRef]
Disclaimer/Publisher’s Note: The statements, opinions and data contained in all publications are solely those of the individual author(s) and contributor(s) and not of MDPI and/or the editor(s). MDPI and/or the editor(s) disclaim responsibility for any injury to people or property resulting from any ideas, methods, instructions or products referred to in the content. |
© 2023 by the authors. Licensee MDPI, Basel, Switzerland. This article is an open access article distributed under the terms and conditions of the Creative Commons Attribution (CC BY) license (https://creativecommons.org/licenses/by/4.0/).