Abstract
Food waste is a global concern and is the focus of this research. Currently, no method in the state of the art classifies multiple fruits and vegetables and their level of ripening. The objective of the study is to design and develop an intelligent system based on deep learning techniques to classify between types of fruits and vegetables, and also to evaluate the level of ripeness of some of them. The system consists of two models using the MobileNet V2 architecture. One algorithm is for the classification of 32 classes of fruits and vegetables, and another is for the determination of the ripeness of 6 classes of them. The overall intelligent system is the union of the two models, predicting first the class of fruit or vegetable and then its ripeness. The fruits and vegetables classification model achieved 97.86% accuracy, 98% precision, 98% recall, and 98% F1-score, while the ripeness assessment model achieved 100% accuracy, 98% precision, 99% recall, and 99% F1-score. According to the results, the proposed system is able to classify between types of fruits and vegetables and evaluate their ripeness. To achieve the best performance indicators, it is necessary to obtain the appropriate hyperparameters for the artificial intelligence models, in addition to having an extensive database with well-defined classes.
1. Introduction
Food waste has become a global problem, and science is looking for a solution. Artificial intelligence (AI) seems to have a solution to the problem and reduce the high impact of food waste globally. During the ripening process of fruits and vegetables, there are very noticeable changes to the human senses, but there are also chemical, biochemical, and microbiological changes that are not so noticeable to humans. The most noticeable physical changes for fruits and vegetables are changes in color, weight, shape, texture, size, and consistency, among others. Specifically for color changes, there are changes that generally range from lighter to darker tones as the state of life or ripeness increases. For each class of fruit and vegetable, there is a Red, Green, and Blue (RGB) scale combination that defines the stage of ripeness in which they are found, i.e., the combination of a certain percentage of RGB results in the color characteristic that can determine the stage of ripeness. Chemical changes are also a variable that can be considered for ripeness. These types of changes are analyzed in specialized laboratories and usually involve destructive tests. The chemical characteristics analyzed are changes in soluble solids, acidity, and sugar content. These changes are difficult to implement using AI because they are destructive methods. Physiological changes are associated with changes in respiration and ethylene production. A specialized team is needed to carry out these tests and therefore the cost of the operation is high [1]. Microbiological changes are caused by microbiological organisms involved in ripening. Generally, these are bacteria, viruses, and fungi, but sometimes they accelerate the ripening process, since the concentration may be higher than it should be [2]. The ripening of fruits and vegetables is genetically programmed and therefore these types of changes are given in a progressive order. The variables involved in these processes are tissue softening, carbohydrates, pigmentation, pectin, organic acids, and volatiles [3].
Artificial Neural Networks (ANNs) are widely used in the food industry, but specifically for Convolutional Neural Networks (CNNs), one of the limitations is the lack of a substantial dataset to perform their training [4]. The detection of fruits and vegetables using AI is a topic of great interest today. A review of the state of the art shows that there are numerous works focused on the development of classification algorithms and neural networks for the identification of different types of fruits. These techniques are based on computer vision and range from binary to hyperspectral images [5,6,7]. In computer vision, the hyperspectral systems combine spectral information for each pixel [8]. Cutting-edge deep learning techniques have been applied to fruit and vegetable classification. In two previous studies [9,10], researchers have used Faster R-CNN to develop fruit recognition systems that can be used in harvesting, smart farming, and packaging. These systems have been trained on real-life orchard images and can work in different lighting conditions. One way to improve the accuracy of apple detection is to add a suppression branch to Mask R-CNN [11,12]. Also, research detects the quality of coffee beans using CNN and color space models, distinguishing between the quality categories of under-roasted coffee beans [13].
Machine vision systems can be used to analyze food waste, which has increased significantly in recent years. These systems can provide detailed information about the types and amounts of food that are being wasted [14]. With deep learning and through CNNs, it can become an alternative to classical methods of object classification that require a manual selection of features. Complex problems such as classification are where deep learning proves effective. In addition, when combined with computer vision techniques, object detection can be performed quickly and in real time [15]. Fruit recognition and classification systems for agricultural and robotic harvesting have been developed through deep learning methods [16,17]. An enhanced MobileNetV2 model was introduced in a study, utilizing ImageNet weights and fine-tuning by freezing the initial 130 layers of MobileNetV2 and training the remaining 25 layers for accurate fruit classification. The researchers achieved real-time performance by using a 13 MP AR1335 camera that was connected to an NVIDIA Jetson Xavier. They were able to achieve 97% accuracy in the classification of six types of fruit, including fresh/rotten apples, bananas, and oranges [18]. In another study, different architectures of classical and residual Convolutional Neural Networks (CNNs) were implemented and tested for fruit classification. The CNNs used in this study included AlexNet, ResNet50, and VGG-16. The dataset used in this study comprised the same six classes as the dataset used in another study [19]. The experiment demonstrated that the ResNet50 and AlexNet models accurately identified the spoilage of other perishables with over 99% accuracy on the dataset provided. This suggests that they may be useful in determining the freshness of other fruits and vegetables at an industrial scale [4]. Research suggests that You Only Look Once (YOLO) topologies can automate various tasks, resulting in a seamless and efficient shopping experience [20].
Deep learning fruit classification methods are widely used in the post-harvest stage and fruit industry. A study proposed a CNN-based model to sort apples into normal and defective categories [21]. The model was deployed in a fruit sorting system, achieving 92% accuracy with a processing time of less than 72 ms per apple. Another study improved the UNet model to detect rotten or fresh apples based on defects in the fruit peel [17]. The modified UNet model achieved superior outcomes compared to the original UNet. A third study implemented an apple fruit quality evaluation system utilizing grab-cut segmentation and fuzzy c-means clustering to segment six diverse apple varieties. Logistic regression, SVM, sparse representation classifier, and KNN classifier were employed to categorize fresh and rotten apples. Finally, researchers proposed a CNN model that can accurately classify fresh and rotten fruits, including apples, bananas, and oranges, utilizing a dataset containing 5989 images [22].
Despite the growing interest in AI for food waste, there is a lack of research on the use of AI for the detection of fruits, vegetables, and their ripeness stage. The aim of this research is to design and develop an intelligent system capable of identifying 32 classes of fruits and vegetables, in addition to assessing the level of ripeness of 6 of the total number of classes (apples, bananas, mangoes, oranges, potatoes, and tomatoes). Two stages of ripening are considered: fresh and rotten. The architecture used for both models is MobileNet version 2, and the transfer learning is performed from the pre-trained weights of the network. The pre-trained weights are taken from ImageNet, while the input images have a size of 512 × 512 pixels. Additionally, the initial weights of the first layers are frozen, as they do not need to be trained again. The system is unique in its class, as no other system with such capabilities has been identified in the state of the art. The proposed hypothesis is that an intelligent system can be used to develop a model capable of classifying fruits and vegetables, as well as determining their ripeness. The proposed system has some limitations; for example, the general methodology uses two AI models, one to recognize thirty-two categories of fruits and vegetables, and another model to assess the ripeness of six of the categories. On the other hand, the system is not able to detect damaged, obstructed or poorly illuminated fruits and vegetables.
2. Theoretical Background
This section presents a theoretical framework for fundamental concepts such as deep learning, CNNs, metrics utilized in deep learning models, and horticultural maturity stages utilized in agricultural research. These concepts played an essential role in constructing the current research.
2.1. Deep Learning
Deep learning is a branch of machine learning that aims to develop algorithms and models that can imitate the behavior and decision-making processes of the human brain. Neural networks inspire these algorithms by modeling the way neurons in the brain process information. ANNs are the most popular deep learning approach, and they constitute a subset of machine learning. These algorithms are designed to automatically extract features from raw input data, eliminating the need for manual feature extraction. This is especially useful for tasks like image and speech recognition, natural language processing, and computer vision. Deep learning algorithms comprise multiple layers of interconnected nodes or “neurons” trained on large amounts of labeled data. Each layer extracts more complex features from the input data, leading to a prediction or decision. The deep neural network’s hierarchical structure enables the model to learn and extract increasingly intricate representations of the input data with greater precision [23].
2.2. Convolutional Neural Networks
Convolutional Neural Networks (CNNs) are a type of deep learning algorithm that is ideal for handling image and video processing tasks. They utilize a convolution operation to extract features from the input data. A CNN comprises an input layer, hidden layers, and an output layer. Furthermore, the input layer receives raw input data, such as an image or video, while the hidden layers execute the convolution operation. These layers contain filters, also referred to as kernels, which detect specific features in the input data. The convolution operation involves moving the filters over the input data and calculating the dot product between the filter weights and the input data at each position. The output is a new set of feature maps that display the features of the input data at varying levels of abstraction. One of CNNs’ main benefits is their capacity to process spatial information and comprehend pixel relationships in an image. This is accomplished by scanning the entire image with the convolution operation and using pooling layers to efficiently down-sample the feature maps, enabling the network to concentrate on the most pertinent information. [24].
2.3. Metrics for Deep Learning Model Evaluation
There are two general types of evaluation metrics for deep learning models, classification metrics and regression metrics. In this study, the classification category is used because the topic is image classification, so the metrics used are accuracy, precision, recall, and F1-score. These metrics are shown in Equations (1)–(4).
Accuracy is important because it gives us an overall sense of how well the model is performing. This metric reports the percentage of all predictions that were correct. For example, if a model is 90% accurate, it has correctly identified 90 out of 100 fruits or vegetables it has been tested on. The values obtained for true positives (TP), true negatives (TN), false positives (FP), and false negatives (FN) are used to determine the accuracy.
A TP is a result where the model correctly predicts the positive class. Similarly, a TN is a result where the model correctly predicts the negative class. A FP is a result where the model incorrectly predicts the positive class. And a FN is an outcome where the model incorrectly predicts the negative class.
On the other hand, precision shows how reliable the model’s positive predictions are. In other words, it represents the proportion of positive predictions that were correct. For example, if a model is 80% accurate, then 80 out of 100 fruits or vegetables that it predicted would be ripe were ripe.
Recall indicates how many ripe fruits or vegetables are missing from the model. This is the proportion of actual positives that were correctly identified. For example, if a model has a recall of 70%, then 70 out of 100 ripe fruits or vegetables were correctly identified as ripe.
F1-score is important because it provides a balanced measure of precision and recall; the metric reports a weighted harmonic mean of precision and recall. It is often considered a more balanced measure of performance than accuracy, especially when there is an unequal number of positive and negative examples in the dataset.
In general, a high accuracy score is desirable, but it is also important to consider the other metrics, as high accuracy could also be a sign of overfitting. For example, a model with a high accuracy score but low precision may have a high number of false positives. This could be problematic if the model is used to make decisions about the ripeness of fruits or vegetables, as it could misclassify ripe fruits or vegetables as unripe.
Confusion matrix is another type of evaluation metric for deep learning models. This type of metric is more visual, so this table shows the true and predicted classifications for a set of data. It can be used to visualize the performance of a model and identify areas for improvement.
2.4. Horticultural Maturity
For human beings, the consumption of fruits and vegetables is essential because of their nutritional contribution, but it is necessary to consume them in the ideal state of maturation. Growth consists of three stages: initialization, development, and death. The first stage goes from the initialization stage to the development stage and is generally known as the growth stage. The second stage is the period between development and death. Figure 1 shows in detail the developmental stages of a plant in which fruits and vegetables are found.
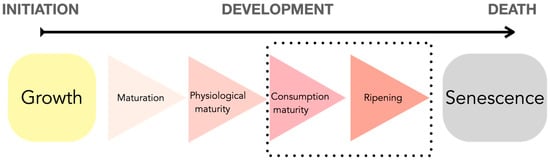
Figure 1.
Horticultural maturity in relation to plant developmental stages.
As can be seen in Figure 1, specifically on the black dotted rectangle, consumption maturity, and ripening stages are the most representative of the maturity diagram because these are the stages when humans can consume fruits and vegetables. In addition, the senescence stage includes the aging of cells until they stop reproducing. These stages of consumption correspond to the ideal stages for human consumption since they provide all the maximum nutrients that the fruit or vegetable can produce.
3. Materials and Methods
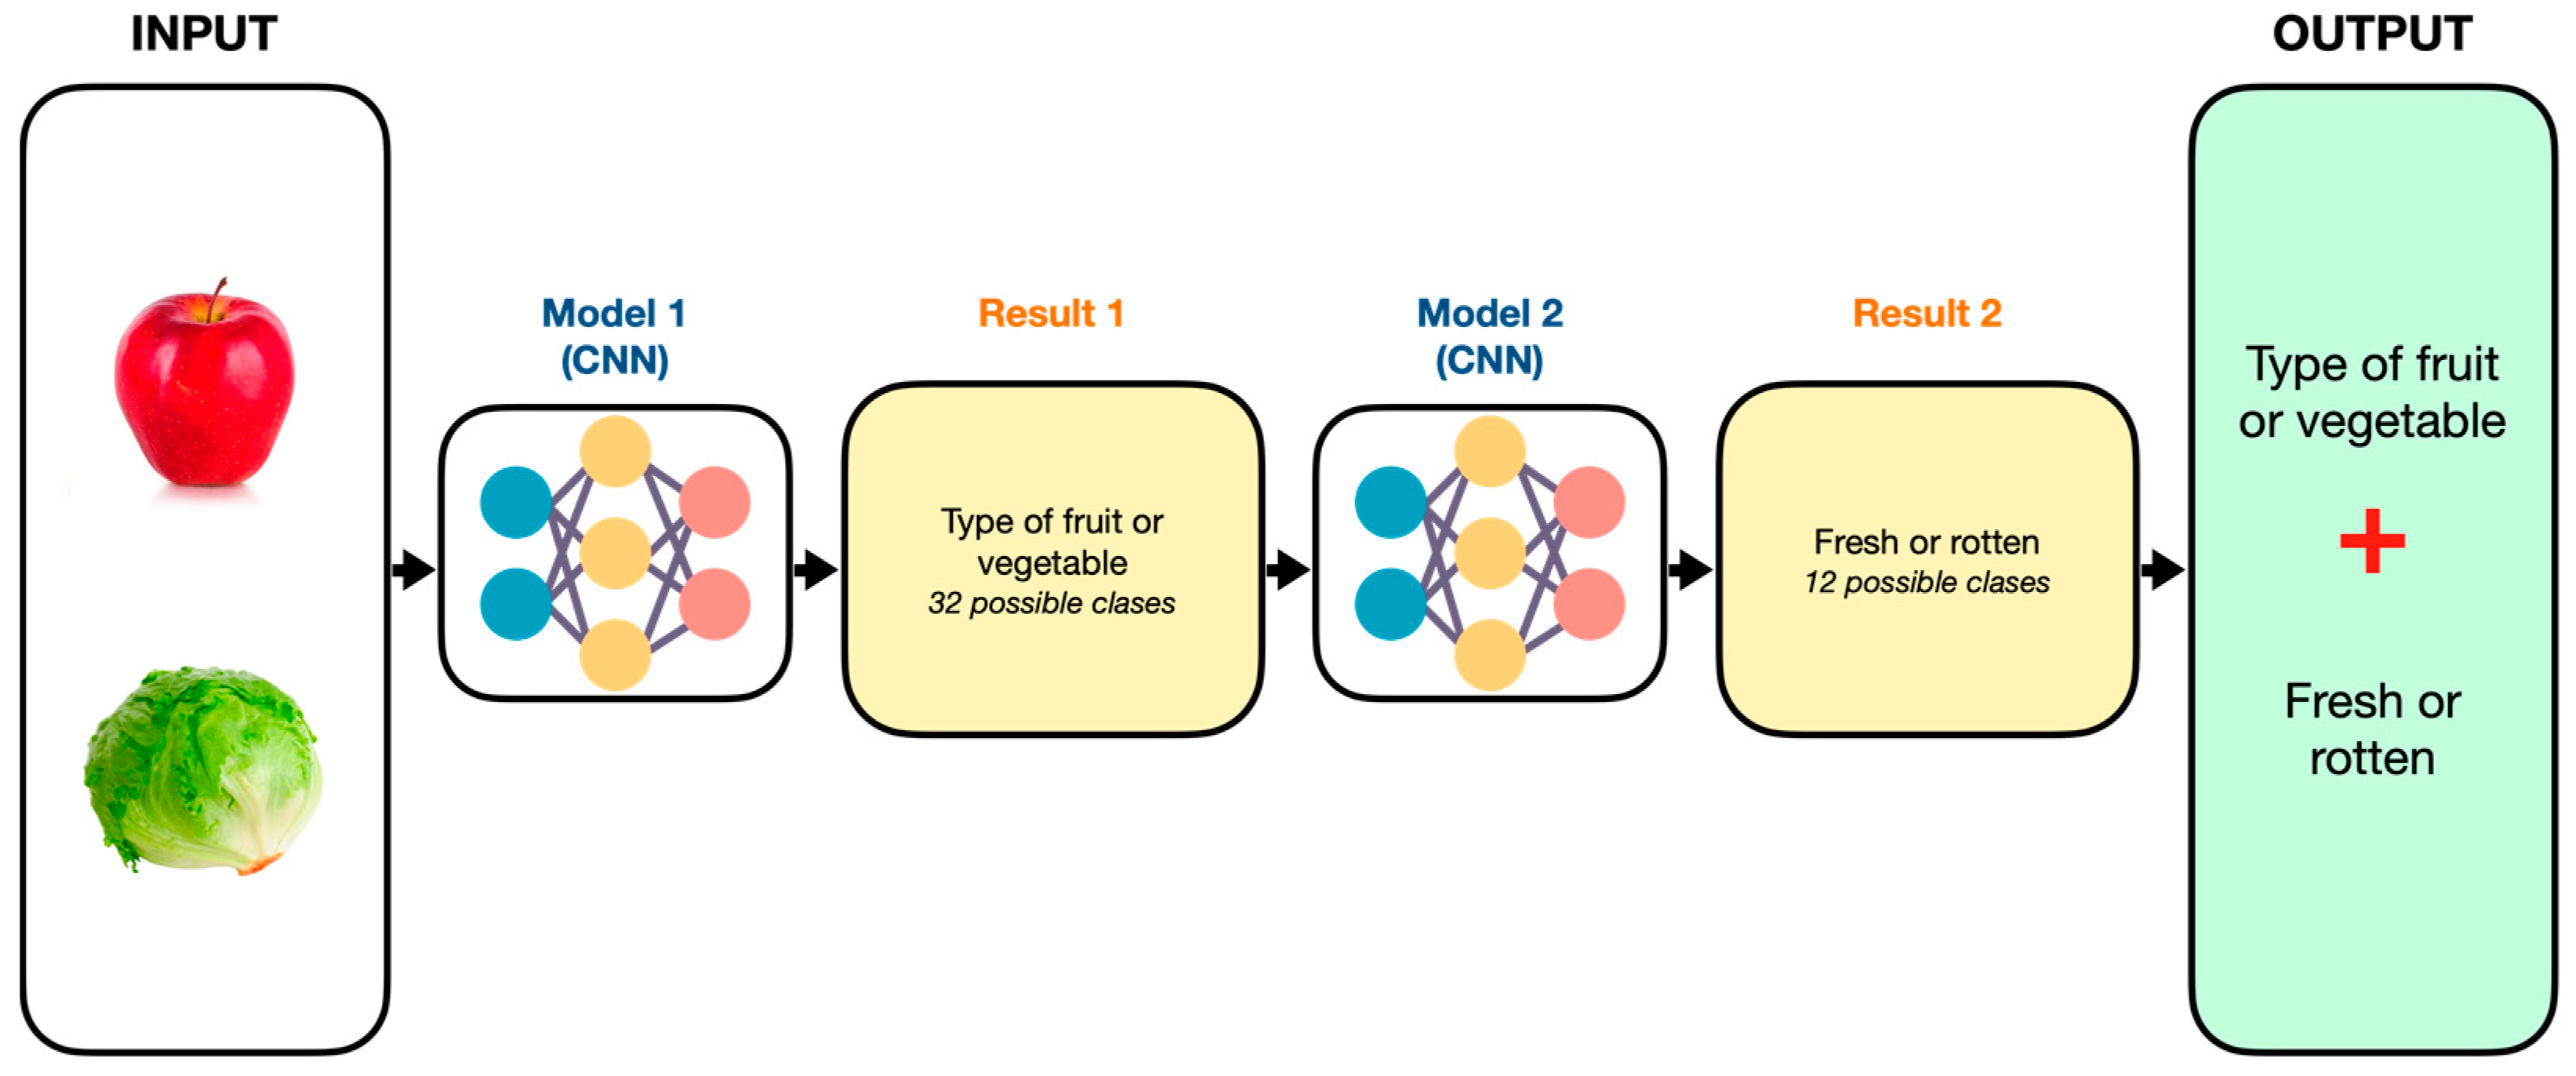
The operation of the system consists of a general model that integrates two models with architectures based on CNNs, where the first model performs the classification of fruits and vegetables, giving as output the class. The second model predicts the state of ripeness, where the output could be fresh or rotten, depending on the input to the system. The final output shows the combination of the results of model 1 and model 2 and the prediction. Figure 2 shows the general scheme of operation.
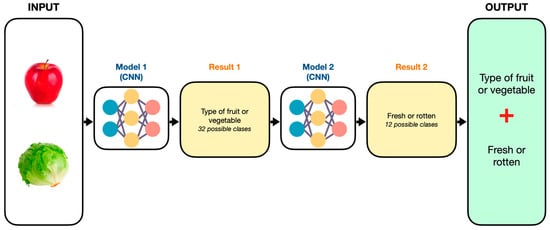
Figure 2.
Basic operating scheme for fruits, vegetables, and ripeness prediction.
Deep learning models have large data processing capabilities as well as good generalization when the model is obtained. For this case study, two pre-trained models are used, where the first predicts the type of fruit or vegetable class, while the second predicts the corresponding ripening stage. The reason why two models are used and not just one where all classes could be included is that the purpose of the research is to demonstrate that through an intelligent system, it is possible to classify and assess the level of ripeness of fruits and vegetables.
The great advantage of using this type of configuration is that it is capabilities can be increased by easily identifying areas of opportunity through the analysis of training metrics. Furthermore, both models can be retrained by adding classes to them, depending on the objective; for example, if the objective is to increase the number of maturity levels per class, only model number two, which has the objective of detecting maturity levels, needs to be retrained; the same principle would work for model number one.
3.1. Conceptual Proposal of the System
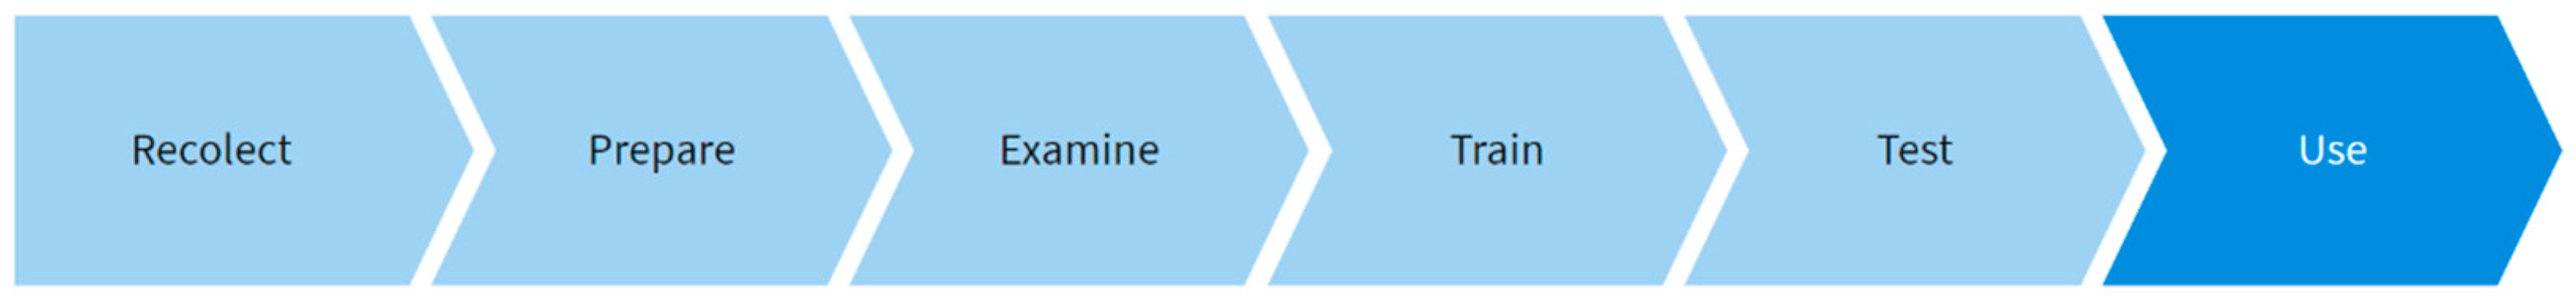
The system is composed of a general algorithm that performs the classification of fruits and vegetables, followed by an algorithm that detects the state of ripeness of the fruits and vegetables mentioned in Table 1. As part of the methodology, Figure 3 describes the methodology performed [25].
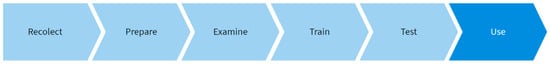
Figure 3.
Proposed methodology for fruits, vegetables, and ripeness detection.
Figure 3 outlines the approach used to develop the AI system. The initial phase involves collecting a dataset that is appropriate for the given task. Once the data has been collected, it must be prepared for the training model by formatting it into a dataset. Before starting to train, it is important to analyze the dataset to make sure that it is not biased or limited. This will ensure that your system is trained on high-quality data, reducing the likelihood of biased or inaccurate results. The next step is to train the model by feeding the data into the chosen deep learning method and allowing the algorithm to learn a model capable of predicting new data. Finally, the model is tested on a retained dataset to evaluate its performance. This process identifies areas in the system that need improvement. Once the model is performing well, it can be integrated into production to begin predicting new data.
3.2. Recollect
For any AI algorithm, and especially for deep learning, it is necessary to have input data to feed the CNN. In this step, depending on the problem, the database to be used is searched or generated. The first dataset used was obtained from Kaggle and contains 36 types of fruits and vegetables [26], but for research purposes, it was reduced to 32 classes, where each class contains 105 images, with a total of 3360 images. In addition, other datasets obtained from Kaggle were used, which contain the ripening states depending on the type of fruit or vegetable [27,28]. Table 1 shows the characteristics of the datasets used for the ripening process.

Table 1.
Ripening state datasets.
Table 1.
Ripening state datasets.
| Fruit/Vegetable | Ripeness States | Number of Images |
|---|---|---|
| Apple | Fresh and rotten | 561 |
| Banana | Fresh and rotten | 524 |
| Mango | Fresh and rotten | 1198 |
| Orange | Fresh and rotten | 428 |
| Potato | Fresh and rotten | 1200 |
| Tomato | Fresh and rotten | 1189 |
It should be noted that there is an imbalance between the classes due to the number of images contained in each class. Therefore, an increase in data or synthetic data was used to create the correct balance between classes. The methodology section explains the process. Also, the databases for the maturation states were collected from different datasets and one was built with them.
3.3. Prepare
The database for classifying fruits and vegetables has 32 classes. For the selection of the ripeness classes, a study was carried out to determine which of the most consumed fruits and vegetables in the country would be suitable for ripeness detection. In addition, a data augmentation was implemented to homogenize all the classes in order to obtain the correct balance between them. The configuration used was a 30° clockwise rotation of the images and a 10% zoom of the original image. This resulted in three times the number of images per class.
3.4. Analyze
In the fruit and vegetable classification dataset, images that do not have representative characteristics or contain some other types of information were removed, which significantly improved the model’s performance. The analytical method used is the 80-10-10 method, where 80% of the data is used for training, 10% for testing, and 10% for validation. That is, for classification, out of the total number of images, 2688 images were used for training, 168 for testing, and 168 for validation. On the other hand, for ripeness, 4080 images were used for training, 255 for testing, and 255 for validation. In addition, data augmentation is performed for each of the domains.
To run the models, ablation tests were used to understand the contribution of each component of the model. These components are the hyperparameters, such as the optimizer, the number of epochs, and the architecture. All the tests are shown in the Results section. To perform these tests, first a model was trained with a configuration, then the metrics were analyzed to decide which hyperparameter had to be changed to obtain better performance. After identifying the components that could be changed or removed, the model was trained again to finally evaluate the new metrics. This process was repeated several times until the performance was better than the previous one.
3.5. Train
The fruit and vegetable classifier was trained via transfer learning from the pre-trained InceptionV3 and MobileNetV2 models. Hyperparameters were modified until the highest accuracy was reached during testing. The initial fully convolutional layer of MobileNetV2 has 32 filters, followed by 19 residual bottlenecks. ReLu is utilized as the nonlinearity due to its robustness with low-precision computations. Always use kernel size 3 × 3, as it is a standard for modern networks, and implement dropout and batch normalization throughout the network’s training. Maintain a constant expansion rate throughout the network, except for the first layer. According to experiments, maintaining expansion rates between 5 and 10 results in nearly identical performance curves. Smaller networks perform better with slightly smaller expansion rates, whereas larger networks perform slightly better with larger expansion rates.
For all primary experiments, we utilize an expansion factor of 6, which is applied to the size of the input tensor. As an illustration, suppose a bottleneck layer receives a 64-channel input tensor and produces a 128-channel tensor. In that case, the intermediate expansion layer would have 384 channels, as 64 × 6 = 384 [29].
The outputs of the general architecture shown in Figure 4 can be apple, banana, beets, bell pepper, cabbage, carrot, cauliflower, chili pepper, corn, cucumber, eggplant, garlic, ginger, grapes, jalapeno pepper, kiwi, lemon, lettuce, mango, onion, orange, pear, peas, pineapple, pomegranate, potato, radish, soybean, spinach, sweet potato, tomato, watermelon, fresh mango, fresh potato, fresh tomato, rotten mango, rotten potato, rotten tomato, fresh apple, fresh banana, fresh orange, rotten apple, rotten banana, and rotten orange.
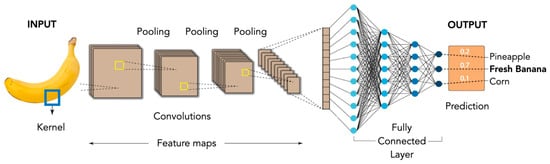
Figure 4.
General CNN architecture used for models 1 and 2.
For the fruits and vegetables classification model, the output layers are modified in order to determine the correct result, since when performing transfer learning training, the last layers and the output layer must be adapted to the nature of the problem to be solved. The configurations made resulted in adding two previous dense layers to the output with the Relu activation function and a dense layer as output with the number of existing classes with the Softmax activation function, resulting in the final training model.
The model for determining the state of ripeness presents a configuration like the model of classification of fruits and vegetables, maintaining a transfer learning with the weights of MobileNetV2, but with modifications in the last layers and the output. The antepenultimate layer is a batch normalization to normalize the size and help the output, adding a penultimate layer, with a kernel regularizer type l2, activation regularizer l1, and a bias regularizer l1 with Relu activation function. Note that before reaching the output layer, there is a layer in which neurons with a dropout are turned off to help train the network. Finally, a dense output layer is presented with the number of classes, which in this case is 12, since the 6 classes of fruits and vegetables each have 2 states of ripeness.
3.6. Test
This state corresponds to the testing of the already trained models with the weights obtained during this phase. The training data, test, and validation intervene to be able to demonstrate that the model was able to learn without generating overtraining or subtraining, in addition to the fact that with the validation separation can be verified the robustness of the model. For both algorithms developed, the metrics of precision, recall, f1-score, and support were used to perform the evaluation. The equations of accuracy, precision, recall, and F1-score are previously mentioned as (1), (2), (3), and (4).
3.7. Use
It is necessary to identify if the design corresponds to an application, a prototype, a part of a platform or if it must be executed from a specific framework. In this case, the design corresponds to the platform that will be used in the future to build an API and a functional physical prototype. Trained models need to be called from where they are stored and executed with a Python programming language. The results of this part of the methodology are presented in Section 4.
4. Results
As part of building a robust intelligent system capable of detecting fruits, vegetables, and their stage of ripeness, the first model had a unique dataset that included the 32 classes of fruits and vegetables, as well as the 12 classes of fresh and rotten stages, obtaining a dataset of 44 classes. The performance obtained with this configuration is shown in Table 2, which reports the number of classes (No. classes), architecture, optimizer (Opt.), epochs, execution time (Exec. time), accuracy (Acc.), precision (P), recall (R), and F1-score (F1).
Table 2.
Model results for fruit and vegetable classification and ripeness.
As shown in Table 2, the metrics obtained are good, but they could be improved by making some changes to the model. According to the results obtained, the decision taken to obtain a better performance was to generate two models. The first model contained only the fruit and vegetable classes, and the second model contained the fresh and spoiled classes. This decision was made to have more possibilities to change the hyperparameters and obtain better results. Also, to have opportunities to add more classes to the models in future work. This decision had good results and the results can be seen in Section 4.1 and Section 4.2.
4.1. Fruit and Vegetable Classification
As part of the results obtained, in the case of the model for the classification of fruits and vegetables, 5 training sessions were carried out, changing the hyperparameters, as mentioned in previous sections. The improvements were significant in terms of accuracy, as shown in Table 3.
Table 3.
Ablation test for the proposed methodology.
The hyperparameters for the deep learning model were adjusted using a grid search to identify the best parameters for assessing horticultural maturity. Grid search is a commonly used method for hyperparameter tuning, which involves training the model with numerous hyperparameter values and then selecting the model that provides the optimal performance on a held-out validation set.
Table 3 shows the accuracy increased throughout the training because the hyperparameters were changed according to the results presented in the previous training. With respect to the first training with InceptionV3, the training time is significantly reduced, due to the configuration presented by the model.
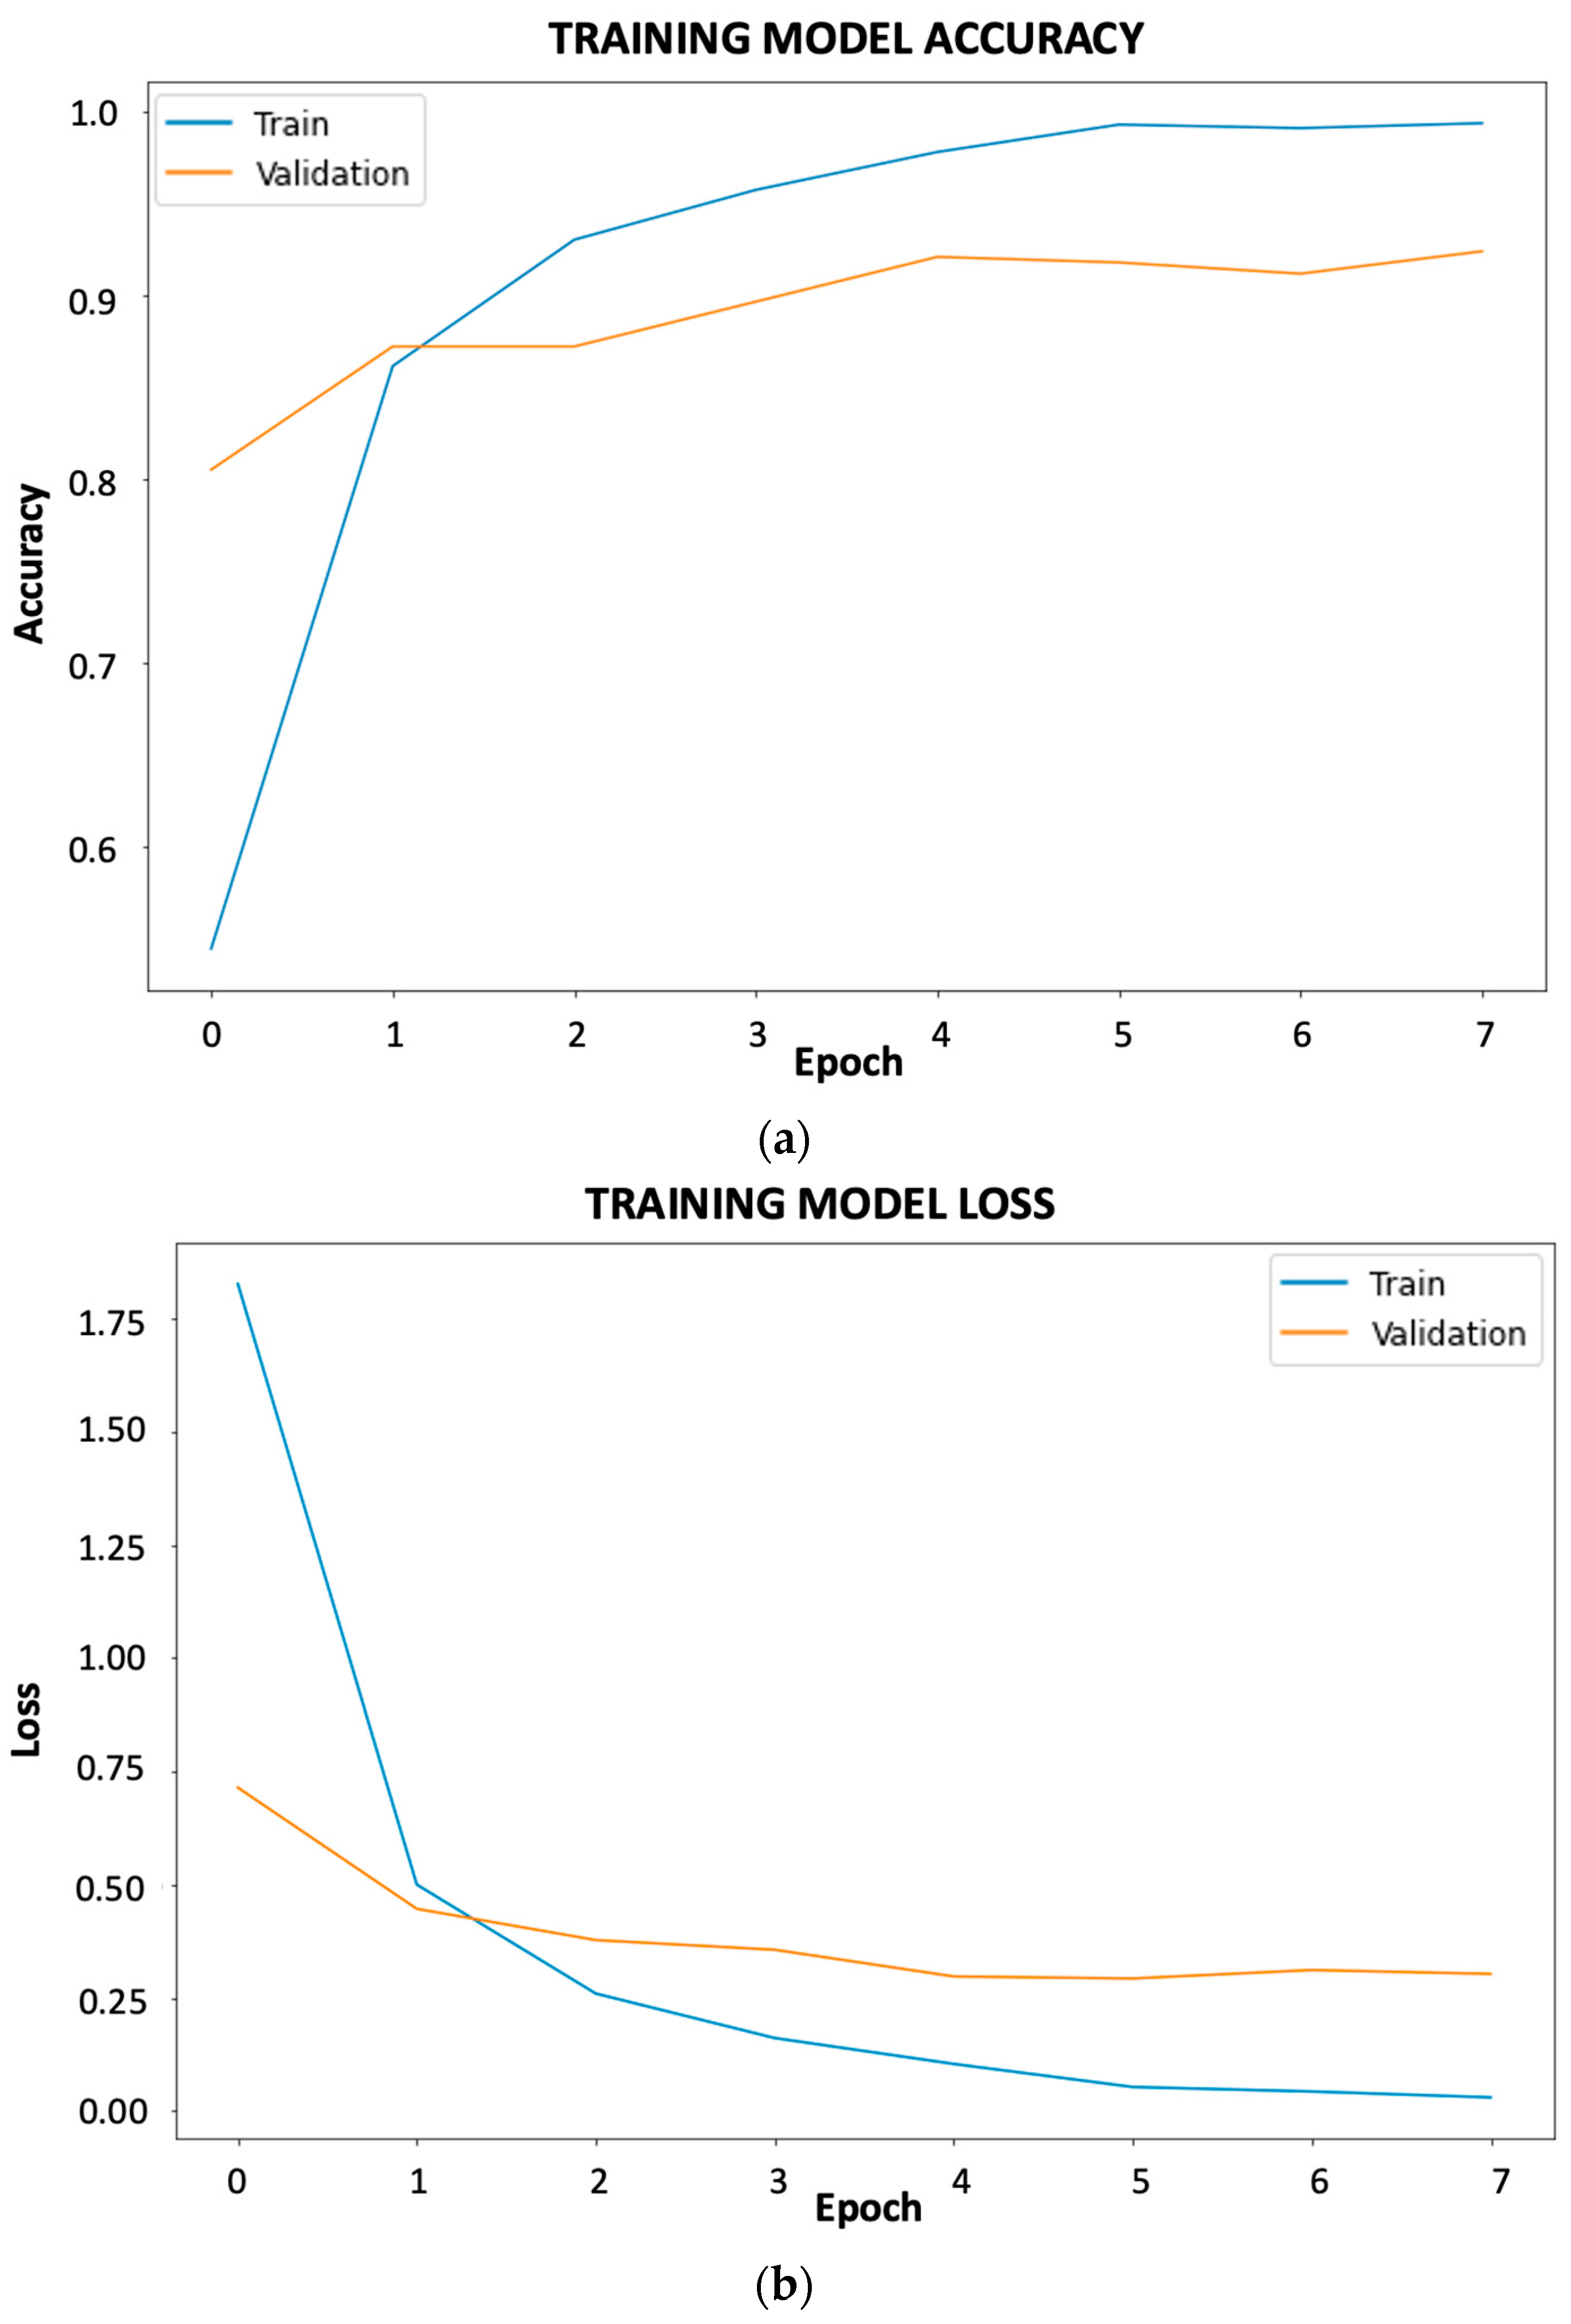
As can be seen in Figure 5, both the accuracy and loss curves show that there is no overfitting or underfitting as they continue up and down, respectively. At this stage, an early stopping condition was implemented with the parameters that the algorithm stops if the accuracy and loss do not improve. This ensures that the following phenomena do not occur.
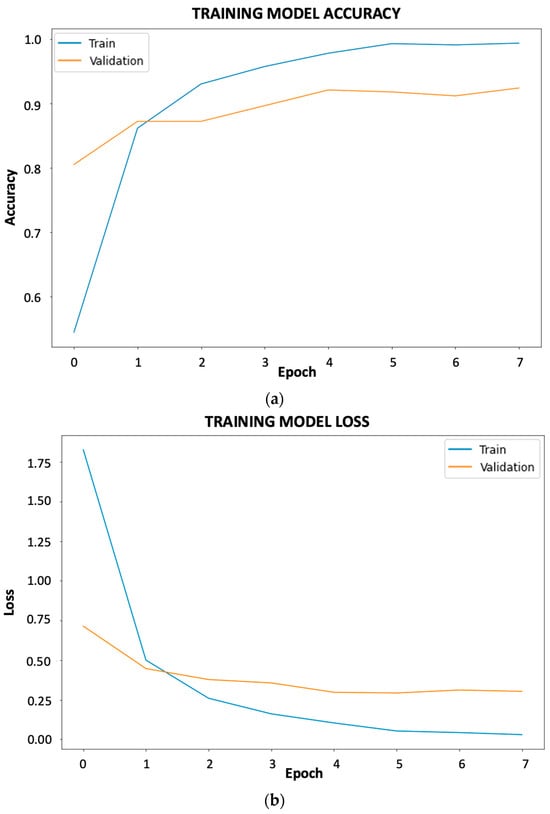
Figure 5.
Accuracy and loss curves of the best results for fruit and vegetable classification: (a) accuracy; (b) loss.
4.2. Fruit and Vegetable Stage of Ripeness
For the second model, which represents the detection of the stage of ripeness, transfer learning was also performed using the weights of MobileNetV2 and InceptionV2. In this case, three experiments were performed because the final metrics were acceptable. Table 4 shows the results and some hyperparameters used for training.
Table 4.
Results of fruit and vegetable ripening models.
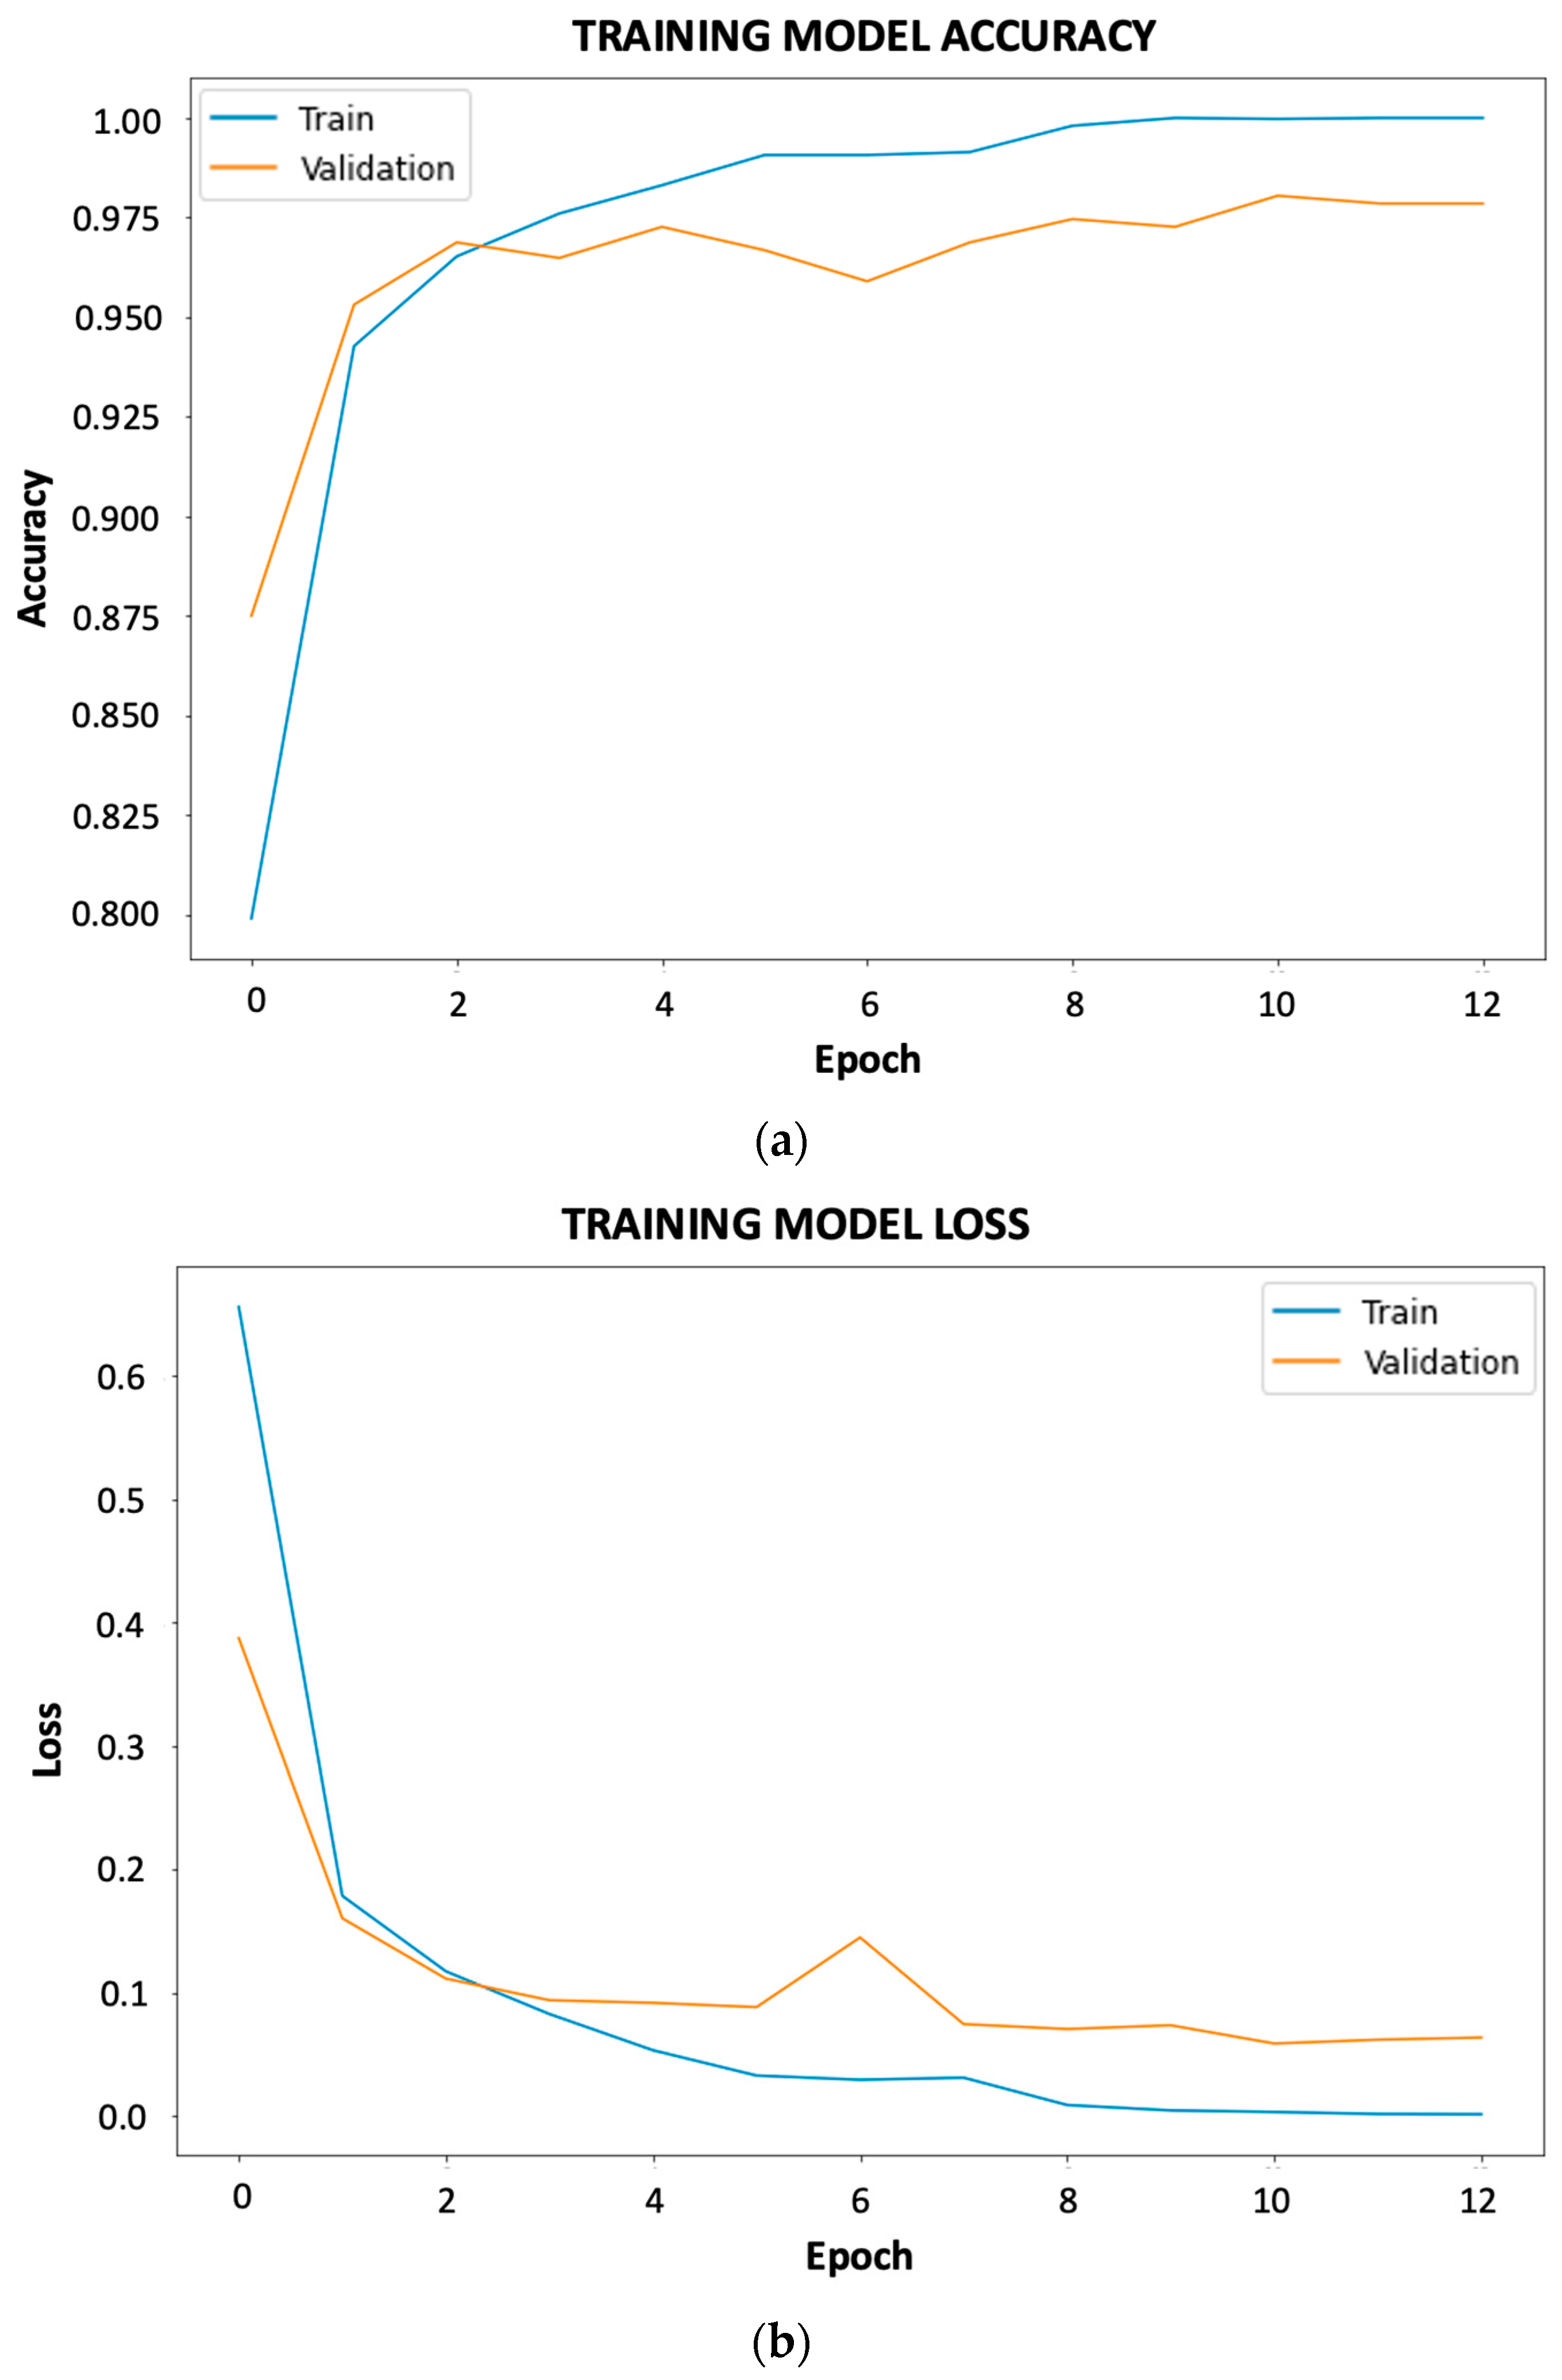
Analyzing the results obtained, it is observed that higher accuracy is obtained only by tenths in the second training with MobileNetV2, but that the execution time was much higher compared to the training with InceptionNetV2. Also, it does not present overfitting or underfitting these by analyzing Figure 6.
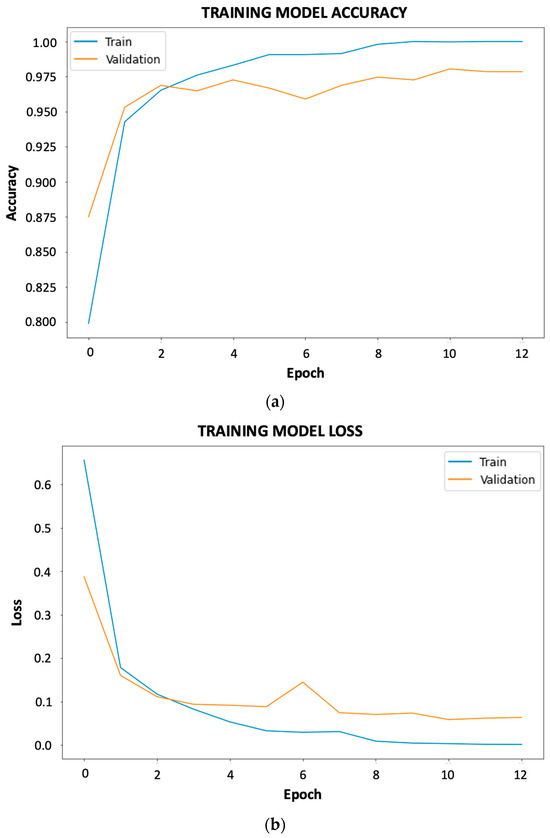
Figure 6.
Accuracy and loss curves of the best results for fruit and vegetable ripeness: (a) accuracy; (b) loss.
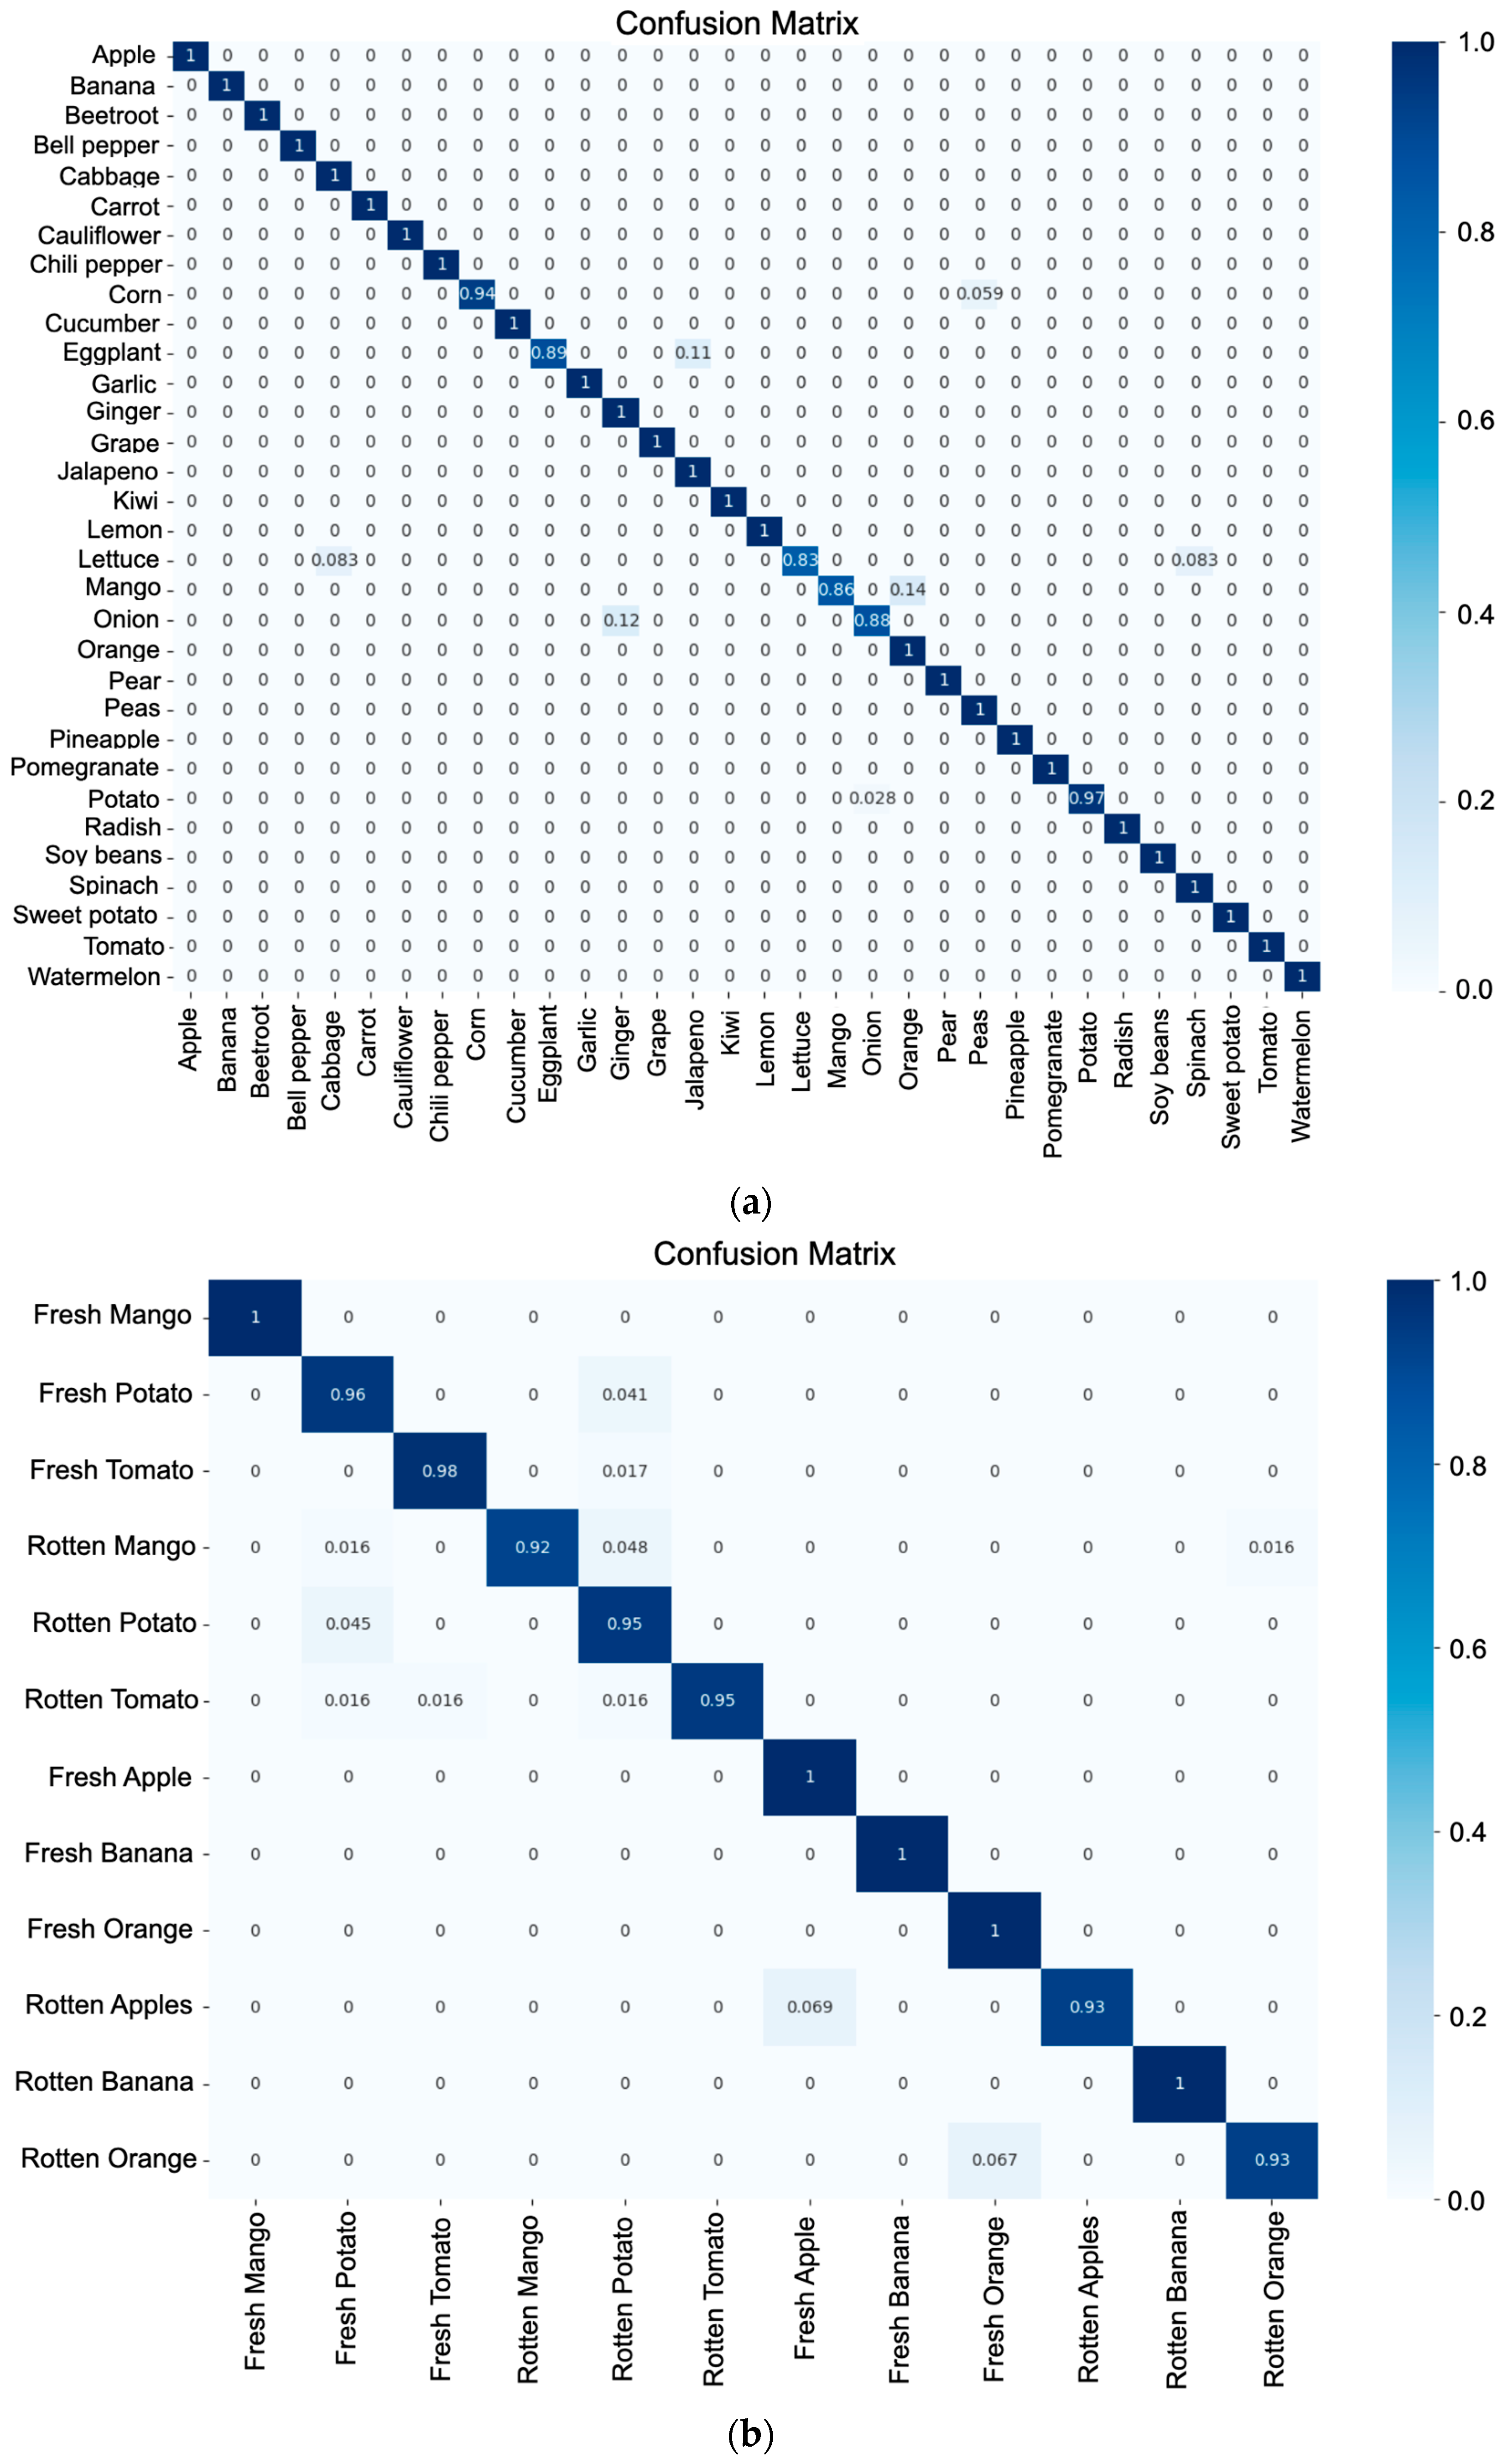
Figure 7 shows the confusion matrices for both model 1 (a) and model 2 (b). For the case of (a), a high index of good classification is shown for each of the classes of fruits and vegetables, indicating that 26 of the classes are correctly predicted, and the rest of them are above 83% of the correct classification of the total of the samples for each class. For the specific case of (b), 5 classes show a classification rate of 100%, while the rest are above 93%.
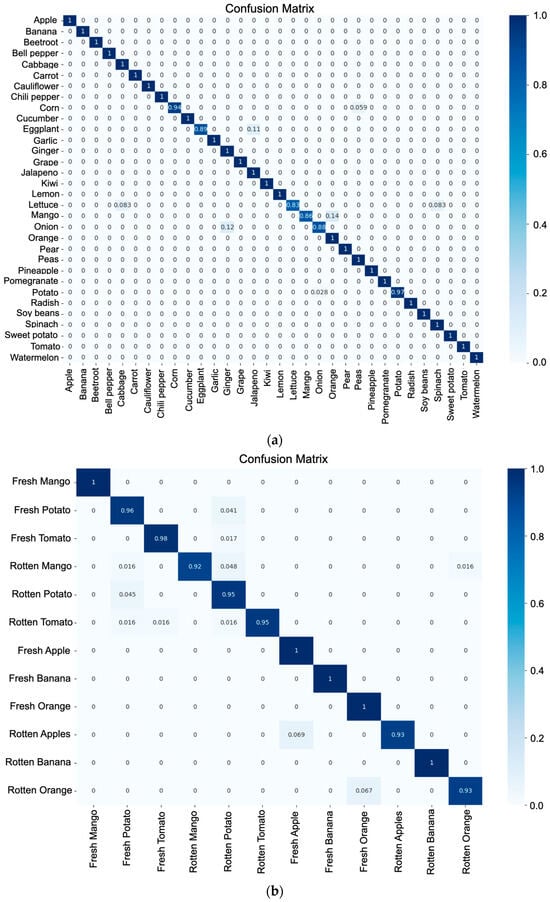
Figure 7.
Confusion matrix: (a) classification of fruits and vegetables; (b) stage of ripeness.
4.3. Inference
Inference is a powerful tool that allows machines to reason and learn from experience. It is a critical process in many AI applications and is one of the key ingredients that makes AI possible. In computer vision or deep learning, inference is used to identify objects in images and videos. For example, a machine can use inference to identify a person in a crowd, recognize a traffic sign, or in the case of this study, identify fruits and vegetables and their ripeness. In Figure 8, it can be seen some of the results obtained in the context of inference on data with the models already trained. In the upper part, the recognition of some fruits and vegetables and their state of ripeness is observed, while in the lower part, only the recognition of the fruit or vegetable is shown. This is because the CNN has been trained to detect only the ripeness of some fruits and vegetables.
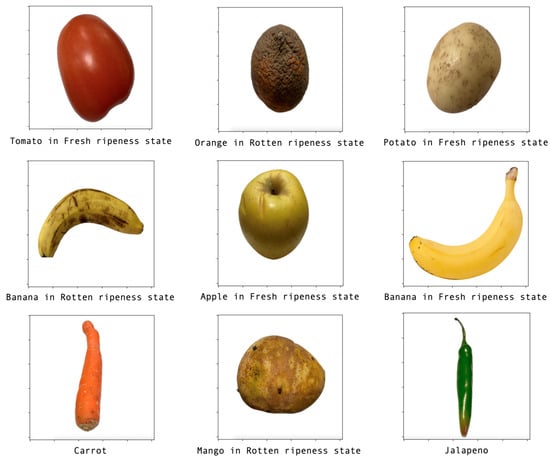
Figure 8.
Results obtained with inference.
4.4. Metrics Obtained
In the case of fruit and vegetable ripeness detection, it is important to consider the four metrics of accuracy, precision, recall, and F1-score when evaluating the performance of the model. The metrics obtained in models 1 and 2 are shown in Table 5.
Table 5.
Metrics of the best models.
The metrics obtained for fruit, vegetable, and ripeness classification show that the performance of both models is good. To evaluate the performance of the model, it is necessary to compare each of the metrics shown in Table 4. Comparing the metrics of the classification of fruits and vegetables model, it can be appreciated that no exists a huge difference between the four metrics, which shows that the model generalized very well, and it is able to make the main function of detection fruits and vegetables. It is the same case for the ripeness stage detection model.
5. Discussion
The results show that good training is performed, as indicated by the reported metrics such as accuracy and loss, but there is room for improvement that can be generated from the input data. Solutions include increasing the number of images per class, which can help the model better understand the different variations in each category and be more resilient to noise and outliers. It may also be useful to have a more diverse dataset consisting of images from a wider range of sources with different backgrounds, lighting conditions, and other factors. Another alternative would be to use data augmentation, where new training samples can be generated by transformations such as cropping, flipping, or rotating. The graphs shown do not show undertraining or overtraining, as the curves were generated from the training and validation samples. The data was split 80-10-10, with 80% for training, 10% for validation, and 10% for testing. It should be noted that given the architecture related to the classification of objects, the algorithm is not able to identify more than one object for each inference; this can be solved by modifying the architecture of the network by a network of type object detection. In addition, more variables can be added to detect, such as a wider range in the spectrum of ripening identification and ripening states to fruits and vegetables that do not contain them, among others.
Table 6 shows comparisons related to the classification of fruits and vegetables as well as the determination of ripeness. According to the table, there is a better performance compared to the authors mentioned. It should be noted that the system in general consists of two algorithms, but they were trained separately and therefore two different metrics are reported.
Table 6.
Comparative analysis of different methodologies applied for classification and ripeness of fruits and vegetables.
As can be seen, the reference [38] shows better accuracy than ours, reporting 99.79%. The reason for this is that our model has 32 classes and the input images for the model have a size of 512 × 512 pixels. In the reference mentioned above, the input images are 100 × 100 pixels in size, and this helps to increase the accuracy, but probably does not do a good job of making inferences.
According to the results and comparison with other methods, the proposed system could be applied in various fields, such as agriculture, where farmers can use this system to identify the ideal harvesting time, which can improve yields and minimize waste. Similarly, food processors can use this system to ensure that their products are processed at the optimal ripening time. In the retail sector, the system has the potential to improve quality and safety by identifying and discarding overripe produce and allowing customers to select the best-conditioned fruits and vegetables from store shelves, thereby reducing food waste. On the other hand, the proposed methodology could be taken as a basis for other types of applications, but it would be necessary to evaluate whether the models proposed in this work are the ones that present the best performance to solve the problem to be addressed, in addition to obtaining the best hyperparameters, as well as having a robust database for training, validation, and testing.
Despite the results, there are some limitations; for example, only some classes of fruits and vegetables have data on ripening, and for this reason, models can be improved by adding more classes of ripening states to the rest of fruits and vegetables where the ripening state is not detected. The dataset provides information for only certain types of fruits and vegetables. This constraint is prevalent in several AI models as gathering data for all classes can be challenging and costly. Hence, the model may not precisely recognize the ripeness of fruits and vegetables excluded from the dataset. Performance could be improved by making changes to the hyperparameters, but this depends on the nature of the problem. Tuning the hyperparameters could enhance the model’s performance and this could be made with optimization algorithms, such as genetic (GA) and swarm intelligence (SI). Also, the general methodology uses two AI models, one to recognize thirty-two categories of fruits and vegetables, and another model to assess the ripeness of six of the categories. One of the improvements of the system would be to unify in a single model both the classification between fruits and vegetables and the identification of the ripeness stage. On the other hand, the system is not able to detect damaged, obstructed or poorly illuminated fruits and vegetables. Future research will take these points into account in order to create a robust system. Finally, this work can only detect one fruit or vegetable per inference. Therefore, it is necessary to develop a system that allows the detection of more than one element per inference, achieving a more robust system. As part of future work, enhancing the model’s performance could involve integrating real-time inference capabilities. This will enable the model to be used in real-world applications, including sorting and grading on farms and quality control in stores. Additionally, incorporating sensors such as hyperspectral and near-infrared cameras could enhance the model’s performance. These devices can provide additional information on the chemical composition and structural characteristics of fruits and vegetables.
6. Conclusions
Food waste will always be a problem to be considered and solved with the help of current technologies, such as AI. Certainly, awareness must come from everyone and try to contribute to the reduction of the current percentages of food waste worldwide. Undoubtedly, the creation of models such as the one presented above contributes to the solution. For both algorithms that make up the system in general, high metrics are reported, so it can be concluded that it is a robust system. The results show, for the classification of fruits and vegetables, 97.86% accuracy, 98% precision, 98% recall, and 98% F1-score, and for the ripeness assessment, the results show 100% accuracy, 98% precision, 99% recall, and 99% F1-score. It should be noted that there is no other model capable of detecting 32 types of fruits and vegetables and assessing their ripeness. The use of transfer learning to train neural network models with many classes is advantageous because it generates high metrics and reduces computational costs. It can be mentioned that deep learning generally uses only one model to obtain results like the problem solved in this research; however, in this case, the remarkable contribution is the design and development of a general intelligent system based on two Convolutional Neural Networks trained separately and that the finally trained models are brought together in a single algorithm to generate the outputs as shown in this paper.
Author Contributions
Conceptualization, E.T.-M., L.A.M.-H. and I.A.C.-A.; methodology, E.T.-M., L.A.M.-H. and I.A.C.-A.; software, E.T.-M.; validation, L.A.M.-H., S.T.-A. and I.A.C.-A.; formal analysis, all authors; research, E.T.-M. and L.A.M.-H.; resources, L.A.M.-H. and I.A.C.-A.; data curation, E.T.-M., L.A.M.-H. and I.A.C.-A.; writing—preparation of the original draft, all authors; drafting—revising and editing, all authors; visualization, E.T.-M. and L.A.M.-H.; supervision, L.A.M.-H., S.T.-A. and I.A.C.-A.; project management, L.A.M.-H. and I.A.C.-A. All authors have read and agreed to the published version of the manuscript.
Funding
This research received no external funding.
Institutional Review Board Statement
This study was approved on 9 March 2020 by the Bioethics Committee of the Faculty of Engineering of the Autonomous University of Queretaro with registration code CEAIFI-021-2022-TP.
Informed Consent Statement
Not applicable.
Data Availability Statement
The database and code may be made available for use upon prior request and approval of the authors. The data are not publicly available due to privacy.
Acknowledgments
The first author would like to thank the National Council of Humanities, Science, and Technology for the scholarship given.
Conflicts of Interest
The authors declare no conflict of interest.
References
- Kyriacou, M.C.; Rouphael, Y. Towards a new definition of quality for fresh fruits and vegetables. Sci. Hortic. 2018, 234, 463–469. [Google Scholar] [CrossRef]
- Moreno, J.L.; Tran, T.; Cantero-Tubilla, B.; López-López, K.; Becerra López Lavalle, L.A.; Dufour, D. Physicochemical and physiological changes during the ripening of Banana (Musaceae) fruit grown in Colombia. Int. J. Food Sci. Technol. 2021, 56, 1171–1183. [Google Scholar] [CrossRef] [PubMed]
- Maduwanthi, S.D.T.; Marapana, R. Biochemical changes during ripening of banana: A review. Int. J. Food Sci. Nutr. 2017, 2, 166–169. [Google Scholar]
- Bhargava, A.; Bansal, A. Fruits and vegetables quality evaluation using computer vision: A review. J. King Saud Univ. Comput. Inf. Sci. 2021, 33, 243–257. [Google Scholar] [CrossRef]
- Kurtulmus, F.; Lee, W.S.; Vardar, A. Immature peach detection in colour images acquired in natural illumination conditions using statistical classifiers and neural network. Precis. Agric. 2014, 15, 57–79. [Google Scholar] [CrossRef]
- Gongal, A.; Amatya, S.; Karkee, M.; Zhang, Q.; Lewis, K. Sensors and systems for fruit detection and localization: A review. Comput. Electron. Agric. 2015, 116, 8–19. [Google Scholar] [CrossRef]
- Vignati, S.; Tugnolo, A.; Giovenzana, V.; Pampuri, A.; Casson, A.; Guidetti, R.; Beghi, R. Hyperspectral Imaging for Fresh-Cut Fruit and Vegetable Quality Assessment: Basic Concepts and Applications. Appl. Sci. 2023, 13, 9740. [Google Scholar] [CrossRef]
- Lorente, D.; Aleixos, N.; Gómez-Sanchis, J.; Cubero, S.; García-Navarrete, O.L.; Blasco, J. Recent Advances and Applications of Hyperspectral Imaging for Fruit and Vegetable Quality Assessment. Food Bioprocess Technol. 2012, 5, 1121–1142. [Google Scholar] [CrossRef]
- Song, Z.; Fu, L.; Wu, J.; Liu, Z.; Li, R.; Cui, Y. Kiwifruit detection in field images using Faster R-CNN with VGG16. IFAC-PapersOnLine 2019, 52, 76–81. [Google Scholar] [CrossRef]
- Wan, S.; Goudos, S. Faster R-CNN for multi-class fruit detection using a robotic vision system. Comput. Netw. 2020, 168, 107036. [Google Scholar] [CrossRef]
- Chu, P.; Li, Z.; Lammers, K.; Lu, R.; Liu, X. Deep learning-based apple detection using a suppression mask R-CNN. Pattern Recognit. Lett. 2021, 147, 206–211. [Google Scholar] [CrossRef]
- Sun, M.; Xu, L.; Luo, R.; Lu, Y.; Jia, W. GHFormer-Net: Towards more accurate small green apple/begonia fruit detection in the nighttime. J. King Saud Univ. Comput. Inf. Sci. 2022, 34, 4421–4432. [Google Scholar] [CrossRef]
- Przybył, K.; Gawrysiak-Witulska, M.; Bielska, P.; Rusinek, R.; Gancarz, M.; Dobrzański, B., Jr.; Siger., A. Application of Machine Learning to Assess the Quality of Food Products—Case Study: Coffee Bean. Appl. Sci. 2023, 13, 10786. [Google Scholar] [CrossRef]
- Cubero, S.; Aleixos, N.; Moltó, E.; Gómez-Sanchis, J.; Blasco, J. Advances in Machine Vision Applications for Automatic Inspection and Quality Evaluation of Fruits and Vegetables. Food Bioprocess Technol. 2011, 4, 487–504. [Google Scholar] [CrossRef]
- Ismail, N.; Malik, O.A. Real-time visual inspection system for grading fruits using computer vision and deep learning techniques. Inf. Process. Agric. 2021, 9, 24–37. [Google Scholar] [CrossRef]
- Fahad, L.G.; Tahir, S.F.; Rasheed, U.; Saqib, H.; Hassan, M.; Alquhayz, H. Fruits and Vegetables Freshness Categorization Using Deep Learning. Comput. Mater. Contin. 2022, 71, 5083–5098. [Google Scholar] [CrossRef]
- Roy, K.; Chaudhuri, S.S.; Pramanik, S. Deep learning based real-time Industrial framework for rotten and fresh fruit detection using semantic segmentation. Microsyst. Technol. 2021, 27, 3365–3375. [Google Scholar] [CrossRef]
- Ananthanarayana, T.; Ptucha, R.; Kelly, S.C. Deep Learning based Fruit Freshness Classification and Detection with CMOS Image sensors and Edge processors. IS T Int. Symp. Electron. Imaging Sci. Technol. 2020, 2020, 172-1–172-7. [Google Scholar] [CrossRef]
- Chen, M.C.; Cheng, Y.T.; Liu, C.Y. Implementation of a Fruit Quality Classification Application Using an Artificial Intelligence Algorithm. Sens. Mater. 2022, 34, 151–162. [Google Scholar] [CrossRef]
- Zargham, A.; Haq, I.U.; Alshloul, T.; Riaz, S.; Husnain, G.; Assam, M.; Ghadi, Y.Y.; Mohamed, H.G. Revolutionizing Small-Scale Retail: Introducing an Intelligent IoT-based Scale for Efficient Fruits and Vegetables Shops. Appl. Sci. 2023, 13, 8092. [Google Scholar] [CrossRef]
- Fan, S.; Li, J.; Zhang, Y.; Tian, X.; Wang, Q.; He, X.; Zhang, C.; Huang, W. On line detection of defective apples using computer vision system combined with deep learning methods. J. Food Eng. 2020, 286, 110102. [Google Scholar] [CrossRef]
- Bhargava, A.; Bansal, A. Classification and Grading of Multiple Varieties of Apple Fruit. Food Anal. Methods 2021, 14, 1359–1368. [Google Scholar] [CrossRef]
- Zhang, Y.; Gao, J.; Zhou, H. Breeds Classification with Deep Convolutional Neural Network. In Proceedings of the 2020 12th International Conference on Machine Learning and Computing, Shenzhen, China, 15–17 February 2020; pp. 145–151. [Google Scholar] [CrossRef]
- Lecun, Y.; Bengio, Y.; Hinton, G. Deep learning. Nature 2015, 521, 436–444. [Google Scholar] [CrossRef]
- Fernández, M.A.A. Inteligencia Artificial Para Programadores Con Prisa, 2nd ed.; Universo de letras: Sevilla, Spain, 2021. [Google Scholar]
- Zhang, E. Fruit Classification. Kaggle. Available online: https://www.kaggle.com/datasets/sshikamaru/fruit-recognition (accessed on 1 March 2022).
- Reddy, S. Fruits Fresh and Rotten for Classification. Kaggle. Available online: https://www.kaggle.com/datasets/sriramr/fruits-fresh-and-rotten-for-classification (accessed on 1 March 2022).
- Mukhiddinov, M. Fruits and Vegetables Dataset. Kaggle. Available online: https://www.kaggle.com/datasets/muhriddinmuxiddinov/fruits-and-vegetables-dataset (accessed on 1 March 2022).
- Sandler, M.; Howard, A.; Zhu, M.; Zhmoginov, A.; Chen, L.C. MobileNetV2: Inverted Residuals and Linear Bottlenecks. In Proceedings of the 2018 IEEE/CVF Conference on Computer Vision and Pattern Recognition, Salt Lake City, UT, USA, 18–23 June 2018; pp. 4510–4520. [Google Scholar] [CrossRef]
- Unay, D.; Gosselin, B. Automatic defect segmentation of ‘Jonagold’ apples on multi-spectral images: A comparative study. Postharvest Biol. Technol. 2006, 42, 271–279. [Google Scholar] [CrossRef]
- Zhu, B.; Jiang, L.; Luo, Y.; Tao, Y. Gabor feature-based apple quality inspection using kernel principal component analysis. J. Food Eng. 2007, 81, 741–749. [Google Scholar] [CrossRef]
- Ranjit, K.N.; Raghunandan, K.S.; Naveen, C.; Chethan, H.K.; Sunil, C. Deep Features Based Approach for Fruit Disease Detection and Classification. Int. J. Comput. Sci. Eng. 2019, 7, 810–817. [Google Scholar] [CrossRef]
- Zhang, Y.D.; Dong, Z.; Chen, X.; Jia, W.; Du, S.; Muhammad, K.; Wang, S.H. Image based fruit category classification by 13-layer deep convolutional neural network and data augmentation. Multimed. Tools Appl. 2019, 78, 3613–3632. [Google Scholar] [CrossRef]
- Dubey, S.R.; Jalal, A.S. Apple disease classification using color, texture and shape features from images. Signal Image Video Process. 2016, 10, 819–826. [Google Scholar] [CrossRef]
- Kim, D.G.; Burks, T.F.; Qin, J.; Bulanon, D.M. Classification of grapefruit peel diseases using color texture feature analysis. Int. J. Agric. Biol. Eng. 2009, 2, 41–50. [Google Scholar] [CrossRef]
- Arakeri, M.P. Lakshmana Computer Vision Based Fruit Grading System for Quality Evaluation of Tomato in Agriculture industry. Procedia Comput. Sci. 2016, 79, 426–433. [Google Scholar] [CrossRef]
- Jahanbakhshi, A.; Momeny, M.; Mahmoudi, M.; Zhang, Y.D. Classification of sour lemons based on apparent defects using stochastic pooling mechanism in deep convolutional neural networks. Sci. Hortic. 2020, 263, 109133. [Google Scholar] [CrossRef]
- Sakib, S.; Ashrafi, Z.; Siddique, M.A.B. Implementation of Fruits Recognition Classifier Using Convolutional Neural Network Algorithm for Observation of Accuracies for Various Hidden Layers. arXiv 2019, arXiv:1904.00783. [Google Scholar]
- Hossain, M.S.; Al-Hammadi, M.; Muhammad, G. Automatic Fruit Classification Using Deep Learning for Industrial Applications. IEEE Trans. Ind. Inform. 2019, 15, 1027–1034. [Google Scholar] [CrossRef]


Disclaimer/Publisher’s Note: The statements, opinions and data contained in all publications are solely those of the individual author(s) and contributor(s) and not of MDPI and/or the editor(s). MDPI and/or the editor(s) disclaim responsibility for any injury to people or property resulting from any ideas, methods, instructions or products referred to in the content. |
© 2023 by the authors. Licensee MDPI, Basel, Switzerland. This article is an open access article distributed under the terms and conditions of the Creative Commons Attribution (CC BY) license (https://creativecommons.org/licenses/by/4.0/).