Abstract
In recent decades, cellular metallic materials have increasingly been used for control of reverberation and cutback. These materials offer a unique combination of expanded pores, high specific surfaces, improved structural performance, low weight, corrosion resistance at high temperatures, and a fixed/rigid pore network (i.e., at the boundaries, porosity does not change). This study examines the ability of sphere-packing models combined with numerical modelling and simulations to predict the acoustic properties of bimodal and modulated bottleneck-shaped macroporous structures that can realistically be achieved through liquid melts infiltration casting technique. The simulations show that porosity, openings, pore sizes and permeability of the material have significant effects on acoustics, and the predictions are consistent with experimental data substantiated in the literature. The modelling suggests that the creation of bimodal structures increases the capacity of the interstitial pores and pore contacts. The result is improved sound absorption properties and spectra, characterised by a pore volume fraction of 0.73 and a mean pore size to mean pore opening ratio of 4.8 for the 50% volume bimodal structure created at a 10 µm capillary radius. The importance of how pore structure-related parameters and existing fluid flow regimes can modulate the sound absorption performance of macroporous structures was revealed by numerical simulations of the sound absorption spectra for dual-porosity and dilated macroporous structures working from high-resolution tomography datasets. Sound absorption properties were optimised for structures having pore volume fractions between 0.68 and 0.76, maintaining the mean pore size to mean pore opening ratios between 4.0 and 6.0. Using this approach, enhanced and self-supporting macroporous structures may be designed and fabricated for efficient sound absorption in specific applications.
1. Introduction
According to the World Health Organization (WHO), high levels of noise are associated with long-term health problems [1] such as hypertension, hearing loss, sleep disturbance, child development, dementia, and psychological disorders. Considering these negative consequences of noise pollution, it is imperative that environmental noise pollution be kept below 60 dB as dictated by the UK’s Environmental Protection Act of 1997 and the WHO’s environmental noise prevention act [1]. This may also mean working within the context of the 2030 United Nations Sustainable Development Goals (SDGs)—targeting good health and well-being of the human population [Goal 3], sustainable cities and communities [Goal 11] and climate action [Goal 13]. Soundproofing devices ranging from natural (wool, asbestos, hemp, flax, etc.) to man-made (polyurethane, polyester, melamine, polyethylene, etc.) materials have already been prescribed [2,3,4,5,6,7,8,9], however, potential excellent candidate materials should be capable of withstanding high temperatures, high pressures, and impact loads, as well as stand the test of time. As a result, manipulation of macroporous material pore networks, shapes, and sizes could lead to the development of optimum vibroacoustic systems capable of significantly reducing excessive noise along with the advantages of being ultra-light, fixed morphologies, with high Young modulus, environmentally friendly materials, as well as recyclable.
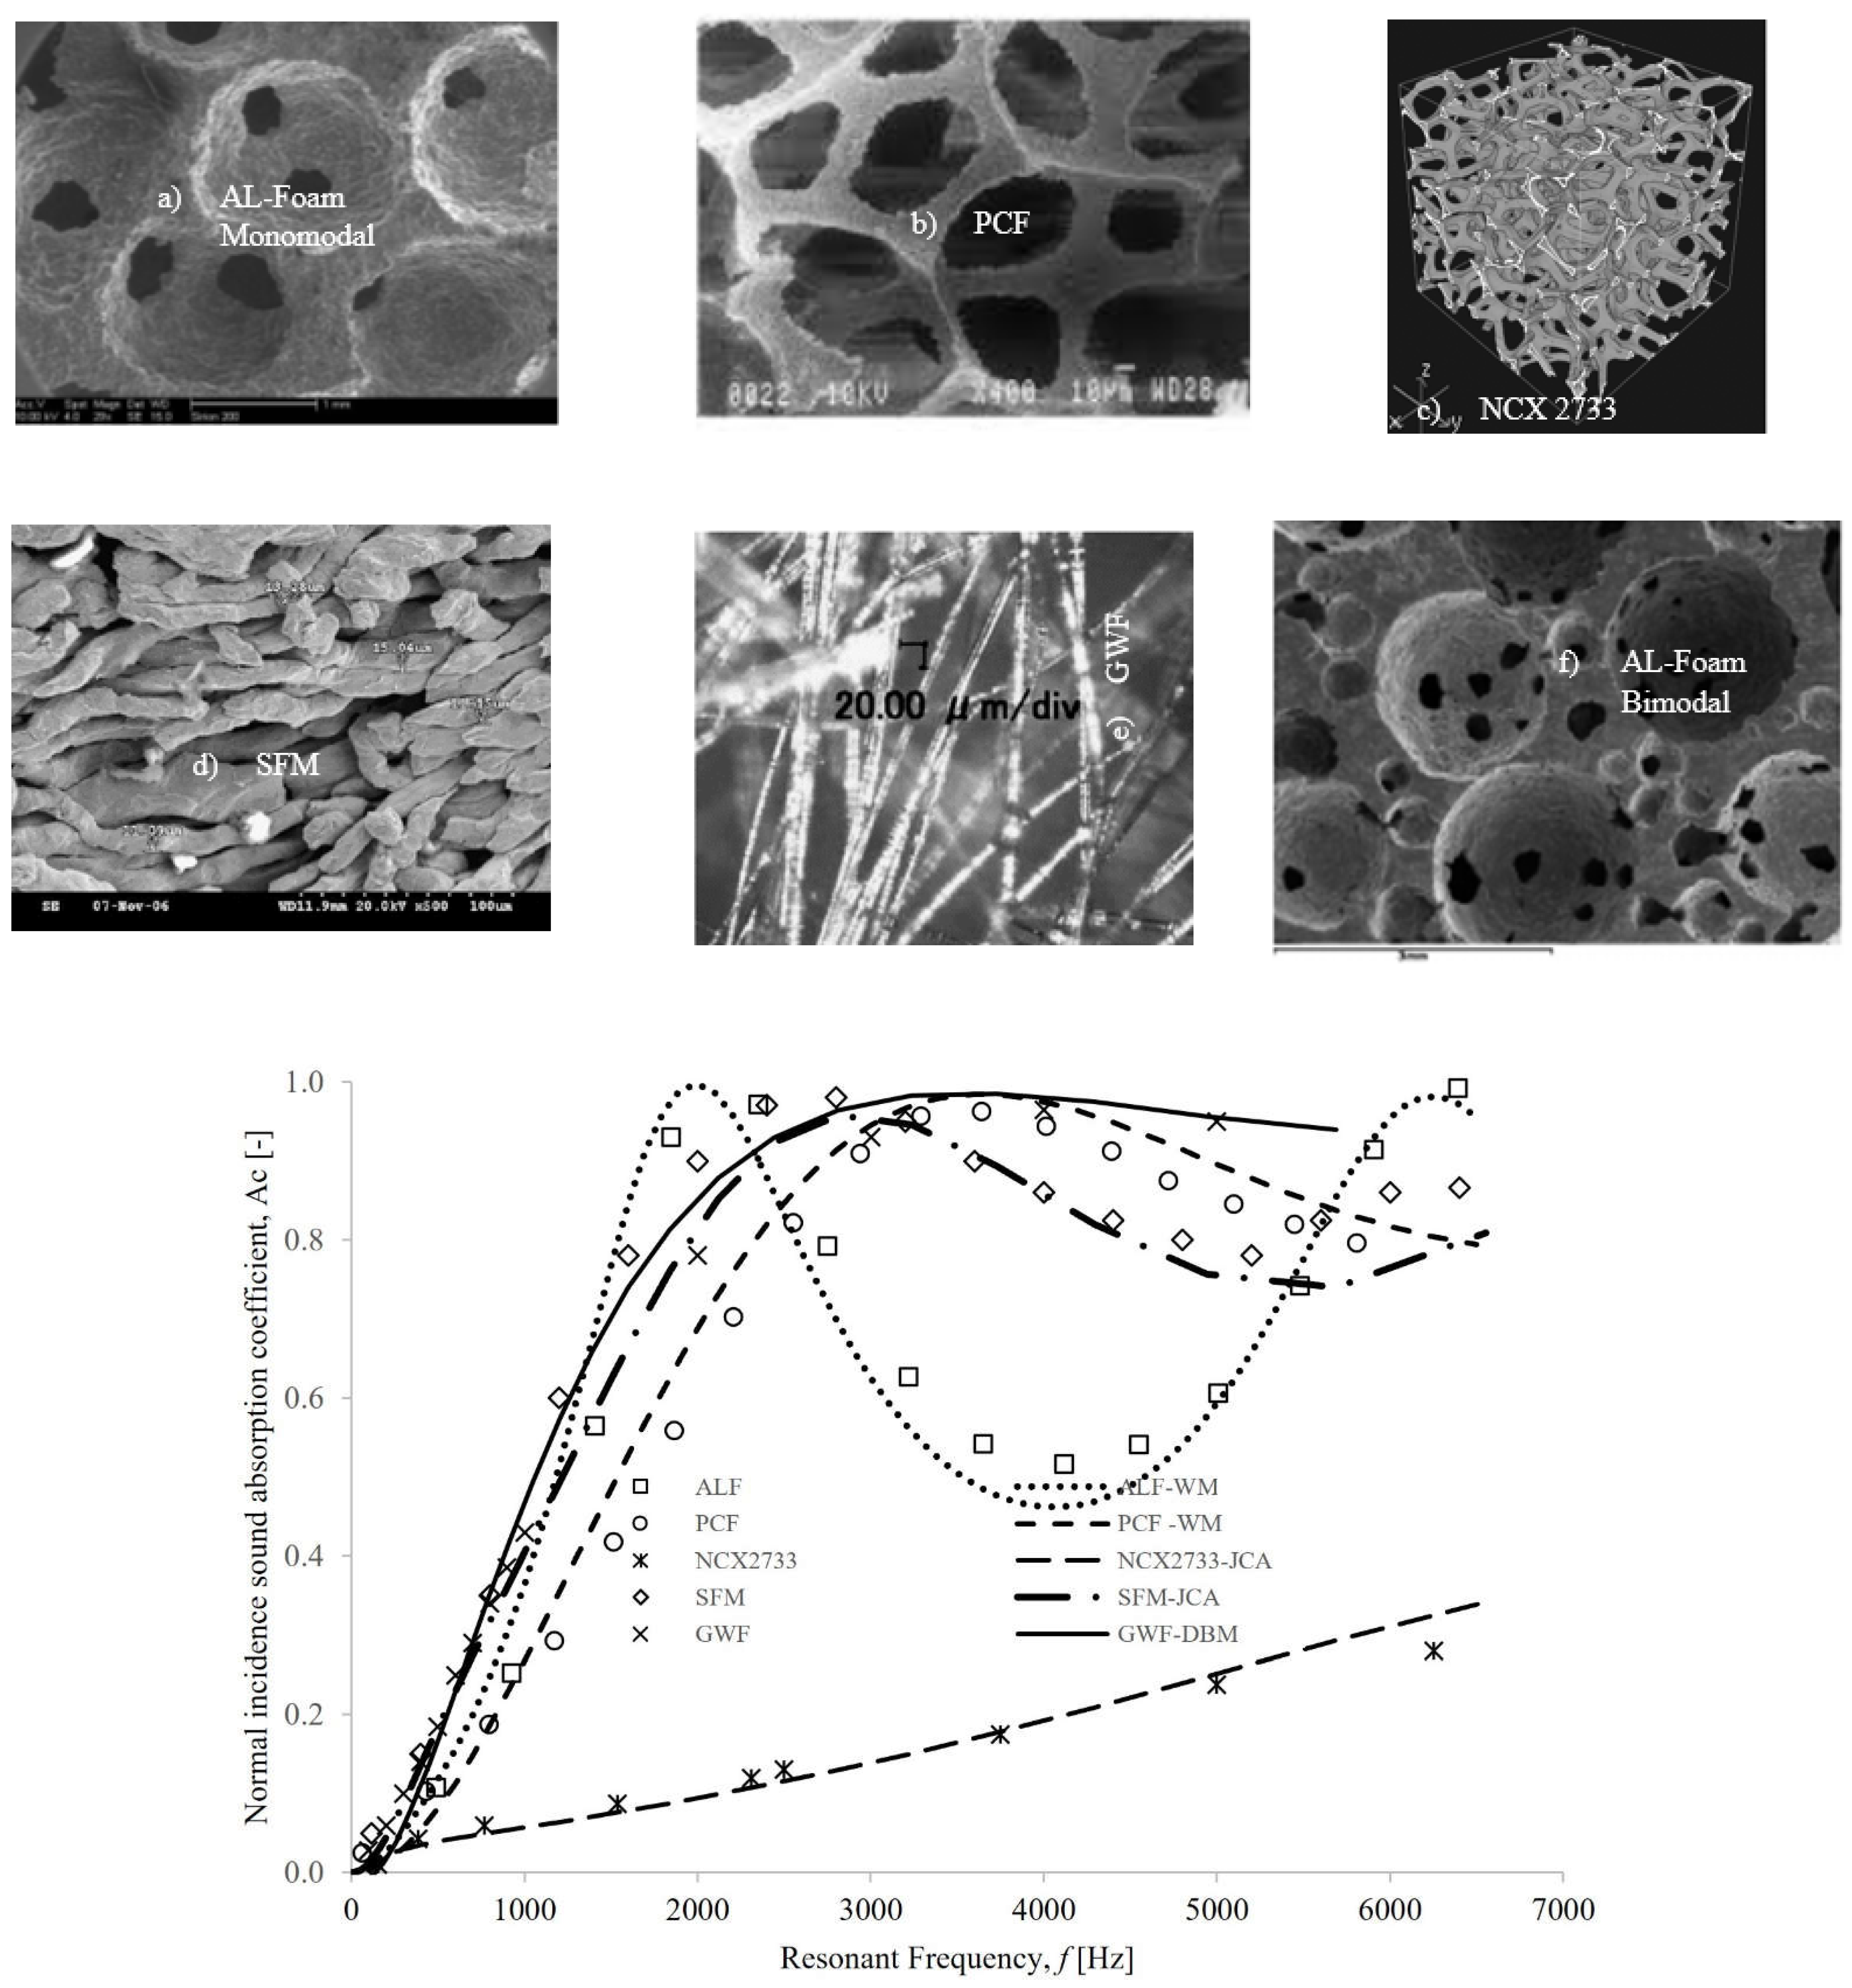
The term soundproofing material has always been used to describe those materials that have been either used in their naturally occurring phenomena or artificially replicated to provide optimum pressure wave penetration and absorption. Lu et al. [10] conducted an experimental study on the sound absorption performance of Alporas foams that suggested the use of cellular metallic components as a potential barrier to noise and vibration control. Their research revealed that compression force and mechanical holes—the drilling of these foams affects their relative densities and pore-structure-related information, and the result is a shift in sound absorption spectra to either frequency minima or maxima. In the absence of a back cavity (air-gap), Han et al. [11] found that aluminium foams with relatively small mean pore sizes (500 µm) exhibited the highest quarter-wavelength layer peak in resonant when compared to structures with larger pore sizes. Liu and Chen [12] concluded that soundproofing metal foam has a higher sound absorption coefficient in the presence of a back cavity and, by extension, when the material is thicker. According to experimental measurements over negatively-infiltration processed aluminium foams, airflow resistance (ratio of fluid dynamic viscosity to the permeability of the porous structure) accounted for the major influence on the shift in their absorption spectra [3]. Studying the sound absorption spectra over Recemat NCX2733 revealed that this material performed poorly in comparison to several other soundproofing materials, such as bottleneck-type aluminium foam (ALF) [3,13,14], polyhedral ceramic foam (PCF) [14,15,16], sintered fibre metal (SFM) [6] and glass wool fibre (GWF) [7]. Figure 1 displays such plots of the experimentally determined and numerically simulated (to be discussed later) normal incidence sound absorption spectra against resonance frequency for these materials. Recemat NCX2733’s poor performance was attributable to the combination of excessive pore openings, pore volume, and reduced ligament orientations, which had the effect of reducing successive back cavities [13,17] that could potentially affect sound absorption within the material. Thus, it is likely that technological variability and operating conditions used for the processing of porous metallic components will affect their application as soundproofing devices. Table 1 presents measurements of pore-structure information used to determine how the sound absorption spectra for these materials can be numerically derived (to be discussed later).
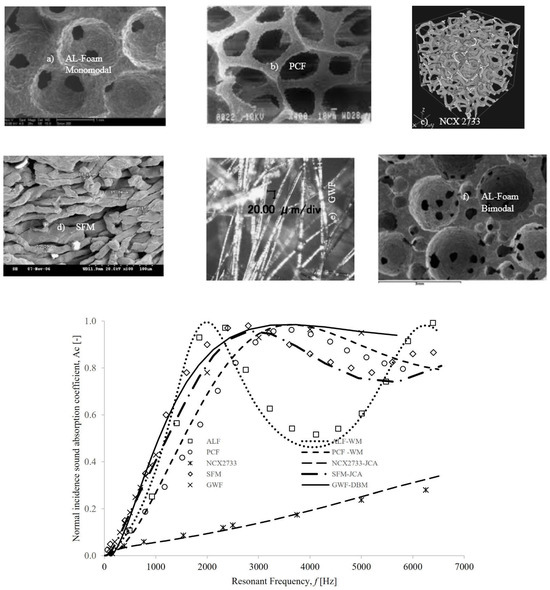
Figure 1.
Above the plots of normal and numerically simulated normal incidence sound absorption coefficient, Ac [–] against resonant frequency are images of several soundproofing materials: (a) porous aluminium foam (ALF) [3], (b) polyhedral ceramic foam (PCF) [14,15,16], (c) nickel-chrome extra-strong NCX2733 [13], (d) sintered fibre metal (SFM) [6], (e) glass wool fibre (GWF) [7] and (f) bimodal aluminium foam (BAF) [18].

Table 1.
Tabular representation of measured pore-structure-related information for several soundproofing materials.
A substantial amount of literature exists containing empirical, phenomenological, and semi-phenomenological models of soundproofing materials’ acoustical properties. For example, Zwikker and Kosten [19] proposed equivalent fluid models to describe the vibroacoustic behaviour of elastic porous materials and have been in use for many decades. The coupling coefficients of the models in [19] were improved in order to better approximate pressure waves inside cellular matrices [20]. Other predictive models [21,22,23,24,25,26,27,28] have been developed for describing the sound absorption properties of soundproofing devices based on pore structure ranging from being transversely isotropic (high porosity [21,22]) to having cylindrical pores and cavities (low porosity [19]). Figure 1 shows the numerical applicability of these models to successfully predict experimental data on sound absorption spectra for several soundproofing materials (images in Figure 1), whose pore volume fractions range between 0.60 and 0.98, as shown in Table 1. The simulations in [14,29,30] show the Wilson relaxation-matched model proposed in [27] has a good fit and fully overlaps absorption spectra for bottleneck-shaped aluminium (ALF) [14,30] and polyhedral ceramic foams (PCF) [9,14]. A key reason for the accuracy is that the Wilson model was developed to predict the transition in relaxation behaviour for boundary layers in structures characterised by near-circular pores, which closely resemble “bottleneck-shaped” materials [14,29]. Furthermore, the acoustic properties of the high porosity (ε~0.909) sintered fibre metal (SFM) were successfully predicted in [8,9] by numerically simulating the semi-phenomenological Johnson–Champoux–Allard (JCA) model [24], indicating a better prediction of the sound absorption spectrum for Recemat NCX 2733 sample, as illustrated in Figure 1. This further increases the ability of JCA’s model to predict the acoustic properties of structures with non-uniform pores and constrictions [17]. Additionally, Figure 1 exhibits a striking overlap between numerical simulations using the Delany–Bazley–Mikki (DBM) poro-acoustic model [23] and the measured data for glass wool fibrous (GWF) material described in [8]. This accuracy has been attributed [8,17] to the fact that the DBM model was developed using impedance tube data for high porosity fibrous materials, a transversely isotropic geometry, and high pore volume fractions (), which closely match those of the glass wool fibres (GWF).
As shown in Figure 1, the sound absorption spectrum for a monosized bottleneck-shaped layer of aluminium foam has the highest quarter-wavelength resonant peak of absorption below 2.0 kHz, but the dip at higher frequencies, usually between 2.5 and 5.0 kHz, implies that it insufficiently absorbs sound when compared to other soundproofing materials. This loss in unattenuated large wavelength characterisation was compensated for by sandwiching with packed beds of spherical structures in [9] and using an absolute thickness of the material in [31]—a consequence of increased load-bearing and increased cost of soundproofing application. The work demonstrated by Otaru et al. [30] was based on the sound absorption properties of monomodal macroporous structures similar to bottlenecks, but [32] examined the thermal conductivity of bimodal “bottleneck-type” structures in terms of their effective thermal conductivity. As such, this study, for the first time, attempts to simulate the permeability of bimodal macroporous structures generated by sphere packing models as well as determine other importance of pore-structure-related properties. These properties, as well as those of monomodal bottleneck structures, will be used in numerical simulations to fully understand the effects of varying pore and fluid volumes on the acoustic properties of modulated virtual macroporous structures. Additionally, the work uses a microscale characterisation approach to predict (for the first time) the properties of sound absorption of dual-porosity differential microcellular samples of the tetrakaidekahedron-shaped (Inconel 450 and 1200 µm) and the influence of Darcy and inertial flowing fluid regimes on the absorption spectrum.
2. Pore-Structure Characterisation and Analysis of Permeability Data
A two-part methodology is used here: the determination of key pore-structure-related parameters via sphere packing models and X-ray computed tomography datasets as well as numerical modelling and simulation of the normal incidence sound absorption coefficients developed across the interstices of these cellular materials. Figure 1 shows that Wilson [28] and JCA [24] models are better predictors of the sound absorption spectra of bottleneck-shaped and tetrakaidekahedron-shaped cellular materials. Since similar materials are considered herein, the numerical application of each of these models will require the input of pore-structure related parameters that define the vibroacoustic characteristics of the materials. Simulations in [14] showed that Wilson’s equivalent fluid model requires inputs such as static viscous permeability (k0), high-frequency-limit of dynamic tortuosity (τ~simple known as tortuosity), and sample porosity (ε). In addition, the numerical application of the semi-phenomenological Johnson–Champoux–Allard (JCA) model in [16,29] requires the inclusion of viscous (˄) and thermal characteristic length (⌅) to account for the viscous thermal dissipation mechanism both at low and high frequencies. The effects imposed by monosized bottleneck-shaped structures on their acoustic behaviour were primarily determined [14,30] by the static viscous permeability of the structure, which was determined by numerical simulation of pressure drop across air-saturated samples for superficial fluid velocities within the creeping fluid flow regime.
Studies in [18,32,33] demonstrate that discrete element modelling and simulation (DEM) packing of spheres, as well as three-dimensional (3D) advanced imaging, can be utilised to mimic the geometrical features of bottleneck-dominated cellular metals made by replication casting (see Figure 2a–c). The study in [32] describes the creation of bimodal bottleneck structures using the same methodologies as the original study [8]. In brief, this study created packed beds of monomodal and bimodal virtual structures—varying capillary radius between 10 and 80 µm and varying widely-distributed particle sizes to create structures capable of realistic manipulation; considering the available technological operating conditions and processing parameters used in the inverse casting process of manufacturing porous metals [34]. The particles were classified as large-large (L-L~(2.0–2.5 mm)), large-small (L-S~(2.0–2.5 mm + 0.5–1.0 mm)) and small-small (S-S~(0.5–1.0 mm)). While L-L and S-S structures were monomodal in nature, bimodal structures (L-S) depicted packing conditions involving the combination of small spheres into larger ones and were created for 6.25, 12.50, 25.00 and 50.00% volume addition of S-S in L-L. Then, a MatlabTM script was used to create 2D datasets of binary images from x, y, z particle conditions and capillary radius of between 10 and 80 µm. Following the import of 2D datasets, a 3D imaging and characterisation software (ScanIP module of Synopsis-SimplewareTM) was used to create 3D volumes and 3D representative volume elements (RVEs). In determining the 3-D RVE structure, larger volumes were subdivided into smaller units until the model porosity reached three per cent of its bulk value. In the ScanIP module, application of the recursive Gaussian smoothing method resulted in lost features and increased pore openings, indicating the inadequacy of using this technique to filter noise within this type of material. It was then possible to preserve these geometric features by using smart mask smoothing (SMS) with ten iterations. Pore structure information such as foam porosity, surface area and sample volume was measured directly from the ScanIP, and the average pore size was determined by creating a Boolean inversion of the RVE microstructure (to create the fluid phase), followed by watershed segmentation (separating particles) of the RVE fluid domain. The mean pore diameter opening (2) of these structures was calculated by measuring the average diameter of small circles in the RVE-domain, while the tortuosity was calculated by expressing the Euclidean distance (shortest route) in relation to its boundary distance. Figure 2a–c shows images of typical pores and openings of the “real” and virtual monomodal structures. As seen in Figure 2d–f, bimodal macroporous structures display a higher number of pores and openings when compared to monomodal macroporous structures. Table 2 shows measurements of key pore-structure parameters such as pore openings and pore sizes taken from optical micrograph and X-ray computed tomography datasets, which confirm the results of sphere-packing models. Table 3 displays structural data on bottleneck-type structures, including sample porosity, average pore size, openings (pore connectivity), and permeability derived from 3D representative virtual samples.

Table 3.
Tabular representation of pore-structure-related information and sound absorption properties of monomodal and bimodal virtual macroporous structures.

Table 2.
Tabular representation of pore-structure-related properties and permeability (measured and predicted) data for several macroporous structures.
Table 2.
Tabular representation of pore-structure-related properties and permeability (measured and predicted) data for several macroporous structures.
| Literature/Current | Foam Porosity ε [-] | Pore Diameter Range, Dp [mm] | Mean Pore Radii, rp [mm] | Mean Openings, rw [mm] | Measured/µCT k0/10−9 [m2] | Predicted k0/10−9 [m2] |
|---|---|---|---|---|---|---|
| Otaru and Kennedy [33] | 61.2 | 2.0–2.5 (L-L) | 1.125 | 0.170 | 1.280 | 1.27 |
| 1.14 [µCT] | ||||||
| Current | 64.8 | 12.5 vol%S | 0.384 | 0.137 | 0.65 [µCT] | 0.98 |
| 68.2 | 25.0 vol%S | 0.387 | 0.120 | 1.34 [µCT] | 1.23 | |
| Otaru et al. [35] | 72.0 | 1.0–1.4 | 0.605 | 0.160 | 3.92 | 3.81 |
| 75.1 | 2.5–3.15 | 1.385 | 0.350 | 20.40 | 27.92 | |
| Otaru et al. [35,36] | 70.6 | 2.0–2.5 | 1.105 | 0.323 | 13.50 | 12.31 |
| 72.6 | 2.0–2.5 | 1.115 | 0.364 | 17.08 | 19.67 | |
| Li et al. [3] | 57.0 | 1.3–1.9 | 0.800 | 0.130 | 0.49 | 0.42 |
| 60.0 | 1.3–1.9 | 0.800 | 0.155 | 0.81 | 0.83 | |
| 63.0 | 1.3–1.9 | 0.800 | 0.180 | 1.43 | 1.57 | |
| Expt—Current: | ||||||
| NU Spherical | 67.1 | 1.4–2.0 | 0.85 | 0.13 | 1.39 | 1.58 |
| Hydrosoft | 74.6 | 1.4–2.0 | 0.85 | 0.15 | 5.34 | 5.44 |
| Granulite | 61.8 | 3.0–4.0 | 1.75 | 0.19 | 1.85 | 1.92 |
For the materials studied, the CFD simulation of pressure drops developed across the interstices of mesh representative microstructures within the laminar regime was used to predict permeability values using the Darcy-Forchheimer model as described in [35,36,37,38]. The gradient of fluid velocity developed across the pores and openings of these structures was fully captured (in the +FE module of Synopsis-SimplewareTM) by finding an ideal mesh scale balance capable of convergent faster and preserving accuracy. A linear tetrahedral mesh structure (LTM) with a workable growth rate of 1.3, a minimum edge length of 2.75× image resolution (minimum grid size: 55 µm) and a maximum edge length of 6.75× image resolution (maximum grid size: 135 µm) were used to capture flow information within the interstices of these structures. The optimised mesh structures resulted in element counts of 1.5 and 2.5 MCells for the monomodal structures and 2.0 and 3.0 MCells for the bimodal structures. The higher ranges of mesh densities obtained for the bimodal structures can be attributed to larger pore volumes caused by the continued addition of smaller spheres into the larger ones in the sphere packing models. The Navier-Stokes equations with impermeable sidewall boundary conditions were solved using COMSOL MultiphysicsTM to determine the pressure drop across porous surfaces with laminar superficial fluid velocity. The impermeable sidewall boundary condition is commonly referred to as velocity inlet, zero pressure outlet, and zero velocity at the walls and lateral faces of a 3D porous structure. As a final step, these image processing, meshing, and characterisation approaches were applied to the tetrakaidekahedron-shaped Inconel 450 and 1200 µm, working from CT datasets obtained with the Zeiss Xradia Versa XRM-510 3D X-ray microscopy system. Figure 2g,h show the RVE structures of the Inconel 450 and 1200 µm samples, whereas Figure 2i shows the dual-porosity (A + B) structures that were created by importing selected datasets from stack images of these differential structures into the ScanIP module for the creation of 3D models.
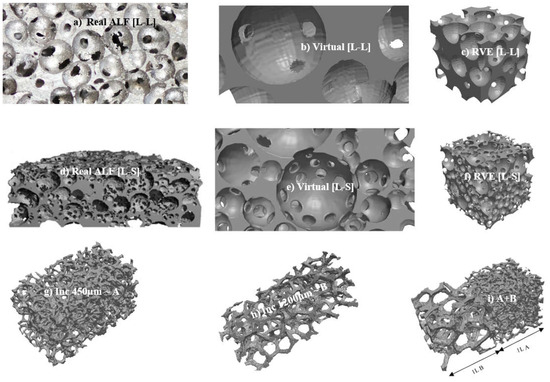
Figure 2.
(a) Optical image of aluminium foam characterised by monosized (L-L) pores [37], (b) virtually-generated image of monomodal (L-L) macroporous structure, (c) virtually-generated representative volume element (RVE) of monomodal macroporous structure, (d) X-ray computer tomography section of bimodal (L-S) macroporous structure, (e) virtually-generated image of bimodal (L-S) macroporous structure, (f) virtually-generated representative volume element (RVE) of bimodal macroporous structure, (g) X-ray computer tomography RVE image of Inconel 450µm sample [8] (h) X-ray computer tomography RVE image of Inconel 1200 µm sample [39] and (i) X-ray computer tomography RVE image of dual-porosity differential Inconel 450 and 1200 µm samples [38].
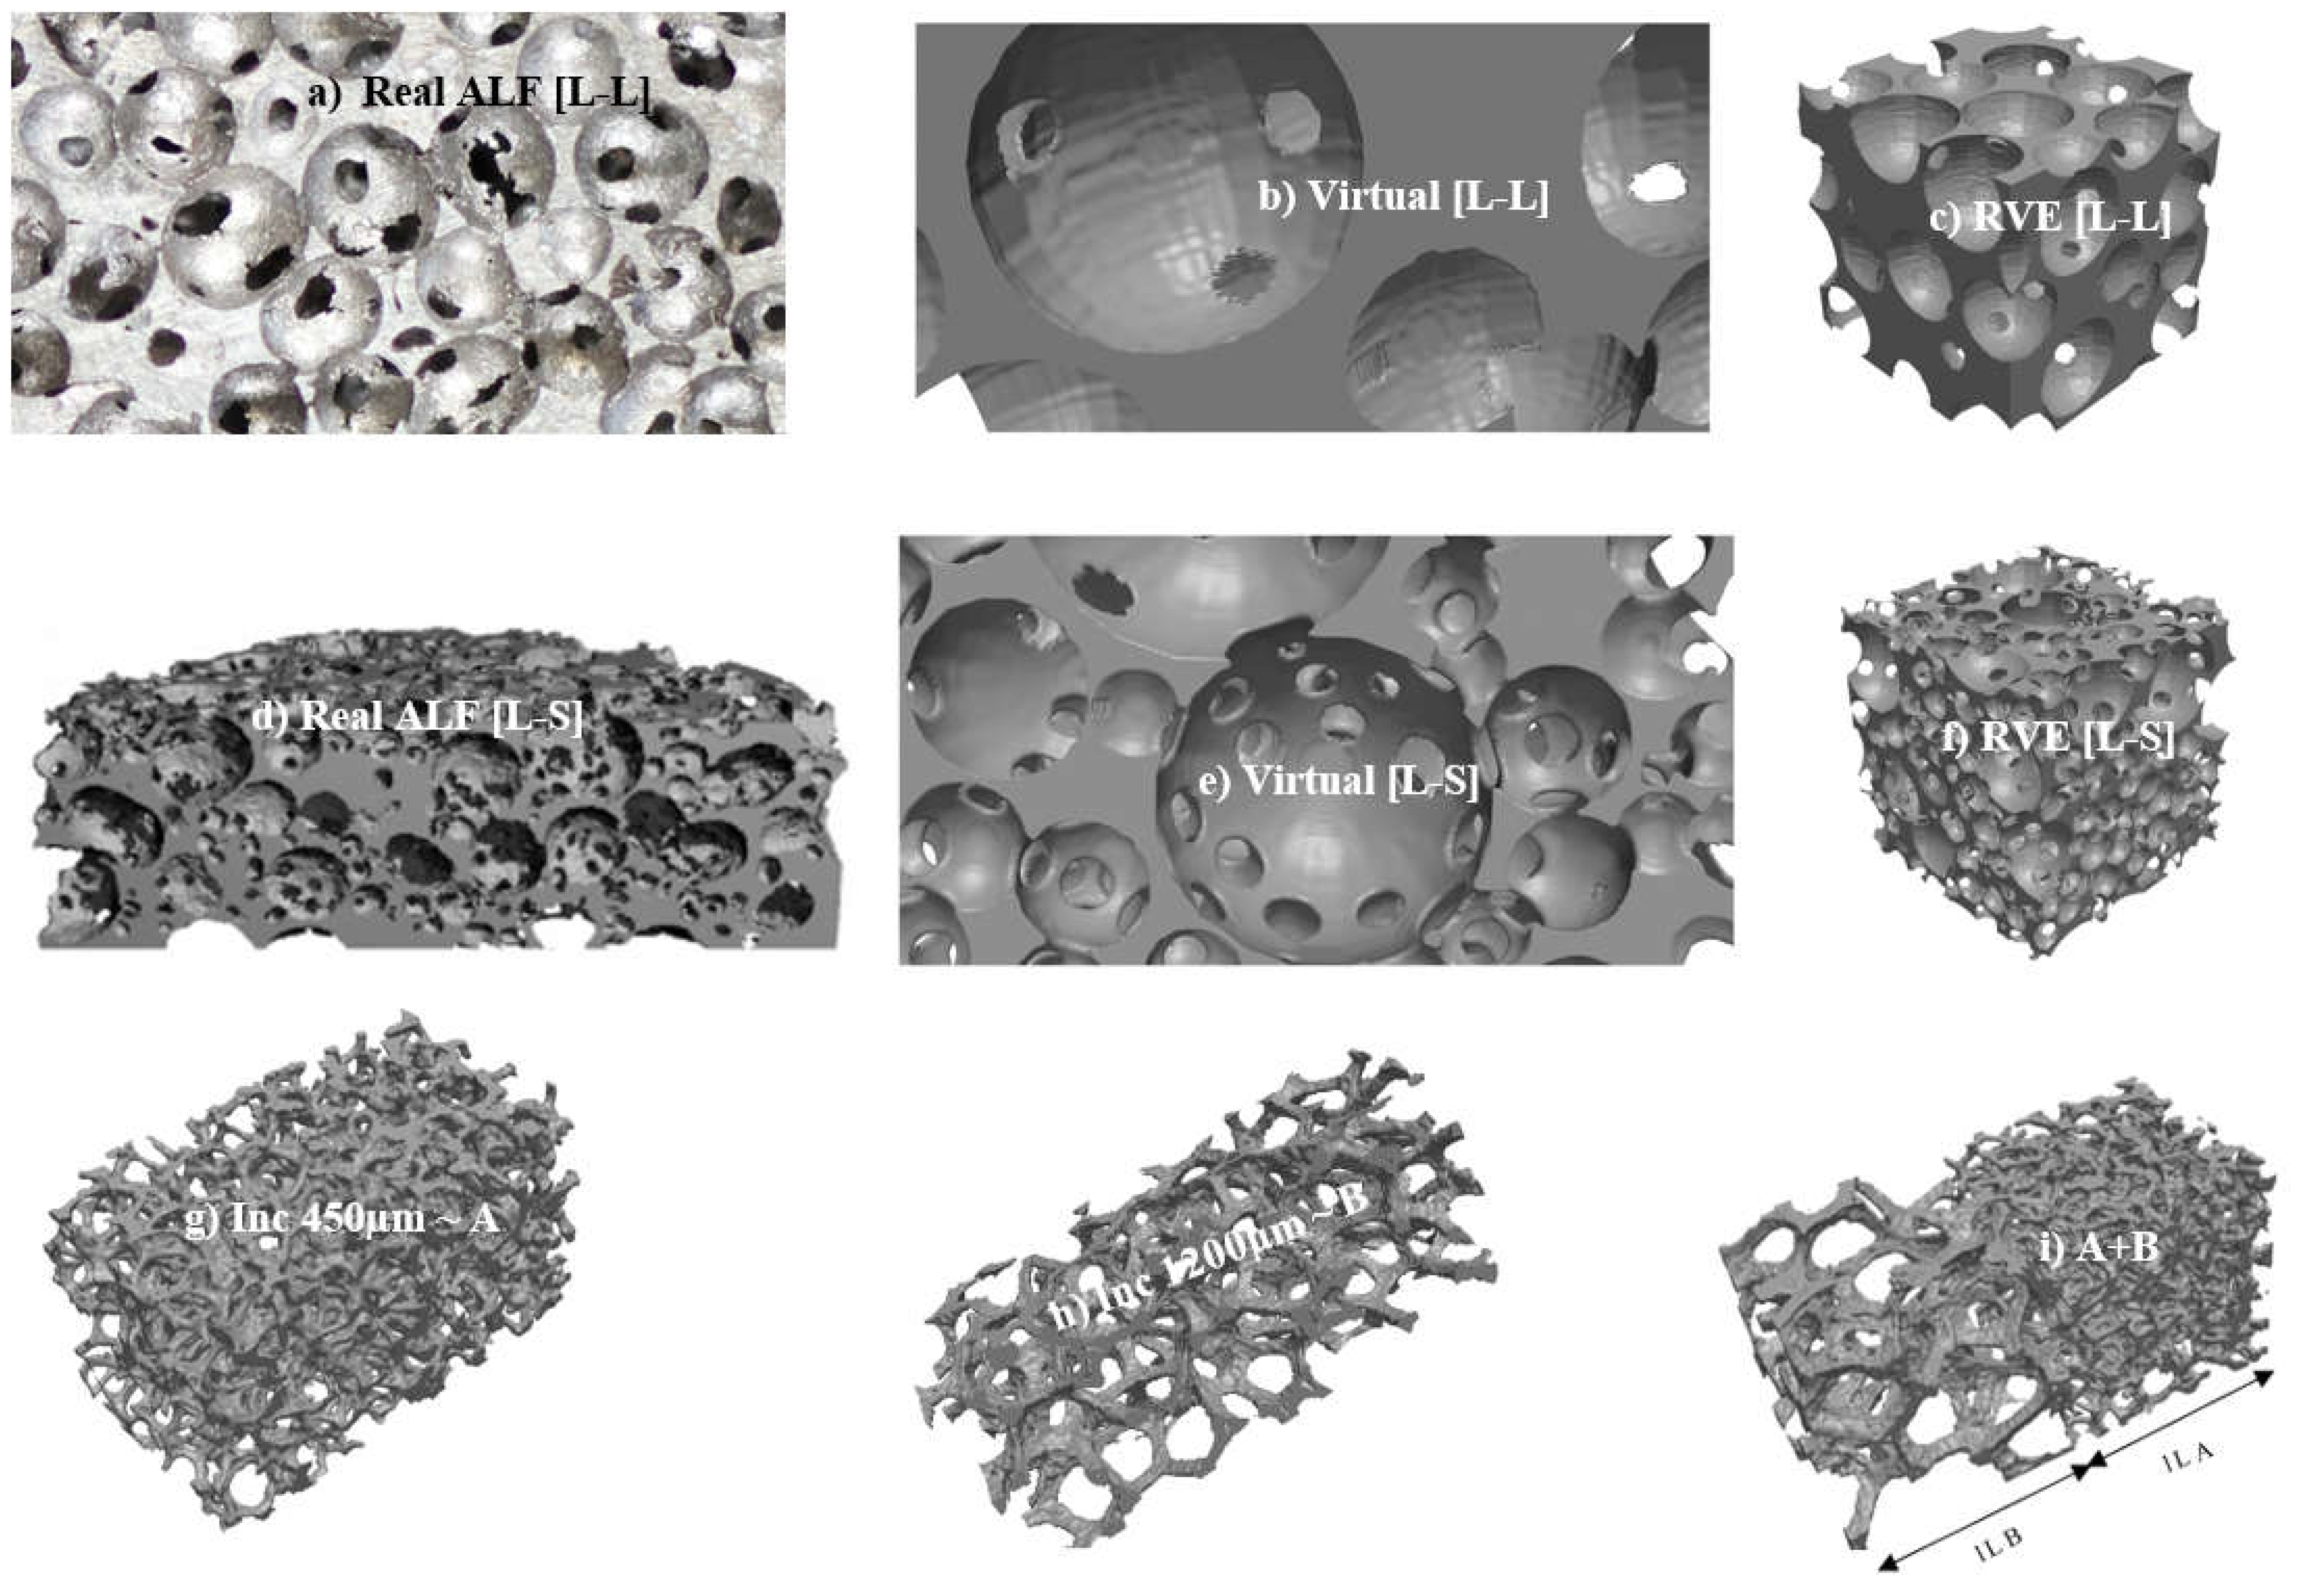
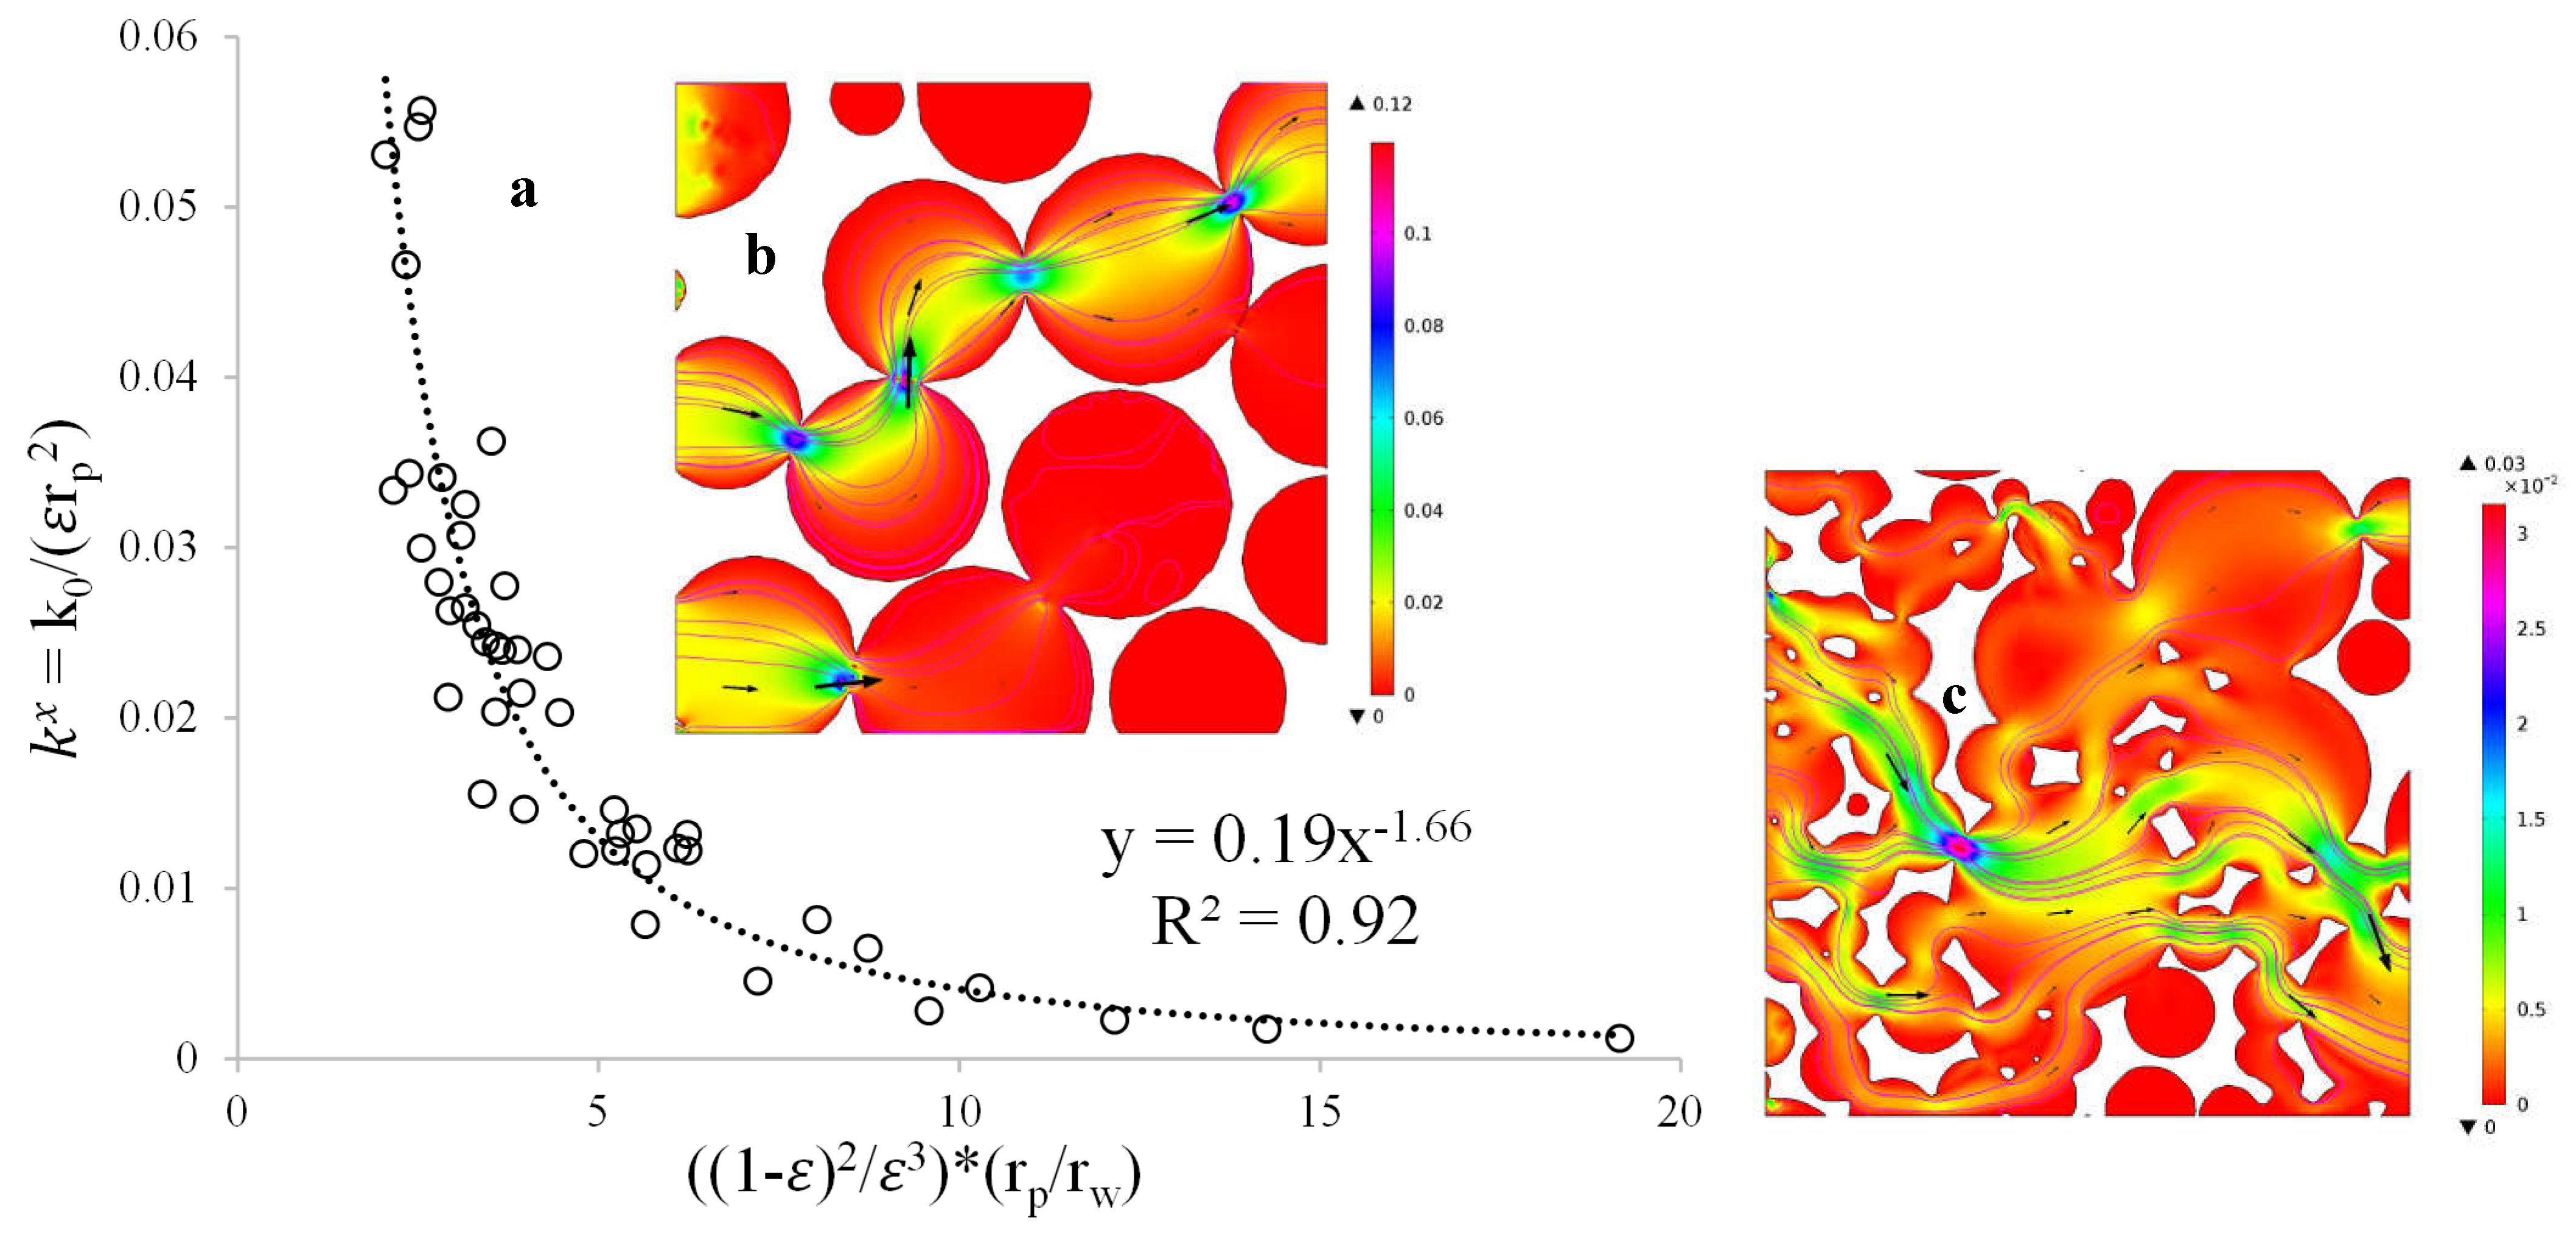
Figure 3 illustrates typical 2D velocity arrow plots for both the bimodal (50% volume in S-S) and monomodal [35,39] structures. These plots illustrate fluid flowing from the inlet to exit regions of these structures, and high intensities of colour scales were observed within the openings of these structures. Streamlined velocity plots were found to be more connected for structures with a larger capillary radius (80 µm) due to their increased pore contacts, allowing a higher volume of fluid to pass, while flows through low capillary radius structures (10 µm) are characterised by recirculation of fluid in the “dead-end” pores. In Table 3, there is evidence of increased porosity and pore openings in samples as S-S was added to L-L, further increasing the flow permeability of the porous structure and reducing the number of “dead-end” pores. With these, bimodal macroporous structures made by packing varied sphere sizes are expected to be more complicated, and the flow patterns within them are expected to behave differently from those of monosized pores. For example, despite capillary influence being included in the coordination number of bottleneck-type structures described in [33], the behaviour characterised by changes in predicted static viscous permeability (using models described in [30,36,39]) of bimodal structures were observed to underestimate their capabilities for prediction by CFD. The reason for this disagreement was that the models presented in [30,36,39] were developed using CFD computed permeability data for macroporous structures characterised by monosized pores and pore volume fractions between 0.59 and 0.65. Figure 3a shows a plot of reduced permeability () against a set of multiple changes in pore-structure-related parameters () for combined packing conditions (monomodal and bimodal structures) emphasising an inverse relationship with near-power. Therefore, this relation can be used to provide an analytical description of permeability as a test function of parameters related to pore structure, as shown by Equation (1).
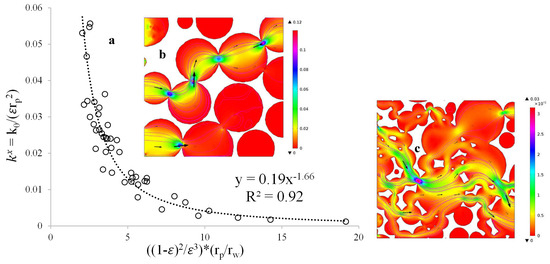
Figure 3.
(a) Plot of dimensionless reduced permeability [k0/(εrp2)] against a set of multiple changes in the pore-structure-related parameters for all packing conditions (monomodal (b) and bimodal (c)) and capillary radius ranging between 10 and 80 µm.
In order to make a quantitative assessment of the proposed model, experimental measurements and modelled permeability data were compared. Table 2 summarises various macroporous component parameters and permeability data (measured experimentally, computed tomography and predicted analytically). According to [33], the permeability derived from X-ray CT and measured experimentally with a variable head permeameter for the L-L structure in Figure 1a is 1.14 × 10⁻⁹ m2 and 1.28 ± 0.09 × 10⁻⁹ m2, respectively. By using the expression in Equation (1), the equivalent predictive value was calculated to be 1.27 × 10⁻⁹ m2, demonstrating excellent agreement between the measured and predicted values. Additionally, for bimodal pore distributed structures, CFD simulation using a 3D representative model reconstructed from 2D X-ray computed tomography slices for the “real” 12.5 and 25.0% volume S-S samples (Figure 2d–f) achieved permeability values of 0.65 × 10⁻⁹ m2 and 1.34 × 10⁻⁹ m2, respectively. The X-ray CT approach and sphere-packing models for the bimodal macroporous structures showed good agreement in Table 2. The correlation between experimentally measured permeability using pressure drop data developed across interstices of “bottleneck” structures against superficial air velocity described in [3,35,36] and those predicted using the proposed model herein is good and within reasonable limits of scatter. Comparing the permeability predictions using the proposed analytical model with experimentally determined permeability values for some selected macroporous structures in a constant-head permeameter, the model was within scattering. These structures were made by a process of replication casting that infiltrated liquid melts into convergent gaps created by packed beds of spherical-shaped salt, hydro-soft salt, and granulite salt samples. Overall, the modelling confidence was greater than 94 percent correlation when compared with experimental measurements and X-ray CT derived data for all foam samples presented in Table 2. Nevertheless, the differences between measured and predicted values could potentially be attributed to the non-homogeneity of the “real” structures, caused by the presence of “half-sized” salts during casting, whereas the virtual structures are homogeneous with a structural roundness range of 0.99 and 1.0. Thus, the proposed model may be useful for predicting the permeability of monomodal and bimodal “bottleneck” structures characterised by expanded pore volume fractions between 0.57 and 0.76 and also has the advantage of ignoring the coordination number used in [39,40].
3. Numerical Modelling and Analysis of Sound Absorption Properties
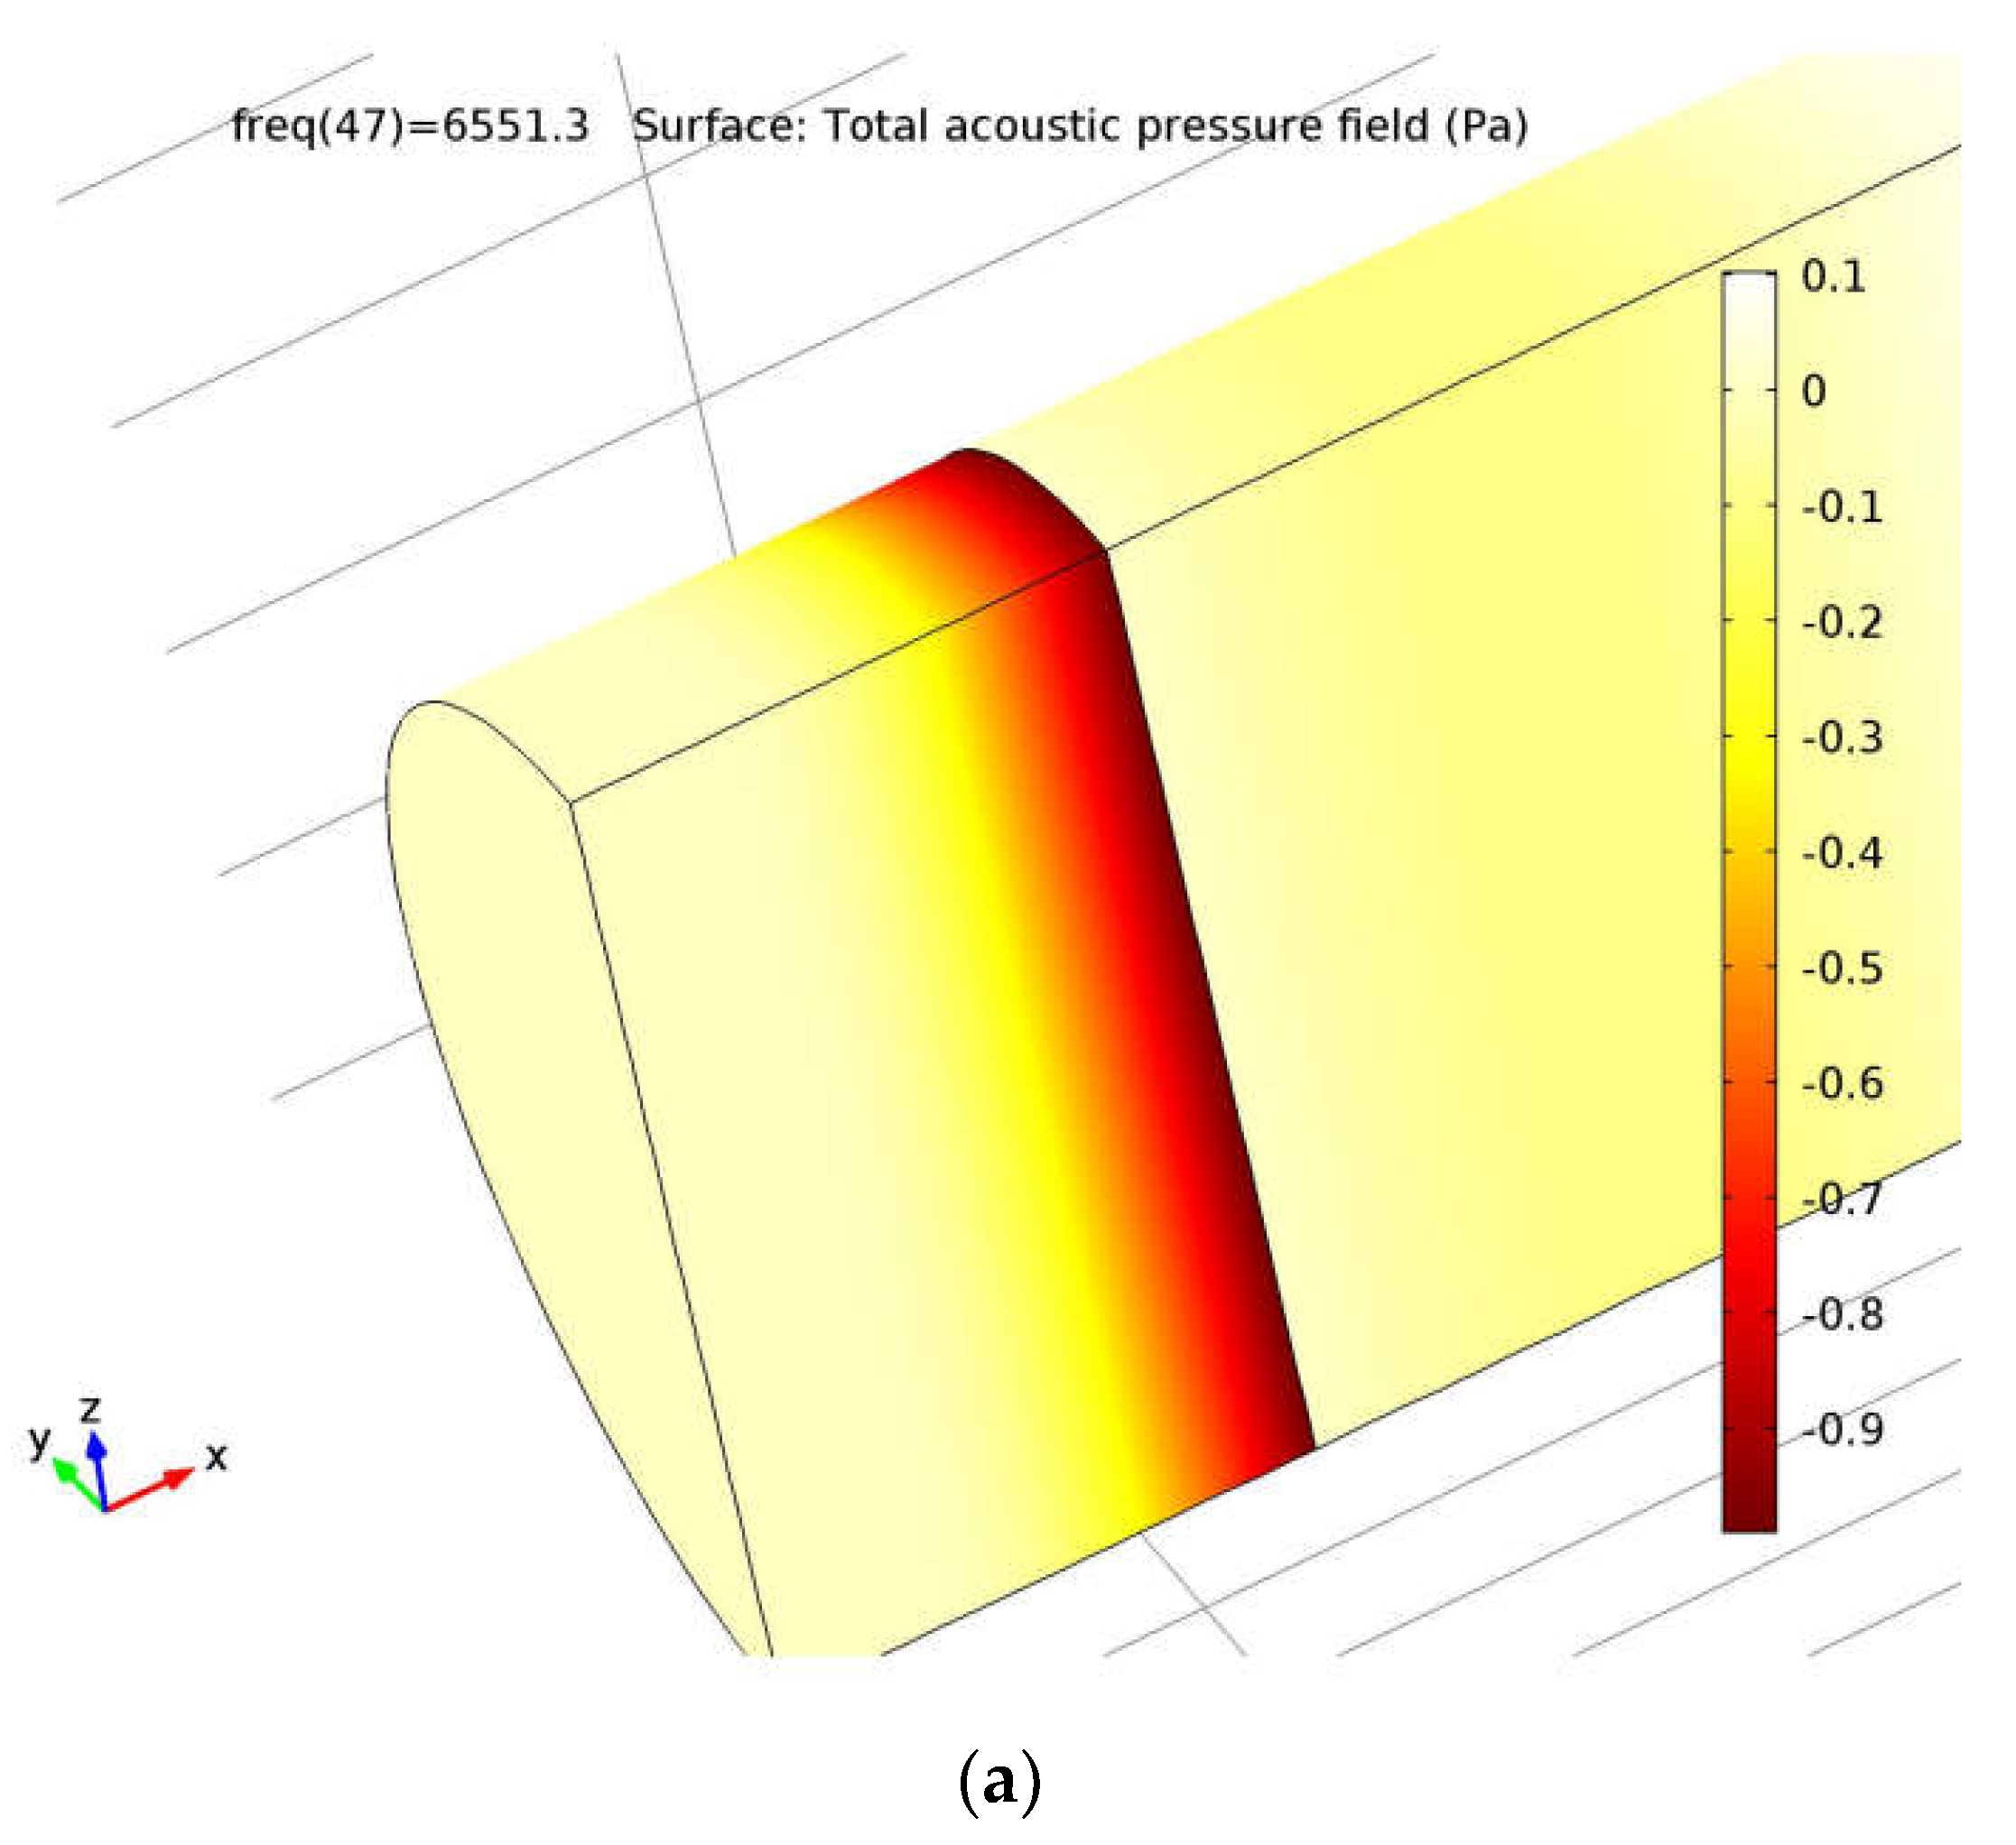
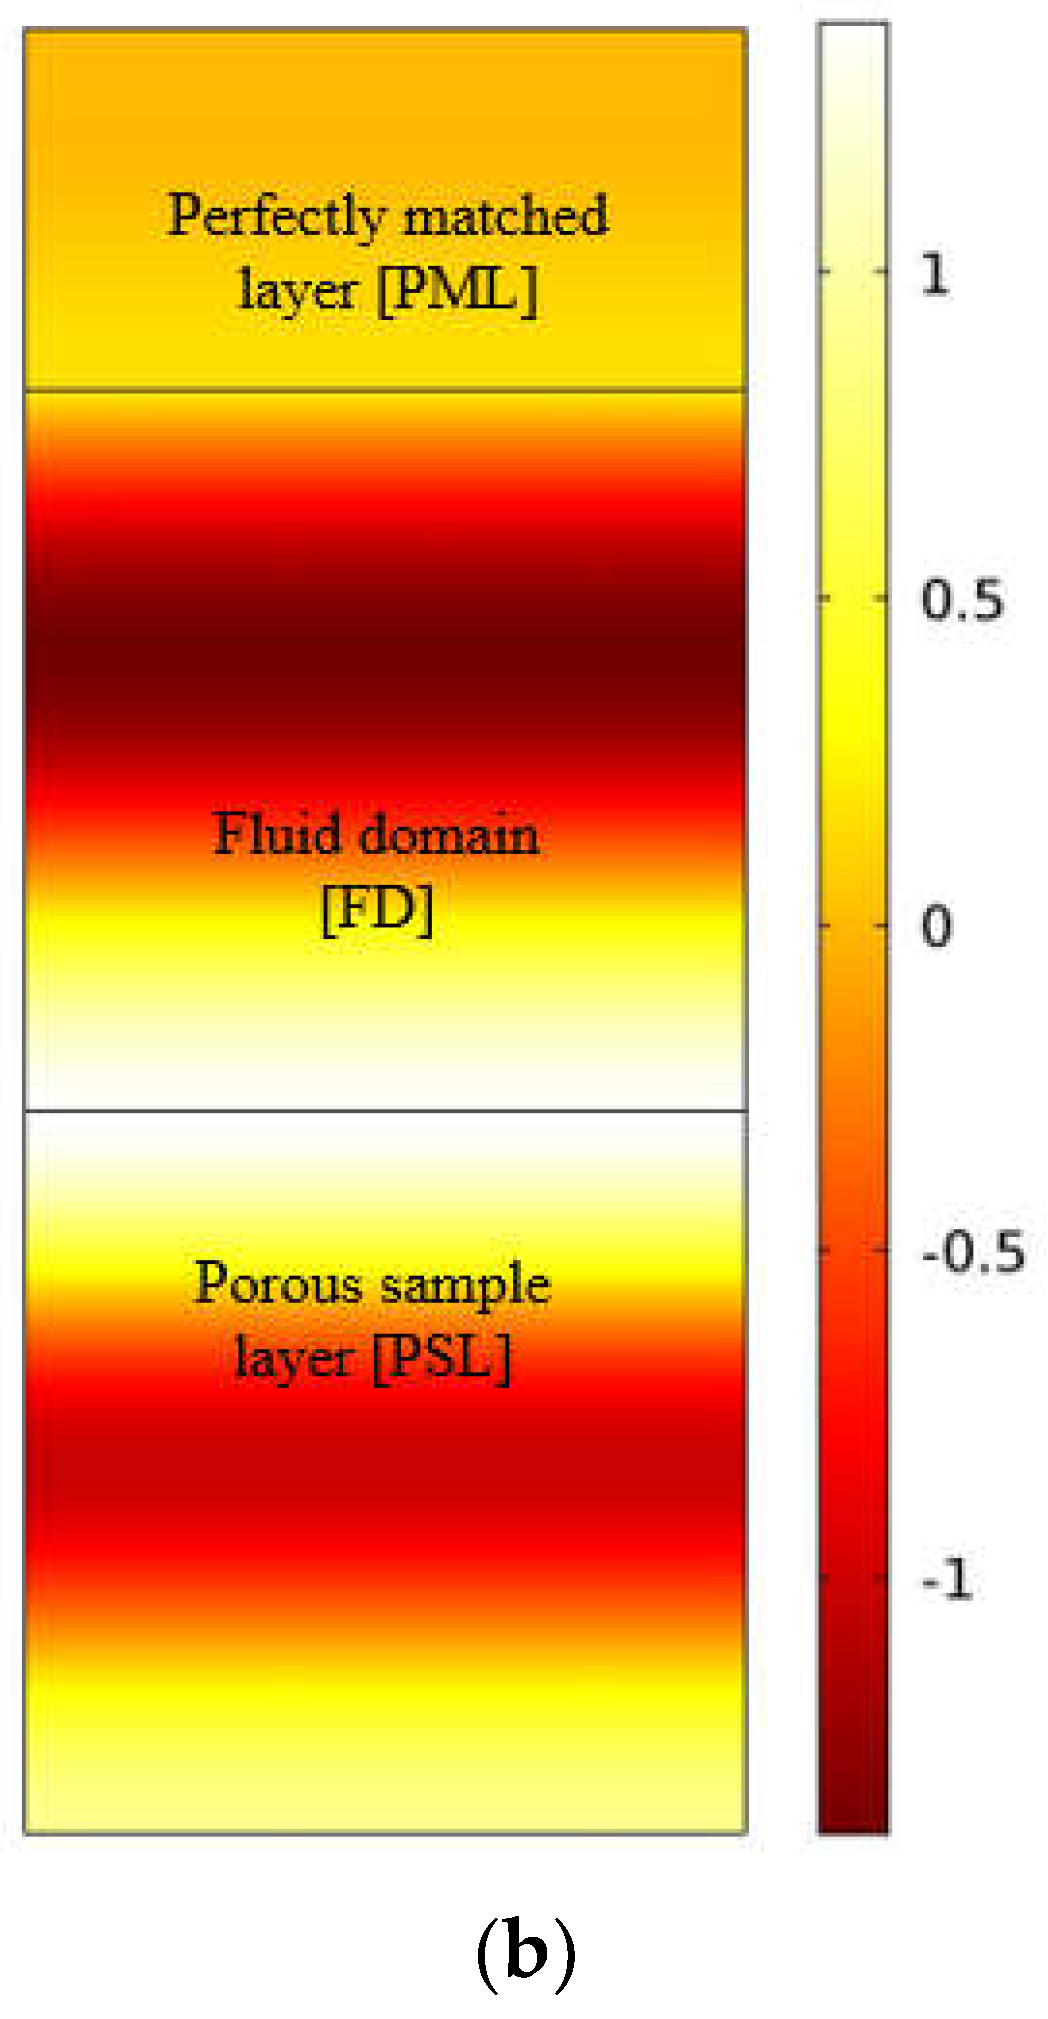
The sound absorption spectra and properties of these modulated soundproofing structures were determined using numerical simulations of propagating pressure waves across their interstices and analysis of the resulting normal incidence sound absorption spectra for frequencies between 0.1 kHz and 6.5 kHz. The numerical modelling and simulation procedures used here are related to those reported in [9,13,16] and were performed in COMSOL MultiphysicsTM using the acoustic module. A two-dimensional (2D) geometry (Figure 4b) was created to mimic an AFD 1200-AcoustiTubeTM measurement set up [8] with air as the fluid domain (FD) of the geometry. Essentially, this geometry consists of a 40 mm-thick hardback porous layer (PSL), a 40 mm-thick air-dominated zone (FD), and a 20 mm-thick perfectly matched layer (PML). It was set up so that, as near as possible, the simulations would be compared with the data generated by a three-dimensional model (Figure 4a) and experimental results reported in [3,6,7,13,14,15,16] as shown in Figure 1. In the FD and PSL domains, triangular mesh structures with minimum grid size, maximum grid size and growth rates of 21 µm, 52 µm and 1.3 µm, respectively, were applied. The PML domain was confined to a perfect match layer. The result was a mesh density of ~26,000 cells for the 2D simulations and ~950,000 cells for 3D simulations, both of which are within the capacity of the computational resources required for this exercise.
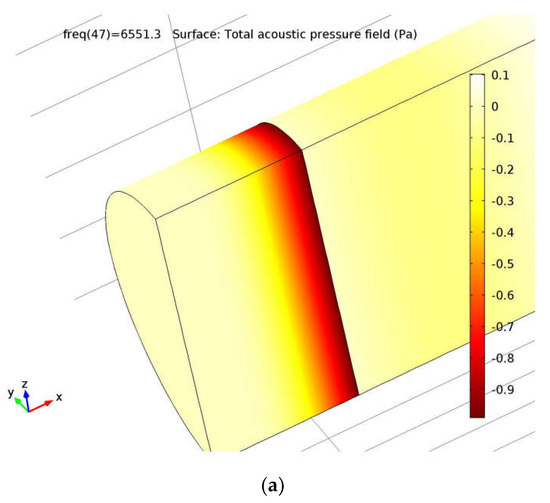
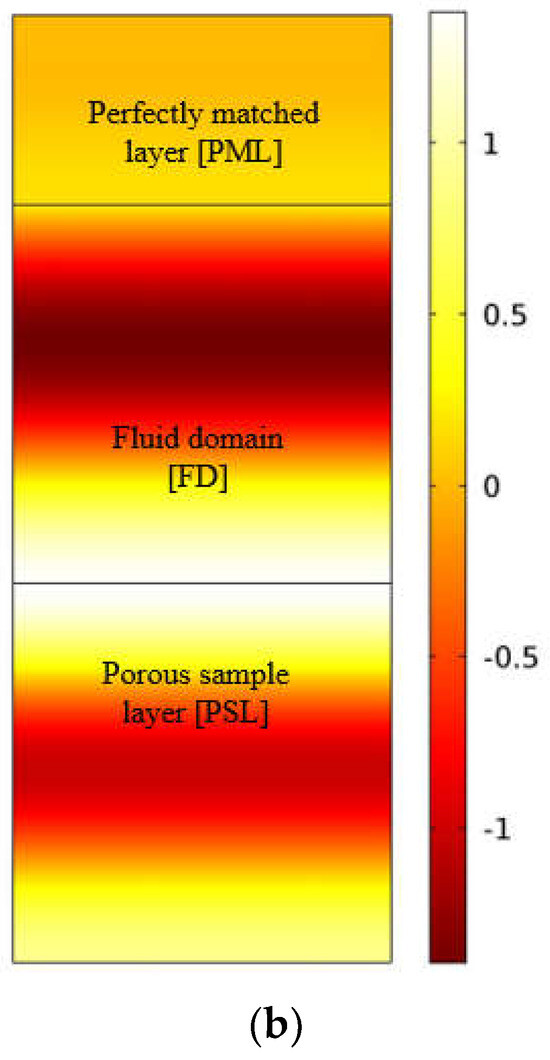
Figure 4.
(a) Three-dimensional and (b) two-dimensional half-tube model representations of total acoustic pressure field (Pa) computed for 40 mm thick hard-backed porous layer at a resonant frequency of 6551.3 Hz.
Helmholtz linear acoustic pressure (Equation (2)) involving total acoustic pressure (), fluid density (), propagation coefficient (), monopoles () and dipoles () was resolved on the PML and FD domains. In the PML domain, the equivalent fluid Wilson [28] and semi-phenomenological JCA [24] models were interchanged to estimate their real specific surface acoustic impedance () and normal incidence sound absorption coefficients (), Equation (3), for the bottleneck-shaped and tetrakaidekahedron-shaped macroporous structures, respectively.
where is the characteristic impedance of the porous sample, is the specific surface acoustic impedance of air, is the sample porosity, is the air density and is the speed of sound in air. A background pressure field boundary condition was applied to the FD zone and a perfectly matched layer to the PML domain, while a periodic Floquent boundary condition was applied to the lateral faces (sides). In the selected Helmholtz linear acoustic model, the inlet and outlet sections of the PML and PSL are conditioned to sound hard boundary walls at a 20 µPa reference pressure. The simulation results from the 2D and 3D created geometries overlap each other with little or no difference (R2~0.99), and the computational time for the 3D geometries is 10× higher than that of the 2D geometry (~1 min) according to the specified frequency range between 0.1 and 6.5 kHz. In addition to the normal incidence absorption spectra, a number of key properties were determined to allow for a quantitative assessment and comparison of the acoustic performance of these modulated structures. These properties are the noise reduction coefficient (NRC), sound absorption average (SAA), quarter wavelength resonance peak in absorption () and frequency of peak absorption (). The arithmetic mean of the normal incidence sound absorption coefficient for the quarter wavelength layer resonance frequencies (0.25, 0.5, 1.0 and 2.0 kHz) was calculated as NRC, while the average sound absorption coefficient for the twelve third-octave bands (0.20–2.5 kHz) was determined as SAA [17,29].
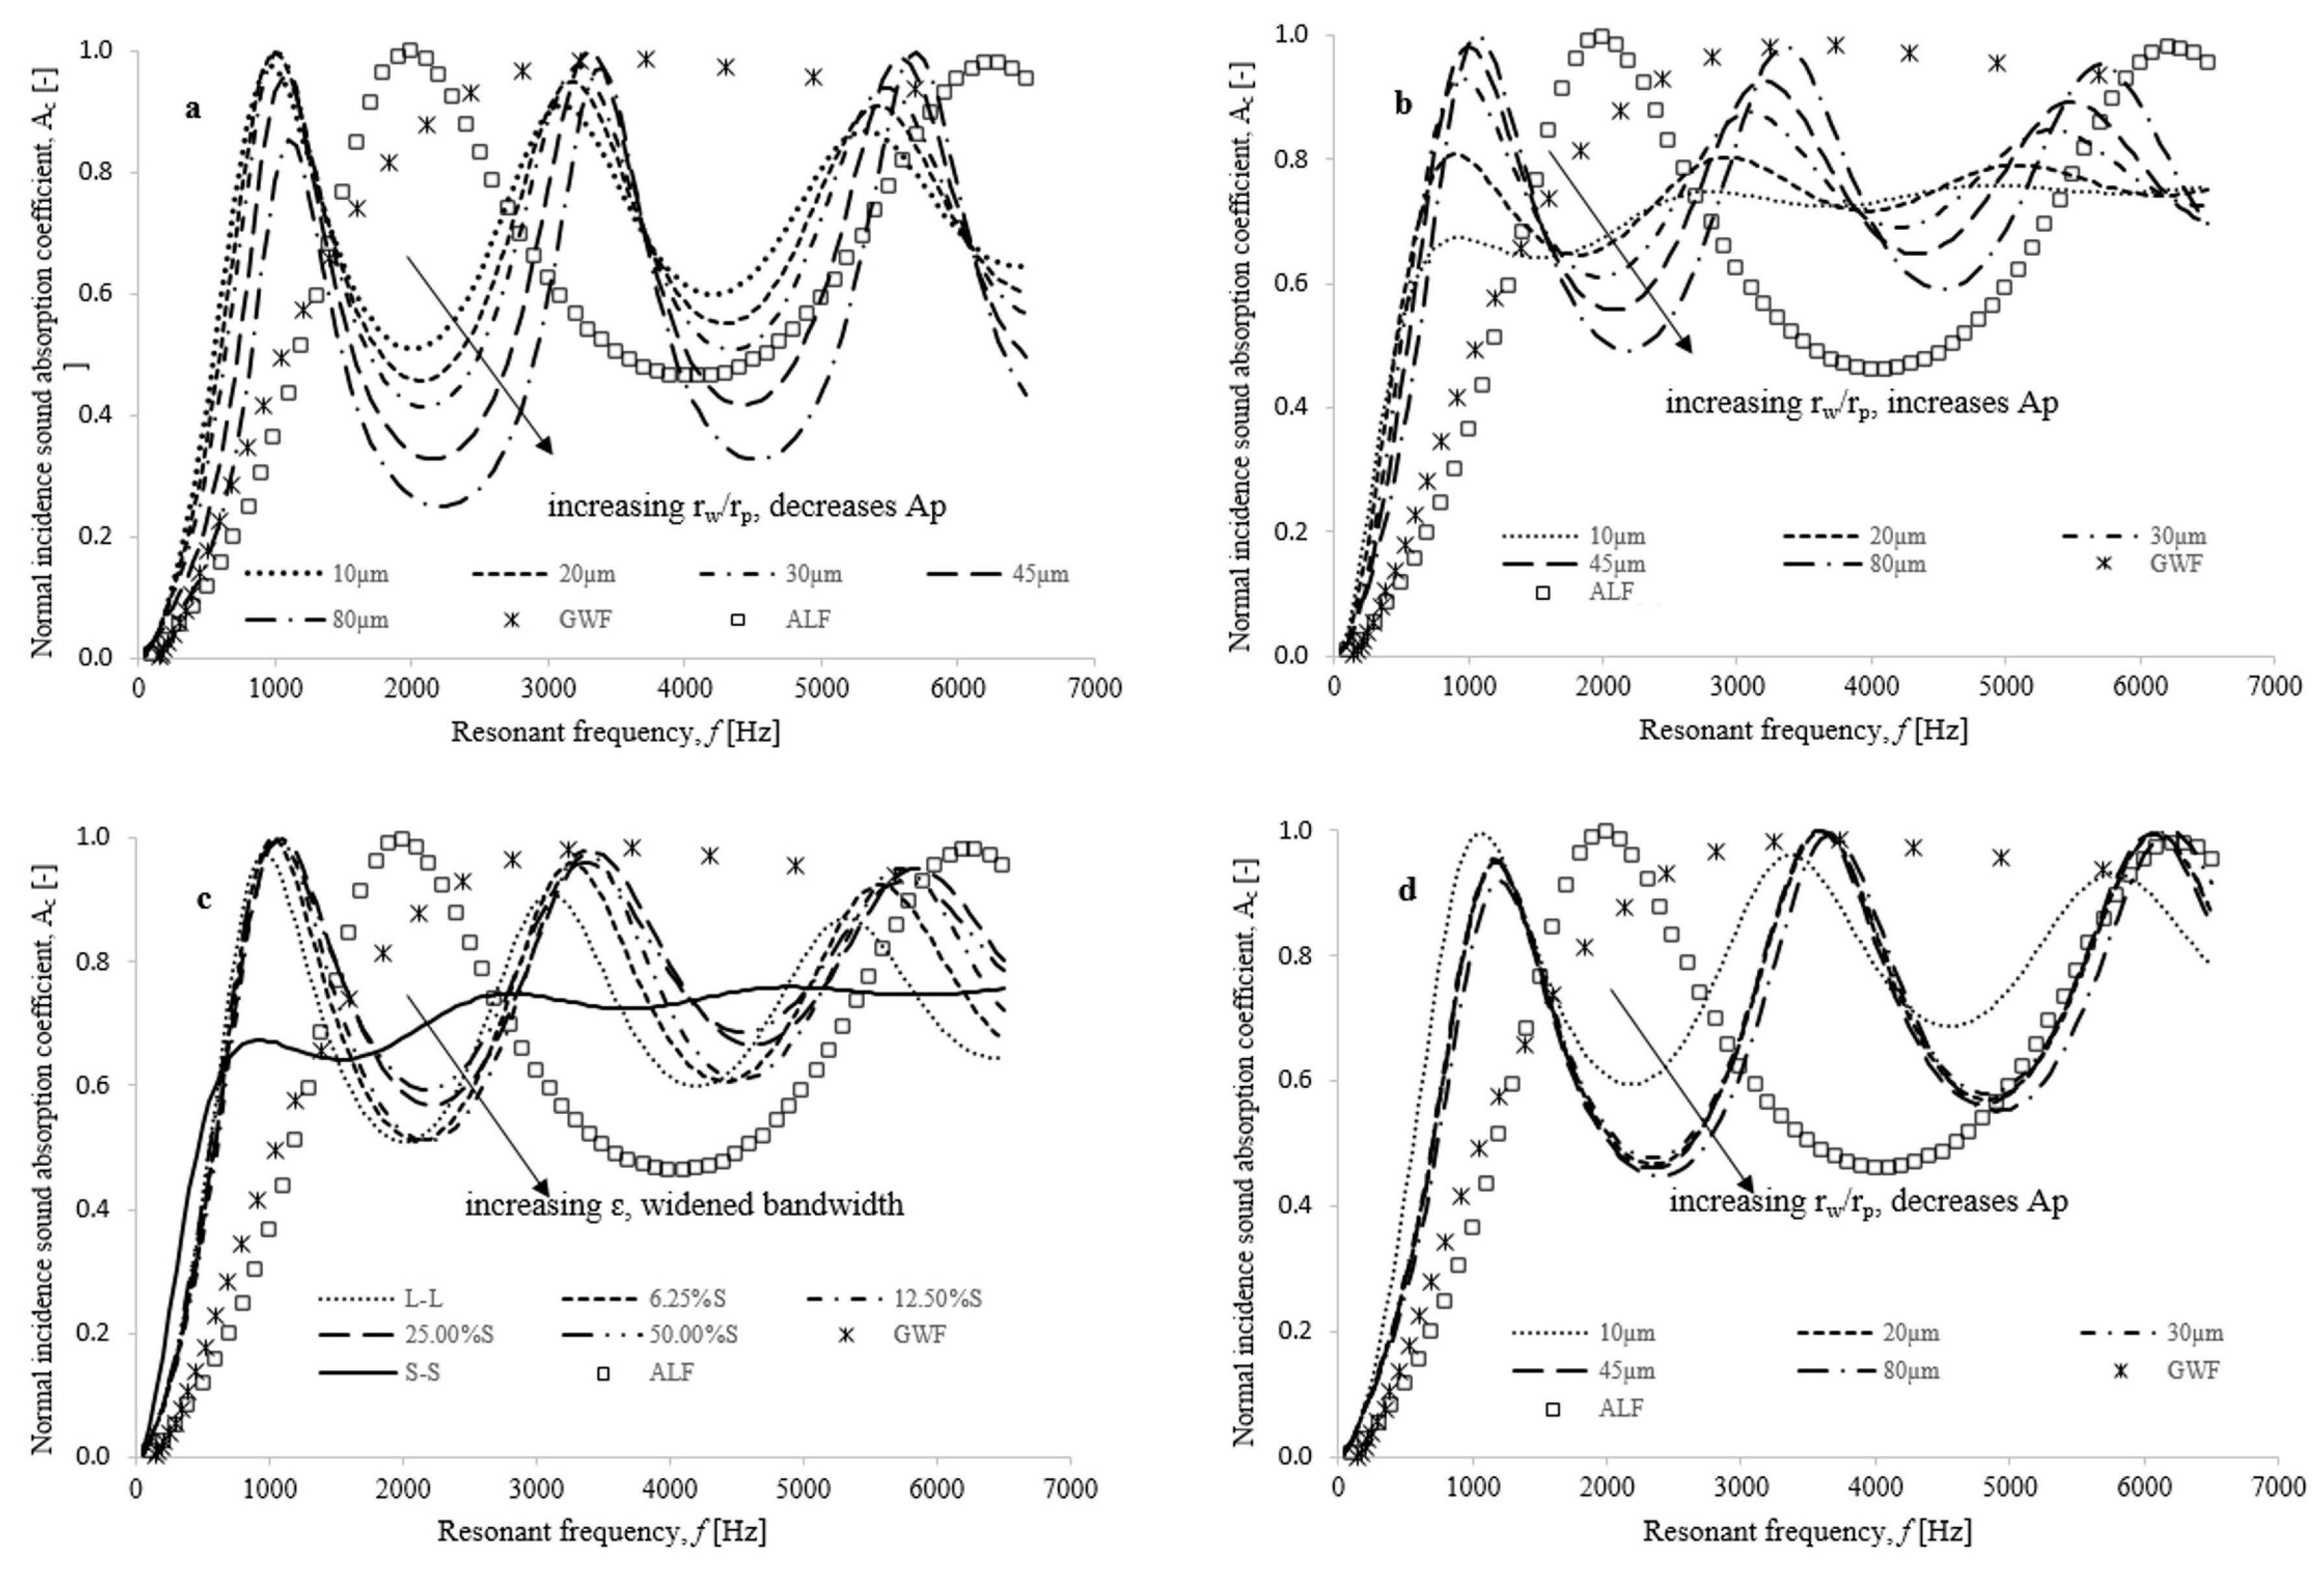
Figure 5 plots the numerical predictions of the normal incidence sound absorption coefficient against resonant frequency for bottleneck-type structures, as well as for glass wool fibre (GWF) and monomodal aluminium foam (ALF), which are also shown in Figure 1. Table 3 contains the pore-structure related input parameters, which were obtained via microscale simulation, as described earlier. These plots illustrate the numerical applicability of the Wilson equivalent fluid model to predict the ability to enhance the vibroacoustic behaviour of bottleneck-type structures by assessing the effect of key pore-structure-related parameters. To perform these simulations, property parameters such as dynamic tortuosity, porosity, and permeability (largely dictated by pore openings and sizes) must be defined and varied within the range realistically possible during foam processing.
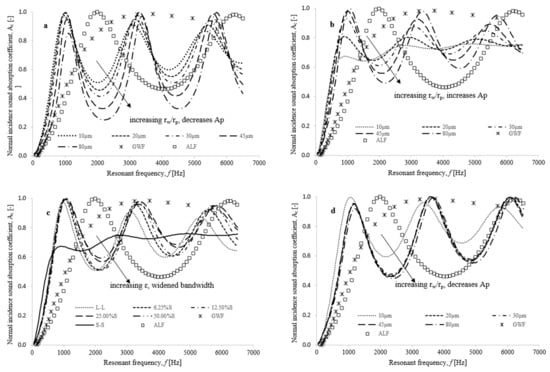
Figure 5.
Plots of numerically predicted normal incidence sound absorption spectra for virtually-generated macroporous structures characterised by: (a) monomodal large-sized pores (2.0–2.5 mm/L-L) for capillary radius between 10 and 80 µm, (b) monomodal small-sized pores (0.5–1.0 mm/S-S) for capillary radius between 10 and 80 µm, (c) monomodal and bimodally distributed pores generated at 10 µm capillary radius and (d) bimodal (50% volume S-S) for capillary radius between 10 and 80 µm, against resonant frequency, f [Hz] at 40 mm porous layer thickness.
Figure 5a,b show the influence of different capillary radius () on the normal incidence sound absorption spectra for bottleneck-type structures with monomodal pores, typically the L-L and S-S structure types. As shown in Table 3, increasing the capillary radius between the connecting pores in the sphere-packing model increases the pore openings, the permeability, and a slight increase in porosity. With increasing porosity, there is less structural content per unit volume in the material, which results in a consistent decrease of their sound absorption properties and a shift in their sound absorption spectrum to frequency maxima as capillary radius increases. Table 3 shows that the highest characteristics of sound absorption were observed for L-L structures created at a 10 µm capillary radius characterised by a mean pore opening radius of 141.6 µm, a porosity of 63.4% and a permeability of 1.03 × 10⁻⁹ m2, respectively. Figure 5b, however, illustrates that the sound absorption property of the S-S structure created at a 10 µm capillary radius was observably poor, a result of the very small pore opening radius (74.3 µm~created by small pores), which results in greater reflections at audible frequencies. Table 3 and Figure 5b indicate that the S-S structures’ sound absorption properties are improved by increasing their capillary radius, thereby extending the mean opening radius () to a range between 110 and 130 µm.
As illustrated in Figure 5a,b, the use of these selected pore-structure-related parameters improves only their quarter wavelength hard-backed layer resonance peak in absorption () and shifts their absorption spectra toward frequency minima, but at the downside of dips in the characterisation of sound absorption spectra for frequencies above 1.8 kHz. Therefore, the creation of bimodal structures increases the number of pore openings (coordination number), the available pore space (ε), and reduces the pore-nonuniformity (tortuosity) of the structure. As a result, the absorption bandwidth of the materials flattens out and the sound absorption properties improve at these high frequencies, as shown in Figure 5c,d. Figure 5c presents numerically predicted sound absorption spectra against resonant frequency for monomodal and bimodal bottleneck-shaped structures created at capillary radius 10 µm, while Figure 5d presents results for bimodal structures (50% volume S-S additions) for varied capillary radius between 10 and 80 µm. Accordingly, the modulated bimodal structures created at a 10 µm capillary radius had the highest sound absorption properties, while the monosized S-S structures created at a 10 µm capillary radius had the lowest. This means that the creation of bimodal structures simply increases the available pore volume and pore contacts in macroporous structures, which reduces the amount of reflected sound waves that penetrate the inlet surface of the porous body. Finally, for the monomodal and bimodal structures, optimal sound absorption spectra and properties were achieved by keeping the mean pore opening radius between 80 and 140 µm, which led to a computed flow permeability between 0.60 and 1.7 × 10⁻⁹ m2.
As shown in Figure 5, the permeability of these macroporous structures has a direct influence on the numerical prediction of their vibroacoustic behaviour. Numerical applications of the equivalent fluid Wilson model do not directly use mean pore size or mean pore opening, but they are directly linked to the permeability of porous structures. In the inverse replication casting route of foam making, the ideal permeability values can be achieved by mechanically manipulating pore sizes (related to pore size [18]), applied infiltration pressure (related to pore openings [35]) and packing density (related to pore volume fraction [37]). Equation (1) reveals the correlation between permeability and pore structure for a deeper understanding of vibroacoustic behaviour for these kinds of structures and could be a valuable tool for modelling their behaviour. Figure 5a and Table 3 show that varying the permeability can result in a change in the absorption spectrum at either frequency maxima or minima and a change in the quarter wavelength hard-backed layer resonance peak. In addition, the dynamic tortuosity and porosity of these materials are crucial considerations. In Table 3, the manipulation of sphere-packing models to create virtual structures illustrates the difficulty in understanding which of these two properties is dominant, as both properties changed in response to changes in pore sizes or pore openings. The two properties, however, were inversely related, being lower for a bimodal structure, and their relationship could be best described using Bruggeman’s relation () described in [17,41]. A plot of the natural log of the dynamic tortuosity () against the log of the porosity of the sample () shows that the relationships are linear-inverse, yielding a tortuosity factor () of 0.69, a shape factor () of 0.3, and a very good fit . There are explicit predictions of lower and upper bound values for this tortuosity factor () in [42,43], ranged between 0.40 and 0.60 for most porous metallic structures. The tortuosity factor obtained in this study fell outside this range due to the reduced pore-nonuniformity and differential opening available in bimodal structures, whereas model predictions in [42,43] were made with porous structures with monomodal pores. Earlier work described in [17] had estimated the tortuosity factor () for virtual macroporous structures characterised by monosized pores as 0.552, which is within the limit prescribed in [42,43].
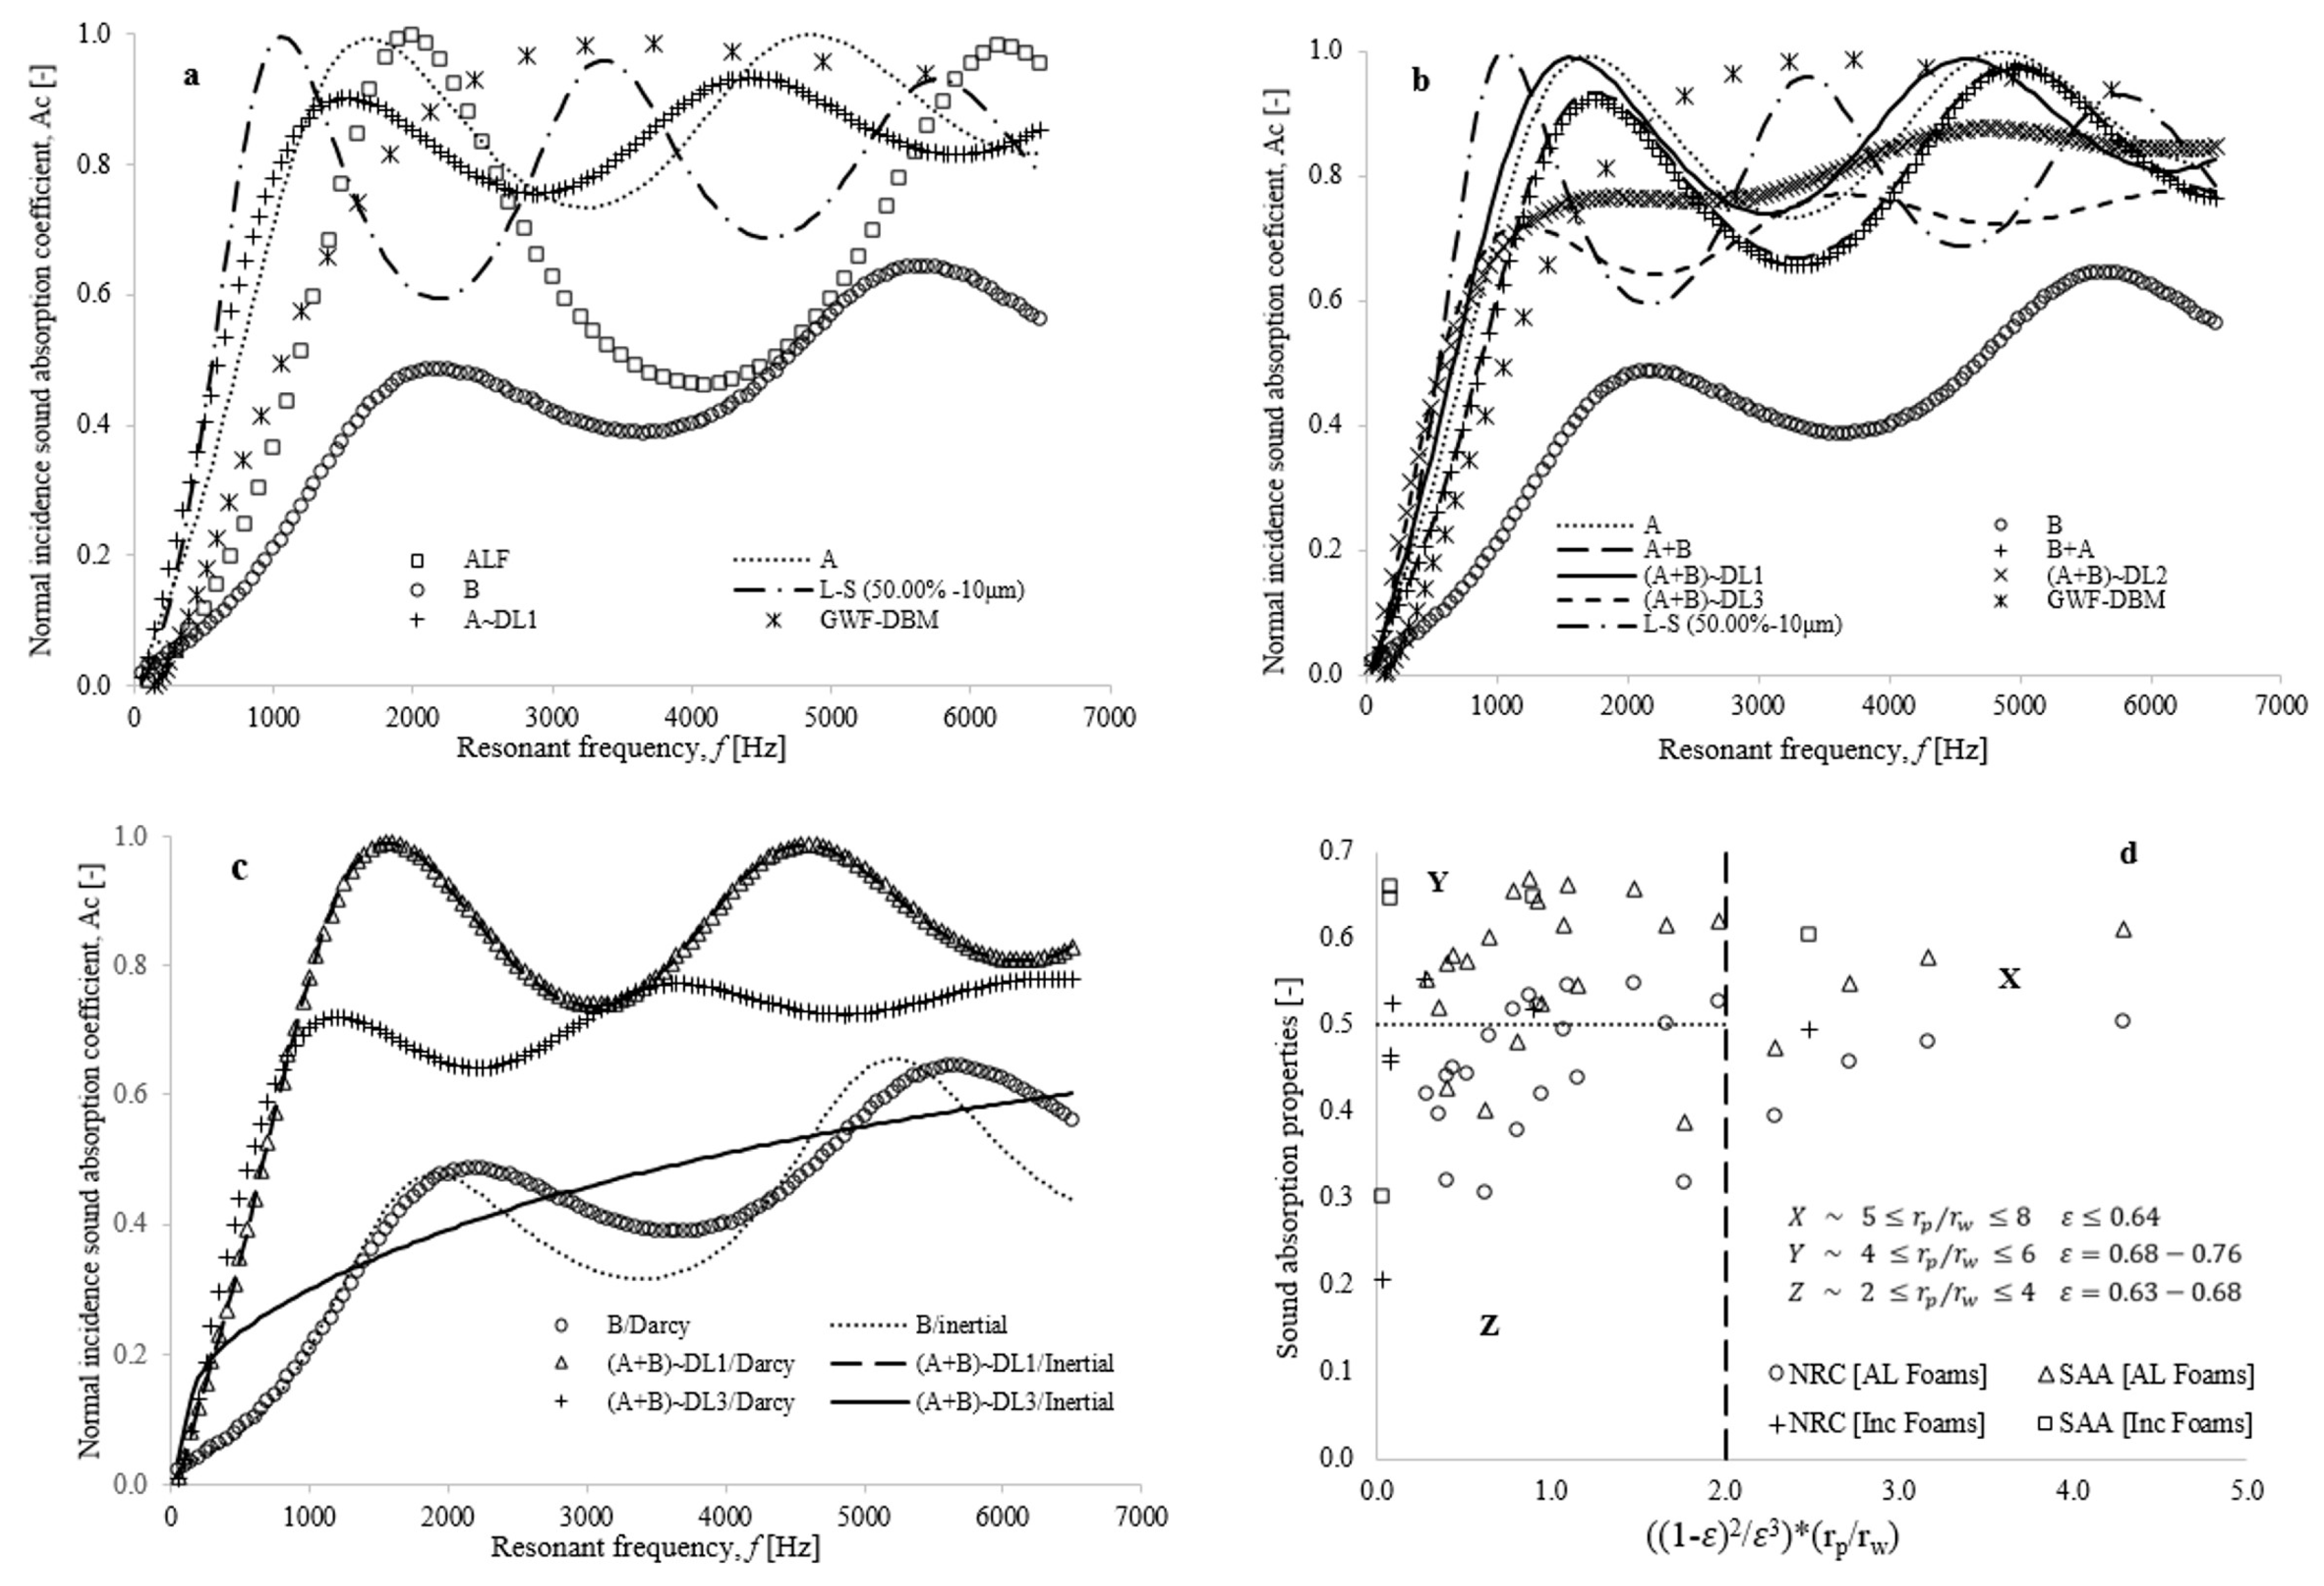
The enhanced bimodal structure (L-S, 50% volume at 10 m capillary radius) showed a significantly different vibroacoustic behaviour compared to the benchmark reported for bottleneck-type aluminium foam (ALF [3]), and commercial soundproofing materials like glass wool fibre (GWF [8,9]), the Inconel 450 µm~(A) and Inconel 1200 µm~(B) porous metallic samples. Figure 6a illustrates how the enhanced bimodal bottleneck structures absorb sound pressure waves at lower frequencies (typically less than 2.0 kHz), compared with other soundproofing devices. The numerical simulations found that the sound absorption spectra of Inconel 450 µm~(A) and glass wool fibre (GWF) materials flattened out at higher frequencies which may be attributed to their high pore volume fraction and reduced pore-nonuniformity. Figure 6a also illustrates how structural dilation of the internal morphology of the representative Inconel 450 µm sample (A-DL1) slightly alters its sound absorption spectrum to a lower frequency but with the upside of reduced quarter wavelength hard-backed layer resonance peak (). To create a 3D representative dual-porosity sample (A + B), selected differential stacked X-ray computerised tomography datasets of Inconel 450 µm (Figure 2g) and Inconel 1200 µm (Figure 2h) samples were imported into 3D imaging software for image processing, see Figure 2i. Structure dilation of this structure occurred through the addition of 20 µm voxel elements to the internal topology of the microstructure, resulting in a semi-virtual structure demonstrating reduced pore volume, increased pore-nonuniformity, and high surface area. Figure 6b shows that the 1-pixel dilated structure, (A + B)-DL1, produced better sound absorption spectra compared to the original A, B, and A + B and other commercially available soundproofing materials. By contrast, the continuous addition of new pixels to the “real” dual-porosity sample (A + B) progressively complicates their topology, thereby reducing their pore openings and providing greater resistance to the penetration and absorption of sound pressure waves.
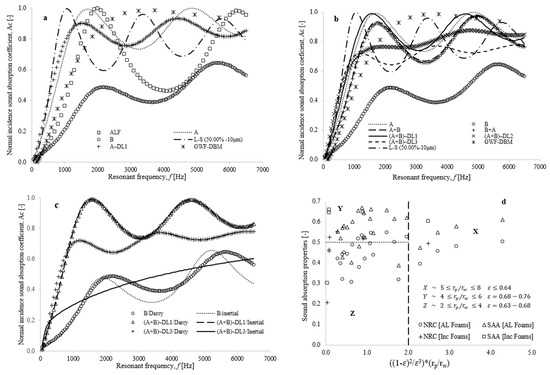
Figure 6.
Plots of numerically predicted normal incidence sound absorption spectra against resonant frequency, f [Hz] for (a) Inconel 450 µm (A), Inconel 1200 µm (B) and some selected materials (b). Dual-porosity differential (A and B) microcellular structures (c) A and B samples at different fluid flowing regimes for 40 mm porous layer thickness and (d) plots of sound absorption properties against a dimensionless ratio of pore radii (rp), pore openings (rw) and sample porosity (ε).
According to Figure 6b, the direction of the pressure waves penetrating either of the surfaces (i.e., A + B or B + A) of the dual-porosity structures has very little influence on their acoustic properties, and their computed sound absorption spectra were actually better at higher frequencies than what was achieved for the enhanced bimodal bottleneck structure. Figure 6c shows the influence of changes associated with Darcian and inertial permeability values on the acoustic properties of these dual-porosity modulated materials. Table 4 clearly demonstrates that changes in fluid flow regimes result in changes in the flow permeability, and slight distortions in their viscous characteristic length are also observed. Based on the results of the study described in [38], it was found that at extremely low air velocities (creeping flow regime), flow permeability varied depending on the pore-structure-related parameters. For high air velocity flow (typically, above 0.5 m.s−1), the presence of forced recirculation and high particle interaction within the interstitial pores of the porous matrix alters their permeability value from that obtained for low air velocity flow [38]. Phanikumar and Mahajan [44] showed that in metal foams, fluids that move slowly are confined to their outer regions, whereas a relative velocity gradient arises for fast-moving fluids when they penetrate deeper into the pores of the porous matrix. Figure 6c shows how numerically simulated sound absorption spectra can differ depending on the key permeability values used for low or high airflow velocities—which is better for slow-moving fluid in the Darcy regime. Normal incidence sound absorption properties for mid-porosity range modulated microstructures (A + B)—DL2 in both Darcy and inertial fluid flow regimes overlap completely, underscoring the importance of permeability changes in cellular materials for their vibroacoustic behaviour. Furthermore, it is important to demonstrate the direct relationship between formulated key pore-structure-related properties and acoustic properties. Figure 6d shows such a plot—categorising how these structural properties affect acoustic properties. Structures classified as Z have relatively poor sound absorption properties, with pore volume fractions (ε) between 0.63 and 0.68, and pore size to opening ratios () between 2.0 and 4.0. Further, structures classed as X are the best for low frequency ( kHz) absorption, while optimum absorption performance was obtained for structures classed as Y typified by pore volume fractions (ε) between 0.68 and 0.76, and pore size to pore opening ratios () between 4.0 and 6.0. Table 3 demonstrates that the highest sound absorption was achieved for 50% volume S-S structures when created at 10 µm and characterised by pore volume fraction () and pore size to pore opening ratio () that are within the specified range. In excess of these 50% volume packing conditions, key structural properties and resulting acoustic properties were below optimum levels. For instance, for 62.5 and 75.00% volume S-S packing conditions created at 10 µm capillary radius, their computed pore volume fractions were 0.68 and 0.65, respectively, and their overall pore size to pore opening ratio and characteristic sound absorption properties fell within structures categorised as type Z (See Figure 6d). As a result, a higher number of smaller pores are in contact—resulting in a reduced mean pore connectivity that is closer to the 100% volume S-S packing condition. Thus, it is pertinent to recommend that a reduction in the number of design iterations can be achieved by working within the specified limiting range of these key pore structure parameters to satisfy application requirements for the processing of enhanced soundproofing metallic components.

Table 4.
Tabular representation of pore-structure-related information and sound absorption properties for Inconel 450 µm, 1200 µm, and dual-porosity microstructures.
4. Conclusions
Sphere packing models, along with numerical modelling and simulation, have been combined to predict key pore-structure parameters and sound absorption properties of monomodal and bimodal macroporous structures. The predictions indicate the clear significance of permeability and acoustic properties on these key pore-structure-related parameters—typically, mean pore size, mean pore opening, and sample porosity, and the results were substantiated by making a comparison with relevant literature data. Bimodal macroporous structures have the effect of increasing the number of pore openings and pore volume, which results in a shift in absorption spectra to frequency minima, and a progressive flattening. The change in absorption spectra is consistent with greater penetration of pressure waves across the pores. The creation of dual-porosity dilated structures and changes in fluid velocity emphasise how pore-structure-related properties can be used to modulate the sound absorption properties of macroporous structures. It is evident that these structures have the potential for improving their sound absorption performance—optimal performance indicated by maintaining pore volume fraction (ε) between 0.68 and 0.76, and pore size to pore opening ratio () between 4.0 and 6.0. In the ongoing work, experiments are being conducted to fabricate bimodal, dual- and multi-porosity foams and determine single, multispecies and multiphase momentum, mass, and energy transport, as well as their vibroacoustic performance.
Author Contributions
CRediT’s author statement for this research work can be found below. A.J.O., software: conceptualisation, methodology, writing-original draft preparation, investigation, data curation, resources. O.D.A. and I.B., visualisation, validation, formal analysis. O.A.O. and J.O.O., reviewing and editing, project administration, formal analysis. All authors have read and agreed to the published version of the manuscript.
Funding
This research received no external funding.
Institutional Review Board Statement
Not applicable.
Informed Consent Statement
Not applicable.
Data Availability Statement
The data presented in this study are available on request from the corresponding author. The data are not publicly available due to organizational privacy.
Acknowledgments
A.J. appreciates the support of Andrew R. Kennedy (Lancaster University, UK), The University of Nottingham, UK, Synopsis-Simpleware Ltd., Dulles, VA, USA, Bowers and Wilkins Group UK, Petroleum Technology Development Fund, Nigeria and Federal University of Technology Minna, Nigeria for the provision of office space, licenses, foams, X-ray CT datasets and technical support needed for the successful completion of this work.
Conflicts of Interest
The authors declare no conflict of interest.
References
- Berglund, B.; Lindvall, T.; Schwela, D. WHO Guidelines for Community Noise; Stockholm University and Karolinska Institute: Solna, Sweden, 1995; Available online: https://www.who.int/docstore/peh/noise/Comnoise-1.pdf (accessed on 1 December 2022).
- Lu, T.J.F.; He, D. Sound Absorption of Cellular Metals with Semi-Open Cells. J. Acoust. Soc. Am. 2000, 108, 1697–1708. [Google Scholar] [CrossRef] [PubMed]
- Li, Y.; Zhendong, L.; Han, F. Airflow Resistance and Sound Absorption Behaviour of Open-celled Aluminium Foams with Spherical Cells. Procedia Mater. Sci. 2014, 4, 187–190. [Google Scholar] [CrossRef]
- Muhammed, M.M.; Sa’at, N.A.; Naim, H.; Isa, M.C.; Yussof, N.H.N.; Yati, M.S.D. The Effect of Air Gap Thickness on Sound Absorption Coefficient of Polyurethane Foam; Marine Material Research Group, Science and Technology Research, Institute of Defence, Ministry of Defence: Kajang, Malaysia, 2013. [Google Scholar]
- Jorges, P.A.; Malcom, J.C. Recent-Trends in Porous Sound-Absorbing Materials. Sound Vib. 2010, 44, 12–17. [Google Scholar]
- Bo, Z.; Tianning, C. Calculation of Sound Characteristics of Porous Sintered Fiber Metal. Appl. Acoust. 2009, 70, 337–346. [Google Scholar] [CrossRef]
- Kino, N.; Ueno, T. Comparison between Characteristic Lengths and Fiber Equivalent Diameter in Glass Fiber and Melamine Foam Materials of Similar Flow Resistivity. J. App. Acoust. 2008, 69, 325. [Google Scholar] [CrossRef]
- Otaru, A.J. Enhancing the Sound Absorption Performance of Porous Metallic Structures using Tomography Images. Appl. Acoust. 2019, 143, 183–189. [Google Scholar] [CrossRef]
- Otaru, A.J.; Odumu, O.E.; Manko, Z.; Isah, A.G.; Isa, R.O.; Corfield, M.R. The Impact of Microcellular Structures on the Sound Absorption Spectra for Automotive Exhaust Performance Mufflers. Appl. Acoust. 2022, 187, 108508. [Google Scholar] [CrossRef]
- Lu, J.J.; Hess, A.; Ashby, M.F. Sound Absorption of Metallic Foams. Am. Inst. Phys. 1999, 99, 07511-9. [Google Scholar] [CrossRef]
- Han, F.; Seiffert, G.; Zhao, Y.; Gibbs, B. Acoustic Absorption Behaviour of an Open-celled Aluminium Foam. J. Phys. D 2003, 36, 294–302. [Google Scholar] [CrossRef]
- Liu, P.S.; Chen, G.F. Porous Materials Processing and Applications; Tsinghua University Press Limited: Beiing, China; Elsevier Inc.: Amsterdam, The Netherlands, 2014; pp. 120–150. [Google Scholar]
- Lautensack, C.; Kabel, M. Modelling and Simulation of Acoustic Absorption of Open Cell Metal Foams, Cellular Metals for Structural and Fundamental Applications; Fraunhofer IFAM: Dresden, Germany, 2009; pp. 271–276. [Google Scholar]
- Otaru, A.J.; Morvan, H.P.; Kennedy, A.R. Numerical Modelling of the Sound Absorption Spectra for Bottleneck Dominated Porous Metallic Structures. Appl. Acoust. 2019, 151, 164–171. [Google Scholar] [CrossRef]
- Peng, H.X.; Fan, Z.; Evans, J.R.G. Microstructure of Ceramic Foams. J. Eur. Ceram. Soc. 2000, 20, 807–813. [Google Scholar] [CrossRef]
- Zielinski, T.G. Generation of Random Microstructures and Prediction of Sound Velocity and Absorption for Open Foams with Spherical Pores. J. Acoust Soc. Am. 2015, 137, 1790–1801. [Google Scholar] [CrossRef] [PubMed]
- Otaru, A.J. Review on the Acoustical Properties and Characterization Methods of Sound Absorbing Porous Structures: A focus on microcellular structures made by a replication casting method. Met. Mater. Int. 2020, 26, 915–932. [Google Scholar] [CrossRef]
- Langston, P.; Kennedy, A.R. Discrete Element Modelling of the Packing of Spheres & its Application to the Structure of Porous Metals made by Infiltration of Packed Beds of NaCl Beads. Powder Technol. 2014, 268, 210–218. [Google Scholar]
- Zwikker, C.; Kosten, C.W. Sound Absorbing Materials; Elsevier: New York, NY, USA, 1949. [Google Scholar]
- Biot, M.A. Theory of Propagation of Elastic Waves in a Fluid-Saturated Porous Solid II: Higher Frequencies Range. J. Acoust. Soc. Am. 1956, 28, 168–178. [Google Scholar] [CrossRef]
- Attenborough, K. Models for the Acoustical Characteristics of Air Filled Granular Materials. Acta Acoust. 1993, 1, 213–226. [Google Scholar]
- Delany, M.E.; Bazley, E.N. Acoustical Properties of Fibrous Absorbent Materials. Appl. Acoust. 1970, 3, 105–116. [Google Scholar] [CrossRef]
- Mikki, Y. Acoustical Properties of Porous Materials-Modifications of Delany Bazley Model. J. Acoust. Soc. Am. Jpn. 1990, 11, 19–24. [Google Scholar] [CrossRef]
- Johnson, D.L.; Koplik, J.; Dashen, R. Theory of Dynamic Permeability & Tortuosity in Fluid-Saturated Porous Media. J. Fluid Mech. 1987, 176, 176–402. [Google Scholar]
- Lafarge, D.; Lemarinar, P.; Allard, J.F. Dynamic Compressibility of Air in Porous Structure at Audible Frequencies. J. Acoust Soc. Am. 1997, 102, 1995. [Google Scholar] [CrossRef]
- Prides, S.R.; Morgan, F.D.; Gangi, A.F. Drag Forces of Porous-Medium Acoustics. Phys. Rev. B 1993, 47, 4964–4978. [Google Scholar] [CrossRef] [PubMed]
- William, K.L. An Effective Density Fluid Model for Acoustic Propagation in Sediments Derived from Biot’s Theory. J. Acoust. Soc. Am. 2001, 110, 2276–2281. [Google Scholar] [CrossRef] [PubMed]
- Wilson, K. Relaxation-Matched Modelling of Propagation through Porous Media, Including Fractal Pore Structure. J. Acoust. Soc. Am. 1993, 94, 1136–1145. [Google Scholar] [CrossRef]
- Otaru, A.J.; Manko, Z.; Odumu, O.E.; Isah, A.G.; Corfield, M.R. Numerical Modelling and Optimisation of Reverberation Cutback for Packed Spheres. J. King Saud Univ. Eng. Sci. 2021; in press. [Google Scholar] [CrossRef]
- Otaru, A.J.; Morvan, H.P.; Kennedy, A.R. Modelling and Optimisation of Sound Absorption in Replicated Microcellular Metals. Scr. Mater. 2018, 150, 152–155. [Google Scholar] [CrossRef]
- Kalita, U.; Pratap, A.; Kumar, S. Absorption Materials used in Muffler: A Review. Int. J. Mech. Ind. Technol. 2015, 2, 31–37. [Google Scholar]
- Otaru, A.J.; Isa, R.O.; Emene, A.U.; Faruq, A.A.; Sedemogun, P.O.; Hassan, S.M. The Effective Thermal Conductivity of Virtual Macroporous Structures. Results Eng. 2022, 15, 100531. [Google Scholar] [CrossRef]
- Otaru, A.J.; Kennedy, A.R. The Permeability of Virtual Macroporous Structures Generated by Sphere-Packing Models: Comparison with Analytical Models. Scr. Mater. 2016, 124, 30–33. [Google Scholar] [CrossRef]
- Perrot, C.; Chevillotte, F.; Jaouen, L.; Hoang, M.T. Acoustic Properties and Applications; Technology & Engineering; DESTECH Publication, Inc.: Lancaster, PA, USA, 2013. [Google Scholar]
- Otaru, A.J.; Morvan, H.P.; Kennedy, A.R. Airflow Measurement Across Negatively-Infiltration Processed Porous Aluminium Structures. AIChE J. 2019, 65, 1355–1364. [Google Scholar] [CrossRef]
- Otaru, A.J.; Morvan, H.P.; Kennedy, A.R. Measurement and Simulation of Pressure Drop across Replicated Microcellular Aluminium in the Darcy-Forchheimer Regime. Acta Mater. 2018, 149, 265–275. [Google Scholar] [CrossRef]
- Otaru, A.J. Review on Processing and Fluid Transport in Porous Metals with a Focus on Bottleneck Structures. Met. Mater. Int. 2020, 26, 510–525. [Google Scholar] [CrossRef]
- Otaru, A.J.; Abdulkadir, M.; Corfield, M.R.; Kenfack, A.; Tanko, N. Computational Evaluation of Effective Transport Properties of Differential Microcellular Structures. AIChE J. 2020, 66, e16928. [Google Scholar] [CrossRef]
- Furman, E.L.; Finkelstein, A.B.; Cherny, M.L. The Permeability of Aluminium Foams Produced by Replicated-Casting. Metals 2013, 3, 49–57. [Google Scholar] [CrossRef]
- Despois, J.F.; Mortensen, A. Permeability of Open-pore Microcellular Materials. Acta Mater. 2005, 53, 1381–1388. [Google Scholar] [CrossRef]
- Du Plessis, J.P.; Fourie, J.G. Pressure Drop Modelling in Cellular Metallic Foams. Chem. Eng. Sci. 2002, 57, 2781–2789. [Google Scholar]
- Dias, R.; Teixeira, J.A.; Mota, M.; Yelshin, A. Tortuosity Variation in a Low-Density Binary Particulate Beds. Sep. Purif. Technol. 2006, 51, 180–184. [Google Scholar] [CrossRef]
- Guo, P. Lower and Upper Bounds for Hydraulic Tortuosity of Porous Materials. Transp. Porous Media 2015, 109, 659–671. [Google Scholar] [CrossRef]
- Phanikumar, M.S.; Mahajan, R.L. Non-Darcy Natural Convection in High Porosity Metal Foams. Int. J. Heat Mass Transf. 2002, 45, 3781–3793. [Google Scholar] [CrossRef]
Disclaimer/Publisher’s Note: The statements, opinions and data contained in all publications are solely those of the individual author(s) and contributor(s) and not of MDPI and/or the editor(s). MDPI and/or the editor(s) disclaim responsibility for any injury to people or property resulting from any ideas, methods, instructions or products referred to in the content. |
© 2023 by the authors. Licensee MDPI, Basel, Switzerland. This article is an open access article distributed under the terms and conditions of the Creative Commons Attribution (CC BY) license (https://creativecommons.org/licenses/by/4.0/).

