Article

A Hybrid Heuristic Algorithm for Maximizing the Resilience of Underground Logistics Network Planning

1
College of Civil and Transportation Engineering, Shenzhen University, Shenzhen 518060, China
2
Key Laboratory of Coastal Urban Resilient Infrastructures (Shenzhen University), Ministry of Education, Shenzhen 518060, China
3
Underground Polis Academy, Shenzhen University, Shenzhen 518060, China
*
Author to whom correspondence should be addressed.
Appl. Sci. 2023, 13(23), 12588; https://doi.org/10.3390/app132312588
Submission received: 31 October 2023 / Revised: 16 November 2023 / Accepted: 20 November 2023 / Published: 22 November 2023
(This article belongs to the Section Transportation and Future Mobility)

Abstract

:
In recent times, there has been a sharp increase in the congestion of ground transportation, the scarcity of land resources, and various disasters. Hence, there is an urgent need to find an effective and sustainable approach to transportation. The construction of an underground logistics network, where transportation activities occur beneath the surface of the ground, is anticipated to emerge as a future trend. This study aims to formulate a resilient-maximizing plan for the underground logistics network, ensuring optimal meeting of transportation demands in the aftermath of ground disasters. Accordingly, a two-stage linear programming model is established to determine the layout plan for the most resilient underground logistics network. The first phase of the model is designed to generate viable layouts for the underground logistics network, while the second phase is dedicated to evaluating the resilience of the proposed layout plan. During the evaluation of network resilience, Monte Carlo simulations are used to simulate disaster scenarios. Given the inherent complexity of the model, the traditional solver cannot efficiently solve the problem. Thus, a new hybrid heuristic algorithm is designed to obtain solutions that maximize network resilience. The results show the effectiveness of the designed algorithm and the significant improvement in network resilience achieved by numerical experiments. Moreover, sensitivity analyses are conducted to reveal the relationships between resilience and budget, as well as resilience and the capacity of underground pipelines. It has a significant impact on sustainability when making decisions regarding network planning.

1. Introduction

As demand for logistics in cities has increased sharply in recent years, the traditional means of transportation cannot fulfill the increasing demand that produces many negative externalities, such as excessive resource consumption, environmental pollution, and traffic congestion [1]. These factors significantly affect the quality of life and sustainable development of the urban economy. According to data released by the China Federation of Logistics and Purchasing, there was a consistent year-on-year increase in the total cost of social logistics in China from 2006 to 2016. In 2018, the total cost of social logistics amounted to 36.22 trillion euros, representing an almost fivefold increase compared to 2006 [2]. As the scarcity of urban land has become increasingly severe, this problem cannot be alleviated by building new roads on the ground. Hence, a new concept of “utilizing the underground space of the city” has been proposed—using underground pipelines to transport goods automatically [3]. This means a transport network consisting of a dedicated set of underground nodes and tunnels that connects the urban logistics centers of cities. This network has been put on the development agenda in several regions of the world [4,5].
Underground logistics networks are recognized as an advanced, intelligent means of transportation, which can not only improve the service level of the logistics network and reduce energy consumption and environmental pollution but also alleviate the impact of natural disasters [6,7]. This means of transportation integrates subterranean transport pipelines, tunnels, and storage facilities. The primary objective is to optimize the utilization of underground spaces, striving for more efficient and sustainable cargo transportation and logistical services. This, in turn, supports the broader goal of fostering sustainable economic development. Currently, some key technologies, such as automatic transportation and tunnel construction, are gradually maturing [8]. Additionally, several pilot projects and engineering practices are underway [9]. In the meantime, there are some studies that systematically discuss the design of an underground logistics network, especially in terms of system planning. For example, planning the layout of underground pipelines and nodes to achieve higher network efficiency and resilience is a significant problem.
Currently, several studies on underground logistics networks only focus on minimizing construction costs and maximizing utilization. For example, some layouts of underground logistics networks or subway systems can be planned to meet the goal of minimum construction costs [10,11]. In addition, the layout planning of underground logistics networks also considers the impact of other factors, such as drainage and track systems [12]. However, studies that focus on this aspect of resilience are scarce. It is necessary to consider whether the construction of an underground logistics network can improve the resilience of a system when facing disasters. The resilience of a network typically refers to its ability to resist and recover from disasters. It is an important indicator of sustainability and can be divided into two types: structural resilience (network topology) and performance resilience (network operation level). Current research on network resilience primarily involves the ground transportation network and has very little to do with the logistics network, especially with the underground logistics network. Moreover, most studies have focused on network structural resilience. For example, studies have used the average shortest circuit length and three node degrees as efficiency indicators, the maximum subgraph concentration as connectivity indicators, and the number of shortest circuits as resilience indicators [13]. Few studies have been conducted on performance resilience. The most typical research uses the average satisfaction rate of origin–destination (OD) pairs as an index to evaluate network performance resilience [14]. This indicator reflects the ability of a network to maintain a certain operational level during disasters.
In the current literature, few studies have been conducted on the planning of underground logistics networks, especially on planning that considers network performance resilience. Hence, in this study, a two-stage model using the average demand satisfaction rate as a performance resilience index is established. The objective is to obtain the layout of an underground logistics network that provides the ground–underground network with the highest resilience. In this study, the Monte Carlo method is used to simulate disaster scenarios. Different layout plans of the generated underground logistics network are put into different scenarios for comprehensive evaluation. This study not only fills some gaps in the research on network resilience but also provides new insights for cities on how to save energy and reduce emissions to achieve sustainable development.
The remainder of this paper is organized as follows: Section 2 provides a comprehensive review of pertinent literature. Section 3 offers a detailed description of the problem, presenting a mathematical model. In Section 4, we introduce a hybrid heuristic algorithm. Section 5 is dedicated to the presentation of numerical experiments and analysis. Finally, Section 6 summarizes the research findings, and Section 7 delves into potential avenues for future research.

2. Literature Review

2.1. Underground Logistics Network

Important concepts regarding network topology and the operating model of underground logistics networks have been proposed. Its decisions are grouped into three categories: determining the location, assigning routes, and optimizing vehicle time [15]. The Netherlands has planned a series of national network projects to transport palletized goods between major cities; these projects are considered to be a substantial breakthrough for the underground logistics network [5]. A hydrodynamic calculation and capsule kinetic analysis model of pipeline capsule movement were established, which provides a theoretical basis for automatic transportation in pipelines [16]. In recent years, the planning of underground logistics networks has emerged as an academic topic. It focuses primarily on the following aspects: network layout and optimization, transport line planning and scheduling of container operations, and subway freight network layout and operation. Currently, research on the planning of underground logistics networks is focused on layout and path planning, aiming at the minimum total cost. For example, a hybrid planning model was proposed to distribute freight between an underground network and maritime highways to obtain a layout plan for an underground logistics network with the goal of cost-minimizing [10,17,18]. In addition, some researchers have developed a weighted set coverage model for node positioning in underground logistics networks aiming at the lowest total cost [19], while others have developed a planning method based on the subway system [11]. The locations of the nodes were allocated considering the service capacity, cargo flow area, and accessibility. In addition, another study established a three-stage maximum coverage model based on the minimum distance and an entropy weight model that was solved by a tabu search and greedy algorithm [20].
Recently, a methodology proposed by Hu et al. [21] revolves around optimizing crucial decisions and considering uncertainties in crafting an integrated urban surface-underground logistics network. The findings underscore its effectiveness in achieving a nuanced equilibrium between conservatism and optimality in the intricate domain of network design. In the domain of container operations and scheduling, Liang et al. [22] devised a mathematical model aimed at optimizing the configuration and scheduling of the underground container logistics system. This comprehensive model encompassed elements such as underground logistics vehicles, gantry cranes for loading and unloading at wells, and ground-automated guided vehicles. The primary objective was to maximize the operational efficiency of the container terminal. In a similar vein, Fan et al. [23] developed a robust optimization model to ascertain appropriate locations for port connecting stations. This model facilitated the seamless integration of underground logistics systems with ports, thereby enhancing port operational efficiency and mitigating traffic congestion. However, in addition to cost, the planning of an underground logistics network also needs to consider several other factors, such as robustness, fragility, and resilience [24]. Underground logistics networks face huge sunk costs once they are put into practice. Planning them with high resistance to disasters is an important aspect to consider in research and engineering practice, but no relevant studies have been found.

2.2. Network Resilience

In recent years, research on network resilience has focused on defining, evaluating, and improving it. Some studies have provided a detailed overview of the concepts of vulnerability, reliability, and resilience in transportation networks. They defined resilience as the interaction between managing organizations, infrastructure, and users [25,26,27]. In the pursuit of alleviating the detrimental impacts associated with the implementation of intelligent transportation systems on urban transit, Ganin et al. [28] applied a percolation theory model to statistically analyze delays resulting from damage to roads and nodes. They introduced the concept of resilience within this context. Scholars have classified many aspects of the assessment methods for network resilience. They proposed five indicators—queue, length, time, speed, and delay time—to evaluate traffic network elasticity and resilience under attacks [29,30,31]. In the domain of evaluating the resilience of transportation networks, a predominant approach involves employing metrics like delay duration and attack time as indicators to assess network resilience [32]. Additionally, a model was established to comprehensively assess the resilience of transportation networks by considering the cost of attack, system stress, and exhaustion level [33]. Regarding resilience improvement, current research has mostly focused on the network structure. For example, studies have proposed different recovery strategies based on different statuses—increasing network lines as strategies to improve traffic network resilience and considering network connectivity, road traffic time, accessibility, and effectiveness as resilience indicators [34,35,36]. In addition, two methods were proposed to improve the resilience of the network. The first is to improve the capacity and reliability of key lines, and the second is to change the topology of the network by considering driving time, shortest path, and other factors [30]. Apart from structural resilience, resilience to performance is also essential for the network. The ability to maintain and recover after attacks needs to be considered when assessing performance resilience [37]. Moreover, a parallel can be drawn between the recovery phase in post-disaster logistics networks and the emphasis on network resilience in this study. Ransikarbum et al. [38] addressed gaps in modeling the recovery phases of humanitarian logistics post-disasters by introducing a hybrid approach named HNSGA-II. This approach highlights the trade-off between fairness and cost in decision-making processes. However, compared to research on network structural resilience, there are fewer studies on performance resilience.
To address the identified research gaps, this paper focuses on maximizing the resilience of underground logistics network planning. The contributions of this paper are articulated as follows:
  • Resilience assessment perspective: This study introduces a distinctive approach to resilience assessment. In contrast to conventional methods centered on structural resilience through efficiency assessments, our emphasis lies on appraising the network service level.
  • Resilience improvement strategies: Departing from conventional methods that enhance resilience through the allocation of resources for disaster supplies and preparedness, we propose improving the resilience of ground logistics networks by constructing underground networks.
  • Network planning perspective: In the planning phase, we not only account for cost and capacity constraints but also assess the impact of constructing an underground logistics network on the resilience of the ground network.

3. Problem Modeling

3.1. Problem Description

The underground logistics network is not only highly resistant to disasters but also provides more alternative routes than on-ground transportation. If the on-ground network is damaged by typhoons, rainstorms, and other natural disasters, demand can be transported through an underground logistics network. Therefore, the resilience of the network can be enhanced and improved. When disasters occur, the best indication of network resilience in terms of performance is the service level. For transportation networks, service level refers to how well demand is met, that is, how much of the demand is met relative to the potential transportation demand. Therefore, we consider the expected demand satisfaction rate of the network under different disaster scenarios as an indicator of resilience. The satisfaction rate is a fraction of the actual demand that can be satisfied after a disaster. The formula for calculating the expected satisfaction rate is as follows:
α = 1 M w W E s S d w s / D w
where D w is the potential demand for the OD pair w . d w s is the post-disaster maximum demand that can be satisfied for OD pair w ; s is the Monte Carlo disaster scenario; M is the total number of OD pairs; and α is resilience index.
The Monte Carlo simulation approach, rooted in the concept of utilizing random sampling to derive numerical results, stands as a potent tool for addressing uncertainty in logistics network planning. This methodology enables a more resilient evaluation of system performance across diverse conditions, thereby enhancing decision-making processes.

3.2. Problem Assumption

Assume a known ground logistics network. Each ground-network node has a corresponding underground candidate node. Once an arc of the underground network is constructed, the nodes at both ends of the arc are constructed. To maximize network resilience, a two-stage mathematical model is formulated to plan an underground logistics network layout. The following are the model decisions to be taken:   i the location of underground logistics nodes and arcs, and ii the demand to be satisfied and assigning routes for all OD pairs. The first stage of the model is the outer layer, which generates feasible layout solutions to select the one with the highest resilience based on the evaluated results obtained in the second stage. The second stage of the model is the inner layer, which evaluates the resilience values of the solutions generated in the first stage.
The model satisfies the following assumptions:
  • Any underground node corresponding to a ground logistics node is a feasible candidate site.
  • The fixed cost of any underground node is the same, and its capacity is the same. The underground arc capacities are the same.
  • Disasters only destroy part of the ground network.

3.3. Notations

  • Sets and Parameters:
    • N , set of ground–underground network nodes, N = 1 , 2 , 3 , , n , n + 1 , , 2 n .
    • N 1 , set of ground network nodes, N 1 = 1 , 2 , 3 , , n .
    • N 2 , set of underground candidate nodes, N 2 = n + 1 , n + 2 , , 2 n .
    • B , budget for underground network construction.
    • W , set of OD pairs.
    • M , total number of OD pairs.
    • A , set of ground–underground network arcs.
    • S , set of Monte Carlo disaster scenarios.
    • D k l , potential demand of the OD pair k l , where k is the origin node and l is the destination node.
    • c a p i , capacity of the node i .
    • c a p i j , capacity of an arc i , j .
    • b 1 , fixed cost of the underground arc construction per kilometer.
    • b 2 , fixed cost of underground node construction.
    • d i j , distance of an arc i , j .
    • a i j , network–arc indicator (1, if arc i , j is in the ground network; 0, otherwise).
    • e i j , network–arc indicator (1, if arc i , j is the arc between the ground node and the corresponding underground node; 0, otherwise).
  • Decision variables:
    • X i , binary variable indicating whether the underground node i is built (1, if the node i is built; 0, otherwise).
    • Y i j , binary variable indicating whether the underground arc i , j is built (1, if the arc i , j is built; 0, otherwise).
    • Z i j k l , binary variable indicating whether the arc i , j is used (1, if the arc i , j is used; 0, otherwise) between the OD pair k l .
    • F i j k l , satisfied flow along the arc i , j of OD pair k l .

3.4. Mathematical Model
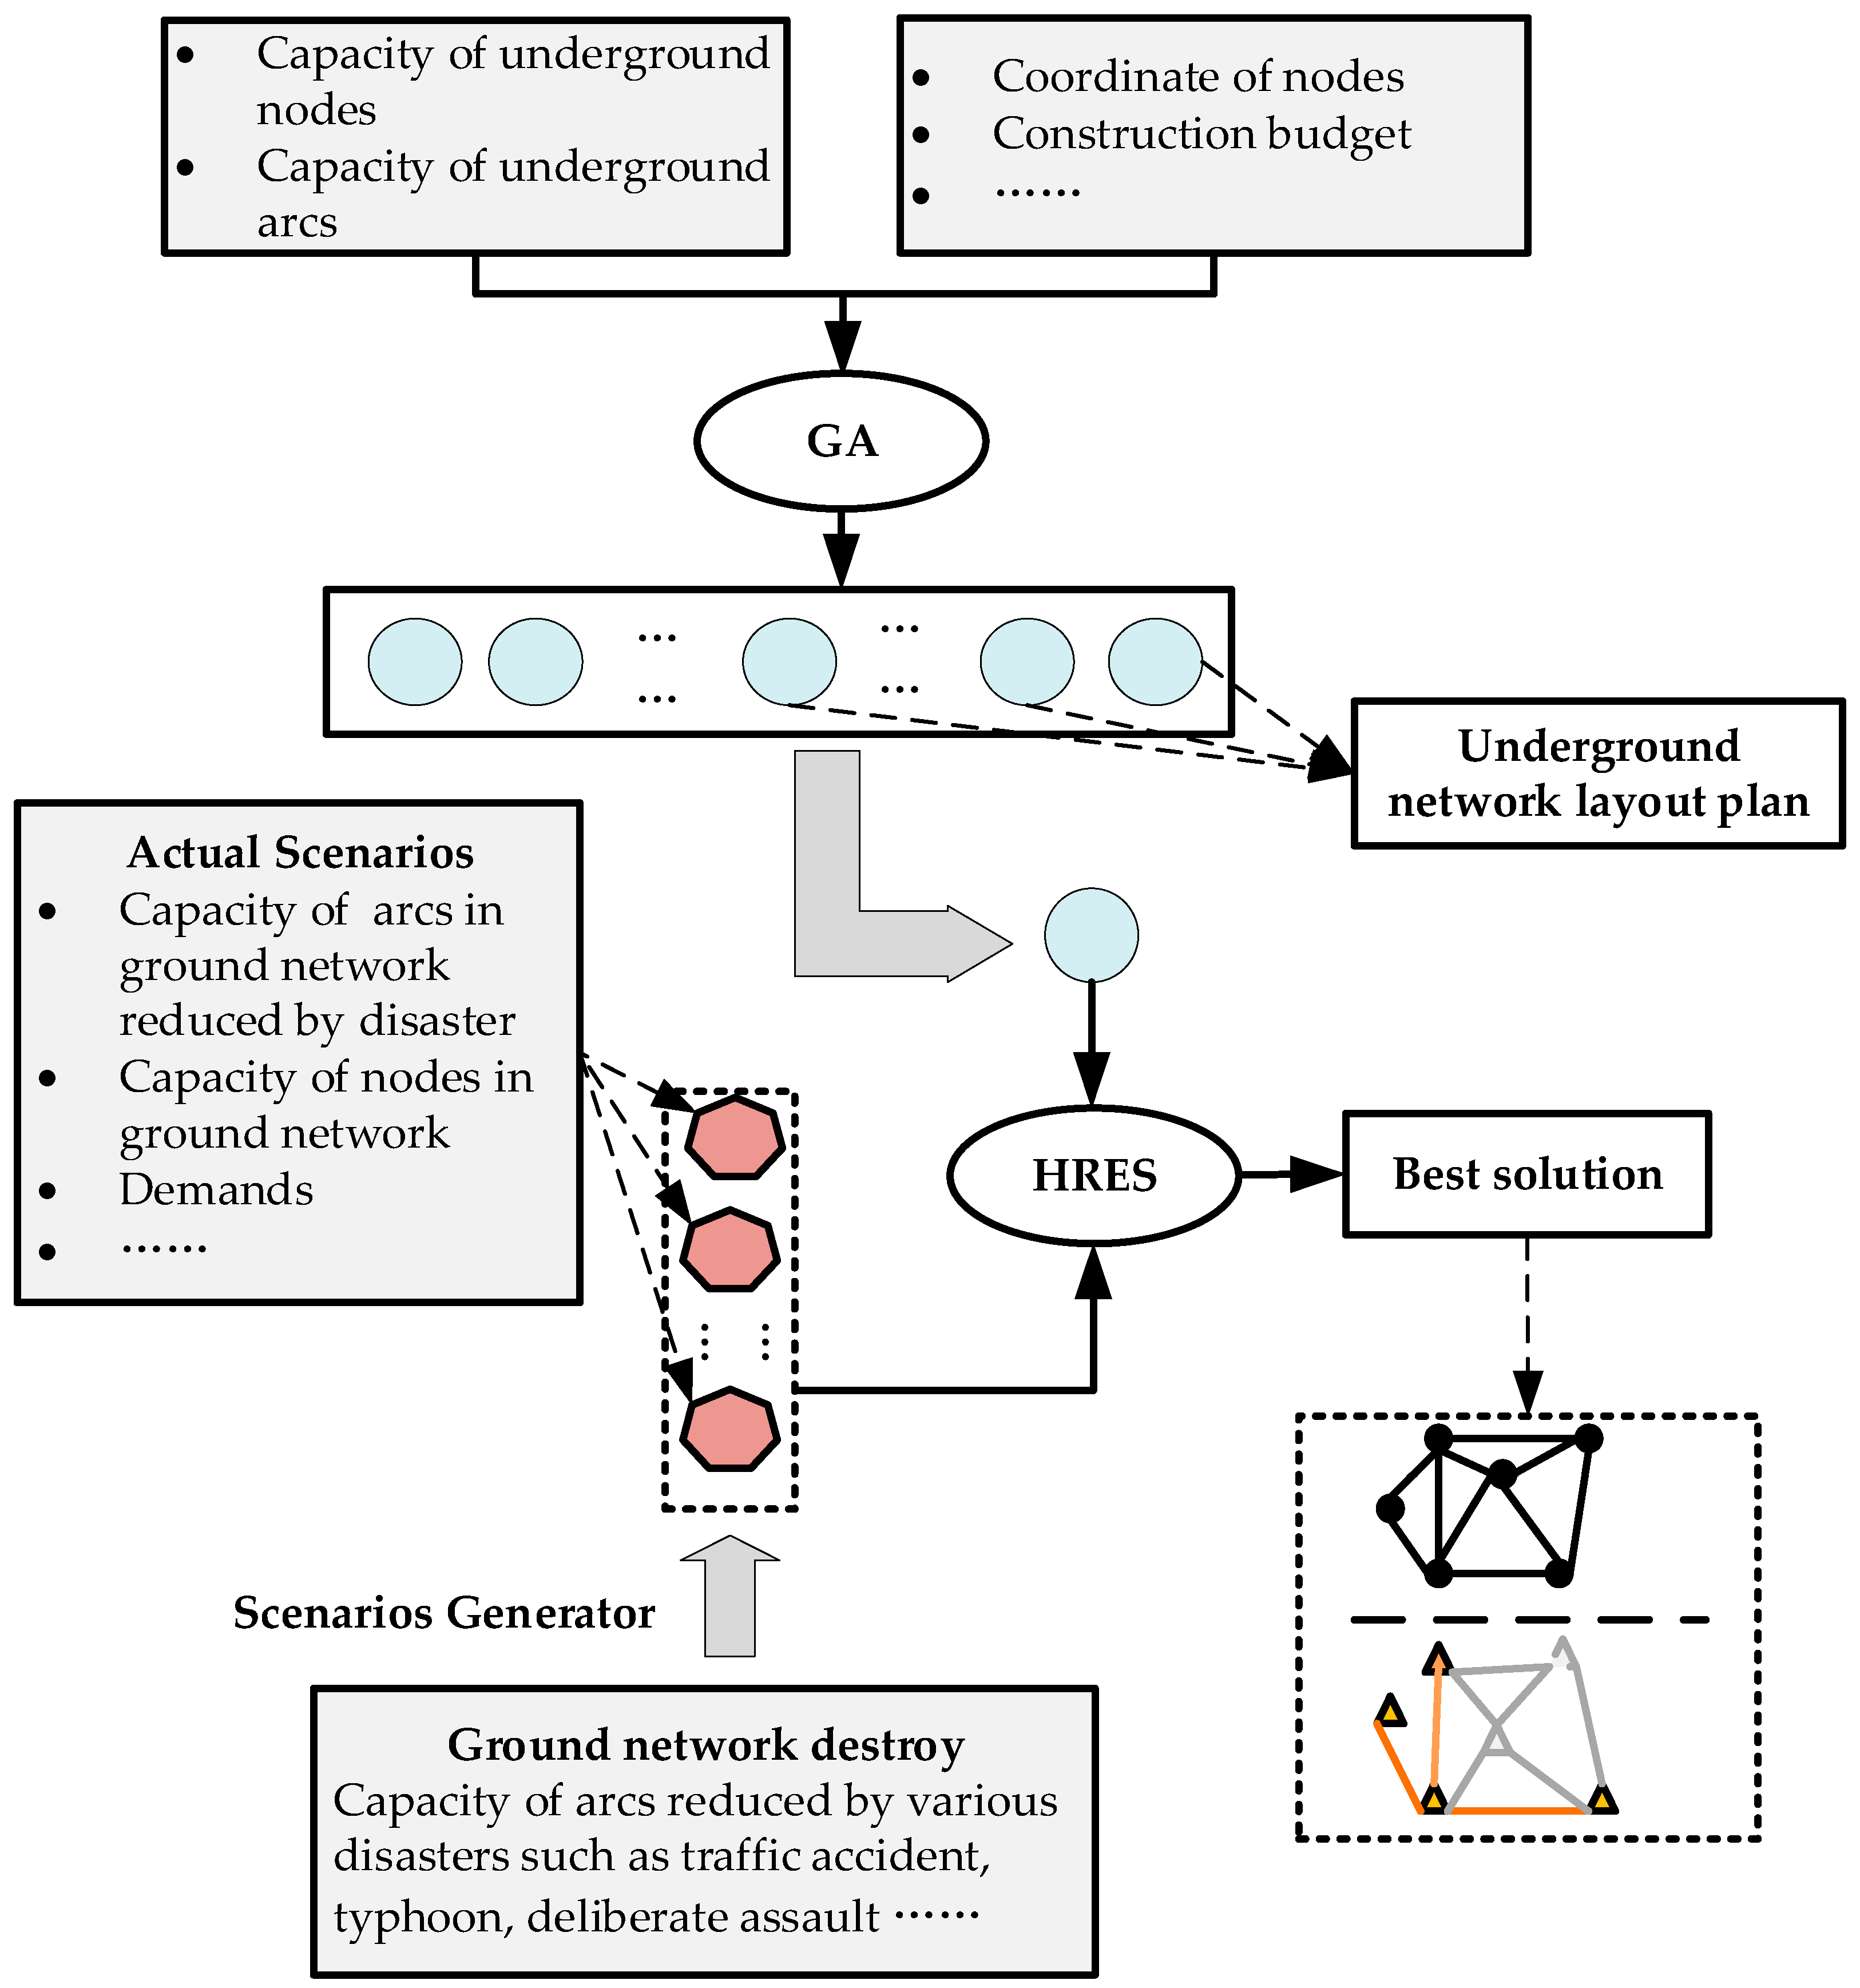
Stage I :
max E s Ζ s
i N 2 b 1 X i + i N 2 j N 2 i j b 2 d i j Y i j B
Y i j X i ,   i , j N 2 , i j
Y i j X j ,   i , j N 2 , i j
X i ,   Y i j 0 , 1 ,   i , j N 2 , i j
Stage II :
max Z s = 1 M j N j k k N 1 k l l N 1 F k j k l D k l
j N j k Z k j k l 1 ,   k , l N 1 , k l
i N i l Z i l k l 1 ,   k , l N 1 , k l
i N i j , l , k Z i j k l 1 ,   k , l N 1 , k l , j N , j k , l
i N i j , l Z i j k l = i N i j , k Z i j k l ,   k , l N 1 , k l , j N , j k , l
Z i j k l a i j ,   k , l , i , j N 1 , k l , i j , i l , j k
Z i j k l Y i j ,     i , j N 2 , i j , k , l N 1 , k l , i l + n , j k + n
Z i j k l e i j X j ,   i , k , l N 1 , j N 2 , k l , i = j n , i l
Z i j k l e i j X i ,   j , k , l N 1 , i N 2 , k l , j = i n , j k
F i j k l c a p i j Z i j k l ,   k , l N 1 ,   k   l
i N i j , l F i j k l = i N i j , k F j i k l ,   k , l N 1 , j N , k l , j k , j l
j N j k F k j k l D k l ,   k , l N 1 , k l
k N 1 k j l N 1 l k , i F i j k l c a p i ,   i , j N , i j
k N 1 k j l N 1 l k , i F i j k l c a p j ,   i , j N , i j
k N 1 k l , j l N 1 l i   F i j k l c a p i j ,   i , j N ,   i j
Z i j k l 0 , 1 ,   i , j N , k , l N 1
F i j k l 0 ,   k , l N 1 ,   k l , i , j N , i j
In the first stage, the objective Function (1) seeks an underground network layout plan that maximizes resilience. Constraint (2) specifies that the construction of the underground nodes and arcs must not exceed the available budget. Constraints (3) and (4) guarantee that if an arc is constructed, the nodes at its ends are also constructed; however, if nodes are constructed, it does not imply that the arc between these two nodes is necessarily constructed. Constraint (5) ensures that the variables X i , Y i j are binary. Constraint (6) is the objective function of stage I I , which maximizes the average satisfaction rate of all OD pairs. Constraint (7) guarantees that only one path is selected from the origin node. Constraint (8) indicates that only one path can be selected for the destination node. Constraint (9) indicates that only one path can be selected between the two nodes, excluding the origin and destination nodes. Constraint (10) ensures path conservation. Constraint (11) specifies that only arcs on the ground network can be used. Constraint (12) ensures the use of only the underground network arcs that have been built. Constraints (13) and (14) ensure that the construction of an underground node precedes the construction of its corresponding arcs, which connect the ground and underground. Constraint (15) ensures that the traffic flow for each OD pair must not exceed the capacity of the arc. Constraint (16) specifies the conservation of flow. The demand constraint (17) guarantees that the flows for each OD pair do not exceed their potential demand. Constraints (18) and (19) specify that the total flow through an arc must not exceed the capacity of the nodes at the ends of the arc. Constraint (20) specifies that the total flow through an arc should not exceed its capacity. Constraints (21) and (22) define the decision variables.

4. Methodology

The model comprises two stages, both of which are binary. Thus, it cannot be solved directly using linear programming and must be divided into two stages. The first stage is the outer layer, which is solved by a genetic algorithm (GA) to obtain feasible underground layout plans, and the best one is selected based on the evaluated results in the second stage. The second stage is the inner layer, which is solved using a heuristic algorithm to evaluate the resilience of each plan generated in the first stage for various disaster scenarios. Disaster scenarios disrupt ground networks, in which the capacities of some arcs are reduced to different degrees. The arcs that are selected as important arcs of the ground network are ones that have a significant impact on the network’s resilience if they are disrupted.
The entire solution framework is illustrated in Figure 1. First, all necessary parameters, such as the arc capacity and node capacity of the underground network, distance, and budget, are recorded. Second, different underground network layout plans that satisfy budget constraints are generated by GA. Subsequently, every layout plan combines each disaster scenario, which is a disrupted ground network, to form a ground–underground network system. The evaluated results for each layout plan in different disaster scenarios are obtained by a heuristic resilience evaluation scheme (HRES). The average of these results is the resilience value of the layout plan. Iteratively, the resilience of the layout plans is compared so that the most optimal one can be chosen.

4.1. Genetic Algorithm

GA is a type of randomized search method that draws on the evolution of the biological world. For an optimization problem, a certain number of candidate solutions (called chromosomes) act as the population. The initial population is randomly generated to satisfy budget constraints. Chromosomes from the current population are randomly selected as parent chromosomes following the roulette wheel selection strategy based on their fitness. They are then replicated to produce the offspring chromosomes through crossover and mutation. The same number of chromosomes with greater fitness are selected as the new population for the next round of evolution. Iterate repeatedly to evolve towards a better solution. The operation process of the GA is described in Figure 2.

4.1.1. Chromosome Encoding

A GA is used to solve the first stage of the model, in which two decision variables must be solved simultaneously. The first variable is the node position variable x , and the second is the arc position variable y . To solve two variables simultaneously, they usually need to be encoded separately. However, this approach significantly increases the difficulty of solving problems and affects the efficiency of the algorithm. Because arcs and nodes are strongly connected, once an arc is constructed, nodes at both ends of the arc are also constructed. Therefore, we encode only in arcs. Both variables can be solved simultaneously in this manner. The coding approach significantly improved the efficiency of the algorithm. In this algorithm, each chromosome represents a construction plan for an underground logistics network. The chromosome is one-dimensional with n n 1 genes, where n denotes the number of candidate underground nodes. The genes on the chromosomes are binary, having values of 0 and 1. Genes with a value of 1 indicate that the arc at that location is constructed, and those with a value of 0 indicate that the arc is not constructed. The relationship between the arc position and the gene position is shown in Figure 3.

4.1.2. Crossover and Mutation

Because the underground logistics network has only a few pipelines, the gene having a value of 0 is significantly more abundant than its counterpart in the chromosome of the GA, which makes it difficult to cross and mutate to effectively produce better offspring. Therefore, adjusted crossover and mutation methods are employed to overcome this disadvantage.
The crossover method is shown in Figure 4. The genes of each offspring are obtained from the two parents. The procedure is as follows: First, two positions are randomly selected for both parents (A and B in Figure 4). Second, the gene segment of parent 1 in front of position A is copied to the posterior side of offspring 1, and the gene segment of parent 2 behind position A is copied to the anterior side of offspring 1. Similarly, the gene segment of parent 1 behind position B is copied to the anterior side of offspring 2, and the gene segment of parent 2 in front of position B is copied to the posterior side of offspring 2. To eliminate the poor crossover of chromosomes, this study adjusts the crossover frequency. Every time the algorithm runs, the chromosomes are randomly crossed 30 times to enhance the crossover effect. The adjusted crossover method improves solution convergence and the final result.
The mutation method is described in Figure 5. It changes the value of a randomly selected gene segment in the chromosomes to ensure the diversity of the population and prevent premature convergence. We adjust the mutation method to change the gene segment rather than a single gene to increase the possibility of mutation. To enhance this effect, it mutates five times every time the algorithm runs.

4.1.3. Fitness Function

To select the solution with the best resilience from all feasible solutions, the fitness function of the GA should be the resilience value, which was previously described as α = 1 / M w W E s S d w s / D w . The following evaluation algorithm is used to find the path with maximum flow from origin to destination for all OD pairs in the network.

4.2. Heuristic Resilience Evaluation Scheme

The HRES is based on the Dijkstra algorithm and is combined with the Edmonds-Karp algorithm, which finds the maximum flow assignment for all OD demands. A flowchart of the HRES is shown in Figure 6. First, based on the underground network layout generated by the GA and the actual scenario of the ground network, the ground–underground logistics network is initialized, and all relevant parameters are inputted. Second, the largest of all OD demands is selected for subsequent priority flow assignment. Third, we find the path with the maximum flow from the origin to the destination for the selected OD pair. Fourth, the satisfied demand is assigned, and the capacity of the network is updated. This process is repeated until all the demands are met.

5. Case Study

In this section, a series of computational experiments are conducted to demonstrate the application and effectiveness of the proposed method. The model is encoded using Java 8.0. All experiments are performed on a laptop equipped with an Intel (R), 2.80 GHz CPU, and 8 GB of RAM.

5.1. Background Statement

This section focuses on numerical experiments and analysis. Six group experiments of networks are conducted, with 5, 8, 10, 12, 18, and 24 nodes, respectively. The experimental analysis is carried out in the following aspects: (1) comparing the efficiency of the HRES algorithm with the CPLEX solver; (2) comparing the resilience values before and after building an underground network to analyze the effectiveness of the underground logistics network to improve the resilience of the system; and (3) analyzing the sensitivity of the resilience value to budget and underground pipeline capacity. Each scenario is run 10 times, and the average is reported.
In this experiment, foundational data for ground network node capacity and OD demand were acquired by referencing statistical data from Beijing and integrating it with existing Sioux-Falls data. Similarly, fundamental data for underground logistics network node capacity and transportation pipeline capacity were derived from the parameters of completed underground logistics systems in Western European countries. These parameters were further inferred by integrating them with daily traffic flow data from the main roads of Beijing. Table 1 presents the key parameters of the computational experiment.

5.2. Computational Results

In Table 2, the efficacy of the HRES algorithm in solving both larger and smaller network cases surpasses that of CPLEX. The HRES algorithm demonstrates efficient convergence, reaching the final solution within a notably brief timeframe. In contrast, the solving time of CPLEX exhibits a rapid escalation, especially as the network scale increases. This advantage of the HRES algorithm becomes particularly pronounced for larger network cases, surpassing 12 nodes. For example, when assessing a network with 24 nodes, CPLEX requires 203.474 s for a single evaluation, whereas our method completes the same task in only 0.112 s. Although the results of the HRES algorithm may not be as optimal as those of CPLEX, the difference is not considered significant. The experimental outcomes affirm the effectiveness of the developed HRES algorithm.
As shown in Table 3, the construction of underground networks significantly improves the resilience of the original ground network. The network resilience for nearly all nodes increased by at least 15%. The resilience of the ground network with 24 nodes increased by 25%. Figure 7 shows the ground–underground logistics system planning diagram corresponding to the 10-node network. The orange parts of the figure represent the nodes and arcs that are constructed. The gray parts represent the ones that are not built. The figure shows an underground logistics network plan with maximum resilience under budget constraints. Under this layout, the resilience of the ground network is improved by 25.1%.
To test the operational effect of the GA-HRES algorithm, the convergence process is recorded as shown in Figure 8. The convergence process for each case is generally smooth and effective. In particular, for networks with five and eight nodes, not only does the process converge steadily, but the resilience values also evolve from initial to final results in a large scope. The results prove that the GA-HRES algorithm achieves excellent results.
To explore the correlation between resilience values, budget, and underground pipeline capacity, a sensitivity analysis is conducted. As shown in Figure 9, within a certain range, the resilience value increases as the budget grows. However, once a certain threshold is exceeded, the resilience value does not increase any further. For example, for a network of 10 nodes, the resilience value stays at 0.86 once the budget reaches the threshold of 250. A similar situation is observed for the other two groups of networks. Hence, there is an optimal budget level that maximizes the resilience of the optimal layout plan. For instance, in scenarios involving networks with N = 10 and N = 8 , the appropriate budget allocation is 250. Similarly, for the network with N = 12 , the justified budget is 275.
Similarly, within a certain range, the resilience value increases with an increase in the pipeline capacity. Beyond a certain limit, resilience tends to be stable and does not change with increasing capacity. As shown in Figure 10, when the capacity reaches the limit of 19,000, the resilience value tends to 0.87 and remains constant. Hence, there is an optimal value for the capacity of the underground transportation pipeline, ensuring that the resilience of the optimal layout plan is maximized. Consequently, in practical planning and construction, it is imperative to consider establishing a reasonable underground transportation pipeline capacity to minimize unnecessary cost expenditures.

6. Conclusions

This study introduces a groundbreaking strategy to enhance the resilience of ground logistics networks by incorporating the construction of an underground logistics network. This dual-function infrastructure acts proactively against natural disasters like floods and typhoons while providing a reliable alternative for logistics operations during such events. Empirical validation through numerical experiments highlights the effectiveness of implementing an underground logistics network. Resilience exhibits sensitivity to variations in budget and pipeline capacity within a specific range, stabilizing beyond a critical threshold. Determining the optimal budget and pipeline capacity becomes crucial for balancing resilience enhancement and cost-effectiveness in practical planning, avoiding unnecessary expenditures.
Moreover, this study emphasizes the practical value of the proposed model and algorithm for network planners. The integration of budget constraints and underground pipeline capacity considerations empowers planners to strategically enhance ground logistics network resilience. The results contribute nuanced insights into how specific decisions on budget and pipeline capacity impact logistics network resilience, guiding informed decision-making.
In conclusion, this research not only presents an innovative method for boosting ground logistics network resilience but also offers practical insights for network planning under budgetary constraints and infrastructure considerations. Comprehensive numerical experiments attest to the robustness of our approach, providing actionable insights for real-world applications.

7. Discussions

While this study provides a novel perspective on enhancing logistics network resilience, there are several limitations that warrant attention. For instance, the Monte Carlo simulation lacks the inclusion of damage scenarios specific to underground pipelines. Additionally, the assumption of uniform capacity for underground transportation pipelines may oversimplify real-world complexities. A more accurate representation would involve considering capacity in tandem with construction costs.
Furthermore, beyond resilience, there is a need to extend consideration to other objectives, such as accessibility. Exploring efficient metaheuristic algorithms that deliver high-quality solutions within shorter timeframes could enhance the outcomes of the study. Additionally, integrating stochastic and uncertain factors into planning considerations is essential. This inclusive approach provides planners and decision-makers with valuable insights into infrastructure planning and management.
Certainly, a more comprehensive exploration of the environmental impact of constructing an underground logistics network is crucial. The intricate interplay of geological conditions in diverse urban settings significantly influences the construction challenges associated with such networks. Integrating these considerations into the model and algorithm, possibly through the application of multi-objective optimization techniques, is worth exploring.
The feasibility of underground logistics networks is intricately connected to urban planning, land use, and seamless integration with existing infrastructure. Cities host complex underground pipeline networks, including water supply, sewage, natural gas, and more. Consequently, the implementation of underground logistics networks requires precise consideration and coordination of different pipelines to avoid conflicts and resource waste. Additionally, urban traffic flow and land use conditions impose specific requirements on the design and layout of underground logistics networks, ensuring efficient connectivity with other parts of the city.

Author Contributions

Conceptualization, Z.X. and X.C.; methodology, Z.X.; software, Y.F.; validation, Z.X., Y.F. and W.P.; formal analysis, W.P.; investigation, Y.F.; resources, X.C.; data curation, Z.X. and Y.F.; writing—original draft preparation, Y.F. and W.P.; writing—review and editing, Z.X. and X.C.; visualization, W.P.; supervision, Z.X.; project administration, X.C.; funding acquisition, X.C. All authors have read and agreed to the published version of the manuscript.

Funding

This work was supported by the National Natural Science Foundation of China (grant number 52090084) and Strategic Research and Consulting Project of Chinese Academy of Engineering (grant number 2022-JB-02).

Institutional Review Board Statement

Not applicable.

Informed Consent Statement

Not applicable.

Data Availability Statement

The data presented in this study are available on request from the corresponding author. The data are not publicly available due to privacy reason.

Conflicts of Interest

The authors declare no conflict of interest.

Abbreviations

ODOrigin–destination
GAGenetic algorithm
HRESHeuristic resilience evaluation scheme

References

  1. Holguín-Veras, J.; Amaya Leal, J.; Sánchez-Diaz, I.; Browne, M.; Wojtowicz, J. State of the Art and Practice of Urban Freight Management: Part I: Infrastructure, Vehicle-Related, and Traffic Operations. Transp. Res. Part. A Policy Pr. 2020, 137, 360–382. [Google Scholar] [CrossRef]
  2. Lan, S.; Tseng, M.L.; Yang, C.; Huisingh, D. Trends in Sustainable Logistics in Major Cities in China. Sci. Total Environ. 2020, 712, 136381. [Google Scholar] [CrossRef]
  3. Zhang, Y.; Zhu, J.; Liao, Z.; Guo, J.; Xie, H.; Peng, Q. An Intelligent Planning Model for the Development and Utilization of Urban Underground Space with an Application to the Luohu District in Shenzhen. Tunn. Undergr. Space Technol. 2021, 112, 103933. [Google Scholar] [CrossRef]
  4. Van Binsbergen, A.; Bovy, P. Underground Urban Goods Distribution Networks. Innov. Eur. J. Soc. Sci. Res. 2000, 13, 111–128. [Google Scholar] [CrossRef]
  5. Visser, J.G.S.N. The Development of Underground Freight Transport: An Overview. Tunn. Undergr. Space Technol. 2018, 80, 123–127. [Google Scholar] [CrossRef]
  6. Zhang, H.; Lv, Y.; Guo, J. New Development Direction of Underground Logistics from the Perspective of Public Transport: A Systematic Review Based on Scientometrics. Sustainability 2022, 14, 3179. [Google Scholar] [CrossRef]
  7. Yu, P.; Liu, H.; Wang, Z.; Fu, J.; Zhang, H.; Wang, J.; Yang, Q. Development of Urban Underground Space in Coastal Cities in China: A Review. Deep. Undergr. Sci. Eng. 2023, 2, 148–172. [Google Scholar] [CrossRef]
  8. Chen, Z.; Dong, J.; Ren, R. Urban Underground Logistics System in China: Opportunities or Challenges? Undergr. Space 2017, 2, 195–208. [Google Scholar] [CrossRef]
  9. CST (2020). Cargo Sous Terrain. Available online: https://www.cst.ch/en/committee/ (accessed on 20 September 2023).
  10. Hu, W.; Dong, J.; Hwang, B.G.; Ren, R.; Chen, Z. Network Planning of Urban Underground Logistics System with Hub-and-Spoke Layout: Two Phase Cluster-Based Approach. Eng. Constr. Archit. Manag. 2020, 27, 2079–2105. [Google Scholar] [CrossRef]
  11. Dong, J.; Hu, W.; Yan, S.; Ren, R.; Zhao, X. Network Planning Method for Capacitated Metro-Based Underground Logistics System. Adv. Civ. Eng. 2018, 2018, 6958086. [Google Scholar] [CrossRef]
  12. Wang, H.W.; Peng, Z.R.; Wang, D.; Meng, Y.; Wu, T.; Sun, W.; Lu, Q.C. Evaluation and Prediction of Transportation Resilience under Extreme Weather Events: A Diffusion Graph Convolutional Approach. Transp. Res. Part. C Emerg. Technol. 2020, 115, 102619. [Google Scholar] [CrossRef]
  13. Gao, Y.; Wang, J.W. A Resilience Assessment Framework for Urban Transportation Systems. Int. J. Prod. Res. 2021, 59, 2177–2192. [Google Scholar] [CrossRef]
  14. Miller-Hooks, E.; Zhang, X.; Faturechi, R. Measuring and Maximizing Resilience of Freight Transportation Networks. Comput. Oper. Res. 2012, 39, 1633–1643. [Google Scholar] [CrossRef]
  15. Govindan, K.; Fattahi, M.; Keyvanshokooh, E. Supply Chain Network Design under Uncertainty: A Comprehensive Review and Future Research Directions. Eur. J. Oper. Res. 2017, 263, 108–141. [Google Scholar] [CrossRef]
  16. Turkowski, M.; Szudarek, M. Pipeline System for Transporting Consumer Goods, Parcels and Mail in Capsules. Tunn. Undergr. Space Technol. 2019, 93, 103057. [Google Scholar] [CrossRef]
  17. Liang, H.; Yuan, G.; Han, J.; Sun, L. A Multi-Objective Location and Channel Model for ULS Network. Neural Comput. Appl. 2019, 31, 35–46. [Google Scholar] [CrossRef]
  18. Magway. 2019. British Company Plans Hyperloop-Inspired Network of Tunnels That Will Transport Millions of Parcels around London in Magnetic Carriages Travelling at 40 mph by 2022. Available online: https://www.dailymail.co.uk/sciencetech/article-7689241/British-company-plans-network-underground-tunnels-transport-millions-parcels.html (accessed on 23 September 2023).
  19. Ren, M.; Fan, Z.; Wu, J.; Zhou, L.; Du, Z. Design and Optimization of Underground Logistics Transportation Networks. IEEE Access 2019, 7, 83384–83395. [Google Scholar] [CrossRef]
  20. Zhao, L.; Zhou, J.; Li, H.; Yang, P.; Zhou, L. Optimizing the Design of an Intra-City Metro Logistics System Based on a Hub-and-Spoke Network Model. Tunn. Undergr. Space Technol. 2021, 116, 104086. [Google Scholar] [CrossRef]
  21. Hu, W.; Dong, J.; Yang, K.; Hwang, B.G.; Ren, R.; Chen, Z. Reliable Design of Urban Surface-Underground Integrated Logistics System Network with Stochastic Demand and Social-Environmental Concern. Comput. Ind. Eng. 2023, 181, 109331. [Google Scholar] [CrossRef]
  22. Liang, C.; Hu, X.; Shi, L.; Fu, H.; Xu, D. Joint Dispatch of Shipment Equipment Considering Underground Container Logistics. Comput. Ind. Eng. 2022, 165, 107874. [Google Scholar] [CrossRef]
  23. Fan, Y.; Liang, C.; Hu, X.; Li, Y. Planning Connections between Underground Logistics System and Container Ports. Comput. Ind. Eng. 2020, 139, 106199. [Google Scholar] [CrossRef]
  24. Gong, D.; Tian, J.; Hu, W.; Dong, J.; Chen, Y.; Ren, R.; Chen, Z. Sustainable Design and Operations Management of Metro-Based Underground Logistics Systems: A Thematic Literature Review. Buildings 2023, 13, 1888. [Google Scholar] [CrossRef]
  25. Ta, C.; Goodchild, A.V.; Pitera, K. Structuring a Definition of Resilience for the Freight Transportation System. Transp. Res. Rec. 2009, 2097, 19–25. [Google Scholar] [CrossRef]
  26. Chen, L.; Miller-Hooks, E. Resilience: An Indicator of Recovery Capability in Intermodal Freight Transport. Transp. Sci. 2012, 46, 109–123. [Google Scholar] [CrossRef]
  27. Gu, Y.; Fu, X.; Liu, Z.; Xu, X.; Chen, A. Performance of Transportation Network under Perturbations: Reliability, Vulnerability, and Resilience. Transp. Res. E Logist. Transp. Rev. 2020, 133, 101809. [Google Scholar] [CrossRef]
  28. Ganin, A.A.; Kitsak, M.; Marchese, D.; Keisler, J.M.; Seager, T.; Linkov, I. Resilience and Efficiency in Transportation Networks. Sci. Adv. 2017, 3, e1701079. [Google Scholar] [CrossRef]
  29. Alderson, D.L.; Brown, G.G.; Carlyle, W.M. Assessing and Improving Operational Resilience of Critical Infrastructures and Other Systems. In Bridging Data and Decisions; INFORMS: Orlando, FL, USA, 2014; pp. 180–215. [Google Scholar]
  30. Zhang, W.; Wang, N. Resilience-Based Risk Mitigation for Road Networks. Struct. Saf. 2016, 62, 57–65. [Google Scholar] [CrossRef]
  31. Balal, E.; Valdez, G.; Miramontes, J.; Cheu, R.L. Comparative Evaluation of Measures for Urban Highway Network Resilience Due to Traffic Incidents. Int. J. Transp. Sci. Technol. 2019, 8, 304–317. [Google Scholar] [CrossRef]
  32. Ganin, A.A.; Mersky, A.C.; Jin, A.S.; Kitsak, M.; Keisler, J.M.; Linkov, I. Resilience in Intelligent Transportation Systems (ITS). Transp. Res. Part. C Emerg. Technol. 2019, 100, 318–329. [Google Scholar] [CrossRef]
  33. Nogal, M.; O’Connor, A.; Caulfield, B.; Martinez-Pastor, B. Resilience of Traffic Networks: From Perturbation to Recovery via a Dynamic Restricted Equilibrium Model. Reliab. Eng. Syst. Saf. 2016, 156, 84–96. [Google Scholar] [CrossRef]
  34. Aydin, N.Y.; Duzgun, H.S.; Heinimann, H.R.; Wenzel, F.; Gnyawali, K.R. Framework for Improving the Resilience and Recovery of Transportation Networks under Geohazard Risks. Int. J. Disaster Risk Reduct. 2018, 31, 832–843. [Google Scholar] [CrossRef]
  35. Chen, M.; Lu, H. Analysis of Transportation Network Vulnerability and Resilience within an Urban Agglomeration: Case Study of the Greater Bay Area, China. Sustainability 2020, 12, 7410. [Google Scholar] [CrossRef]
  36. Ding, Y.; Zhang, M.; Chen, S.; Nie, R. Assessing the Resilience of China’s Natural Gas Importation under Network Disruptions. Energy 2020, 211, 118459. [Google Scholar] [CrossRef]
  37. Twumasi-Boakye, R.; Sobanjo, J. Civil Infrastructure Resilience: State-of-the-Art on Transportation Network Systems. Transp. A Transp. Sci. 2019, 15, 455–484. [Google Scholar] [CrossRef]
  38. Ransikarbum, K.; Mason, S.J. A Bi-Objective Optimisation of Post-Disaster Relief Distribution and Short-Term Network Restoration Using Hybrid NSGA-II Algorithm. Int. J. Prod. Res. 2022, 60, 5769–5793. [Google Scholar] [CrossRef]
Figure 1. Solution framework.
Applsci 13 12588 g001
Figure 2. GA flowchart.
Applsci 13 12588 g002
Figure 3. Position of underground network arcs on the chromosome diagram.
Applsci 13 12588 g003
Figure 4. GA crossover diagram.
Applsci 13 12588 g004
Figure 5. GA mutation diagram.
Applsci 13 12588 g005
Figure 6. HRES flowchart.
Applsci 13 12588 g006
Figure 7. Planned underground logistics network.
Applsci 13 12588 g007
Figure 8. Convergence of algorithm results.
Applsci 13 12588 g008
Figure 9. Budget sensitivity analysis.
Applsci 13 12588 g009
Figure 10. Arc capacity sensitivity analysis.
Applsci 13 12588 g010
Table 1. The key parameters of the computational experiment.
ParametersValues
Population size60
Maximum number of iterations400
Fixed construction costs for underground nodes2
Unit construction costs for underground pipelines1/km
Crossover rate0.95
Mutation rate0.05
Table 2. Comparison of HRES and CPLEX on small-sized instances.
Node   Number   ( N ) ApproachResilienceCPU Time (s)
5CPLEX1.00.148
HRES0.91630.001
8CPLEX0.96986.251
HRES0.91220.003
10CPLEX0.910831.542
HRES0.87080.011
12CPLEX0.999961.321
HRES0.88550.029
18CPLEX0.944268.406
HRES0.80140.068
24CPLEX0.9851203.474
HRES0.92090.112
Table 3. Comparison of original and planned network resilience in small-sized instances.
Node   Number   ( N ) Original Network ResiliencePlanned Network ResilienceRate of Increase
50.50830.891775.4%
80.62050.862539.0%
100.69150.865525.1%
120.77580.892715.0%
180.73720.78376.3%
240.65480.821025.4%
Disclaimer/Publisher’s Note: The statements, opinions and data contained in all publications are solely those of the individual author(s) and contributor(s) and not of MDPI and/or the editor(s). MDPI and/or the editor(s) disclaim responsibility for any injury to people or property resulting from any ideas, methods, instructions or products referred to in the content.

