Abstract
The vulnerability zoning of the urban ground subsidence in Tangshan City was investigated in this study, taking into account factors such as the geological lithology, rainfall, population density, road network density, seismic acceleration, and river network density. The main research of this paper is slow land subsidence affecting large territories. A single-factor analysis was conducted using ArcGIS, followed by a grid-weighted overlay analysis. Values were assigned to each factor to generate a vulnerability zoning map. The analytic hierarchy process (AHP) and information value evaluation model were then employed to assess the ground subsidence risk. An evaluation index system was established, comprising the evaluation objective layer, criterion layer, and indicator layer. An evaluation judgment matrix for the ground subsidence risk was constructed, with the calculation of the weight and information value of each risk evaluation indicator, and the total information value of the study area. Four risk levels were determined: high, moderate, relatively low, and low. The findings demonstrate the scientific validity, rationality, and practical applicability of the vulnerability zoning research and risk assessment method for addressing the ground subsidence in Tangshan City. This study contributes to the understanding and management of the ground subsidence risk, providing a robust framework for urban planning and disaster mitigation.
1. Introduction
Urban ground subsidence has garnered increasing attention in recent years due to its complex causality and severe consequences. It is influenced by factors such as the geological lithology, rainfall, population density, road network density, seismic acceleration, and river network density, and the interplay of these elements can readily trigger it. Given the multitude of influencing factors and intricate causal mechanisms, research on the vulnerability zoning of urban ground subsidence is of paramount importance. Moreover, the sudden onset, strong concealment, severe consequences, and difficulty in prevention and control that characterize urban ground subsidence necessitate urgent assessments of the ground subsidence risk in urban areas.
To carry out assessments of the ground subsidence risk, scholars both domestically and internationally have conducted extensive research [1,2,3,4,5,6,7,8,9,10,11,12,13,14,15,16,17,18,19,20,21,22,23,24,25,26,27,28,29,30,31,32,33,34,35] to promote theoretical and engineering advancements. The research on this issue can be mainly categorized into two types: vulnerability zoning research based on the monitoring method and risk assessment method research.
Previously, due to the underdeveloped hardware at the time, ArcGIS technology mainly played a visualization role. Mario Mejla and others from the United States integrated ArcGIS with mathematical models and established a complete geological hazard assessment method, which was successfully applied in practical cases [1]. In the late 1980s, China began applying ArcGIS technology to geological research. In recent years, with the gradual improvement in ArcGIS technology, its depth and breadth of application have made significant progress [2,3,4,5,6]. Wei Fenghua studied the formation mechanism of karst collapse in Tangshan [7]. Liu Fangfang et al. mainly discuss the characteristics, causes, hazards, and prevention methods of road collapse in Tangshan [8].
Huang Runqiu et al. applied ArcGIS to the study of the New Tan–Badong section of the Three Gorges Project and obtained a zonation map of its hazard level [9]. Xu Chong et al. obtained vulnerability zoning using the analytic hierarchy process (AHP) and ArcGIS technology [10,11]. Hossein Rahnema et al. performed a case study for the Marvdasht plain and rural regions of Fars province, Iran [12]. Wang Heping assessed the ground subsidence risk and vulnerability in Tangshan using ArcGIS and obtained a zoning of the subsidence risk in mining areas [13]. Shi M et al. employed multi-track synthetic aperture radar (SAR) datasets acquired by the Sentinel-1A (S1A) satellite to detect spatial and temporal distributions of the surface deformation in the NCP from 2016 to 2018 based on multi-temporal interferometric synthetic aperture radar (MT-InSAR) [14]. Ezquerro P et al. characterized the ground subsidence affecting the urban fabric of the city of Pistoia (the Tuscany region, central Italy) based on the wide-area-mapping capability of Sentinel-1 used in synergy with COSMO-SkyMed high-resolution SAR data [15]. Muhammad Afaq Hussain et al. used persistent scatterer interferometry synthetic aperture radar (PS-InSAR) technology with Sentinel-1 SAR images to monitor the ground subsidence in Karachi, Pakistan [16].
Lei Mingtang et al. used ArcGIS technology to establish a prediction and evaluation system and method for karst collapse [17]. Hu BB et al. proposed a land subsidence risk assessment index based on the Disaster Risk Index [18]. Zhang Haibo et al. used a road collapse evaluation system to assess the roads in Tangshan City [19]. LP Sharma et al. attempted to assess the vulnerability status in parts of East Sikkim, India, by integrating the influence of the various soil attributes [20]. Jin Yanzhu et al. studied the vulnerability of karst collapse hazards based on ArcGIS and the analytic hierarchy process [21]. Mao Wei et al. conducted a risk assessment of the study area based on the analytic hierarchy process [22]. Li FW et al. determined each of the unit risk grades via the method of fuzzy synthetic evaluation on the basis of the index attributes and corresponding weights, and the results were distributed in space using ArcGIS to obtain the groundwater risk-grade map of various aquifers in different groundwater function zones of Tianjin City [23]. Li FW et al. divided the risk grade according to the standards of sixteen grades based on those of five initial grades [24]. Zhou Quanchao analyzed the indicators for the assessment of the karst collapse risk and established a risk assessment model for karst collapse [25]. Richa Bhattarai et al. used the Disaster Risk Index method and analytic hierarchy process (AHP) along with Geographic Information System (GIS) tools to assess the risk of land subsidence in Kathmandu Valley, Nepal [26]. Tu Jing et al. assessed the vulnerability of karst collapse in Wuhan using the comprehensive index method and the analytic hierarchy process [27]. Bu Mengmeng assessed the risk in coal-mining areas based on the analytic hierarchy process–information value method and ArcGIS technology [28]. Dong Peng et al. used GRA-FAHP to select 14 influencing factors as major subsidence indicators and qualitatively and quantitatively evaluated the risk of karst collapse [29]. Xu Xiaoying et al. investigated road cavity collapse accidents nationwide and developed a risk assessment method for urban road cavity hazards [30]. Wu Yuanbin et al. conducted a vulnerability assessment for karst collapse using the analytic hierarchy process in the Huaihua region and obtained a hazard zoning map of the area [31]. Zhou Ziyong et al. identified risk factors and developed a risk assessment framework for urban road collapse and established a road collapse risk assessment model [32]. Shagun Garg et al. used the InSAR technique and analyzed Sentinel-1 data acquired from 2014 to 2020, identified some localized subsidence zones in the region, and performed a risk assessment by considering the hazards and using the vulnerability approach [33]. Zhang Q et al. employed a GIS-based DRASTIC model to assess the groundwater vulnerability in Tangshan City, a coastal area in China, and obtained the early warning standard of the groundwater decline rate [34]. Hamed Sadeghi et al. employed a combined methodology of full-consistency decision making (FUCOM) and the geographical information system (GIS) to assess the vulnerability of Iran to subsidence and obtained the land subsidence risk zoning map of the study area [35].
Existing studies have predominantly focused on either vulnerability zoning or risk assessment methods in isolation, with a limited number of studies integrating both aspects. Furthermore, while influencing factors, characteristics, causal mechanisms, and engineering prevention measures have been extensively discussed in these studies, theoretical research has been relatively limited.
To address this gap, we aimed to carry out vulnerability zoning research based on ArcGIS and the risk assessment method based on the AHP–IV model. In this study, an initial single-factor analysis was conducted, based on ArcGIS, followed by a weighted overlay analysis using the raster calculator. Values were assigned and classified for each factor to generate a vulnerability zoning map of the ground subsidence in Tangshan City, thereby defining the study area. Moreover, the analytic hierarchy process–information value (AHP–IV) model was employed as a theoretical basis in this study. This model was utilized to evaluate the ground subsidence risk; to establish an evaluation index system; to construct an evaluation judgment matrix; and to calculate the weight of each risk assessment indicator, the information value of each individual indicator, and the total information value of the study area. The study area was classified into four risk levels: high risk, moderate risk, relatively low risk, and low risk. This method offers valuable guidance for similar engineering cases.
2. Materials and Methods
2.1. ArcGIS-Based Vulnerability Zoning of Ground Subsidence in Tangshan City
The primary determinants of the ground subsidence in Tangshan City encompass factors such as the lithology, rainfall, population density, road network density, seismic acceleration, and river network density. Spatial analysis, conducted via ArcGIS, was employed for each of these influencing factors to derive their respective classifications. The consolidated classification results of these factors facilitated the generation of a vulnerability zoning map for the ground subsidence in Tangshan City.
The delineation of the vulnerability zones within Tangshan City and the subsequent research on the evaluation of the ground subsidence hazard hinged on the acquisition of pertinent data, which formed the bedrock of this study. A variety of data collection methods, as outlined in Table 1, were utilized to ensure a comprehensive and robust analysis.

Table 1.
Data source introduction.
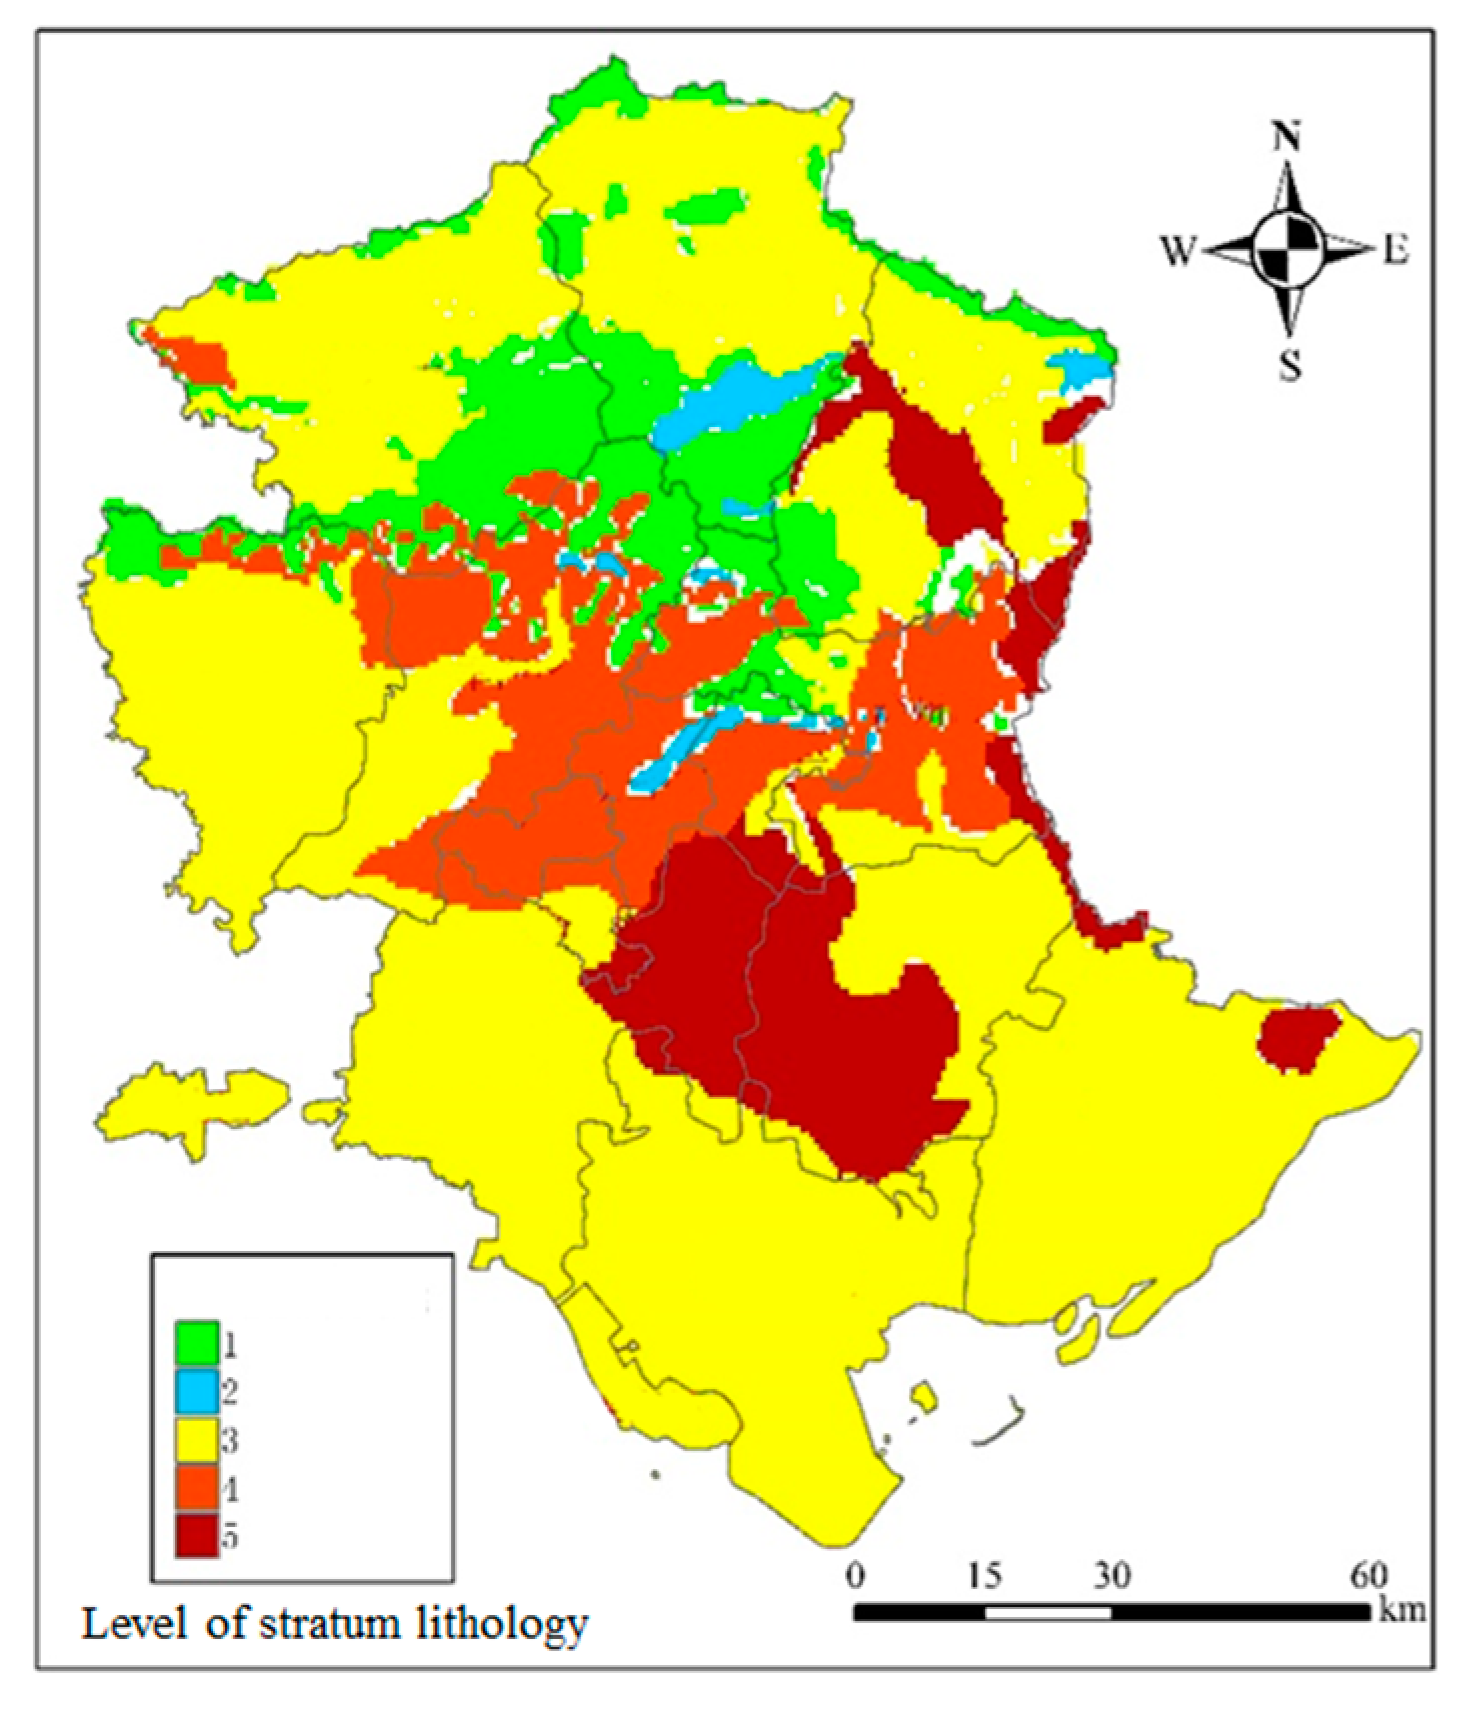
The geological lithology and rainfall patterns within Tangshan City were segmented into five distinct categories. The specific values attributed to each category for both the lithology and rainfall are detailed in Table 2. The classification maps, which visually represent the distribution of the geological lithology and July rainfall across the city, are depicted in Figure 1 and Figure 2, respectively.
Table 2.
Lithology and rainfall values of Tangshan City.

Figure 1.
Lithologic classification.
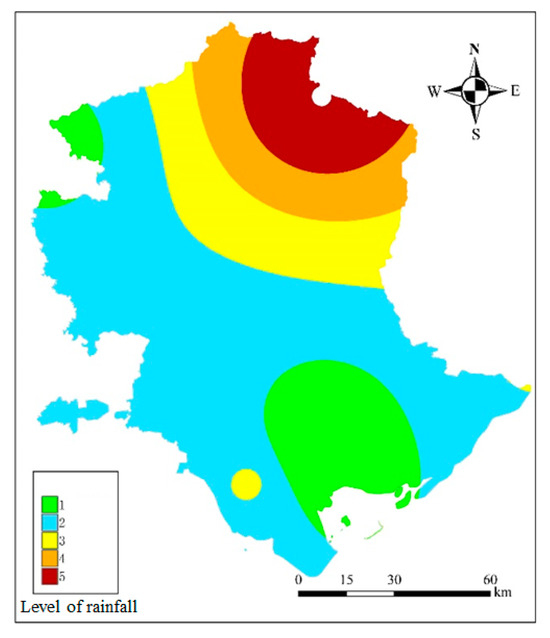
Figure 2.
Rainfall classification.
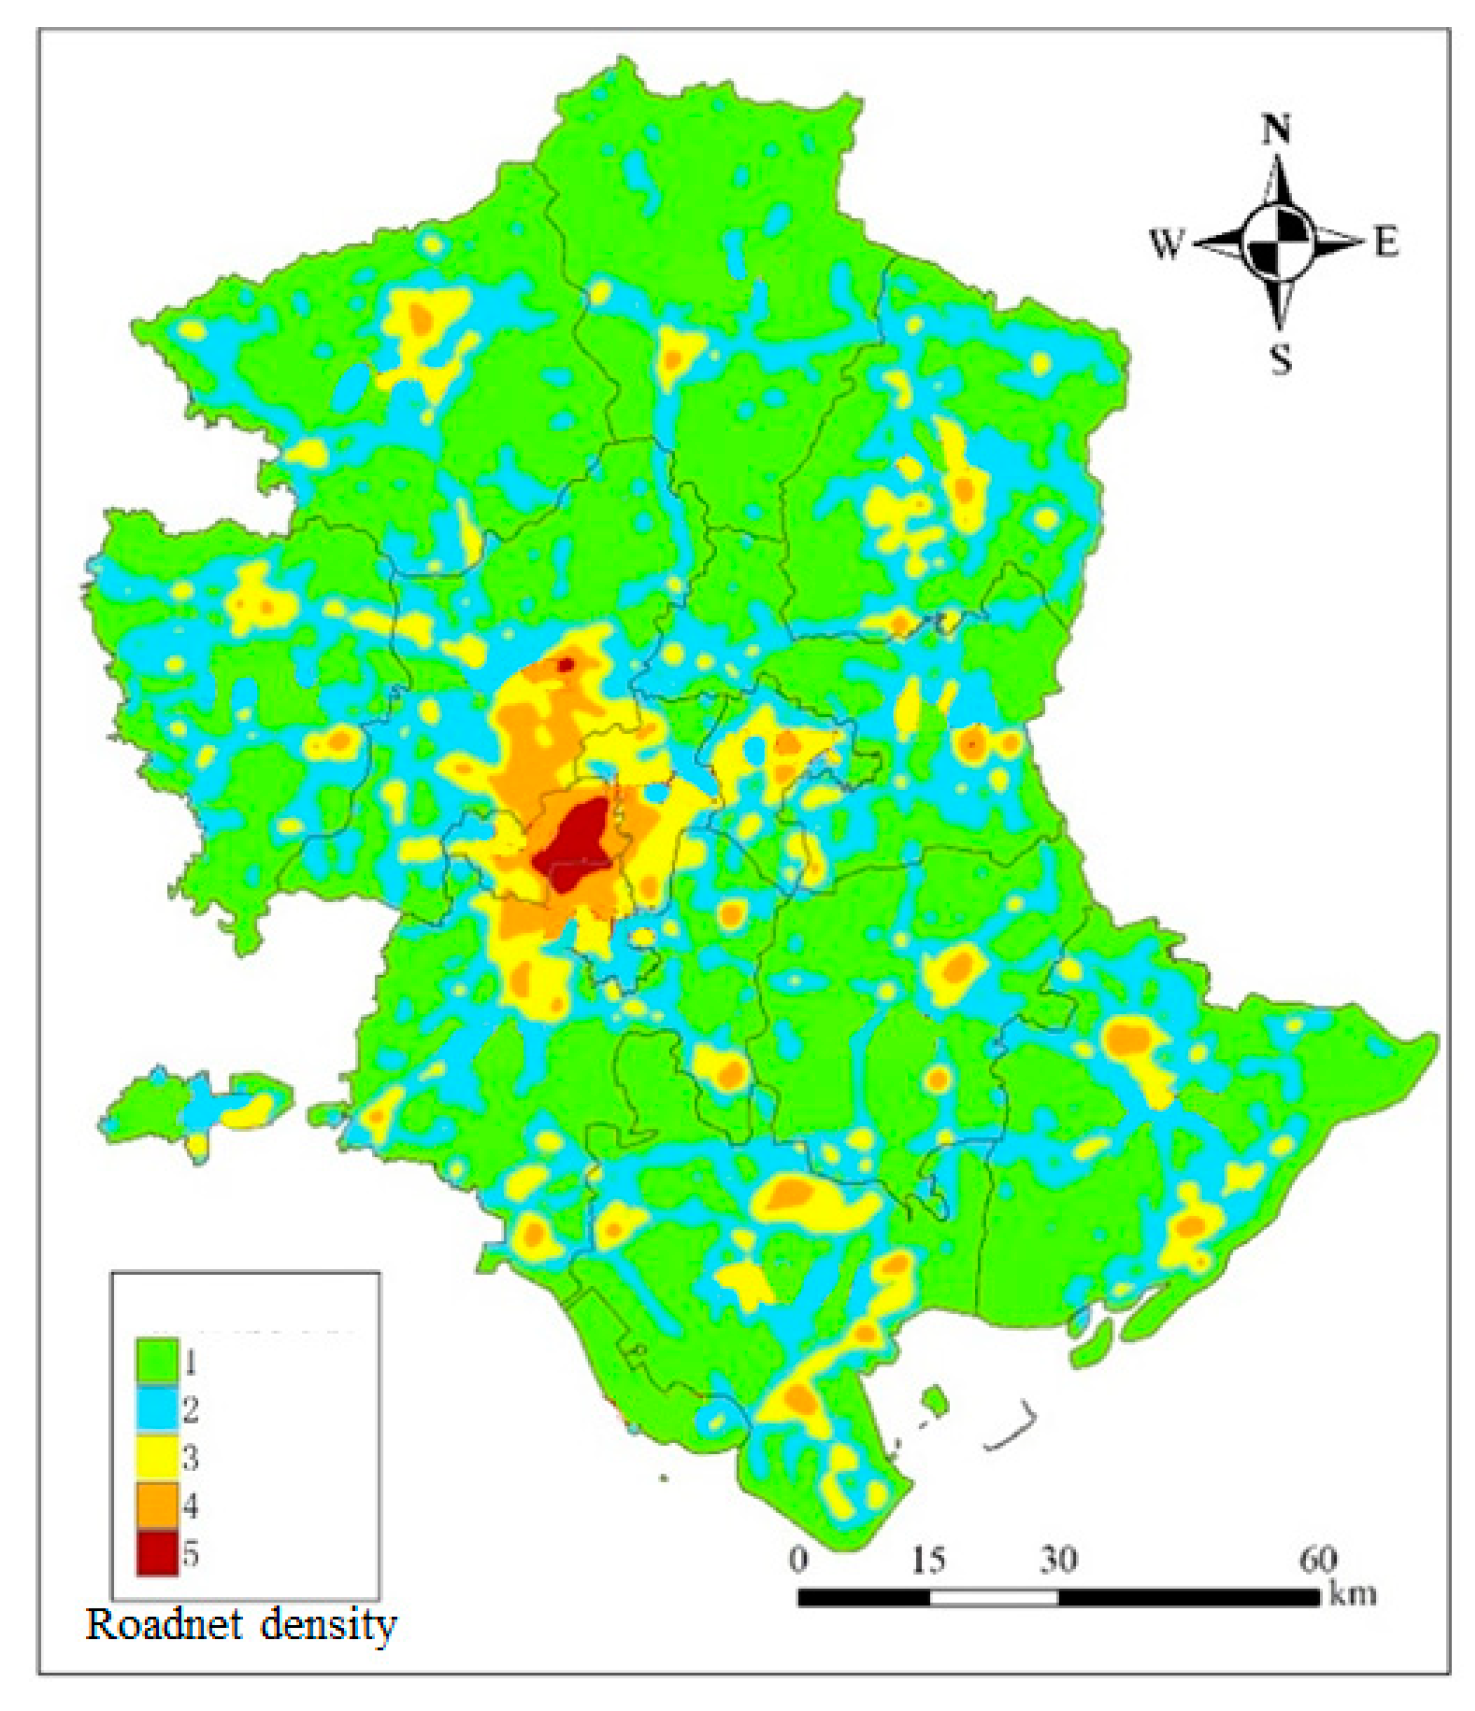
The population density and road network density within Tangshan City were categorized into five distinct levels. The specific values assigned to each level for both the population density and road network density are detailed in Table 3. The classification maps, which visually represent the population density distribution and road network density across the city, are depicted in Figure 3 and Figure 4, respectively.
Table 3.
Assigned values of population density and road network density in Tangshan City.
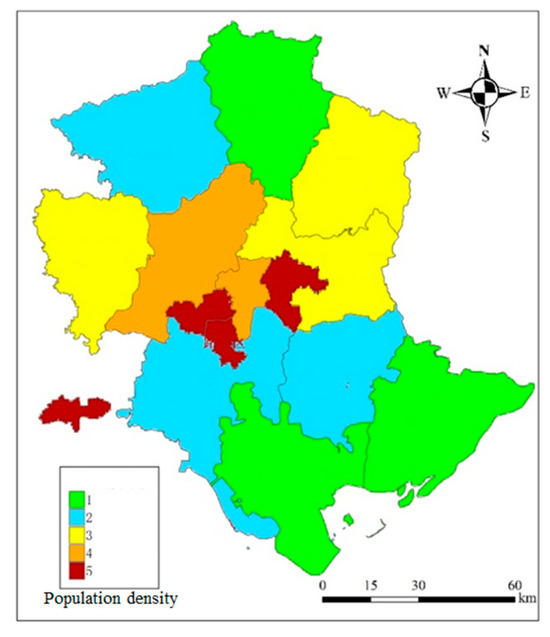
Figure 3.
Classification of population density.

Figure 4.
Classification of road network density.
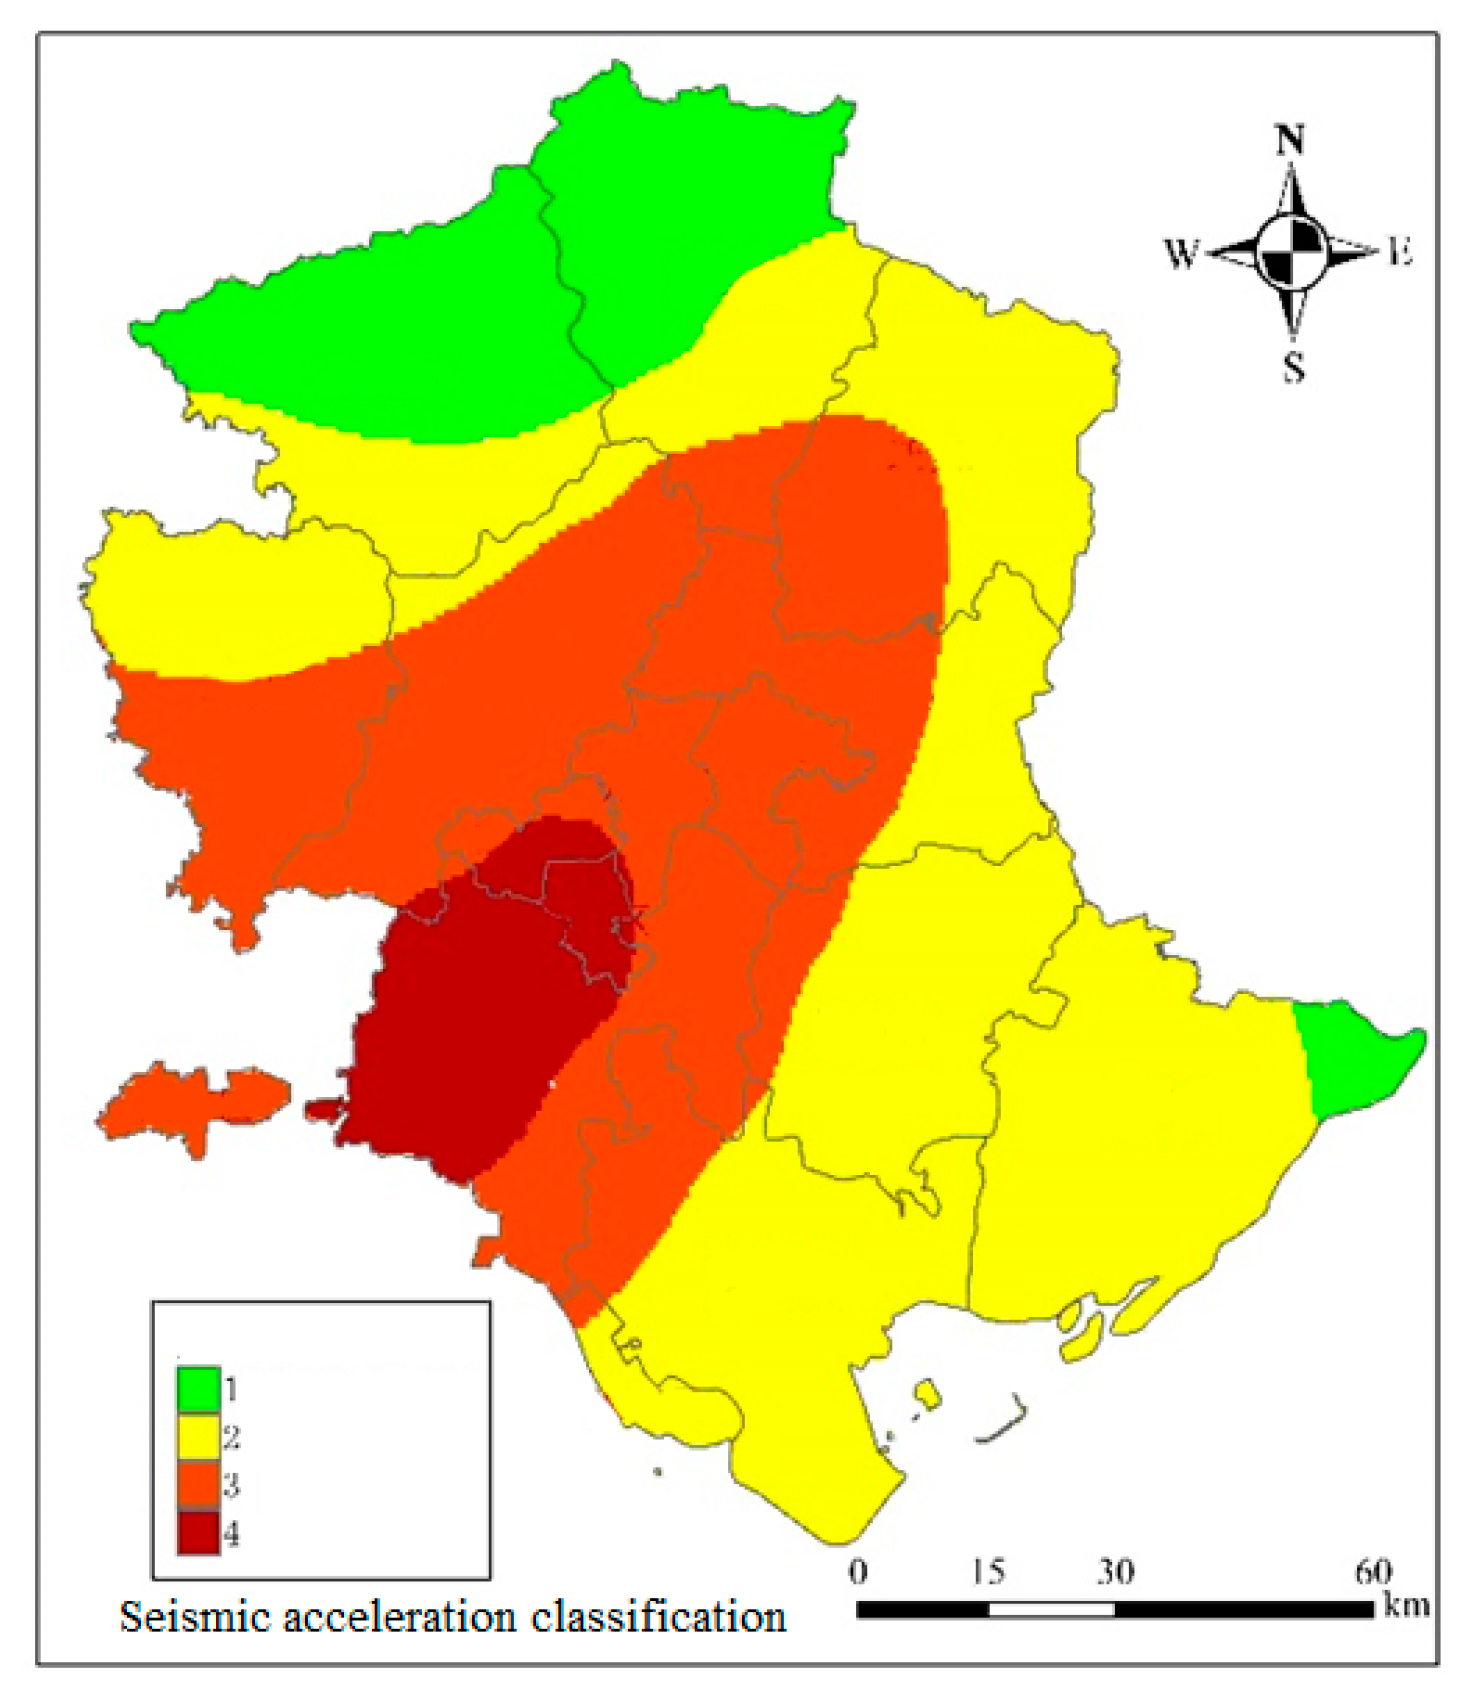
The seismic acceleration was segmented into four levels based on the peak ground acceleration, while the river network density was divided into five levels. The specific values attributed to each level for the seismic acceleration and river network density are provided in Table 4. The classification maps for the seismic acceleration and river network density are illustrated in Figure 5 and Figure 6, respectively.
Table 4.
Earthquake acceleration and river network density values of Tangshan City.

Figure 5.
Classification of seismic acceleration.
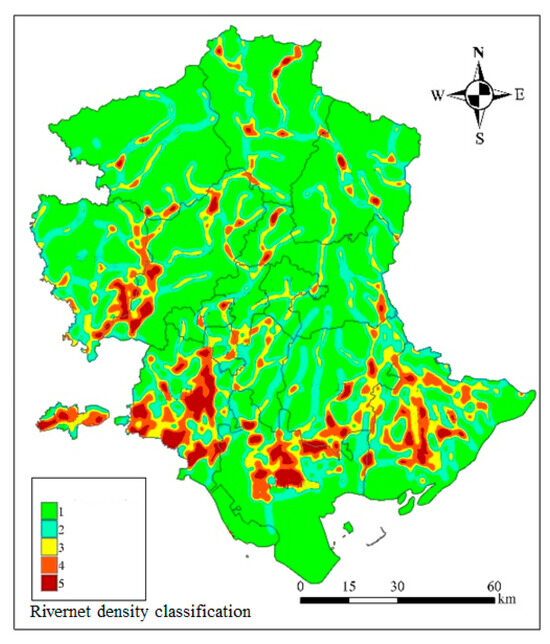
Figure 6.
Classification of river network density.
Utilizing the raster calculator tool in ArcGIS, the six datasets were subjected to a simple raster-weighted overlay analysis. This process generated the vulnerability zoning map of the ground subsidence for Tangshan City, as depicted in Figure 7 and Figure 8.
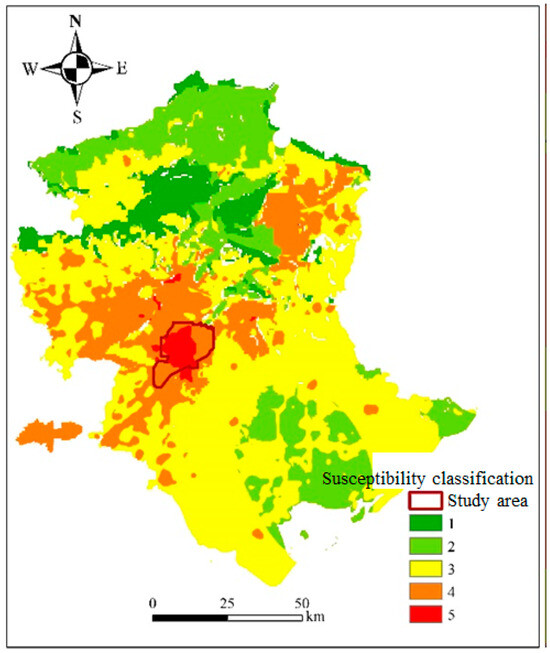
Figure 7.
Classification of collapse susceptibility.

Figure 8.
Study area selection.
Figure 7 indicates that the areas of high vulnerability to ground subsidence are primarily concentrated in the Lunan, Lubei, and Fengnan districts of Tangshan City. The western region of the study area exhibits a higher road density, while the southern region is characterized by a dense river network, including the Nanhu Park area, a former mining area with extensive goaf regions.
A comparison of the vulnerability zoning map with the distribution map of the karst subsidence and goaf areas in the main urban area of Tangshan City reveals consistency in the results of the karst subsidence, goaf subsidence, and vulnerability zoning. Moreover, the majority of the ground subsidence disaster points are concentrated within the study area, further validating the rationality of the vulnerability zoning and selection of the study area. Consequently, a portion of the main urban area of Tangshan City was selected as the research area for the evaluation of the ground subsidence hazard and ground settlement monitoring, as illustrated in Figure 7.
2.2. Ground Subsidence Hazard Assessment Methods
The analytic hierarchy process (AHP) is a decision-making tool that is particularly effective for problems that are challenging to analyze quantitatively. The information value method (IVM) is well suited for quantitative analysis, but it sometimes lacks subjective judgment. This study employed a comprehensive evaluation approach that amalgamates both qualitative and quantitative methods, leveraging the strengths of each to enhance the persuasiveness of the evaluation results for the urban ground subsidence hazard.
2.2.1. Analytic Hierarchy Process (AHP)
In this paper, the research is focused on slow land subsidence affecting large territories. We summarized the main influencing factors including natural factors, engineering factors, and inducement factors.
The AHP is a method used to tackle complex problems and is extensively applied in the field of engineering disaster prevention. The method comprises the following four steps:
(1) Establishing a hierarchy structure model.
The hierarchical structure consists of three levels: the goal level, the criterion level, and the indicator level. The goal level represents the evaluation method for the urban ground subsidence hazard. The criterion level, also known as the intermediate level, is divided into three categories: natural factors, engineering factors, and triggering factors. The indicator level encompasses a total of 12 evaluation indicators.
(2) Establishing judgment matrices.
The scales of the judgment matrices in the AHPare depicted in Table 5.
Table 5.
Definitions of the scales of the judgment matrices.
For n elements, we can obtain the corresponding judgment matrices for pairwise comparisons:
where .
(3) Calculating the judgment matrices.
Based on the δ values obtained in (1), the characteristic vectors of the established judgment matrices in the ground subsidence hazard assessment system are solved to calculate the weight values of the evaluation indicators:
(1) Normalize the column elements of the matrix:
(2) Sum the normalized matrix elements:
(3) Calculate the normalized characteristic vector () to determine the weight values of each evaluation indicator:
(4) Perform a consistency check.
The obtained characteristic vector needs to undergo a consistency check to verify the consistency of the process of assigning weights to the indicators. The calculation formula is as follows:
In the context of the analytic hierarchy process (AHP), the Consistency Index (CI) and the Random Consistency Index (RI) are crucial parameters. The CI is used to measure how consistent the judgments are in the comparison matrix, while the RI is an average index that represents the extent of consistency that would be expected from a randomly generated matrix. The values for the RI are provided in Table 6. The Consistency Ratio (CR) is then calculated as the ratio of the CI to the RI. A CR less than 0.1 signifies that the judgment matrix satisfies the consistency requirements, indicating a reasonable level of judgment consistency. A CR greater than 0.1 suggests a significant inconsistency in the judgments, necessitating an adjustment of the judgment matrix to improve its consistency.
Table 6.
RI values.
2.2.2. Information Value Method
Urban ground subsidence is a multifactorial phenomenon, with the contributing factors exerting varying degrees of influence. To accurately assess the risk of ground subsidence, it is essential to calculate the information value of each factor, thereby determining their individual contributions to the occurrence of ground subsidence disasters. The formula for calculating the information value of a single factor is as follows:
where Y is the ground subsidence disaster; ui is the i-th evaluation factor among the influencing factors; n is the number of influencing factors; and P is the probability of the occurrence of the disaster.
The probability of a ground subsidence disaster occurring is determined by the number of ground subsidence events or the area of ground subsidence disasters within the study area:
where is the information value provided by the indicator () for ground subsidence disasters; is the number of grid cells with ground subsidence disasters within the range of the indicator (); is the total number of grid cells with ground subsidence disasters in the study area; is the number of grid cells with the indicator (); and is the total number of grid cells in the study area.
By calculating the information value of each factor, we can assess its relative importance in contributing to ground subsidence disasters.
2.2.3. Analytic Hierarchy Process–Information Value Evaluation Model
The analytic hierarchy process (AHP) was employed to compute the weights of each hazard assessment factor, reflecting their relative importance. Concurrently, the information value method was utilized to ascertain the information contribution of each factor to the manifestation of ground subsidence. By integrating these two methodologies, the total information value was derived, which served as the basis for the hazard assessment:
where
Itotal is the total information value of the evaluation unit;
N is the number of evaluation factors in the unit;
Wᵢ is the weight of the i-th evaluation factor;
Iᵢ is the information value of the i-th evaluation factor.
The hazard assessment of ground subsidence was achieved by integrating the weights of the evaluation factors and the information value of each factor. Specifically, the analytic hierarchy process (AHP) was employed to calculate the weights of the evaluation factors, reflecting their relative significance. Concurrently, the information value method was utilized to ascertain the contribution of each factor to the overall hazard. The total information value derived from these calculations served as the foundation for the hazard assessment. This comprehensive approach ensures a nuanced and accurate evaluation of the ground subsidence risk, accounting for the multifactorial nature of the phenomenon and the differential impacts of the contributing factors.
3. Hazard Assessment Results for the Study Area
3.1. Construction of Hazard Assessment Index System for Ground Subsidence
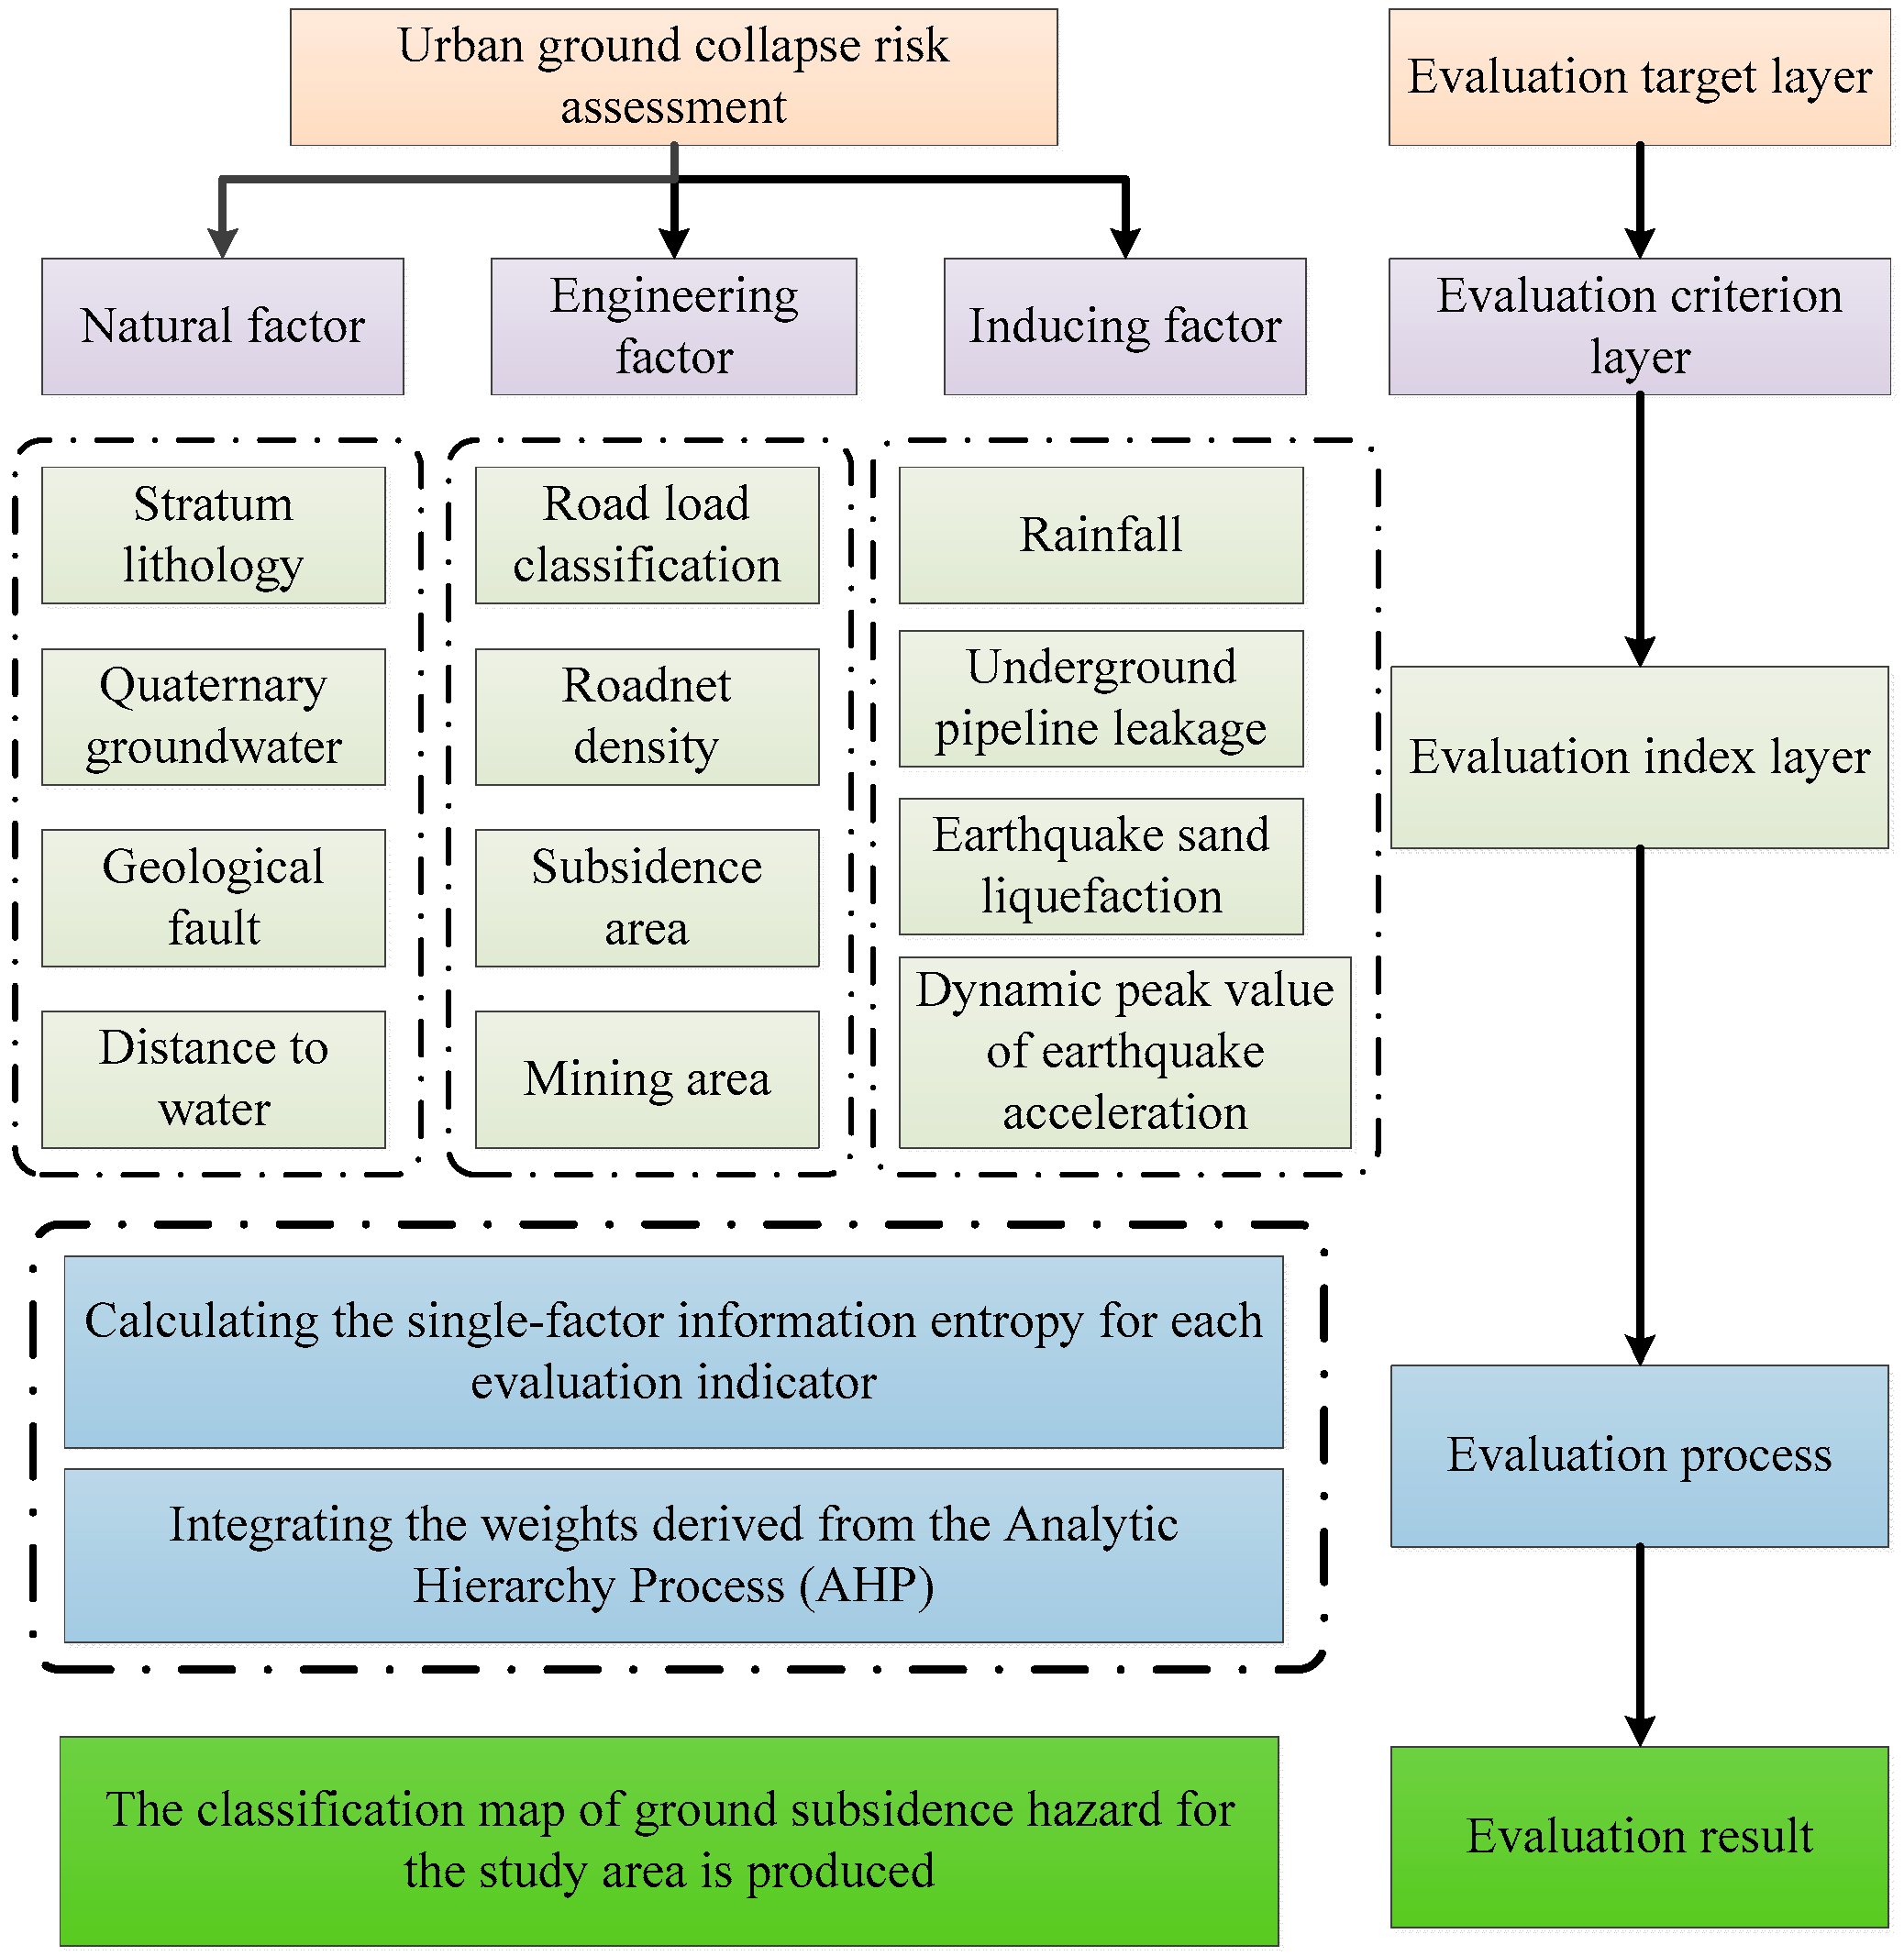
The hazard assessment model for ground subsidence in this study integrates the analytic hierarchy process (AHP) and the information value model. This model takes into account a variety of natural, engineering, and triggering factors that contribute to ground subsidence in the study area. A total of 12 evaluation indicators have been identified and incorporated into the Urban Ground Subsidence Hazard Assessment Index System, as depicted in Figure 9.
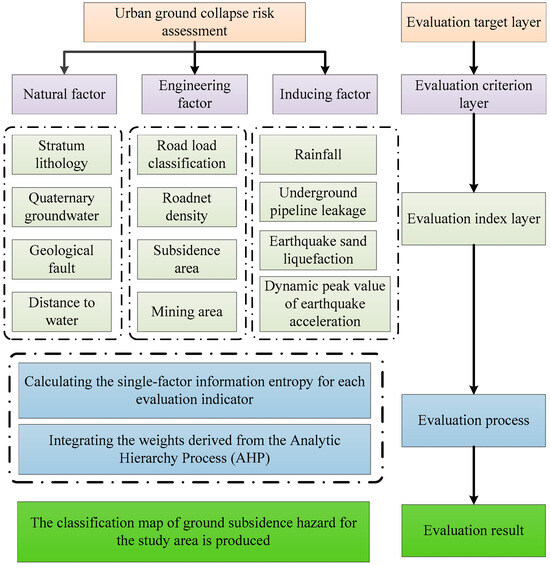
Figure 9.
Evaluation index system of urban ground collapse risk.
The hazard assessment is structured across three levels: the evaluation objective level, the evaluation criterion level, and the evaluation indicator level. The evaluation objective level is centered on the assessment of the urban ground subsidence hazard. The evaluation criterion level is divided into three categories: natural factors, engineering factors, and triggering factors. The natural factors comprise four evaluation indicators: the lithology, quaternary groundwater, geological faults, and proximity to water systems. The engineering factors include four evaluation indicators: the road load, distribution of subsidence areas, distribution of mined-out areas, and road network density. The triggering factors incorporate four evaluation indicators: the rainfall impact, underground pipeline leakage, earthquake-induced liquefaction, and seismic acceleration.
The construction of this comprehensive evaluation index system for the ground subsidence hazard enables the calculation of the single-factor information entropy for each evaluation indicator. By integrating the weights derived from the analytic hierarchy process (AHP), a classification map of the ground subsidence hazard for the study area was produced. This approach provides a holistic and nuanced assessment of the ground subsidence hazard, reflecting the multifaceted nature of the phenomenon.
3.1.1. Natural Factors
The natural factors significantly contributing to the ground subsidence hazard encompass the lithology, quaternary groundwater, geological faults, and proximity-to-water systems within the study area.
(1) Lithology
Drawing upon engineering geotechnical investigation reports, the study area was segmented into seven engineering geological strata, namely, miscellaneous fill, silty clay, loess, loam, sandy soil, gravely soil, and carbonate rock. These strata were integrated with the 1:200,000 geological map of Tangshan City, resulting in a four-class categorization of the lithology, as detailed in Table 7. The specific classification is visually represented in Figure 10.
Table 7.
Stratigraphic lithology classification values in the study area.
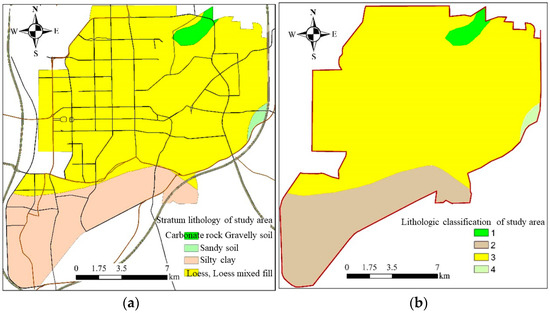
Figure 10.
Lithology of the study area. (a) Lithology distribution. (b) Lithology classification.
(2) Quaternary Groundwater
A statistical analysis of the correlation between the thickness of the quaternary cover layer and the frequency of collapses reveals a significant influence of the former on the latter. Collapses are predominantly observed in areas where the thicknesses range from 15 to 30 m, while areas with thicknesses exceeding 30 m witness fewer collapses. This can be attributed to the fact that, in areas where the thicknesses surpass 30 m, the soil voids that form are sufficiently supported by the thickness of the overlying soil, thereby enhancing the resistance to subsidence. Conversely, in areas where the thicknesses are less than 15 m, the pore water is typically drained, reducing the likelihood of subsurface erosion. The groundwater levels in the study area were classified into three categories based on thickness: less than 15 m, 15–30 m, and exceeding 30 m. Table 8 presents the groundwater monitoring data for the study area. Utilizing well-logging data, the inverse-distance weighting method was employed to classify the groundwater in the study area, as depicted in Figure 11.
Table 8.
Monitoring data of groundwater levels in study area.
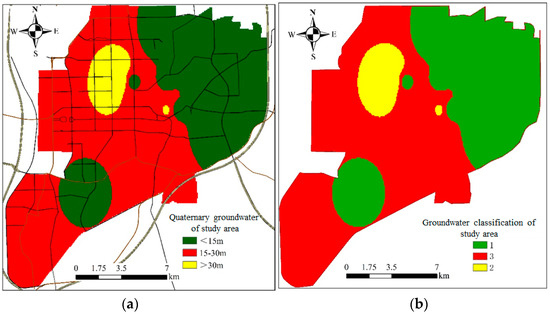
Figure 11.
Groundwater of the study area. (a) Groundwater distribution. (b) Groundwater classification.
The propensity for ground subsidence increases with a decline in the groundwater level. Human activities, such as groundwater extraction, can precipitate a rapid decrease in the water table, thereby exacerbating the risk of subsidence incidents.
The groundwater level monitoring data for the study area, represented by latitude and longitude coordinates, were imported into ArcGIS. The inverse-distance weighting method was then applied to conduct an interpolation analysis of the quaternary groundwater levels. The resulting distribution map of the quaternary groundwater levels in the study area is illustrated in Figure 11, with corresponding categorization. Areas with thicknesses less than 15 m were assigned a value of 1, those with thicknesses of 15–30 m were assigned a value of 3, and those with thicknesses exceeding 30 m were assigned a value of 2.
(3) Geological Faults
Geological faults include the following. (i) The Douhe Fault (F1), depicted in Figure 12, which is a predominantly NE-dipping normal fault: Notably, during the 1976 Tangshan earthquake, this topographic scarp was the site of sand ejection and water eruption phenomena. However, surface investigations yielded no direct evidence of faulting. (ii) The Weishan–Changshan–Fengnan Fault (F2), which is bifurcated into two segments due to the presence of the Dachengshan and Fenghuangshan mountains within the urban area, the Weishan–Changshan South Slope Fault (F2-1) and the Tangshan–Fengnan Fault (F2-2): The F2-1 fault is characterized by angular gravel fill, and the fault surface exhibits clear evidence of friction and drag folds, indicative of its normal fault nature. The Tangshan–Fengnan Fault (F2-2) forms a complex anticline and syncline trending northeast in the Tangshan–Fengnan region, composed of Ordovician limestone. (iii) The Tangshan Earthquake Fault Zone (F3), which is the seismogenic fault of the 1976 Tangshan earthquake: Its southwestern segment exhibits a NE trend of approximately 30°. Upon passing through Tangshan Xiao Shan, it bifurcates northward into two branches, the Tangshan–Guye Fault Segment (F3-1), with an NE trend of approximately 50°, and the Tangshan–Majiagou Mine Segment (F3-2), with an NE trend of approximately 20–30°. The total length of the fault zone is about 30 km. The Tangshan–Majiagou Mine Fault (F3-3), located northeast of Tangshan City and west of Kaiping, generally trends towards the northeast and is characterized by the inversion of Paleozoic marine sedimentary rocks, akin to the inverted syncline of the Tangshan Mine in the southern Nanhu area, as shown in Figure 12.
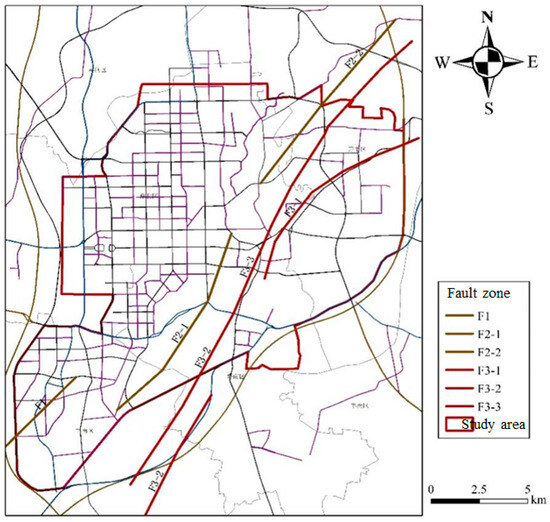
Figure 12.
Fault zone distribution in study area.
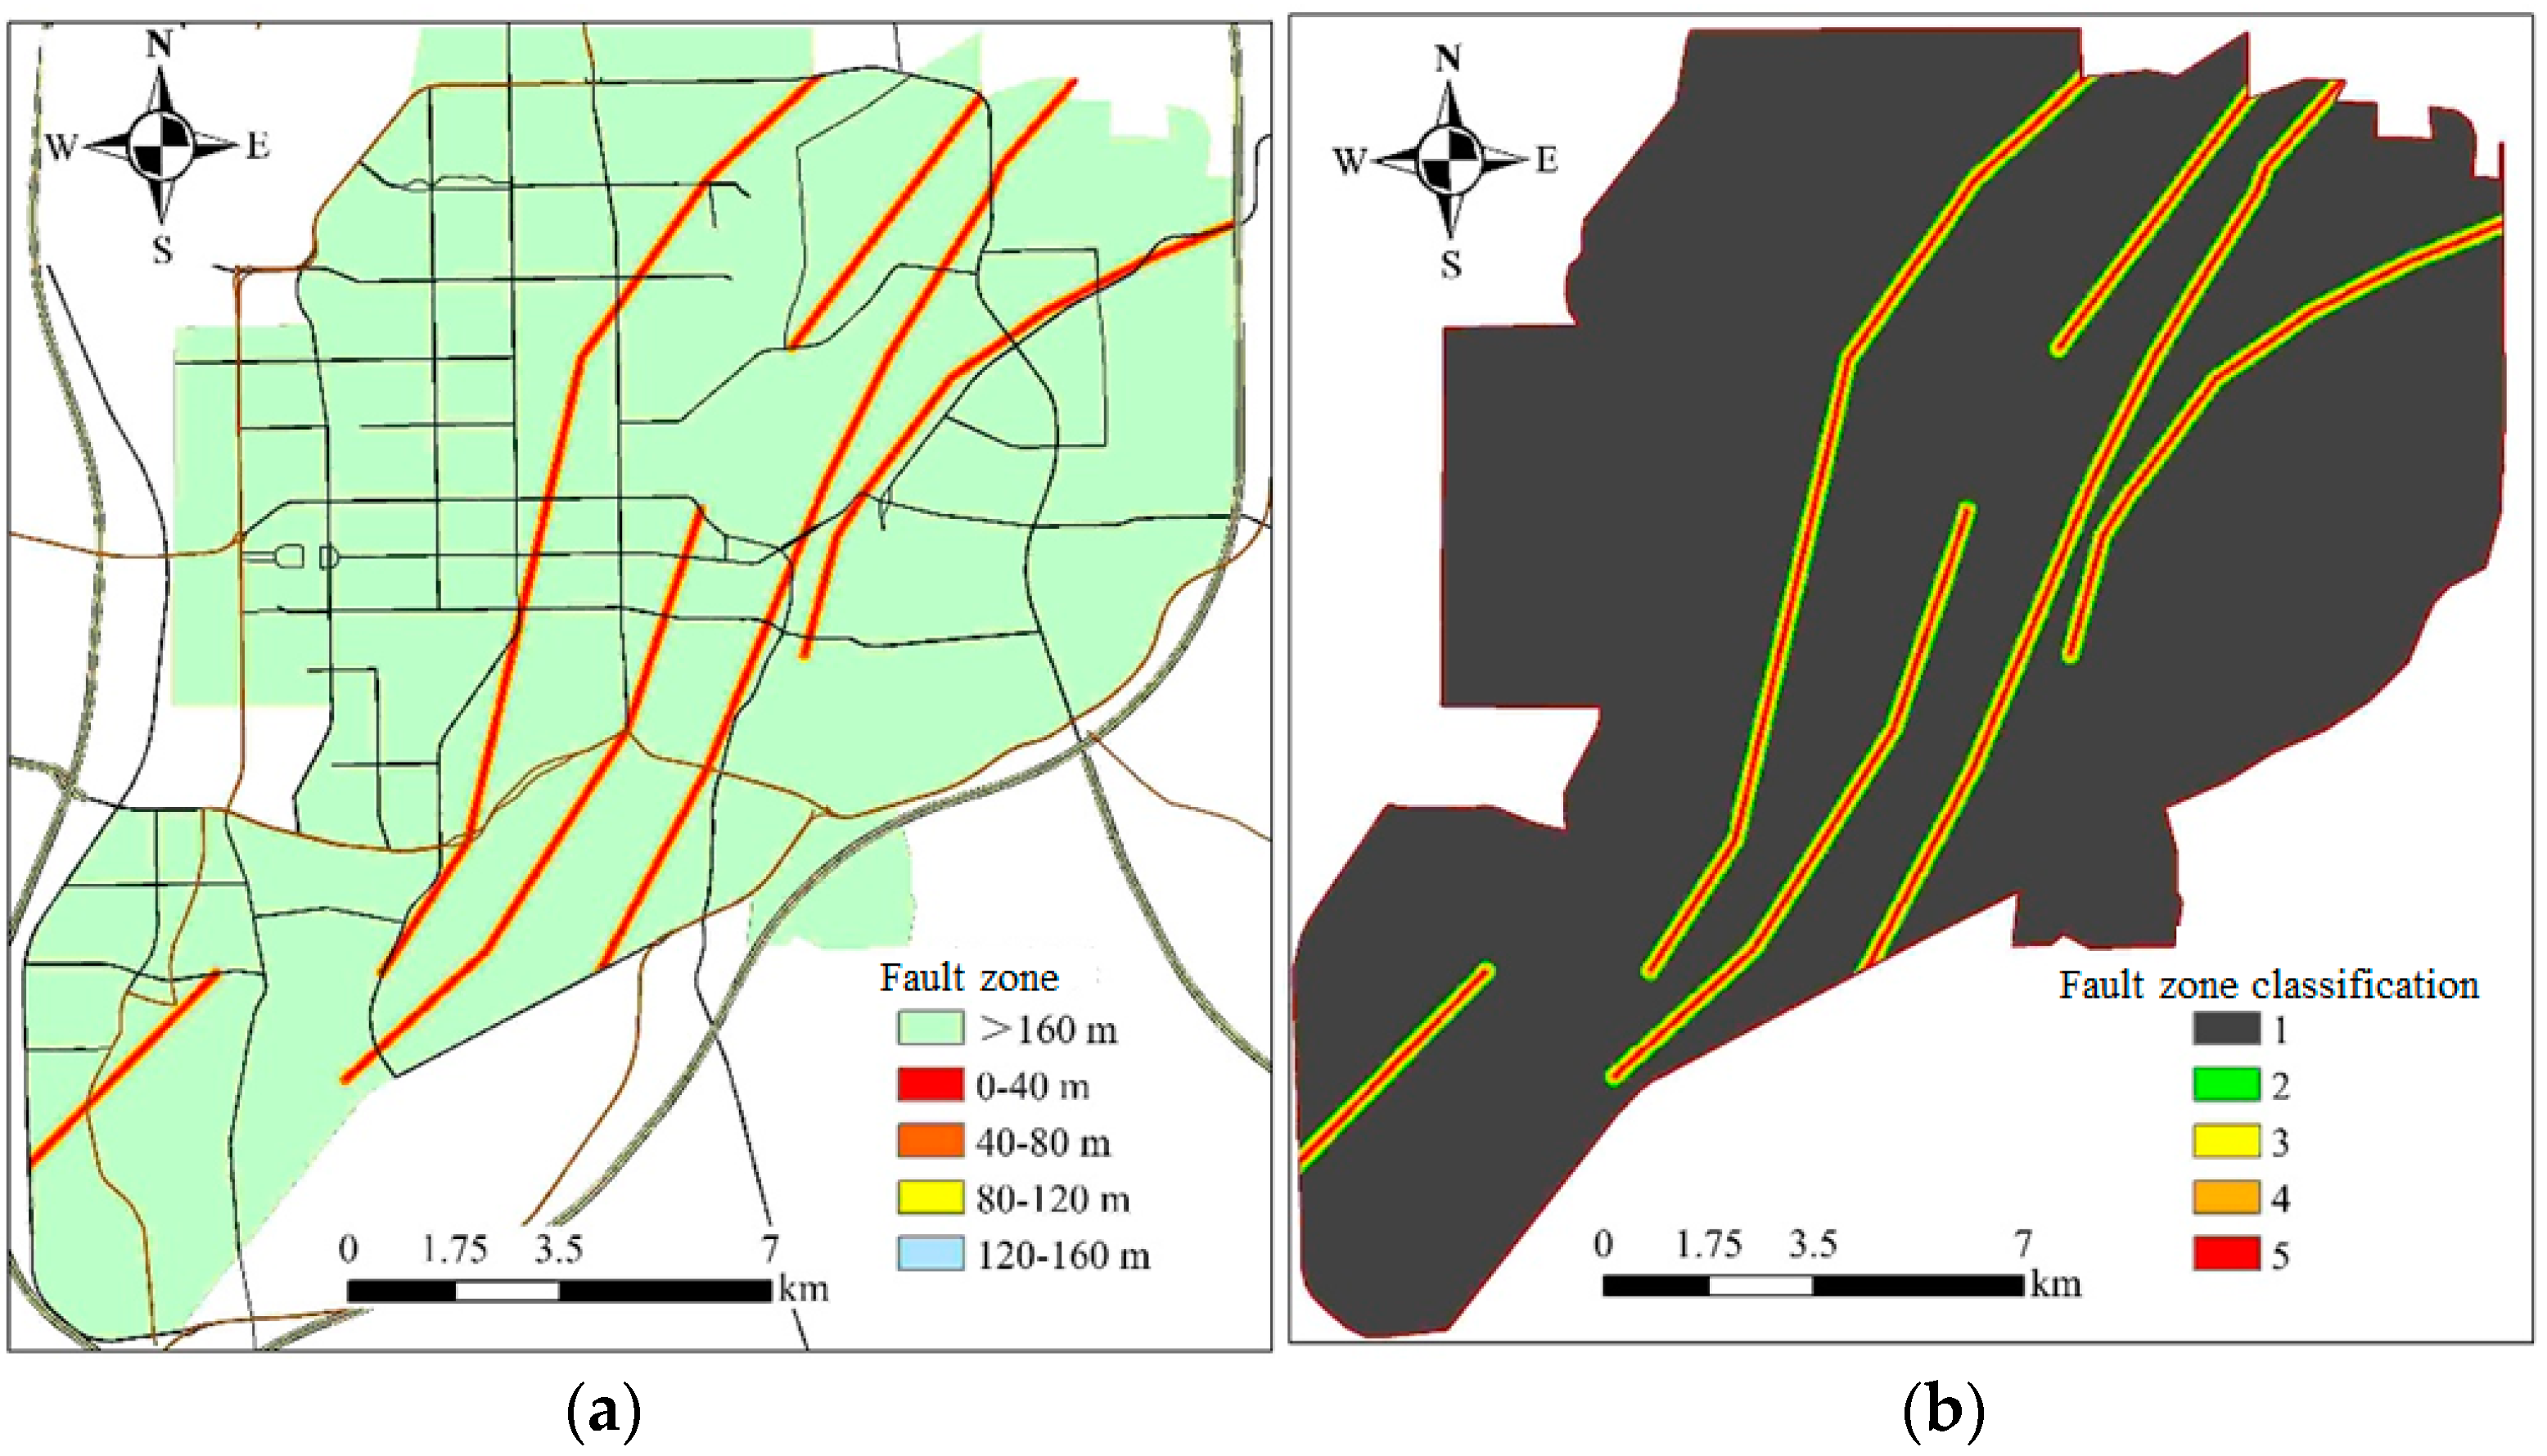
The geological tectonic zones beneath the urban road surface exhibit extensive karst development. At several fault zone turning points within the study area, the presence of well-developed water conduits, formed by these faults, fosters karst development and heightens the susceptibility to collapse. The study area’s proximity to these fault zones was classified into five levels, as depicted in Figure 13.

Figure 13.
Distance from study area to fault zone. (a) Distribution. (b) Classification.
(3) The distance-to-water system
The distance-to-water system was delineated using ArcGIS to establish buffers of 0–100 m, 100–200 m, 200–300 m, and greater than 300 m, as illustrated in Figure 14a,b. These buffers were subsequently merged and trimmed to the extent of the study area. The polygons were then converted into raster data with a pixel size of 30 m × 30 m utilizing the conversion tool. Upon the classification of each indicator, the collapse point data, sourced from an Excel spreadsheet containing latitude and longitude coordinates, were imported into ArcGIS. The “Extract Multi Values to Points” tool was employed to assign the classification indicators of each single factor to the attribute table of the hazard points. ArcGIS software was subsequently used to summarize and calculate the statistical results for each classification indicator of every evaluation factor. The results are compiled in Table 9. The information quantities for the different levels of each factor were also computed.

Figure 14.
Distance from study area to water. (a) Distribution. (b) Classification.
Table 9.
Assigned values of distance to water.
3.1.2. Engineering Factors
The engineering factors predominantly influencing the ground collapse hazard in the study area include the road load classification, road network density, collapse zones, and goaf areas.
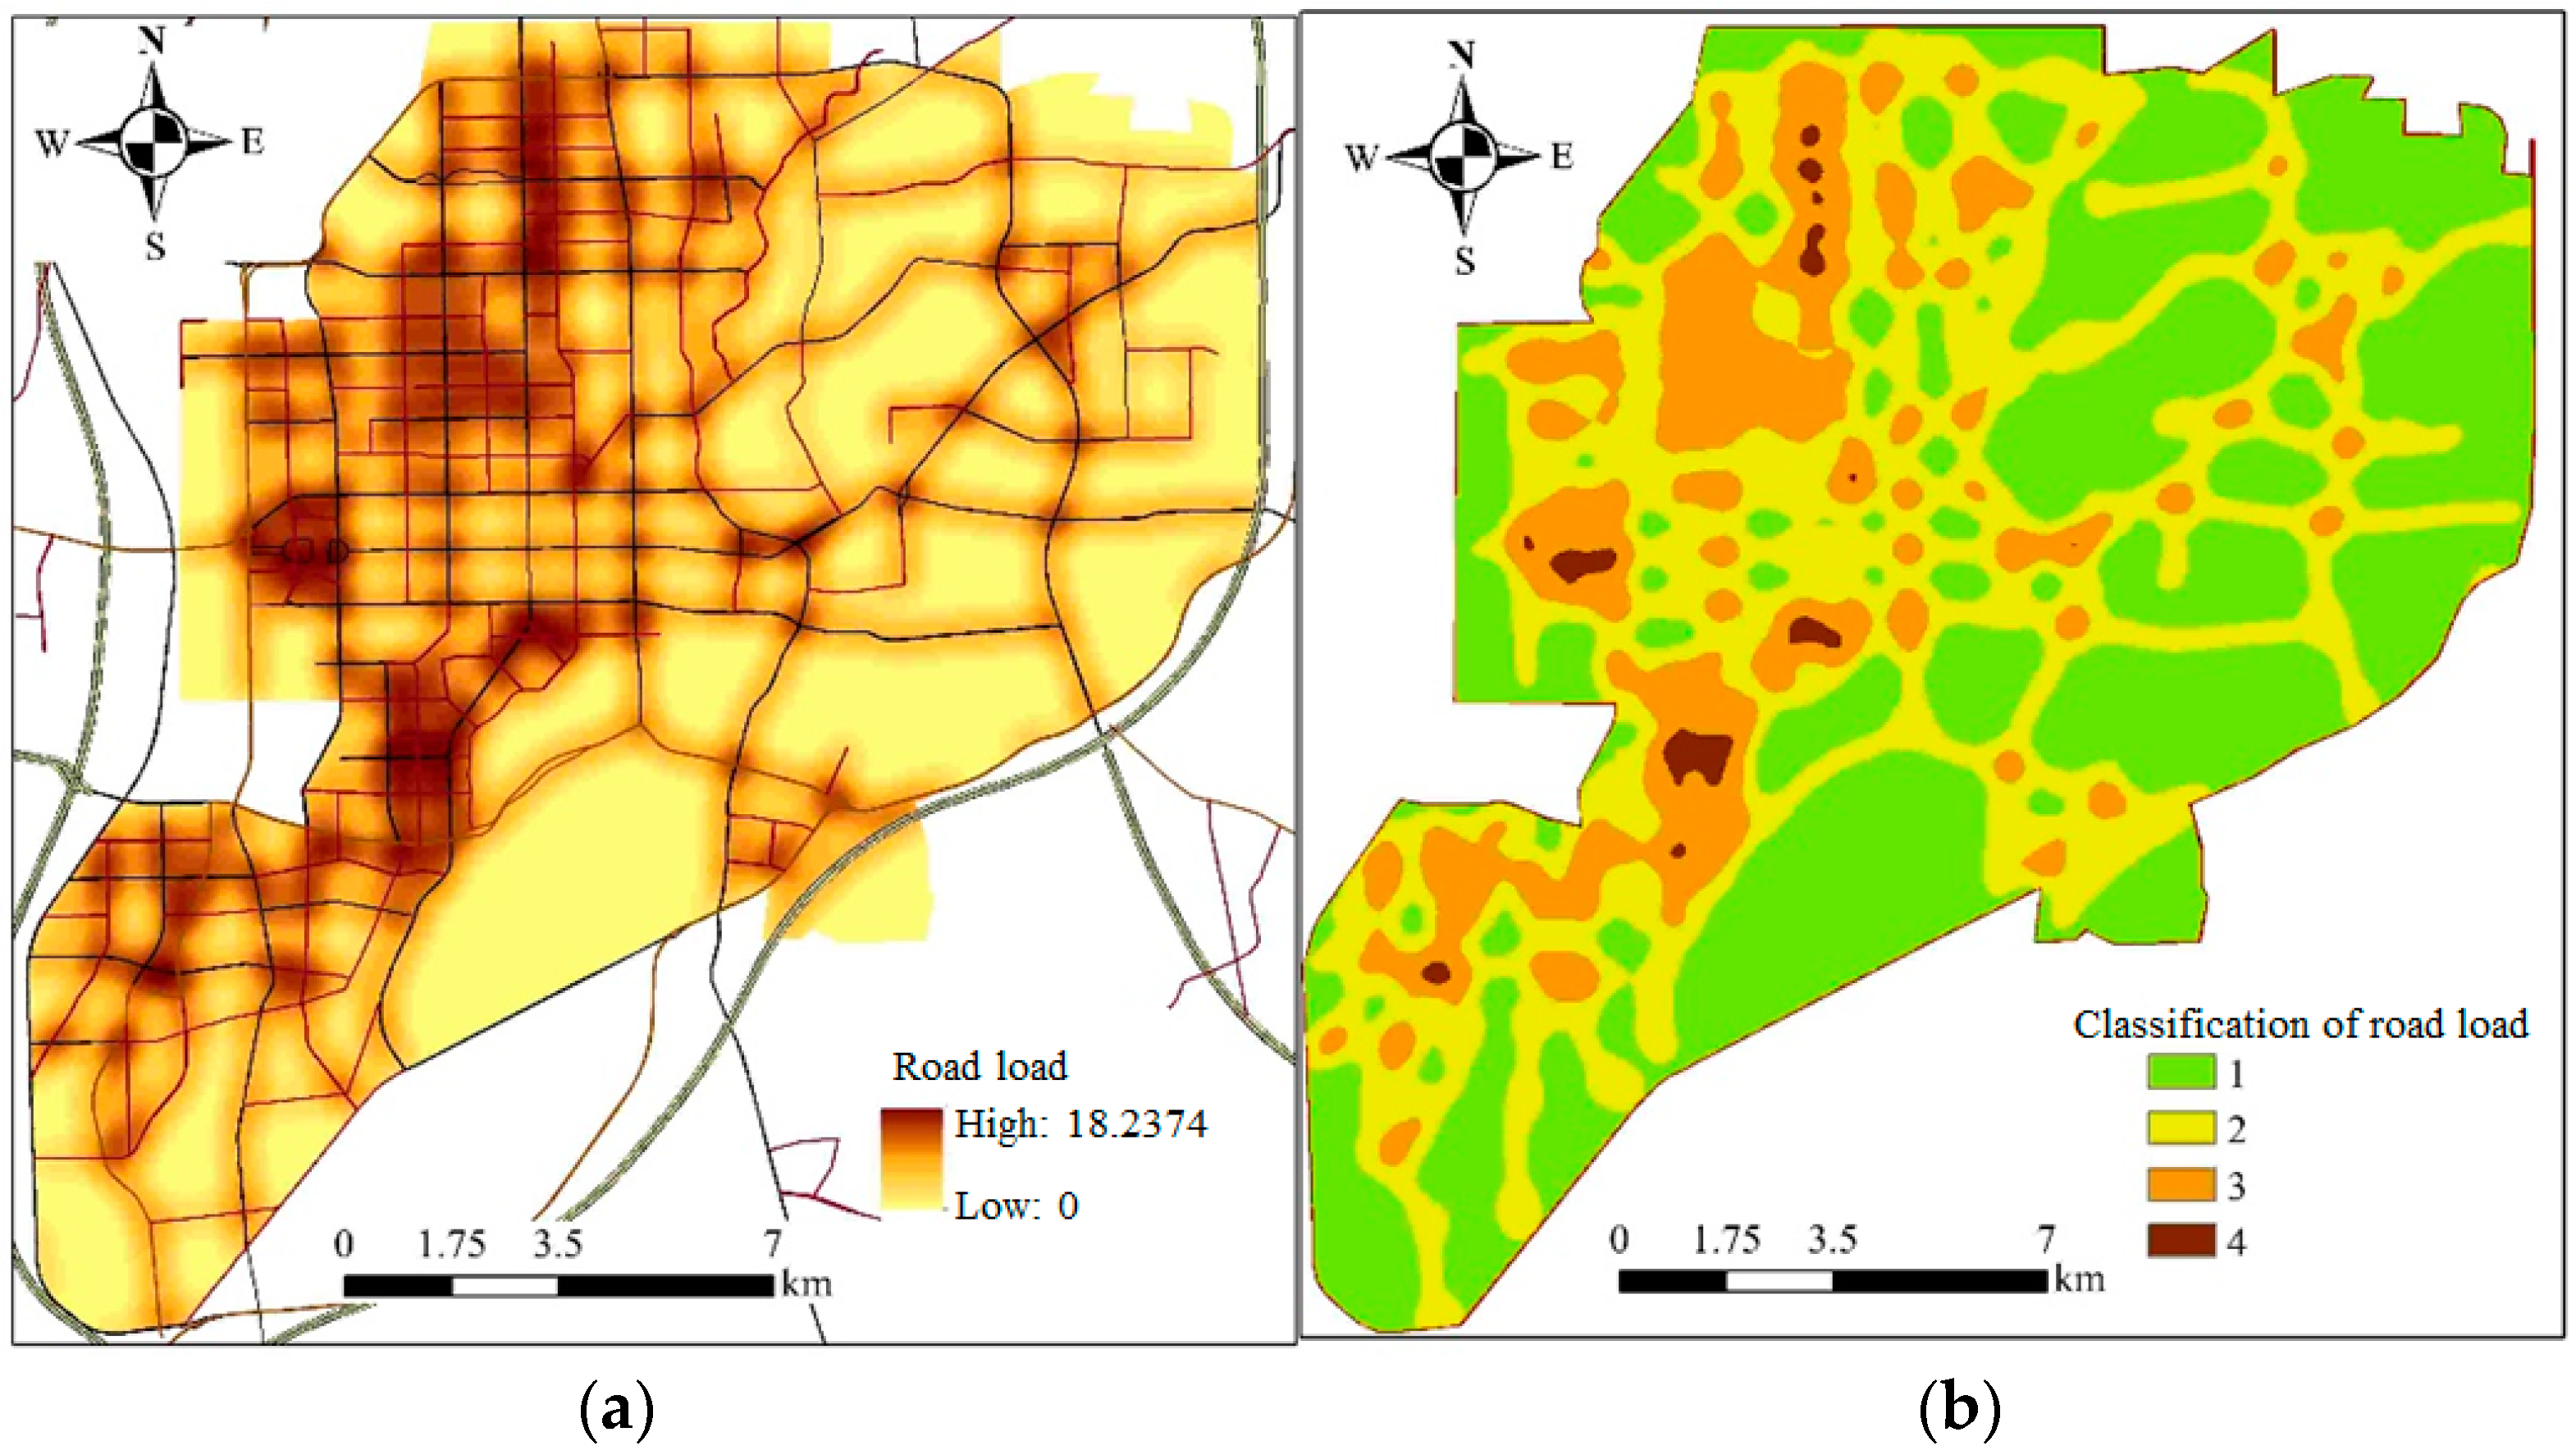
(1) Road Load Classification
The road vehicle loads were qualitatively analyzed based on road classification, with higher road classifications indicating greater vehicle loads. Utilizing ArcGIS, the main roads, secondary roads, and other supporting roads in the study area were extracted and assigned load values. Main roads were assigned a value of 5, secondary roads were assigned a value of 3, and other supporting roads were assigned a value of 1. The road load classification was subsequently merged, and a kernel density analysis was employed to categorize the road load levels, as depicted in Figure 15.
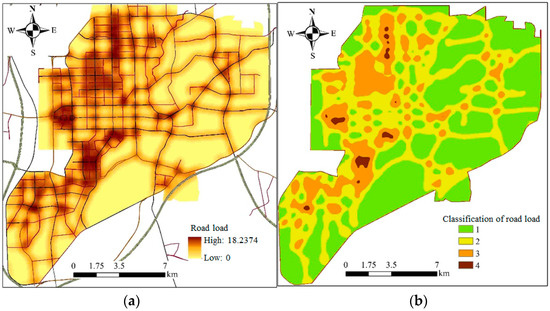
Figure 15.
Road load of study area. (a) Road load distribution. (b) Road load classification.
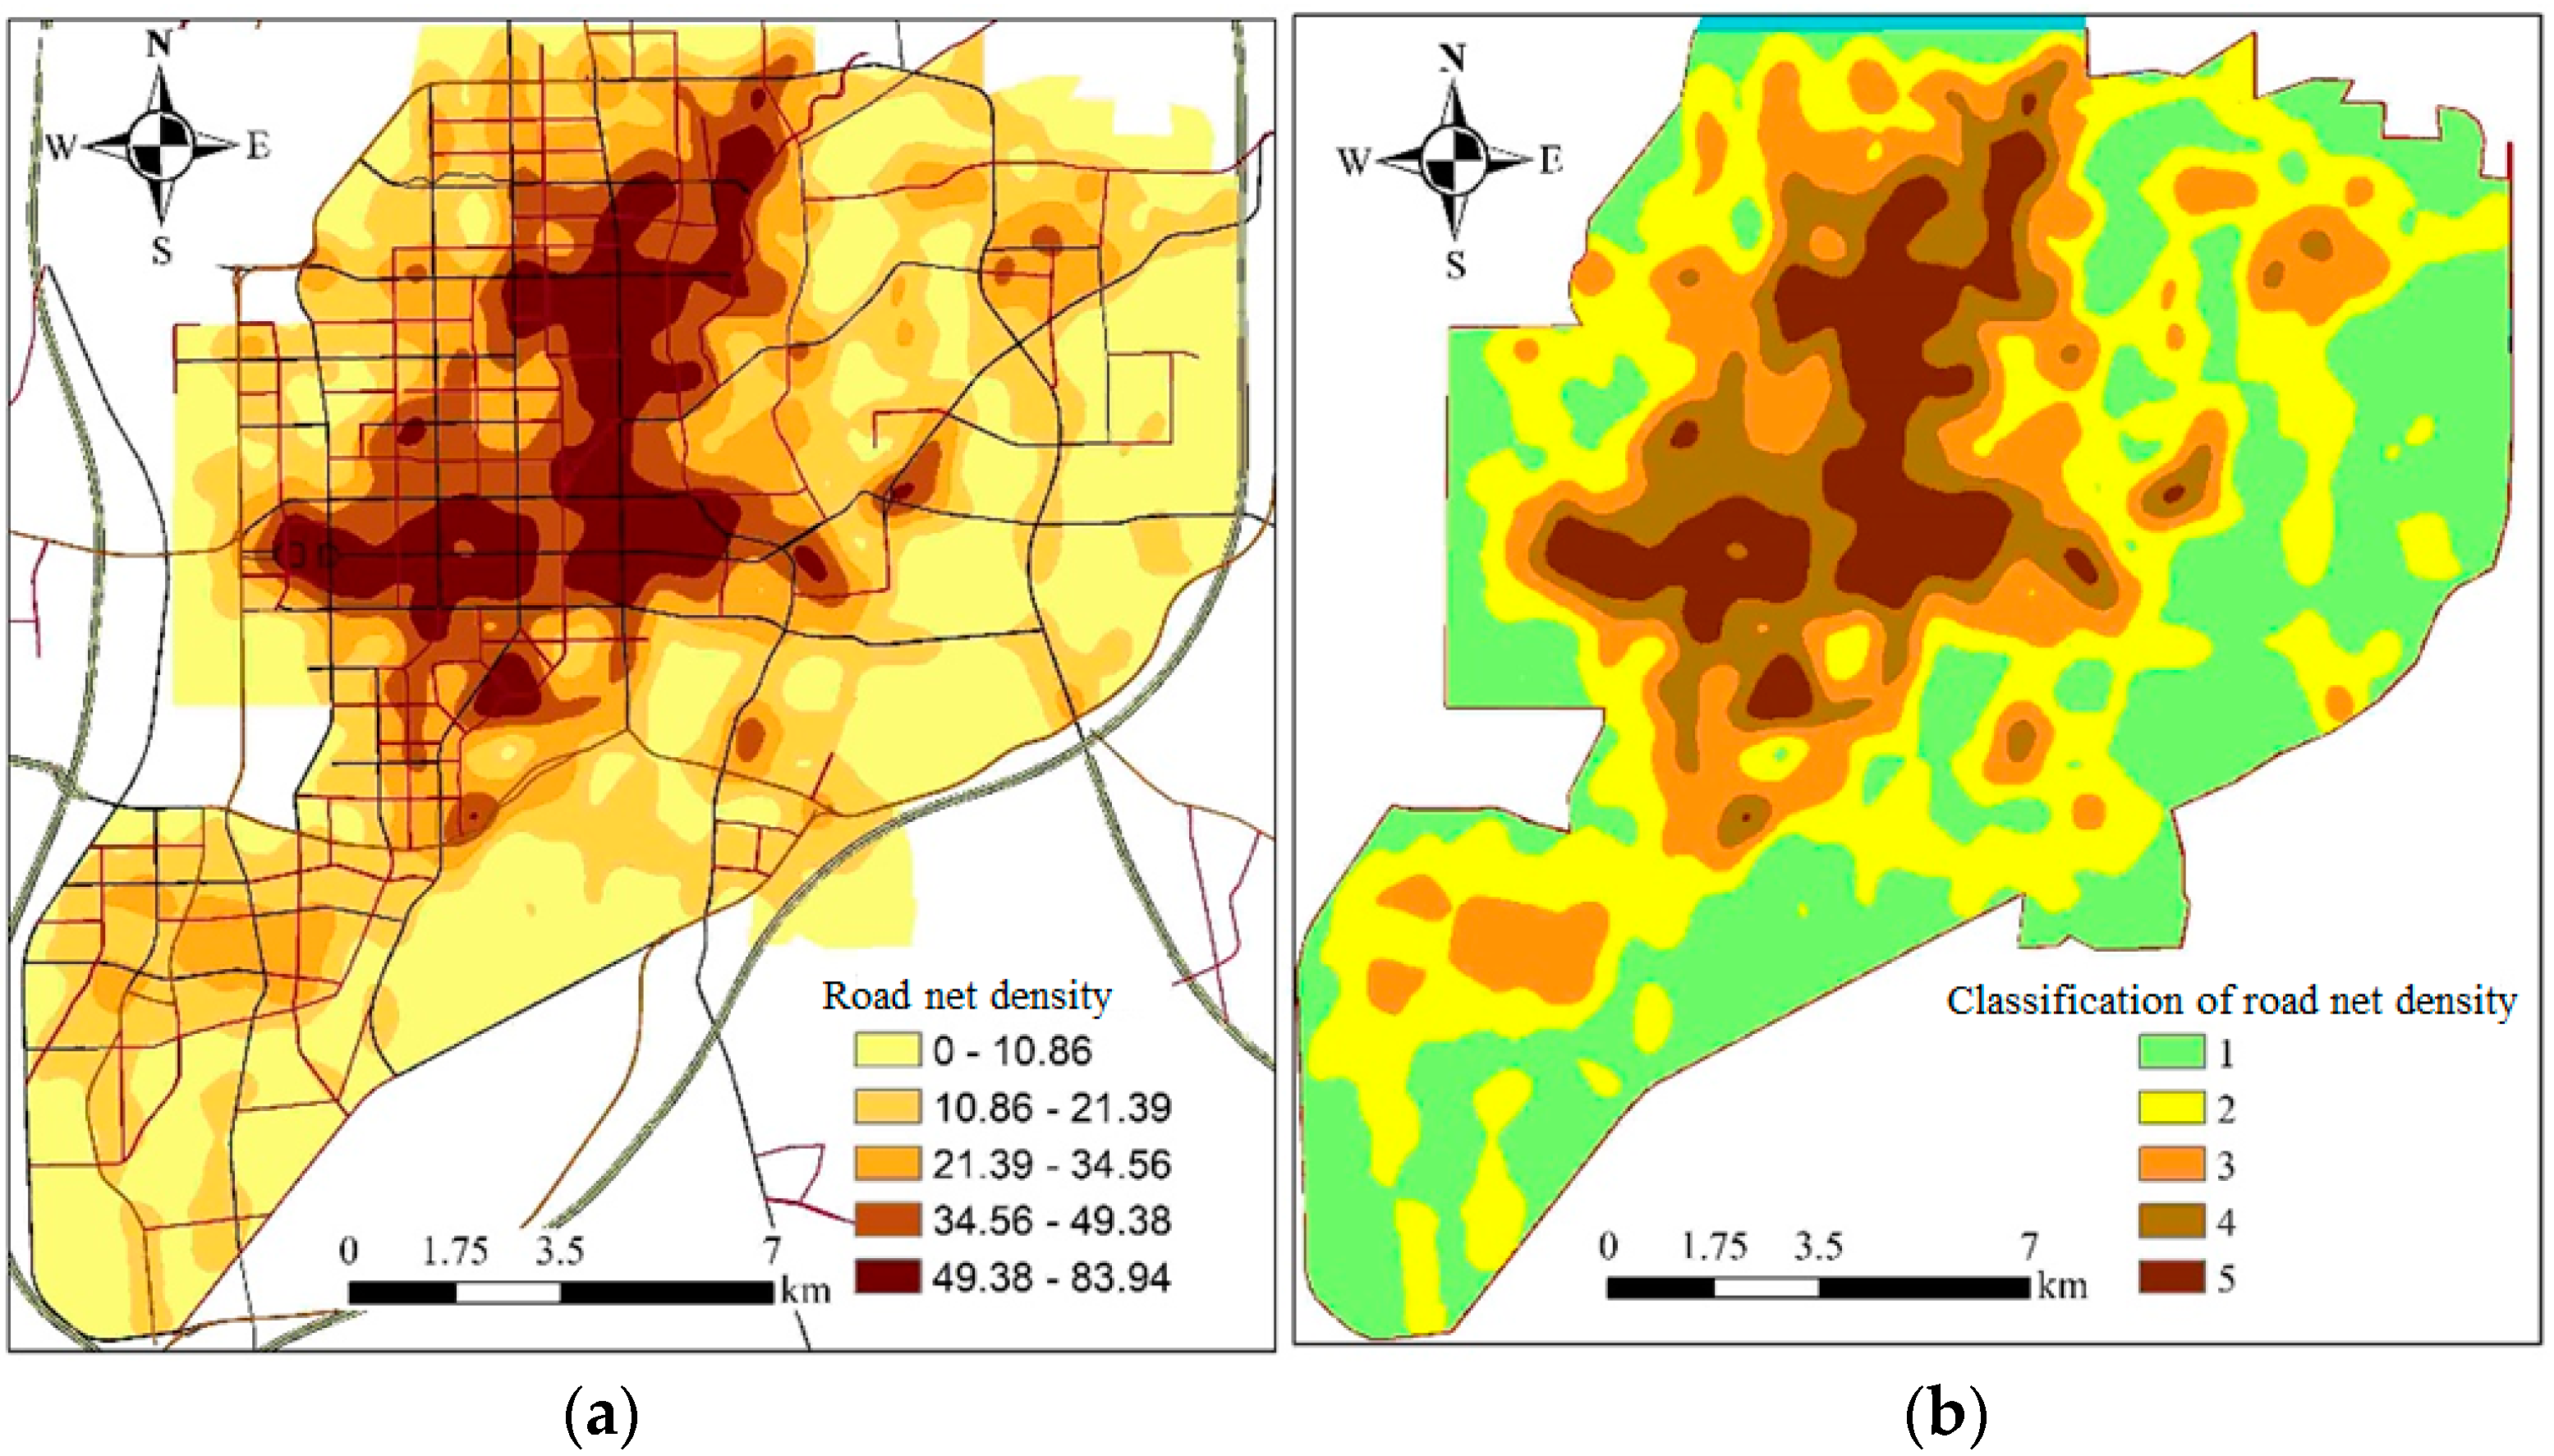
(2) Road Network Density in the Study Area
The road network within the study area was extracted by intersecting the previously downloaded Tangshan City road network with the administrative boundaries of the study area using geoprocessing tools. A kernel density analysis was performed on the road network, as illustrated in Figure 16.
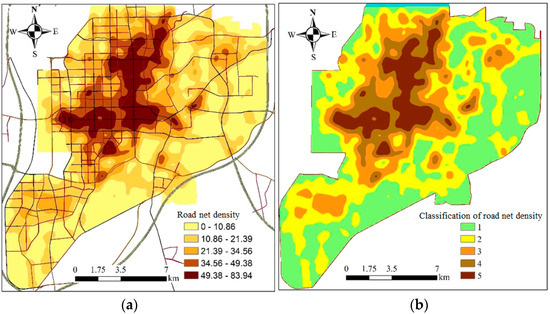
Figure 16.
Road network density of study area. (a) Road network density distribution. (b) Road network density classification.
This analysis calculated the total length of the polylines within each 30 m × 30 m raster cell. The road network density was determined via the ratio of the total length of roads within the raster cells to the cell area. The road network density was classified into five categories using natural breaks, as detailed in Table 10.
Table 10.
The values of road network density classification in the study area.
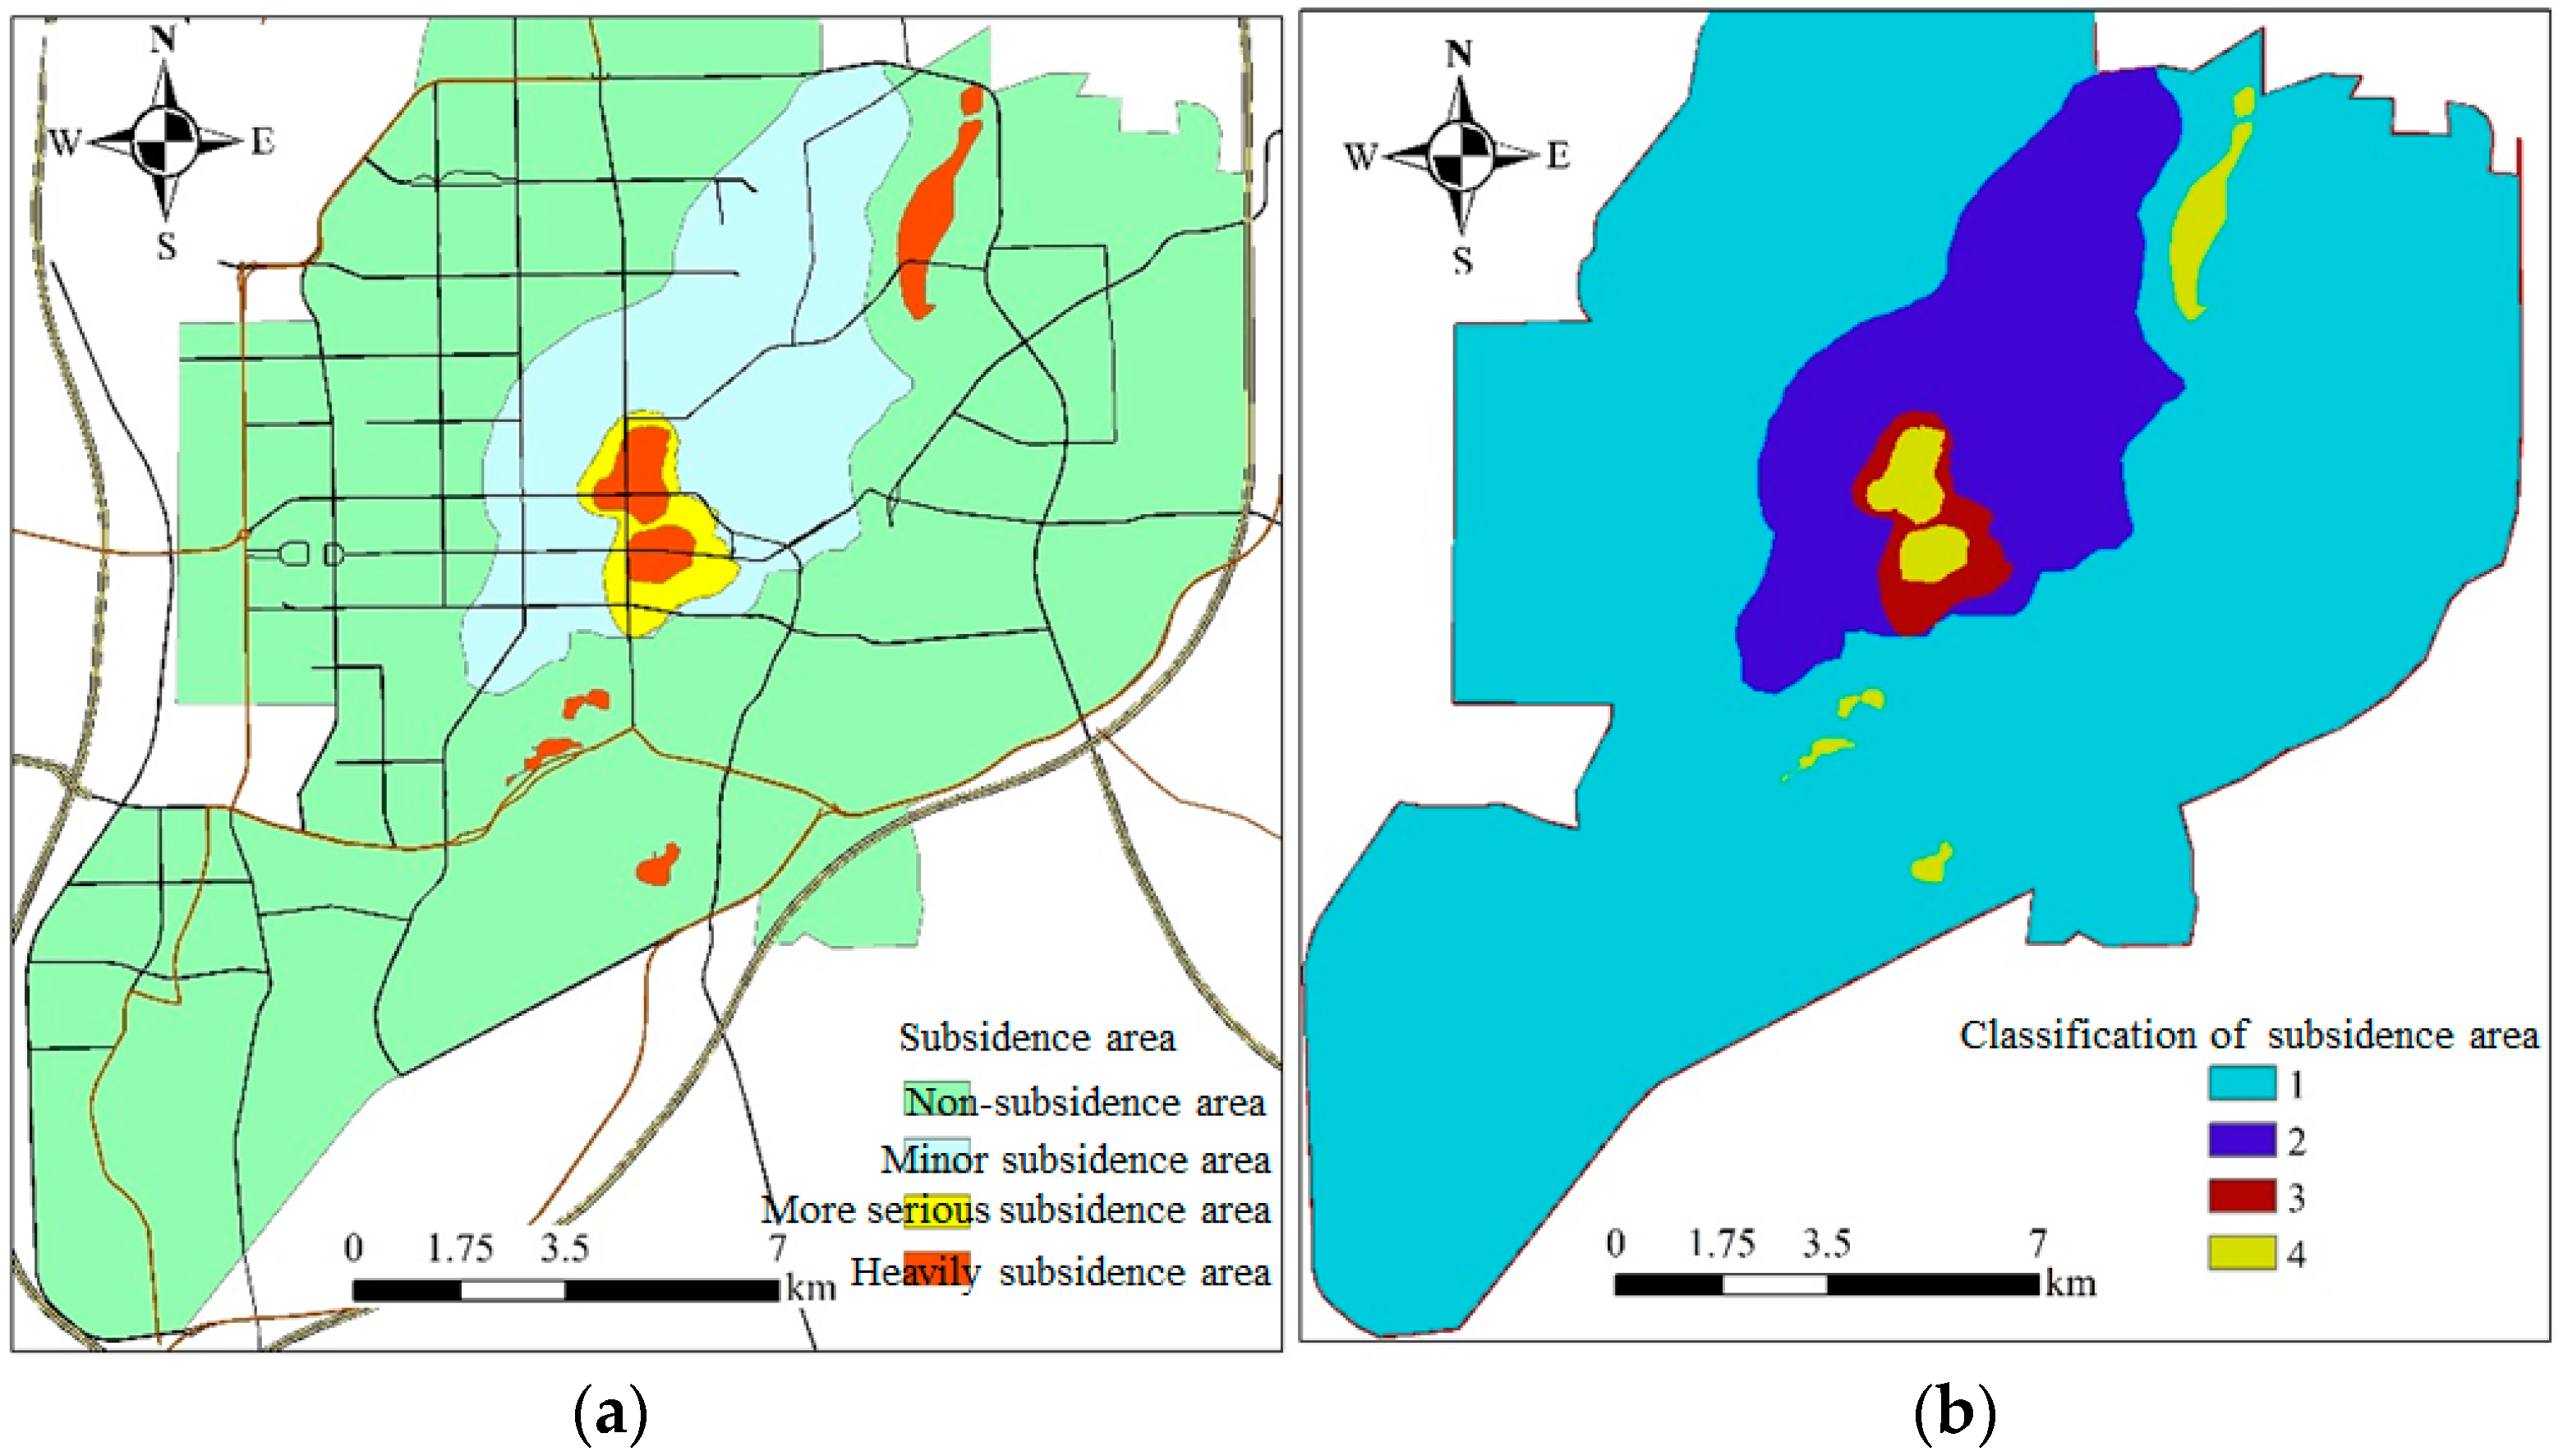
(3) Collapse Zones in the Main Urban Area
The distribution of karst collapse zones is directly related to ground collapse. Based on the distribution of multiple collapse points in the urban area, it is evident that most collapse points are clustered along fault zones. Karst development leads to the formation of underground karst cavities, which can easily result in collapse.
The karst collapse zones in the study area are predominantly located in the central and northern regions. Karst collapses are closely related to groundwater levels and are mostly situated within the subsidence funnels caused by the groundwater lowering. According to the “Tangshan City Comprehensive Disaster Prevention and Reduction Detailed Plan (2016–2020)”, the distribution of collapses in the study area was obtained, as shown in the diagram. The collapses were classified into four severity levels and assigned corresponding values, as illustrated in Figure 17.
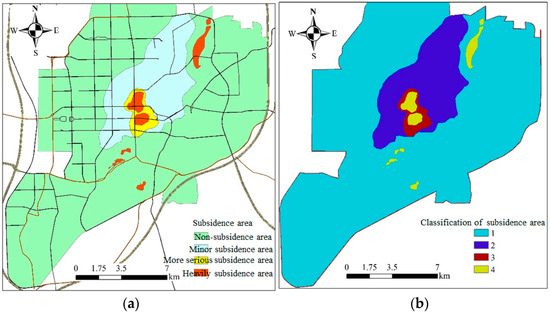
Figure 17.
Karst collapse area of study area. (a) Distribution of karst collapse area. (b) classification of karst collapse area.
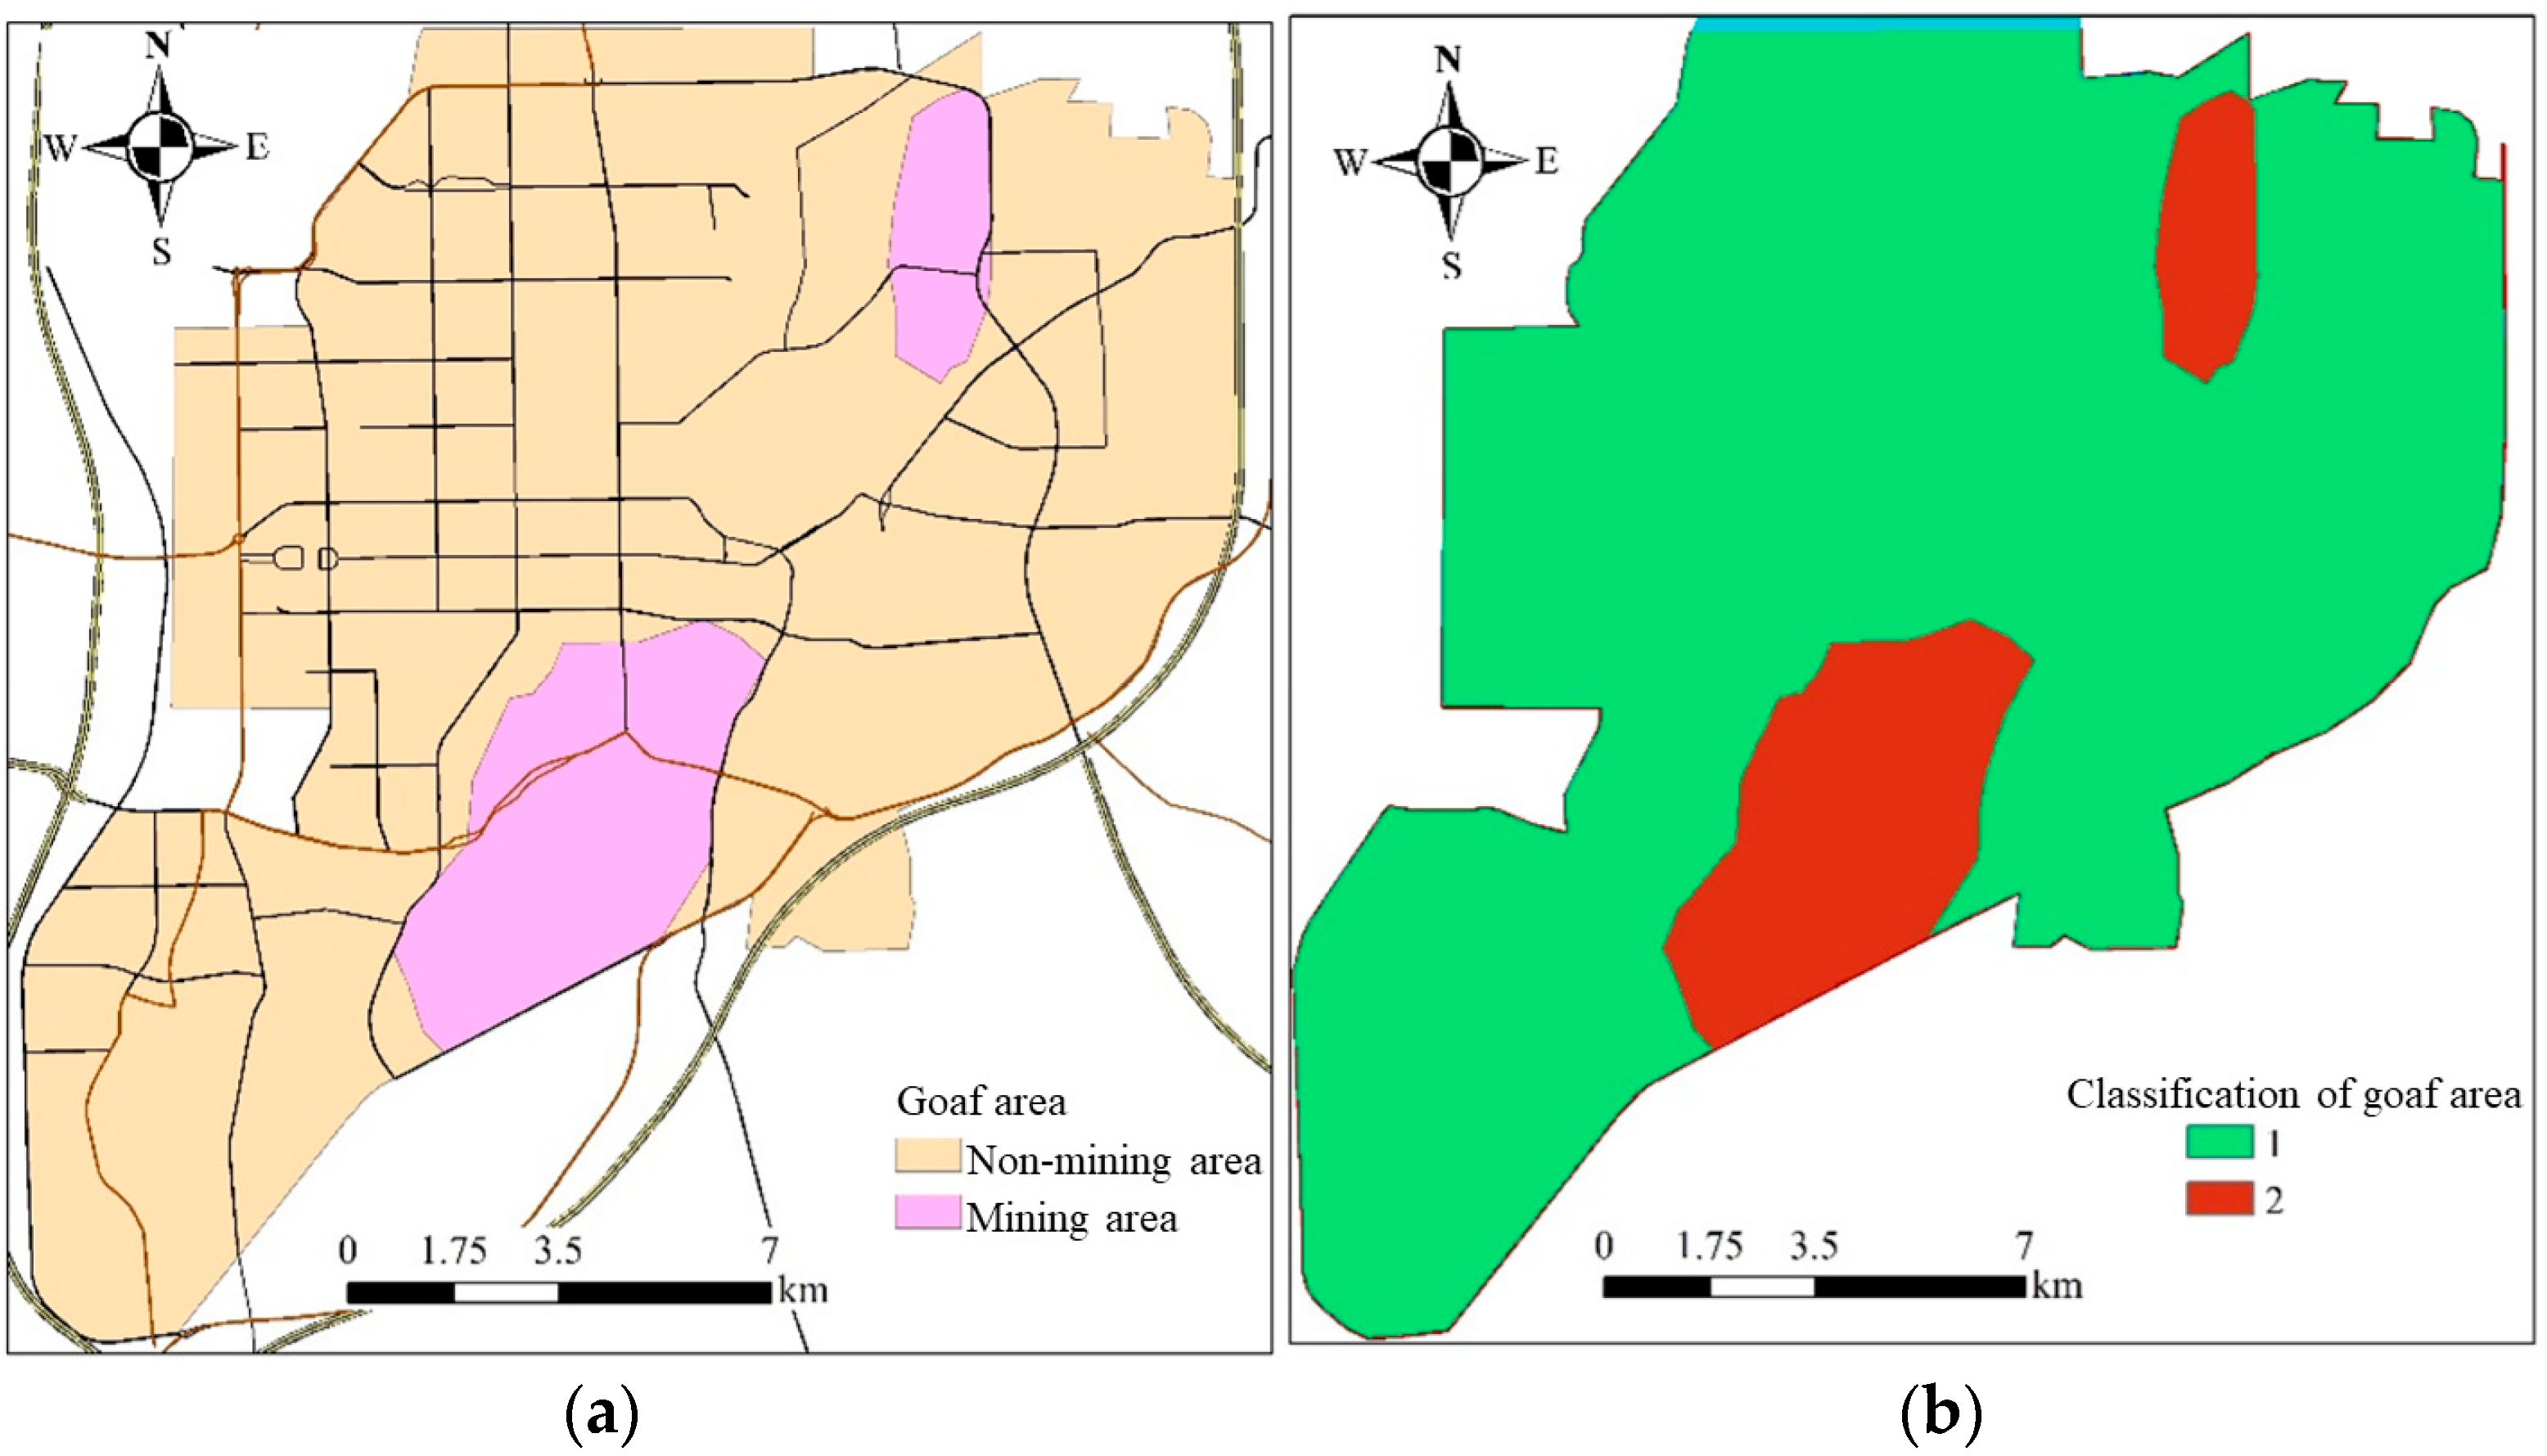
(4) Goaf Areas in the Study Area
Two significant goaf collapse areas are located in the northern part of the study area, within the jurisdiction of Kailuan District. Another larger goaf area is situated in Tangshan Nanhu Park. The mining-induced collapses in these areas result in uneven ground surfaces and large underground goaf cavities. If the overlying soil layer becomes unstable, then this can easily trigger ground collapse. Therefore, goaf areas were selected as an indicator for assessing the ground collapse hazard in the urban area. The study area was divided into goaf areas and non-goaf areas, which were assigned values of 2 and 1, respectively, as shown in Figure 18.

Figure 18.
Goaf area of study area. (a) Distribution of goaf area. (b) Classification of goaf area.
3.1.3. Inducing Factors
The engineering factors that predominantly influence the ground collapse hazard include rainfall, underground pipeline leakage, seismic soil liquefaction, and seismic peak ground acceleration. These factors collectively account for a significant proportion (41%) of the ground collapse incidents in Tangshan City, underscoring the importance of analyzing these inducing factors for the development of an effective ground collapse hazard assessment method.
(1) Rainfall.
The rainfall distribution in the study area is uneven throughout the year, with approximately 70% of the annual rainfall occurring in summer. Historical data on ground collapse incidents in the study area indicate that July is the month most prone to them, which is also the month in which the highest rainfall is recorded. To analyze the rainfall factor, the maximum monthly rainfall was considered. A spatial interpolation analysis was performed on the July rainfall data from meteorological stations using the inverse-distance weighting method. The rainfall was then classified into four levels, as detailed in Table 11, and the classified rainfall map is presented in Figure 19.
Table 11.
Values of rainfall in the study area.
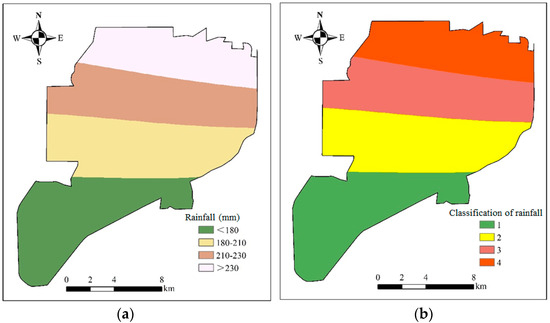
Figure 19.
Rainfall of study area. (a) Distribution of rainfall. (b) Classification of rainfall.
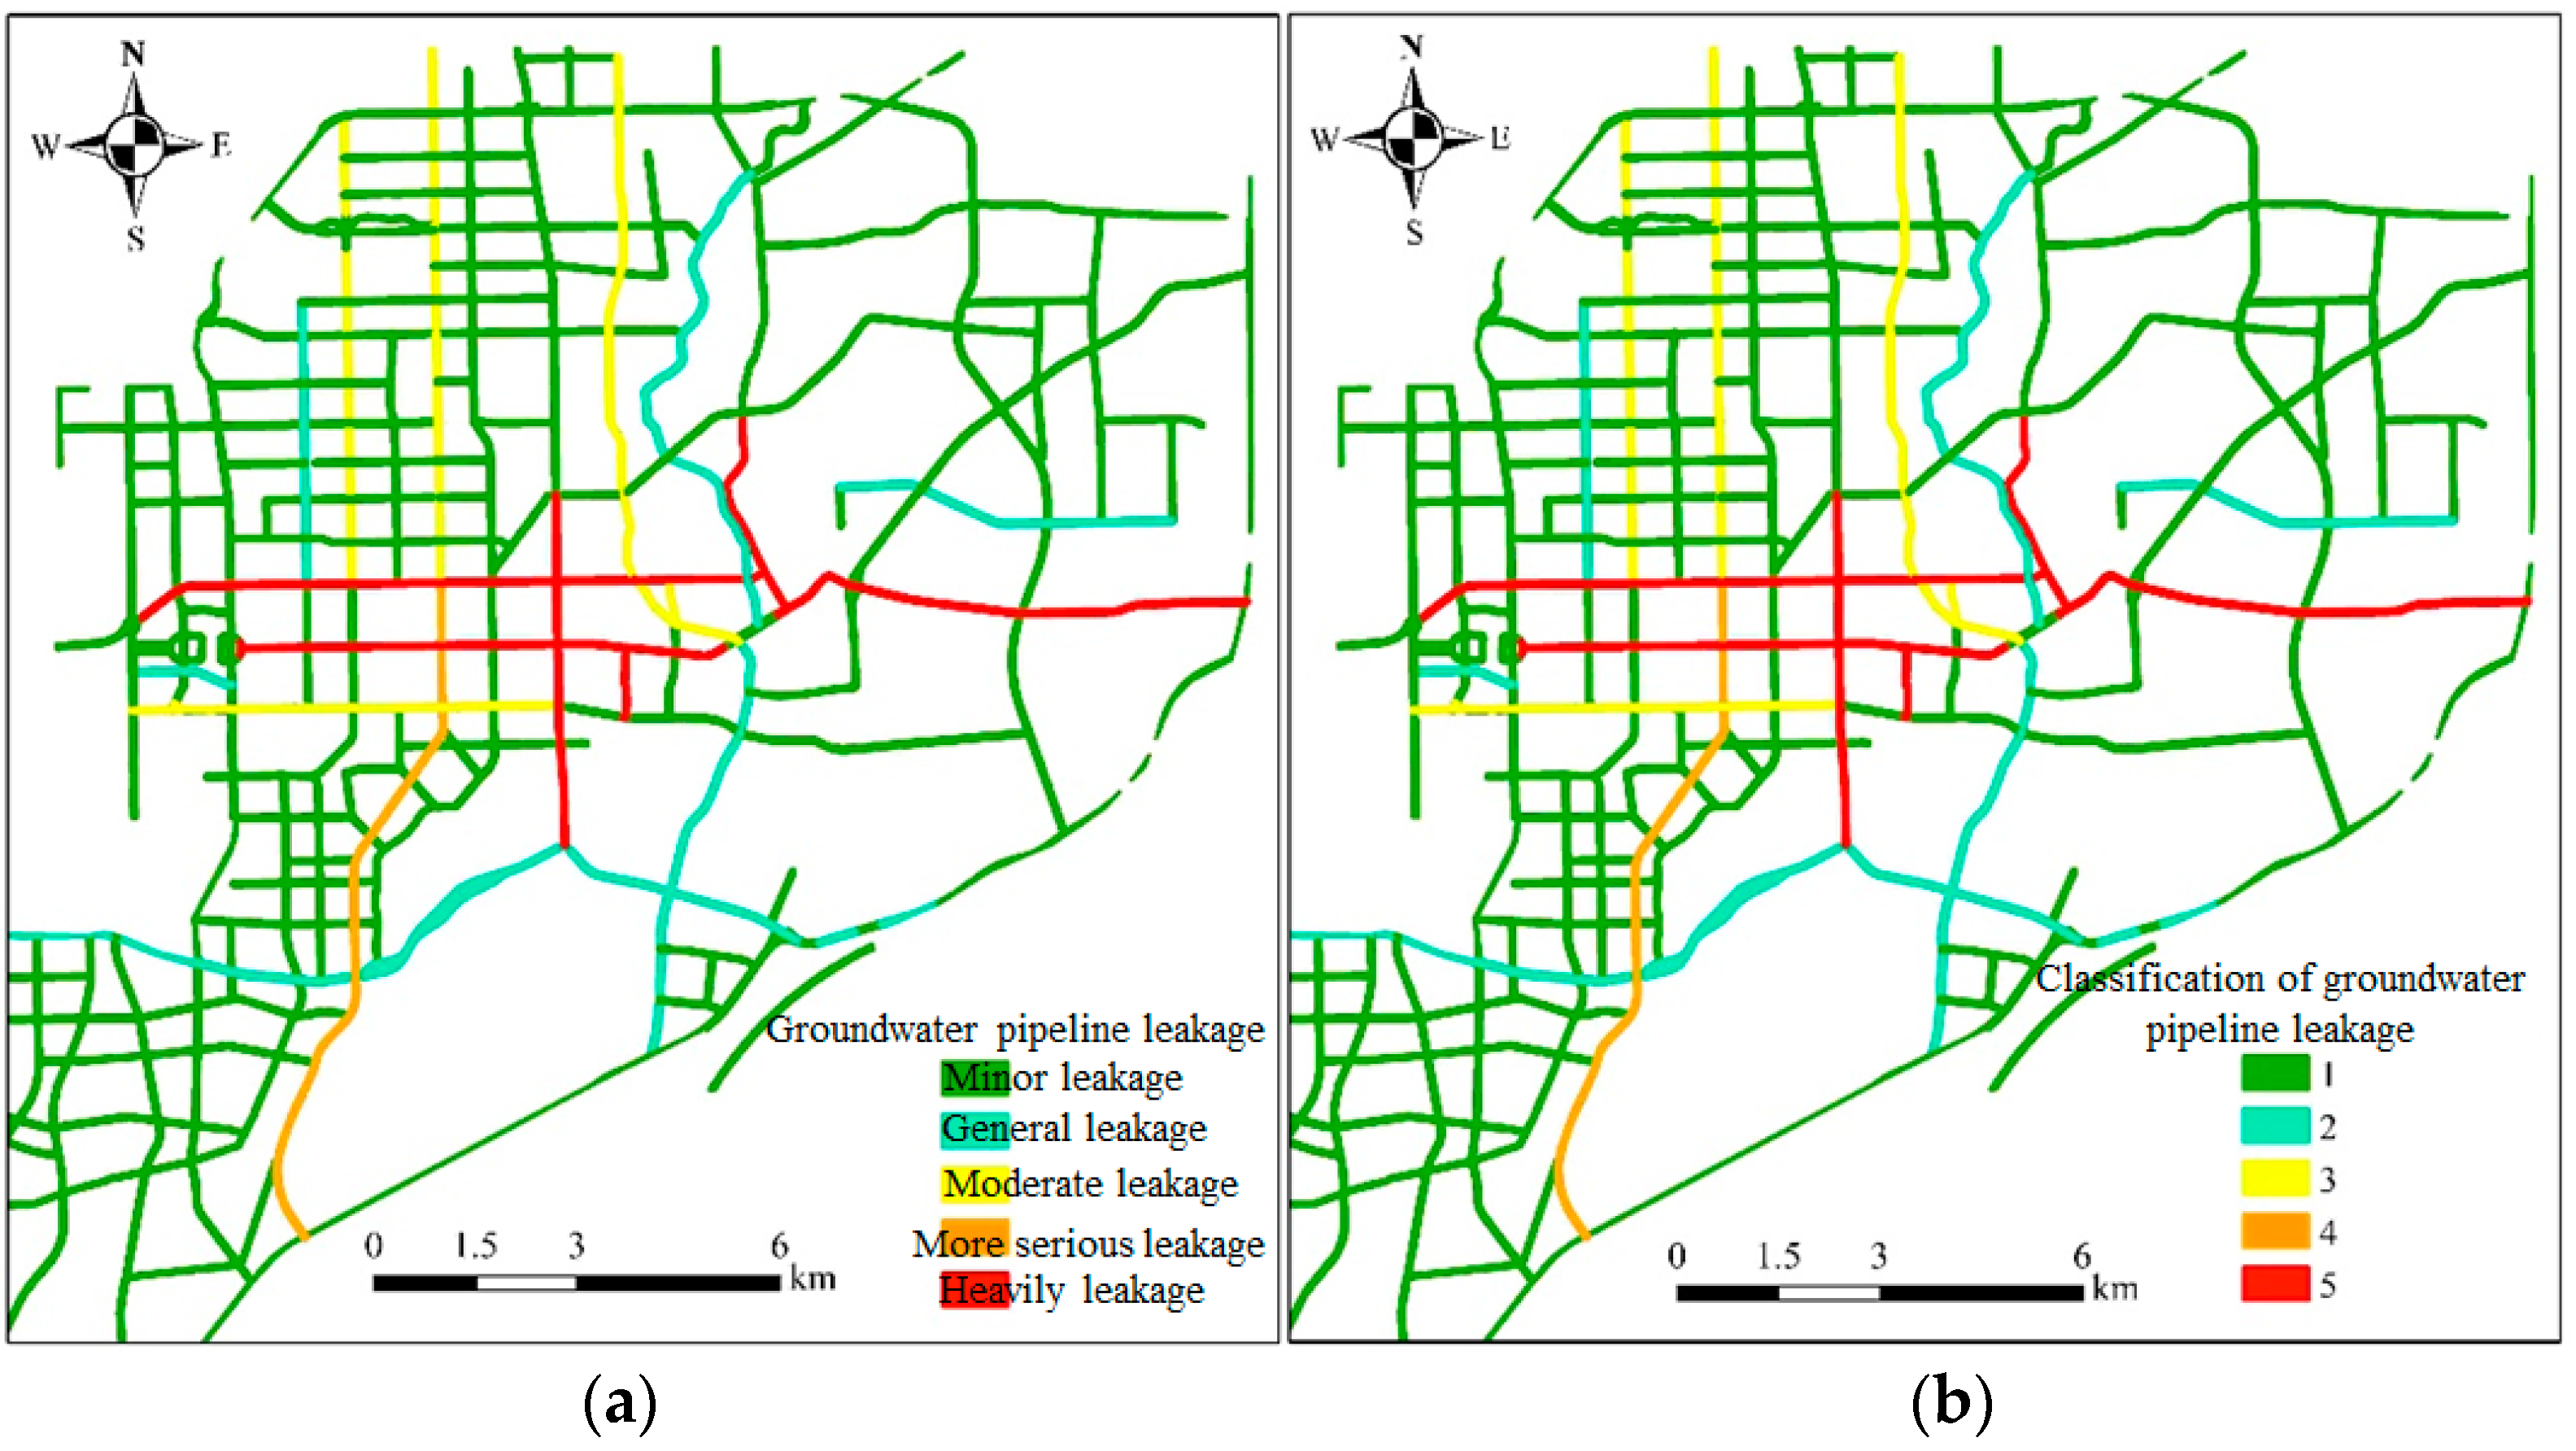
(2) Underground Pipeline Leakage
The underground pipelines in the study area, which include stormwater pipes, sewage pipes, gas pipes, heat pipes, communication pipes, and water supply pipes, form a dense network. Significant leakage issues on some major roads, coupled with this dense network, contribute to ground collapse accidents. Therefore, the distribution and classification of the underground pipelines in the study area are key indicators for assessing the ground collapse hazard. Investigation and analysis of the construction of the underground comprehensive pipeline corridor project reveal severe underground pipeline leakage issues on some critical road sections in the study area, as detailed in Table 12.
Table 12.
Distribution of underground pipelines.
These roads were buffered within ArcGIS using a 30 m radius and classified based on the type of underground pipelines and their leakage conditions, as shown in Figure 20.
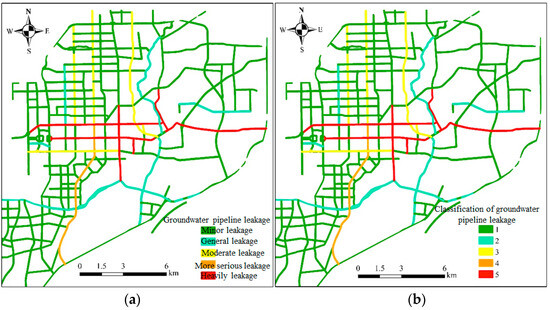
Figure 20.
Leakage of underground pipelines in the study area. (a) Leakage of underground pipelines. (b) Classification of underground pipeline leakage.
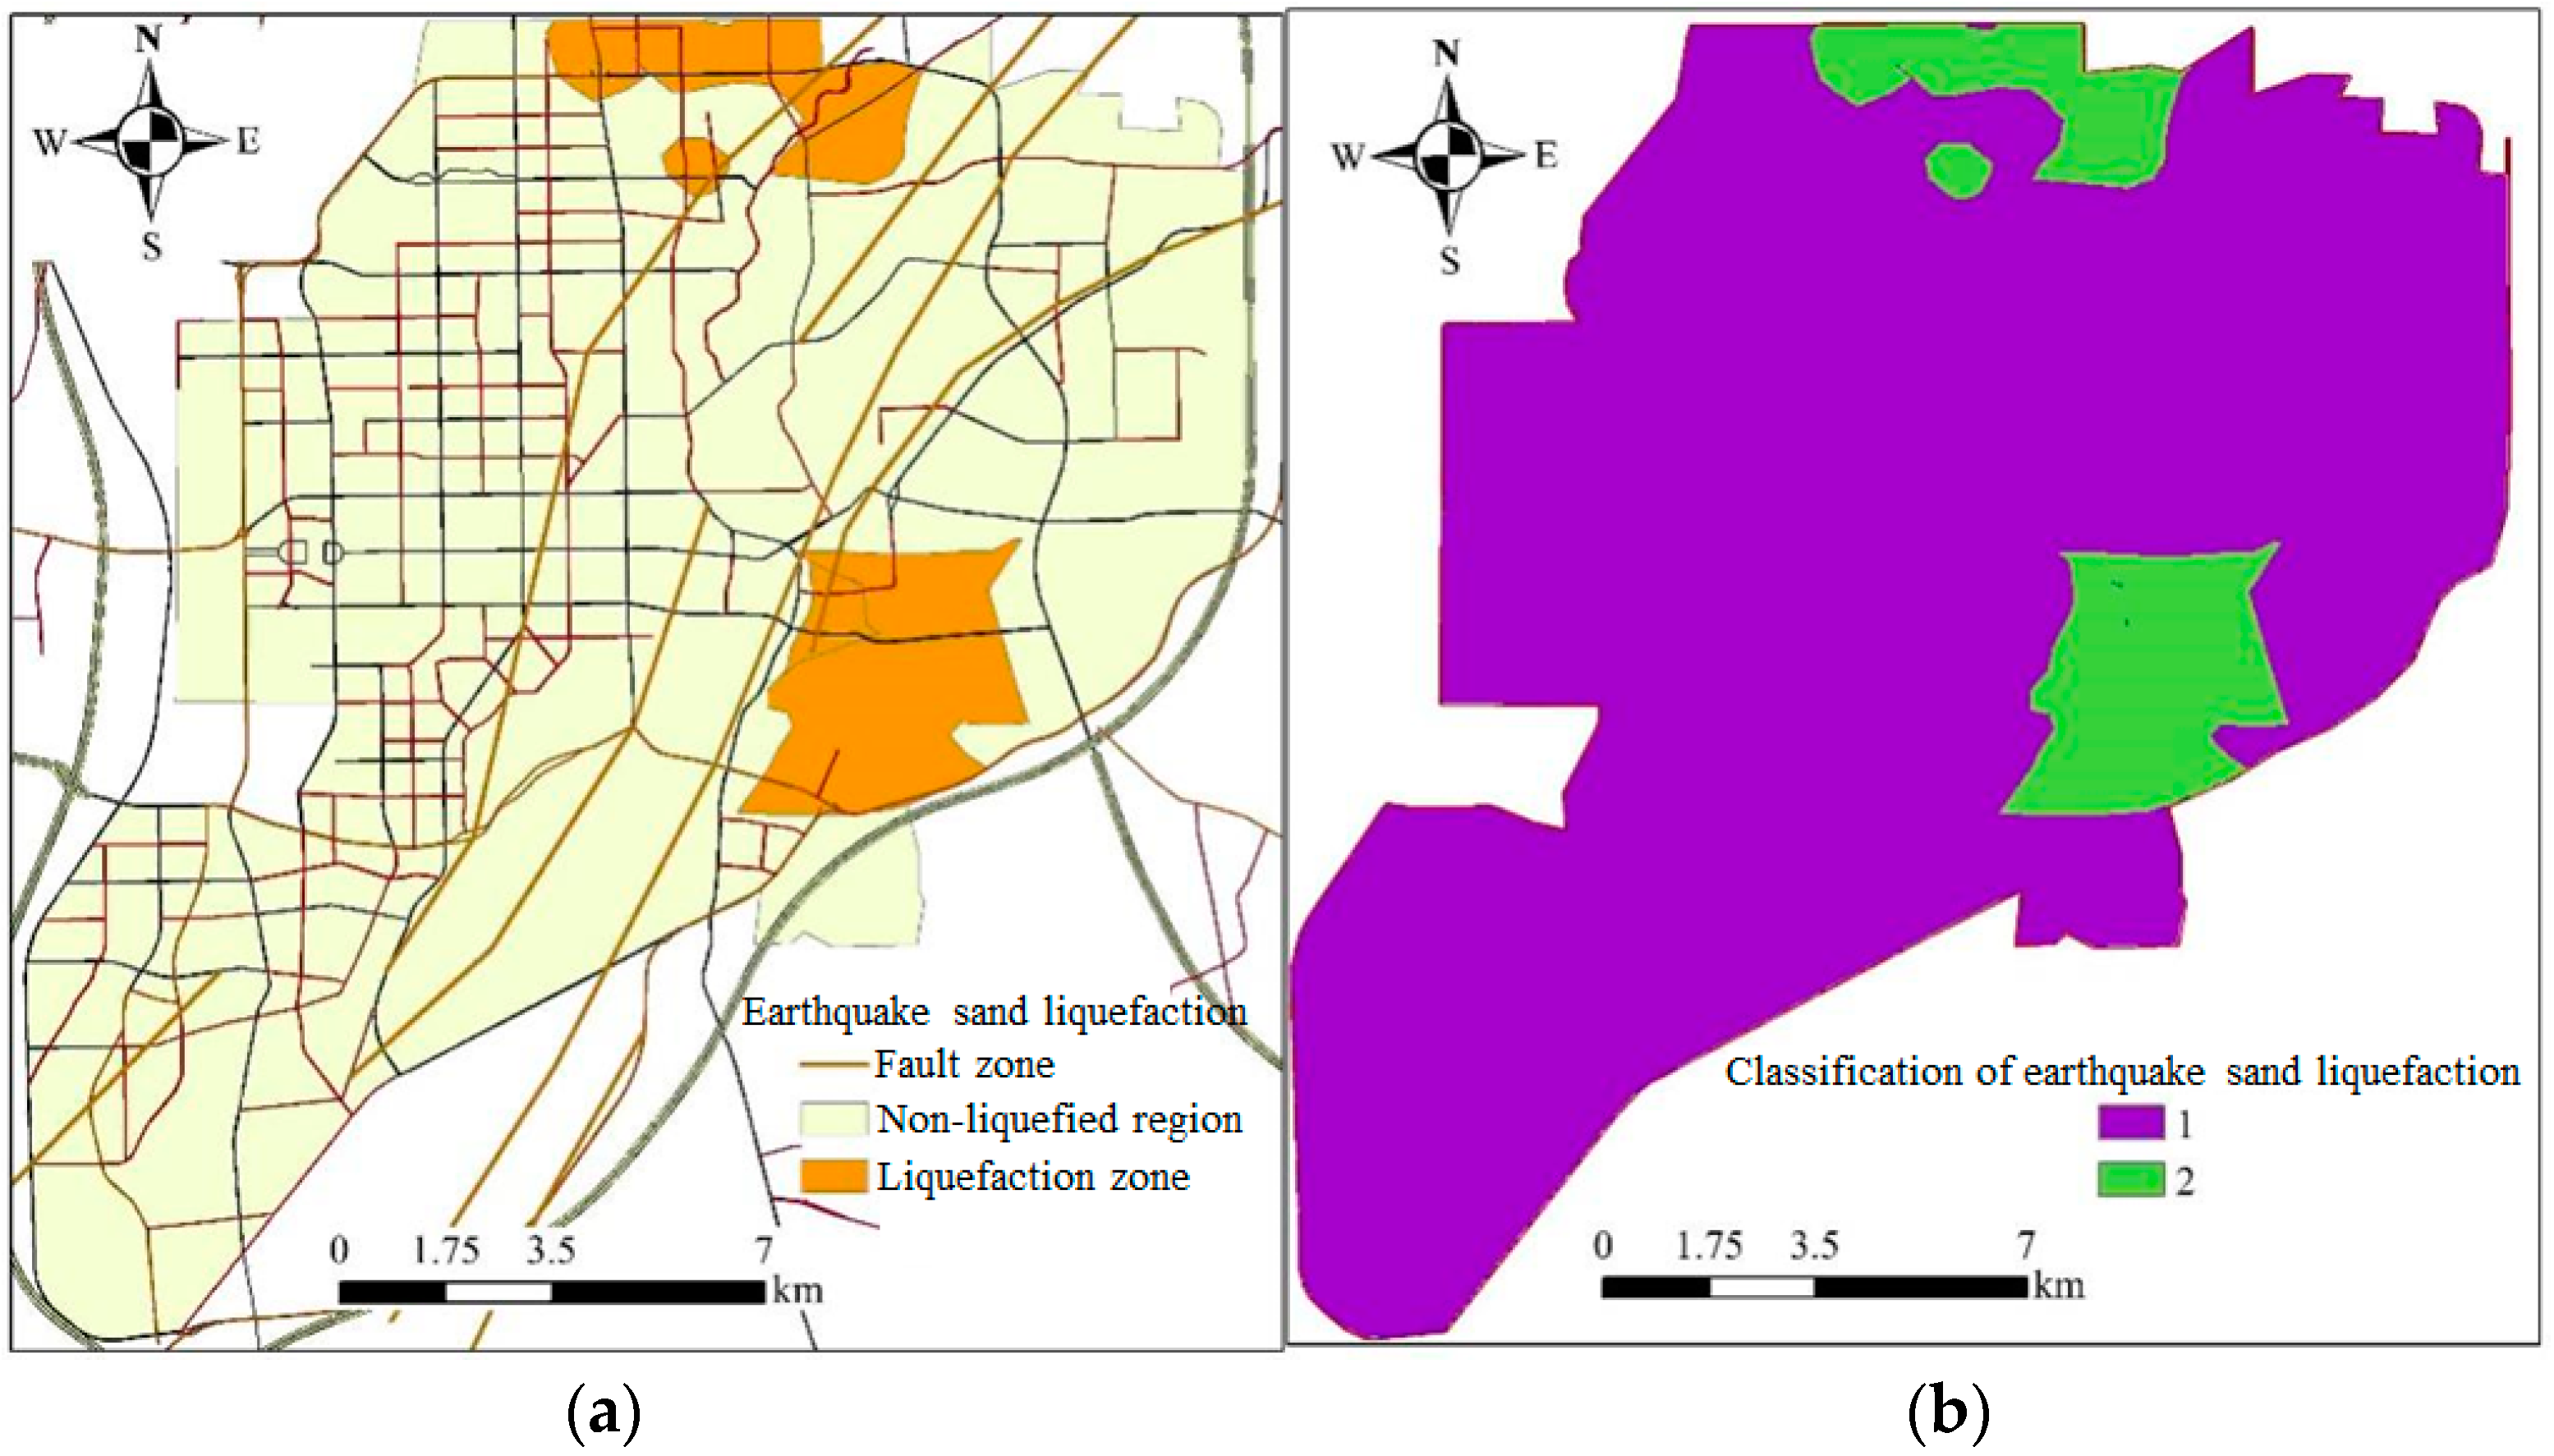
(3) Seismic Soil Liquefaction
The catastrophic Tangshan earthquake of 1976 induced significant liquefaction hazards in various areas, including the Tangshan Plain and Qian’an Basin. Within the study area, two major liquefaction zones were identified: one is situated in the northeastern part, extending from north of Wandaoshan and east of Ligeguancun, along the banks of the Douhe River to Houdouhe Village, with a maximum liquefaction layer thickness of 4 m, and the other is located in the southeastern part of the city, south of Shengli Bridge, with a maximum liquefaction layer thickness of 8 m.
During intense seismic events, sandy soil can lose its load-bearing capacity and self-weight support, leading to foundation subsidence and structural damage. The failure of the foundation due to soil liquefaction can readily trigger ground collapse. Consequently, seismic soil liquefaction was selected as a critical indicator for assessing the ground collapse hazard. The study area was partitioned into liquefaction and non-liquefaction zones and assigned values of 2 and 1, respectively, as depicted in Figure 21.

Figure 21.
Earthquake liquefaction of the study area. (a) Earthquake liquefaction. (b) Classification of Earthquake liquefaction.
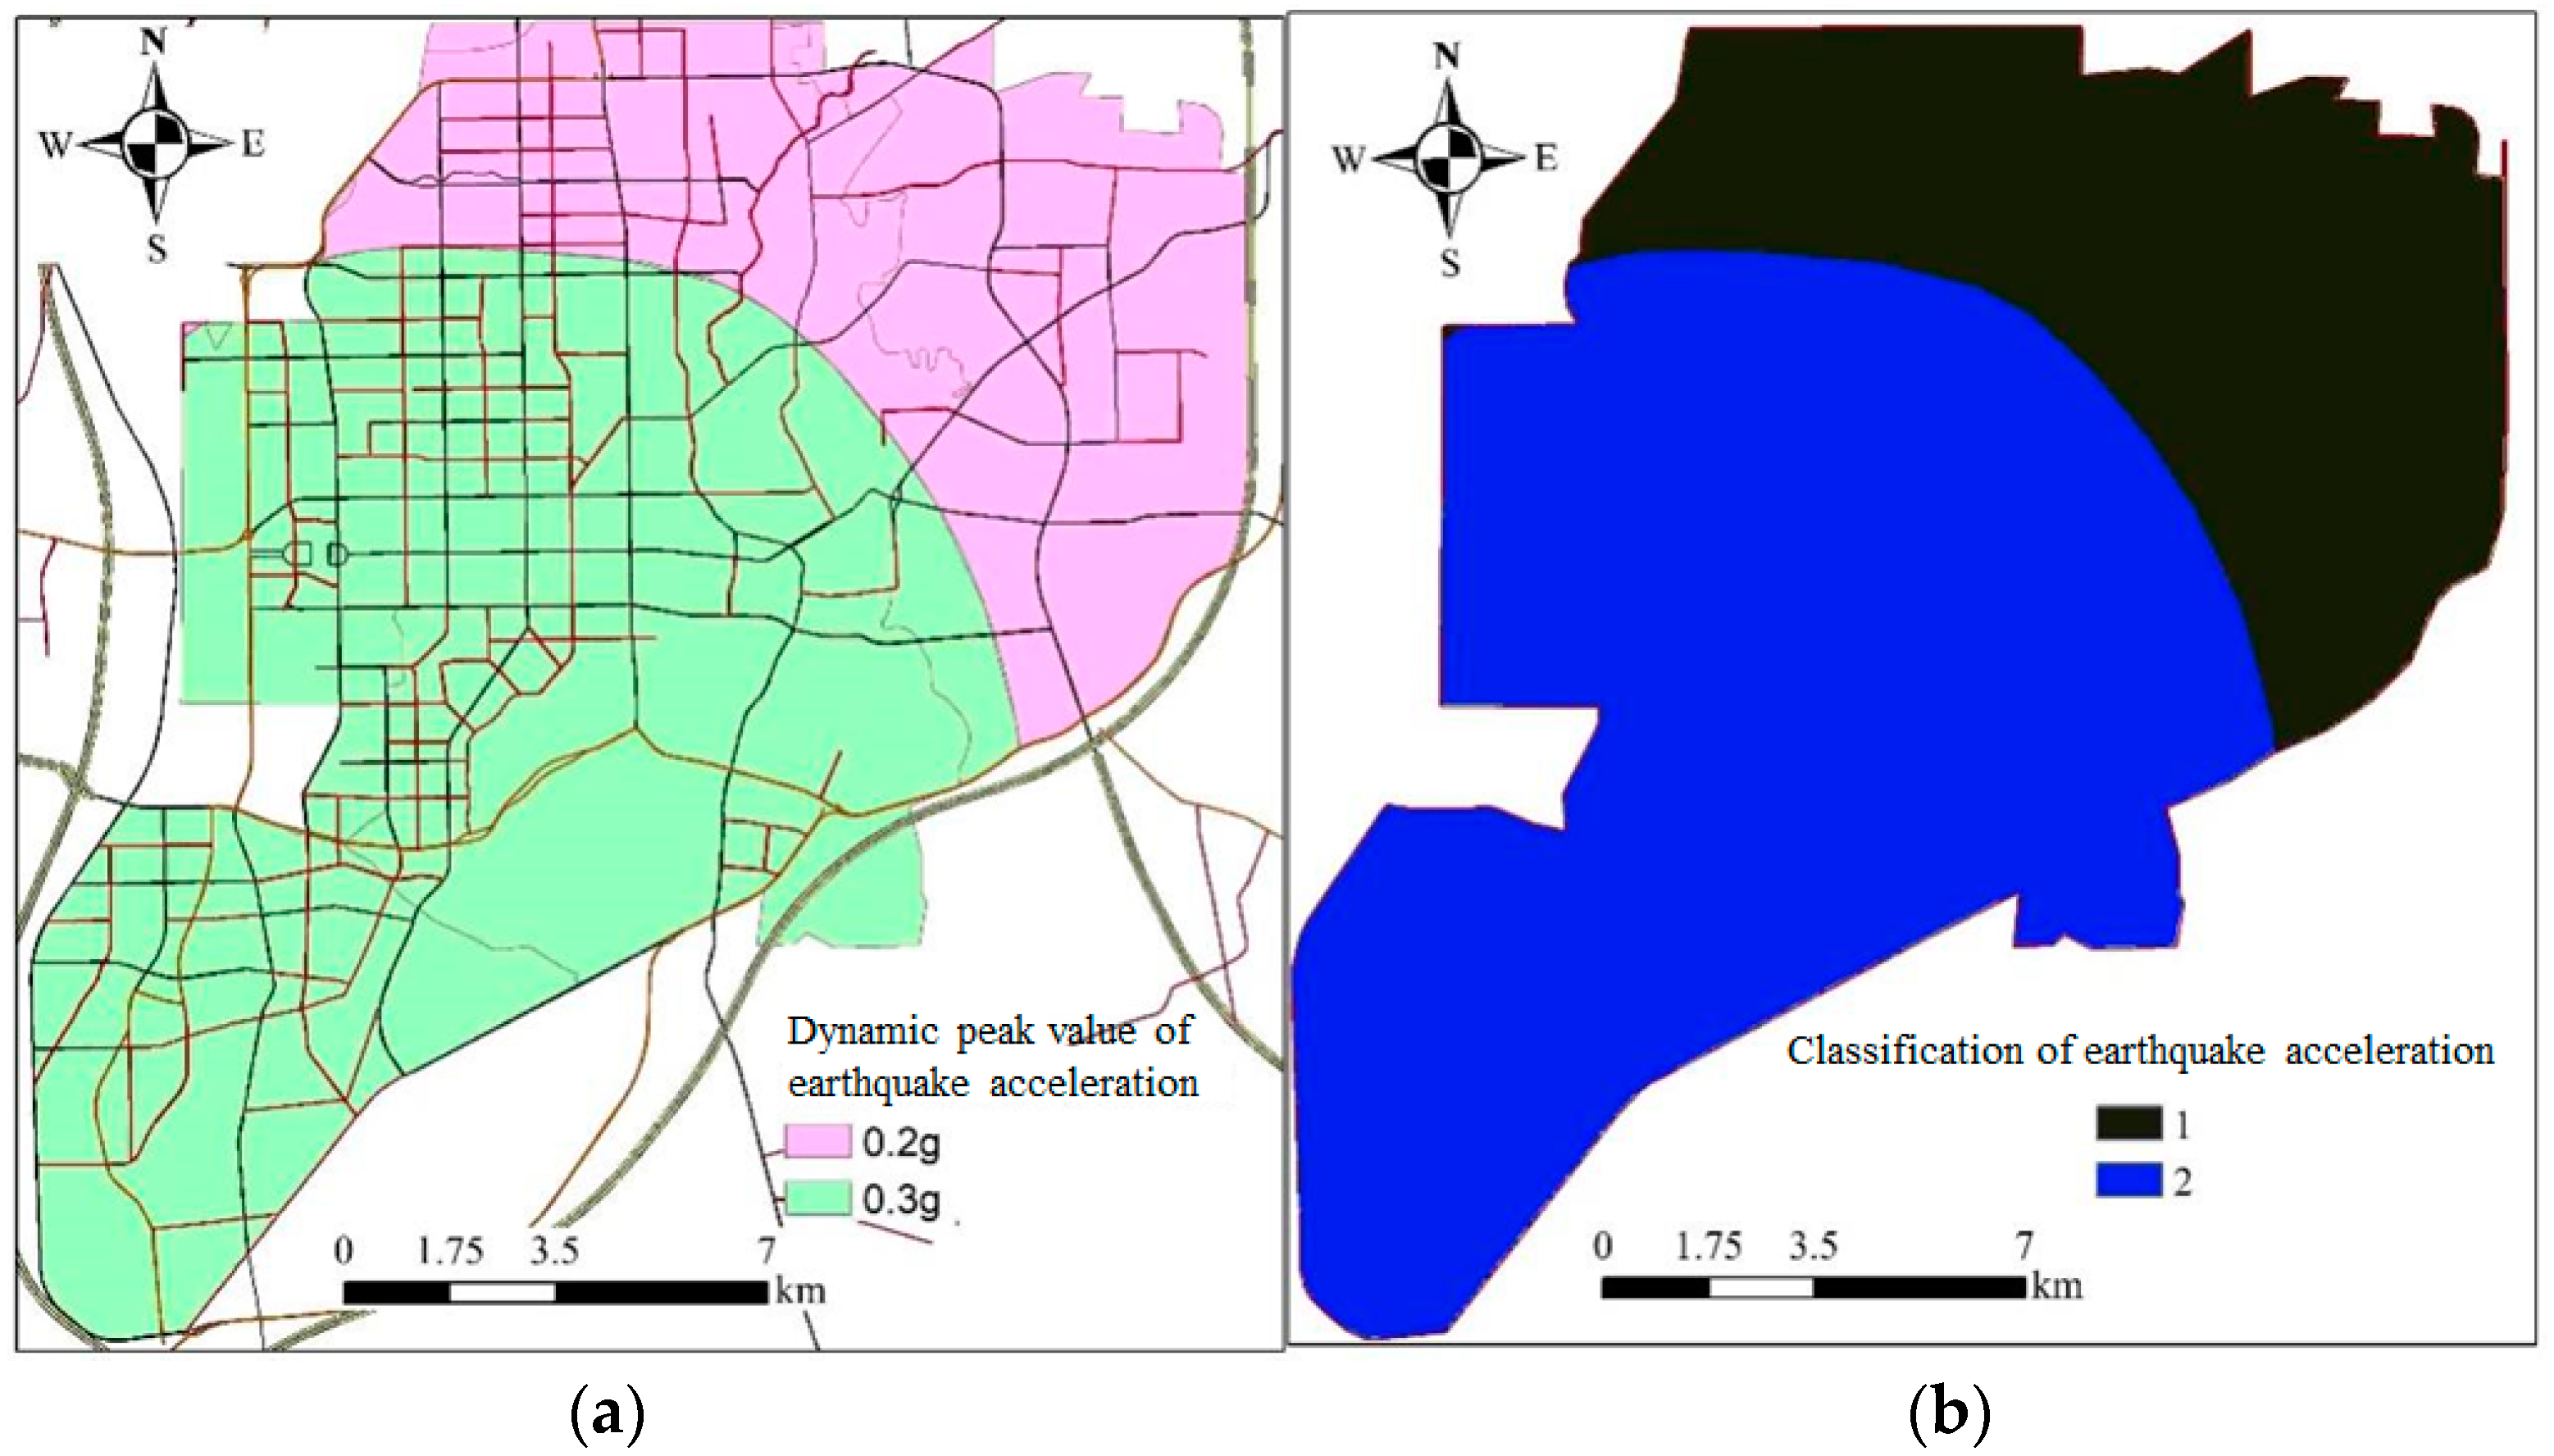
(4) Seismic Peak Ground Acceleration
As per the “Seismic Ground Motion Parameter Zonation Map of China” (GB18306-2015 [36]), the seismic peak ground acceleration in the study area was vectorized. As indicated in Table 13, the seismic peak ground accelerations in the study area are 0.2 g and 0.3 g, signifying an eighth degree of seismic fortification intensity in Tangshan City.
Table 13.
Seismic intensity in China.
In light of the seismic peak ground acceleration in the study area and referencing the Chinese seismic intensity scale, the study area was bifurcated into two levels. The value of 0.2 g was assigned a value of 1, and the value of 0.3 g was assigned a value of 2. The classification map of the study area is presented in Table 14 and Figure 22. Figure 22 reveals that the seismic peak ground acceleration is 0.3 g in the southern part of the study area, while it is 0.2 g in the remaining areas.
Table 14.
Earthquake acceleration values of the study area.
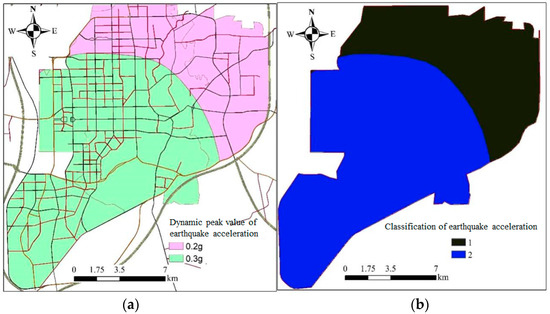
Figure 22.
Earthquake acceleration of the study area. (a) Distribution of earthquake acceleration (b) Classification of earthquake acceleration.
3.2. Evaluation of Ground Subsidence Hazard in the Study Area
3.2.1. Weight Calculation for Evaluation Indicators
Drawing upon the evaluation indicator system for the ground subsidence hazard in the study area and the classification results of each indicator, the analytic hierarchy process–information value evaluation model was employed to compute the information value of individual evaluation factor. Subsequently, the weight of each single factor was ascertained through the amalgamation of the analytic hierarchy process and information value method, culminating in the final evaluation of the hazard in the study area, as delineated in Table 15, Table 16, Table 17, Table 18 and Table 19.
Table 15.
Judgment matrix of criterion layer–target layer.
Table 16.
Judgment matrix of index layer–natural-factor criterion layer.
Table 17.
Judgment matrix of index layer–engineering factor criterion layer.
Table 18.
Judgment matrix of indicator layer–inducing-factor criterion layer.
Table 19.
Weight distribution of evaluation factors.
The consistency requirement is satisfied for all the judgment matrices, as indicated by the matrix calculation results. We know from the matrix calculation results that .
The consistency requirement was satisfied for all the judgment matrices, as indicated by the matrix calculation results. We know from the matrix calculation results that .
The consistency requirement was satisfied for all the judgment matrices, as indicated by the matrix calculation results. We know from the matrix calculation results that .
A visual inspection of these tables reveals that factors such as the underground pipeline leakage, distribution of karst collapse areas, rainfall impact, groundwater level, distribution of mined-out areas, and road load exert substantial influences on the urban ground subsidence hazard within the evaluation indicator system for ground subsidence. Moreover, the influences of the geological structure, seismic liquefaction, seismic acceleration, lithology, road network density, and distance-to-water systems progressively diminish, in that order.
3.2.2. Calculation of Information Value for Single Indicator
Building upon the classification results of the single hazard evaluation factors, the coordinates (longitude and latitude) of the 34 subsidence points within the study area were imported into the ArcGIS platform. The classification intervals of each evaluation factor for the subsidence points were statistically analyzed using the Extract Values to Points tool. The graded values of the 12 influencing indicators were assigned to each subsidence point based on the numerical values of the corresponding raster cells. The information value for each level of the single factors was subsequently obtained, as illustrated in Table 20.
Table 20.
Single-factor information at different levels.
3.2.3. Results of Hazard Evaluation in the Study Area
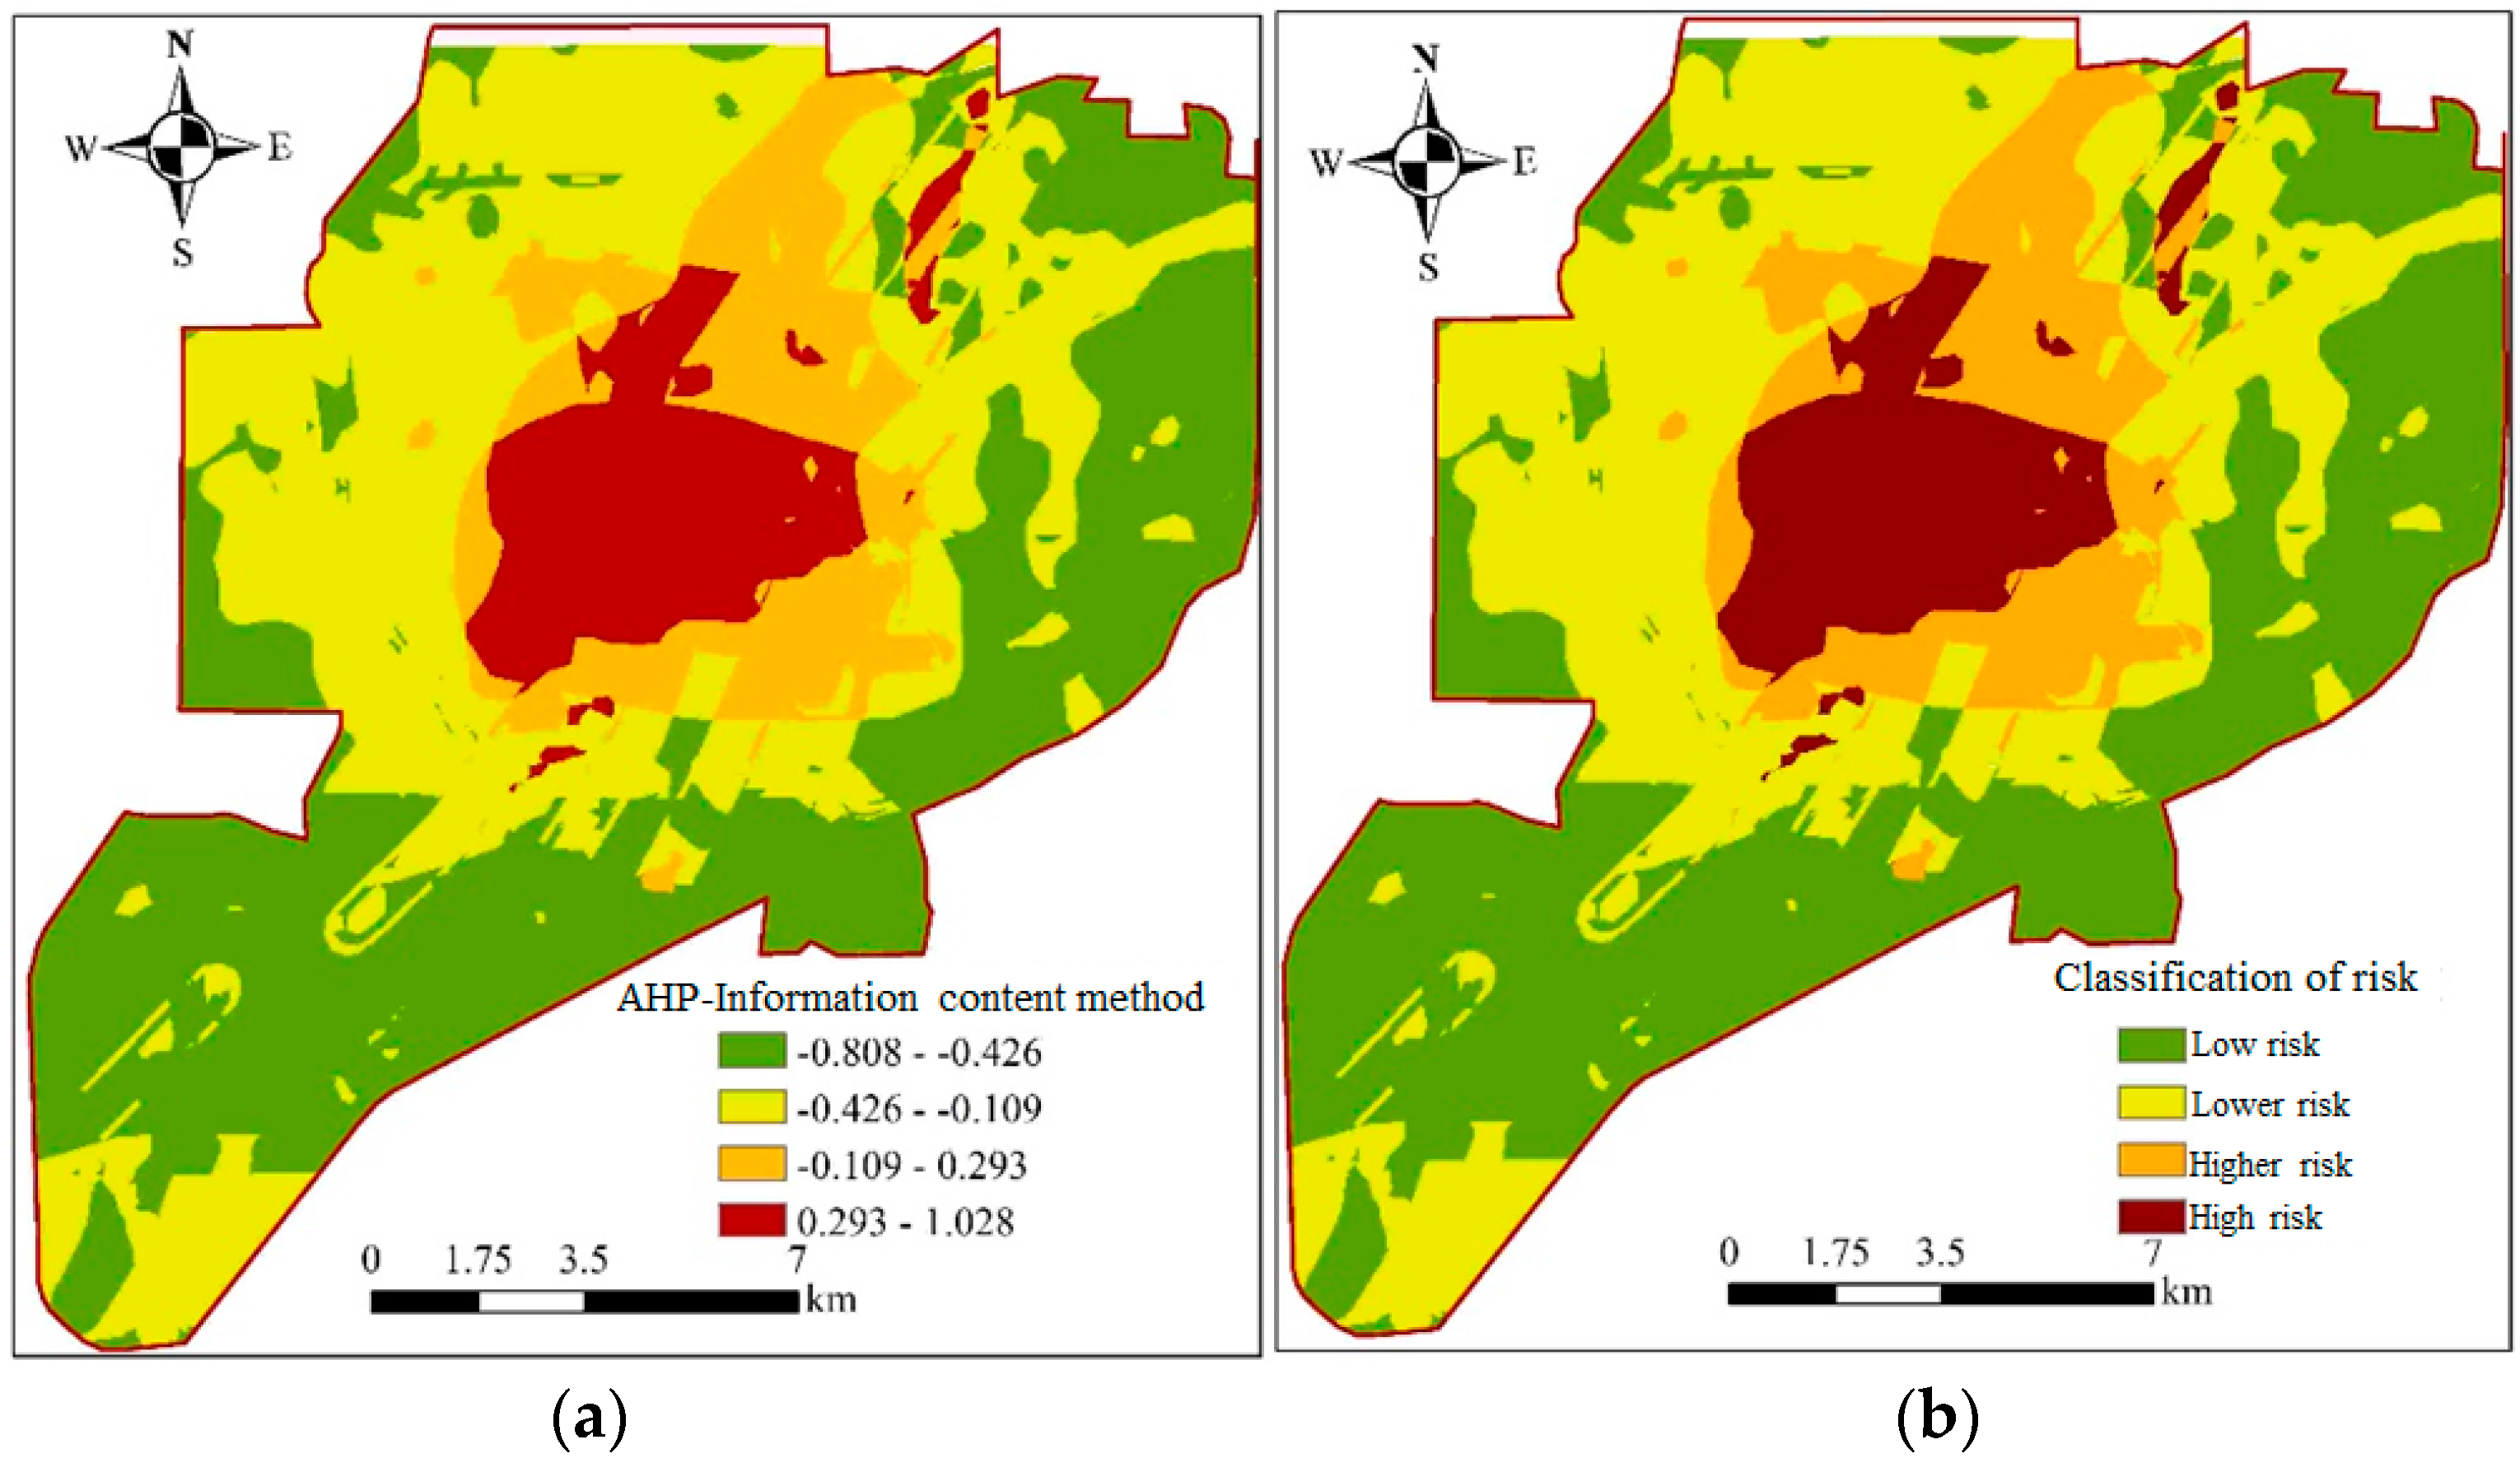
Drawing on the information value results of the individual evaluation factors and the weights derived from the analytic hierarchy process, the total information values for the study area were calculated by multiplying the two. According to the raster calculation results in ArcGIS, the comprehensive information values range from −0.808 to 1.028. The natural break method was employed to divide the total information values into four classes, as delineated in Table 21.
Table 21.
Zoning standards for ground collapse risk.
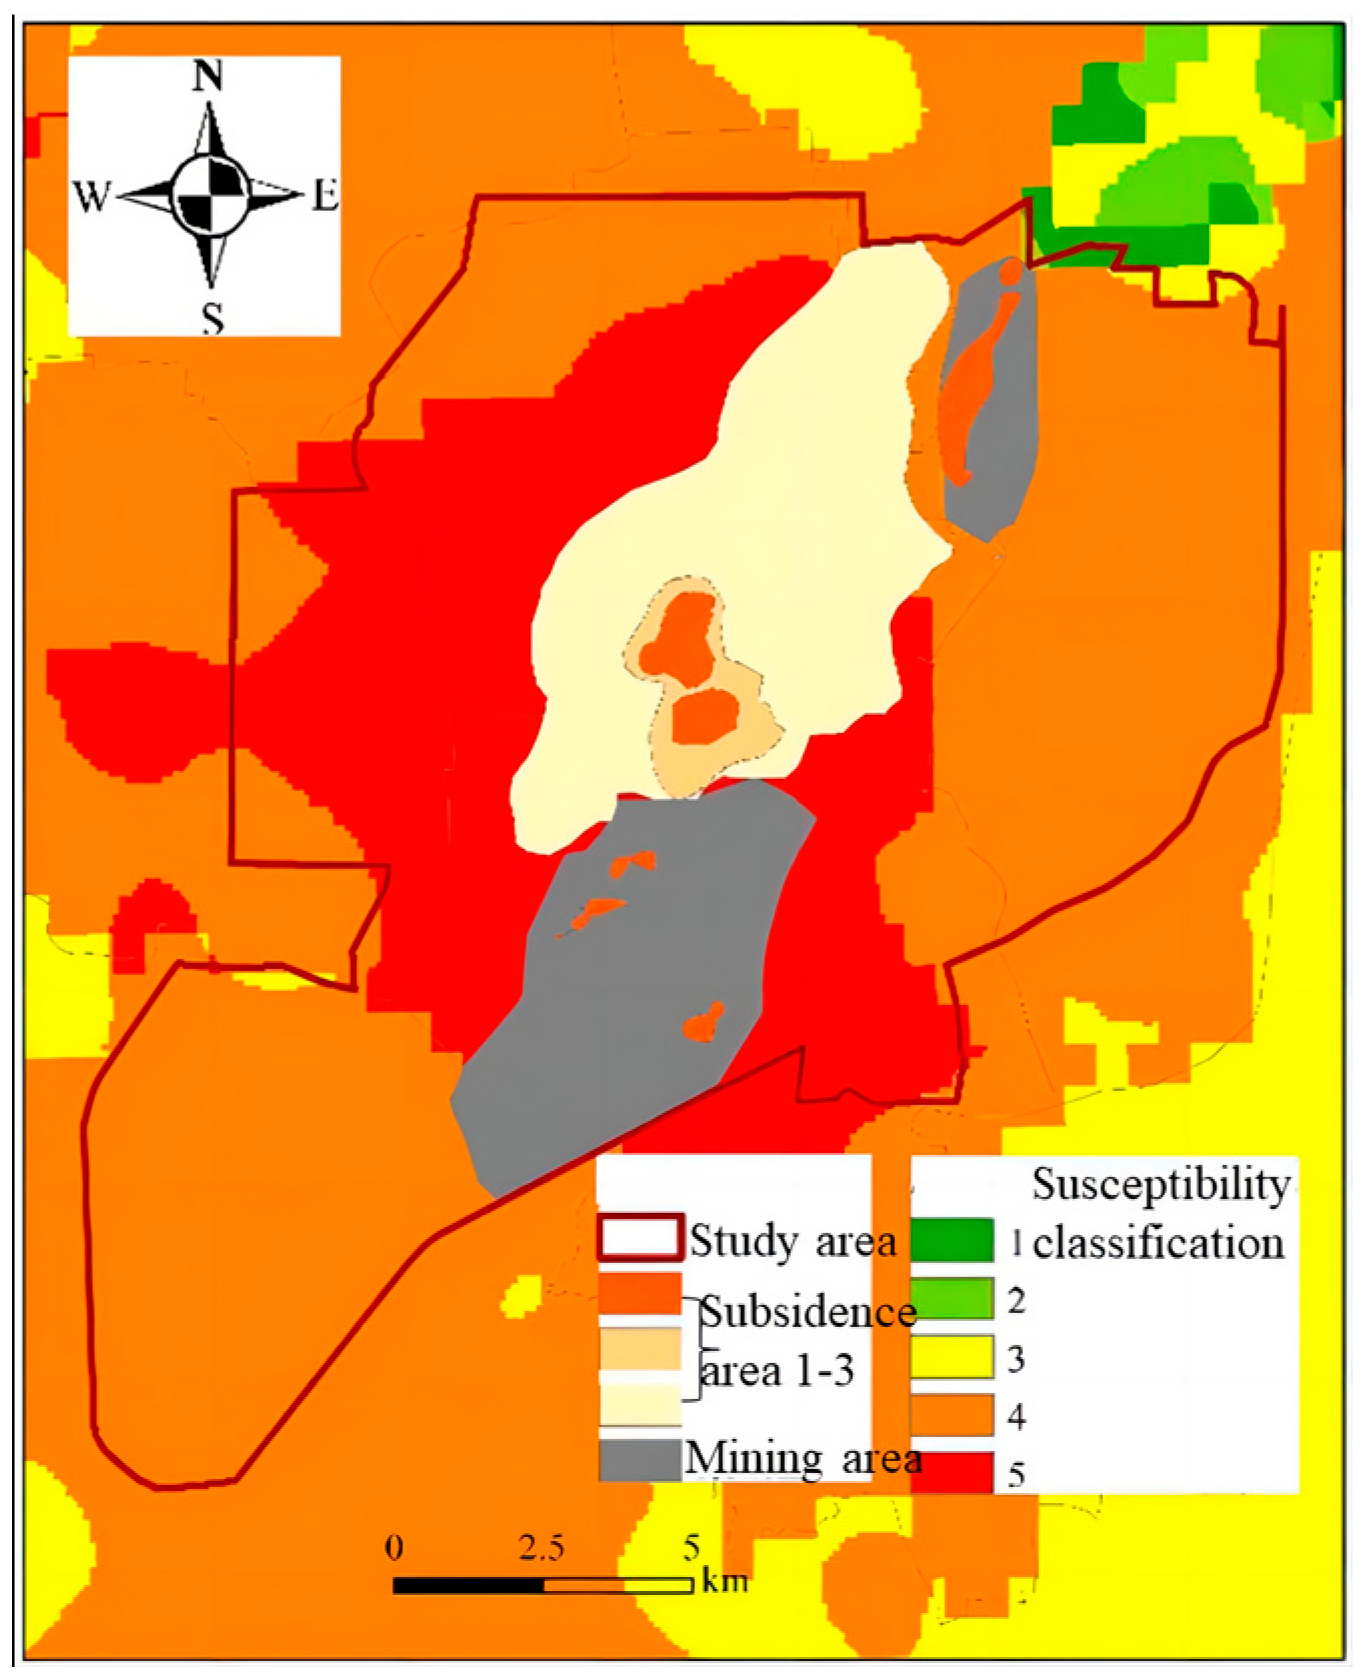
The evaluation results of the ground subsidence hazard in the study area are presented in Figure 23. The central part of the study area exhibits the highest hazard of ground subsidence, which aligns with the occurrence of numerous historical ground subsidence incidents in this region. This can be attributed to a confluence of factors, including severe underground pipeline leakage, karst development, and high traffic volumes on major roads, leading to significant road loads. Conversely, the southern and northeastern parts of the study area exhibit lower hazards of ground subsidence, indicating relatively safer conditions in these areas.
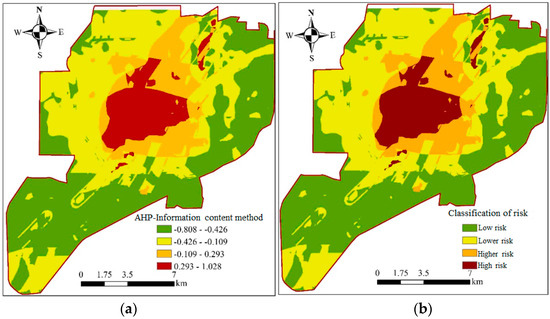
Figure 23.
Total information value of the study area. (a) Classification of total information. (b) Hazard level.
4. Conclusions
The results obtained in this study are as follows:
- (1)
- Utilizing ArcGIS, a susceptibility zoning map of Tangshan City was generated by analyzing six key factors: the lithology, rainfall, population density, road network density, seismic acceleration, and river network density. A single-factor analysis was conducted, followed by spatial-overlay processing using ArcGIS to assign values and to classify each factor. The study area was determined based on the susceptibility zoning results, in conjunction with the distribution of historical subsidence areas and goaf areas in Tangshan City.
- (2)
- The indicator system for evaluating the ground subsidence hazard encompasses three levels: the evaluation objective, evaluation criteria, and evaluation indicators. The evaluation objective is the assessment of the urban ground subsidence hazard. The evaluation criteria are divided into three categories: natural factors, engineering factors, and triggering factors. The natural factors include the lithology, quaternary groundwater, geological faults, and distance-to-water systems. The engineering factors encompass the road loads, distribution of subsidence areas, distribution of goaf areas, and road network density. The triggering factors involve the rainfall, underground pipeline leakage, seismic liquefaction, and seismic acceleration. These twelve indicators constitute the evaluation indicator level.
- (3)
- The evaluation model for the ground subsidence hazard employed the analytic hierarchy process (AHP) in conjunction with the information value evaluation model. The AHP was utilized to determine the weights of individual hazard evaluation indicators, and the information value of each indicator was calculated. The products of the weights and information values were summed to obtain the total information value for the study area. The study area was subsequently classified into four levels of risk: high, moderate, relatively low, and low.
5. Discussion
This study provides a comprehensive evaluation of the ground subsidence hazard in the study area, and the findings demonstrate the scientific validity, rationality, and practical applicability of the vulnerability zoning research and risk assessment method for addressing ground subsidence in Tangshan City. This study makes up for the shortcomings of previous studies and contributes to the understanding and management of the ground subsidence risk, providing a robust framework for urban planning and disaster mitigation.
Author Contributions
Conceptualization, M.B. and L.S.; Methodology, Y.Q., M.B., L.S. and G.T.; Software, L.S.; Validation, Y.Q., M.B. and Q.W.; Formal analysis, L.S.; Investigation, Y.Q., Q.W., G.T. and C.W.; Data curation, Y.Q. and L.S.; Writing—original draft, Y.Q., Q.W. and G.T.; Writing—review & editing, Y.Q. and C.W.; Visualization, Y.Q., Q.W. and G.T.; Supervision, M.B., Q.W. and G.T.; Project administration, M.B.; Funding acquisition, M.B. All authors have read and agreed to the published version of the manuscript.
Funding
This research was funded by the Key Research and Development Project of Science and technology Department of Hebei Province (grant 21375408D) and the National Natural Science Foundation of China (NSFC) (42172311).
Institutional Review Board Statement
Not applicable.
Informed Consent Statement
Not applicable.
Data Availability Statement
The data presented in this study are available on request from the corresponding author. The data are not publicly available due to privacy.
Conflicts of Interest
Author Linlin Song was employed by the company Henan Intercity Railway Co., Ltd. Author Gang Tian was employed by the company C+E Center for Engineering Research Test and Appraisal Co., Ltd. The remaining authors declare that the research was conducted in the absence of any commercial or financial relationships that could be construed as a potential conflict of interest.
References
- Mejía-Navarro, M.; Garcia, L.A. Natural Hazard and Risk Assessment Using Decision Support Systems, Application: Glenwood Springs, Colorado. Environ. Eng. Geosci. 1996, 2, 299–324. [Google Scholar] [CrossRef]
- Xiang, X.; Huang, R. Application of Artificial Neural Network Model Based on GIS in Geological Hazard Zonation. J. Geol. Hazards Environ. Preserv. 2000, 33, 26–30. [Google Scholar]
- Zhu, L.; Wu, X.; Yin, K.; Liu, X. Research on Landslide Hazard Risk Zoning in China based on Information Value Model. J. Earth Sci. Environ. 2004, 03, 52–56. [Google Scholar]
- Guang, L. Application of Information Value Method based on GIS in Landslide Hazard Assessment. Geol. Resour. 2005, 03, 231–233. [Google Scholar]
- Wu, C.; Qiao, J. Influence of Stratigraphic Factors on Landslide Development in Three Gorges Reservoir Area based on GIS and Information Value Model. J. Beijing For. Univ. 2007, 06, 138–142. [Google Scholar]
- Zhang, X.; Li, R. Study on Geological Hazard Susceptibility Zoning of Wushan County, Gansu Province based on Analytic Hierarchy Process and GIS. Gansu Geol. 2012, 21, 70–78. [Google Scholar]
- Wei, F. Analysis of Karst Collapse Mechanism in Tangshan City. Geol. Explor. 2006, 42, 86–89. [Google Scholar]
- Liu, F.; Zhang, H.; Zou, J.; Tang, Y. Study on Road Subsidence in Tangshan City. J. Hebei Univ. Technol. Nat. Sci. Ed. 2007, 3, 130–132. [Google Scholar]
- Ruan, S.; Huang, R. Application of Information Value Method based on GIS in Geological Hazard Zonation. J. Chengdu Univ. Technol. 2001, 28, 89–92. [Google Scholar]
- Xu, C.; Dai, F.; Yao, X.; Chen, J.; Tu, X.; Sun, Y.; Wang, Z. Landslide Susceptibility Evaluation in Wenchuan Earthquake Region based on AHP and GIS. Chin. J. Rock Mech. Eng. 2009, 28, 3978–3985. [Google Scholar]
- Xu, C.; Dai, F.; Yao, X.; Yao, X.; Zhao, Z. Landslide Susceptibility Evaluation in Wenchuan Earthquake Region based on GIS and Deterministic Coefficient Analysis Method. J. Eng. Geol. 2010, 18, 15–26. [Google Scholar]
- Hossein, R.; Sohrab, M. Seismic and Geotechnical Study of Land Subsidence and Vulnerability of Rural Buildings. Int. J. Geosci. 2012, 3, 23254. [Google Scholar]
- Wang, H. Study on Ground Subsidence Risk Assessment in Shulan City. Master’s Thesis, Jilin University, Changchun, China, 2017. [Google Scholar]
- Shi, M.; Gong, H.L.; Gao, M.L.; Chen, B.; Zhang, S.; Zhou, C. Recent Ground Subsidence in the North China Plain, China, Revealed by Sentinel-1A Datasets. Remote Sens. 2020, 12, 3579. [Google Scholar] [CrossRef]
- Ezquerro, P.; Del Soldato, M.; Solari, L.; Tomás, R.; Raspini, F.; Ceccatelli, M.; Fernández-Merodo, J.A.; Casagli, N.; Herrera, G. Vulnerability Assessment of Buildings due to Land Subsidence Using InSAR Data in the Ancient Historical City of Pistoia (Italy). Sensors 2020, 20, 2749. [Google Scholar] [CrossRef] [PubMed]
- Hussain, M.A.; Chen, Z.; Shoaib, M.; Shah, S.U.; Khan, J.; Ying, Z. Sentinel-1A for monitoring land subsidence of coastal city of Pakistan using Persistent Scatterers In-SAR technique. Sci. Rep. 2022, 12, 5294. [Google Scholar] [CrossRef] [PubMed]
- Lei, M.; Jiang, X.; Li, Y. Application of Geographic Information System (GIS) in Karst Collapse Evaluation. Carsologica Sin. 1994, 13, 351–356. [Google Scholar]
- Hu, B.B.; Zhou, J.; Wang, J.; Chen, Z.; Wang, D.; Xu, S. Risk assessment of land subsidence at Tianjin coastal area in China. Environ. Earth Sci. 2009, 59, 269–276. [Google Scholar] [CrossRef]
- Zhang, H.; Liu, F. Research on Road Subsidence Evaluation System based on GIS. J. Hebei Univ. Technol. Nat. Sci. Ed. 2011, 33, 130–135. [Google Scholar]
- Sharma, L.P.; Patel, N.; Debnath, P.; Ghose, M.K. Assessing landslide vulnerability from soil characteristics—A GIS-based analysis. Arab. J. Geosci. 2010, 5, 1–8. [Google Scholar] [CrossRef]
- Jin, Y.; Tan, S.; Hu, X.; Jiang, S.; Feng, L. Evaluation of Geological Hazard Susceptibility Zoning based on Analytic Hierarchy Process and GIS: A Case Study of Shizong County, Yunnan Province. Trop. Geogr. 2012, 32, 173.14–178.14. [Google Scholar]
- Mao, W.; Chen, H.; Ruheiyan, M.; Qiang, H. Research on Ground Subsidence Hazard Evaluation in Mining Area based on GIS. Land Nat. Resour. Res. 2014, 03, 52–53. [Google Scholar]
- Li, F.W.; Zhao, Y.; Feng, P.; Zhang, W.; Qiao, J. Risk Assessment of Groundwater and its Application. Part I: Risk Grading Based on the Functional Zoning of Groundwater. Water Resour. Manag. 2015, 29, 2697–2714. [Google Scholar] [CrossRef]
- Li, F.W.; Qiao, J.L.; Zhao, Y.; Zhang, W. Risk Assessment of Groundwater and its Application. Part II: Using a Groundwater Risk Maps to Determine Control Levels of the Groundwater. Water Resour. Manag. 2014, 28, 4875–4893. [Google Scholar] [CrossRef]
- Zhou, Q. Prediction and Evaluation of Karst Subsidence Hazard based on GIS and Analytic Hierarchy Process. J. Kaili Univ. 2016, 34, 108–110. [Google Scholar]
- Richa, B.; Akihiko, K. Risk Assessment of Land Subsidence in Kathmandu Valley, Nepal, Using Remote Sensing and GIS. Adv. Remote Sens. 2017, 6, 132. [Google Scholar]
- Tu, J.; Liu, C.; Jiang, C.; Zheng, X.; Xiong, Z.; Liao, M.; Li, H. Vulnerability Evaluation of Karst Collapse in Wuhan, Hubei Province. J. Geol. Hazards Environ. Preserv. 2020, 31, 94–99. [Google Scholar]
- Bu, M. Stability and Geological Hazard Risk Assessment of Subsidence Area based on GIS. Master’s Thesis, China University of Mining and Technology, Beijing, China, 2020. [Google Scholar]
- Dong, P.; Cai, Y.; Yang, J.; Li, Y. Evaluation of Karst Collapse Hazard: A Case Study of Jiaobai Village, Dushan County. Guizhou Geol. 2021, 38, 437–442. [Google Scholar]
- Xu, X.; Chen, B. Application Research on Risk Assessment Method of Urban Road Cavity Hazard. Munic. Eng. Technol. 2021, 39, 149–154, 172. [Google Scholar]
- Wu, Y.; Liu, Z.; Yin, R.; Lei, M.; Dai, J.; Luo, W.; Pan, Z. Susceptibility Evaluation of Karst Collapse in Huaihua Area of Hunan Province based on AHP and GIS Technology. Carsologica Sin. 2022, 41, 21–33. [Google Scholar]
- Zhou, Z.; Shi, H.; Dong, Y.; Fan, W. Study on Risk Assessment of Urban Road Subsidence based on AHP-Entropy Weight and Cloud Model. J. Saf. Environ. 2023, 23, 1–11. [Google Scholar]
- Garg, S.; Motagh, M.; Jayaluxmi, I.; Karanam, V.; Selvakumaran, S.; Marinoni, A. Assessment of Land Subsidence Hazard, Vulnerability and Risk: A case study for National Capital Region in India. In Proceedings of the EGU General Assembly 2022, Vienna, Austria, 23–27 May 2022; EGU22-12646. [Google Scholar]
- Zhang, Q.; Shan, Q.; Chen, F.W.; Liu, J.; Yuan, Y. Groundwater Vulnerability Assessment and Protection Strategy in the Coastal Area of China: A GIS-Based DRASTIC Model Approach. Appl. Sci. 2023, 13, 10781. [Google Scholar] [CrossRef]
- Sadeghi, H.; Darzi, A.G.; Voosoghi, B.; Garakani, A.A.; Ghorbani, Z.; Mojtahedi, S.F.F. Assessing the vulnerability of Iran to subsidence hazard using a hierarchical FUCOM-GIS framework. Remote Sens. Appl. Soc. Environ. 2023, 31, 100989. [Google Scholar] [CrossRef]
- GB18306-2015; Seismic ground motion parameters zonation map of China. Standardization Administration of China: Beijing, China, 2015.


Disclaimer/Publisher’s Note: The statements, opinions and data contained in all publications are solely those of the individual author(s) and contributor(s) and not of MDPI and/or the editor(s). MDPI and/or the editor(s) disclaim responsibility for any injury to people or property resulting from any ideas, methods, instructions or products referred to in the content. |
© 2023 by the authors. Licensee MDPI, Basel, Switzerland. This article is an open access article distributed under the terms and conditions of the Creative Commons Attribution (CC BY) license (https://creativecommons.org/licenses/by/4.0/).