Article

Experimental Study on Dynamic Exhaust Law for Ventilation System of Gas Tunnel

1
School of Materials and Chemical Engineering, Ningbo University of Technology, Ningbo 315211, China
2
Zhejiang Institute of Tianjin University, Ningbo 315201, China
3
Key Laboratory of Vehicle Advanced Manufacturing, Measuring and Control Technology (Ministry of Education), Beijing Jiaotong University, Beijing 100044, China
*
Author to whom correspondence should be addressed.
Appl. Sci. 2023, 13(23), 12783; https://doi.org/10.3390/app132312783
Submission received: 19 October 2023 / Revised: 23 November 2023 / Accepted: 27 November 2023 / Published: 28 November 2023
(This article belongs to the Section Civil Engineering)

Abstract

:
The ventilation system is the only channel for gas exchange inside and outside the gas tunnel, which determines whether the high-risk gas in the tunnel can be exhausted in time after a gas leakage accident; thus, it is essential to study the dynamic ventilation characteristics. A fire-retarding division of the gas tunnel in Songjiang District of Shanghai is taken as the study object, and, based on the similarity theory, a similarity experiment platform is built. The simulation experiments of exhaust are carried out under different exhaust velocities, ventilation equivalent diameters and initial gas concentrations by using the control variable method. The changes in ventilation duration and gas concentration are analyzed in detail. The conclusions are as follows: (1) Time–concentration curves at all positions in the gas tunnel exhibit an “asymptote” distribution. (2) Average gas concentration has a linear relationship with time at the beginning and becomes an exponential relationship after a certain time. (3) When the exhaust velocity is 5 m/s, the initial gas concentration is 15%VOL; when the equivalent diameter of the vent in the model is 0.2 m, the ventilation duration is 100.2 s. A calculation model of ventilation duration for the standard gas tunnel is established, and the application limits of the model are 1 ≤ v ≤ 5, 0.5 ≤ d ≤ 1.5, and 5 ≤ φ o ≤ 25. (4) In practical engineering, an exhaust velocity of 5 m/s and an equivalent ventilation diameter of 1 m are relatively optimal ventilation parameters.

1. Introduction

The underground utility tunnel is a symbol of urban modernization and intelligence; therefore, the Chinese government is vigorously promoting the construction of utility tunnels [1,2]. As a new type of underground space structure, the research on various problems in the utility tunnel has gradually seen a new upsurge, and the gas tunnel, as the high-risk part of the utility tunnel [3], is the focus of attention. Due to the flammable and explosive characteristics of natural gas, the establishment of gas tunnels has been controversial all over the world [4,5]. If a leakage accident occurs in the gas tunnel, i.e., an urban underground closed structure, the consequences are very serious [6,7,8]. As the only channel for gas exchange inside and outside the gas tunnel, the ventilation system is the key to avoid accidents under abnormal conditions [9,10,11].
The gas tunnel is a long and narrow underground structure, which is divided into several fire-retarding divisions in the design. The ventilation system of each division is relatively independent, which makes its ventilation mode different from that in mines and other forms of tunnels [12,13,14,15,16,17,18,19,20,21]. The study of ventilation and exhaust in the actual gas tunnel project is destructive, dangerous and difficult to implement. Therefore, simulations [22] and similar experiments [23] are common research methods. In their numerical simulations, Yoo et al. [24] obtained the relationship between the convection heat exchange coefficient, internal temperature, cross-section wind velocity and wall temperature through CFD simulations, and calculated the limit length for fire-retarding division of gas tunnel under different working conditions. Lu et al. [25] established a gas leakage model and fan model in the gas tunnel based on CFD simulation theory and studied the gas leakage diffusion law and ventilation scheme under different accident conditions. Zhang and Zhao [26] studied the fire characteristics of the gas tunnel under different ventilation modes through numerical simulations and analyzed the relationship between the distribution of temperature and smoke and the ventilation mode. Zhang et al. [27] used simulation methods to simulate forced ventilation, free ventilation and mixed ventilation in gas tunnels, obtained the distribution laws of airflow velocity and gas concentration under these three ventilation modes and determined the ventilation system with the best effect.
The numerical simulation models are assumed and simplified, and their feasibility and correctness need to be verified by engineering or experiments. The ventilation similarity experiment of gas tunnels based on similarity theory can avoid this problem effectively. Vauquelin and Mégret [28] conducted ventilation experiments on a 1:20 scale gas tunnel model and studied the influence of the position and shape of the vent on the smoke removal effect. Ingason and Li [29] carried out longitudinal ventilation experiments under different fire conditions using a gas tunnel model with a similarity ratio of 1:23 and studied the correlation between heat release rate, flame growth rate, maximum gas temperature, temperature distribution, total wall heat flux and ventilation system. Zhao et al. [30] used the reduced-scale model to test the temperature distribution on the longitudinal section and cross-section of the gas tunnel after a fire and obtained the influence of ventilation parameters on the layout of temperature sensors and smoke sensors. Li et al. [31] established a reduced-scale experimental platform for the gas tunnel according to the similarity ratio of 1:5 and tested the resistance characteristics of the ventilation system under different pipeline layout conditions.
The above research on ventilation system of gas tunnel mainly focuses on the design of the ventilation method and the ventilation effect in the case of an accident. Because most gas tunnels are in the trial operation stage, the applicability evaluation of ventilation parameters and ventilation methods has not yet been carried out [32]. In addition, the ventilation system is just a copy of the design specifications, and the scientificity and regularity of ventilation and exhaust have not yet been explored [33,34].
As the main ventilation parameters in the ventilation system, the exhaust velocity of the fan and the equivalent diameter of the vent are the main factors affecting the exhaust efficiency of the gas tunnel, and the initial gas concentration has a certain impact on the ventilation duration. Therefore, this paper uses similarity experiments to study the change rule of gas concentration with time in the ventilation process of gas tunnel, then to find out the quantitative relationships between concentration variation, ventilation duration, exhaust velocity, ventilation size and initial gas concentration, finally revealing the dynamic ventilation characteristics of gas tunnels and providing a theoretical optimization basis for the design of fire-retarding division and the selection of ventilation parameters.

2. Similarity Principle

2.1. Study Object

A fire-retarding division of the gas tunnel in Songjiang District of Shanghai City is taken as the study object, and its schematic diagram is shown in Figure 1. The gas tunnel in Songjiang District of Shanghai City is quite representative in China, and it is built in strict accordance with the standard GB 50838-2015 “Technical code for urban utility tunnel engineering” [35]. The fire-retarding division is a cuboid, with a height of 3.8 m, a width of 2 m and a length of 200 m. In case of a leakage accident, the fire barrier will automatically isolate to form an independent closed space. The ventilation inlet and ventilation outlet with the same dimension (1 m × 1 m × 2 m) are set at both ends of the fire-retarding division. The ventilation system has a natural supply air and a mechanical exhaust air mode. A pipeline with a nominal diameter of 400 mm and a nominal wall thickness of 8 mm is laid in the gas tunnel. The pipeline is fixed with concrete supports, and the length, width and height of the concrete supports are all 0.5 m. The spacing between each pair of concrete supports is 20 m, and there are a total of 20 concrete supports in a fire-retarding division. According to the engineering acceptance data, the tunnel enclosure is made of cement concrete material, with a roughness of 500 μm.

2.2. Similarity Verification

When the ventilation system works, the gas flow in the tunnel is generated by overcoming the internal wall friction under the pressure difference [36,37]. Therefore, the Reynolds number of the vent and the on-way resistance of the internal wall are the main similar parameters in this experiment. The mathematical expression of Reynolds number is
Re = ρ v d μ
d = 4 A v l
The gas viscosity increases with the increase in air temperature, and its formula is as follows:
μ = a + b T + c T 2
For scaling experiments, it is difficult to achieve flow similarity by keeping Re equal between the model and the prototype. But, when Re is greater than the second critical value, that is, the velocity distribution in the turbulent state does not change with the increase in Re, the flow will enter the self-mode state [38,39]. When the model and the prototype are in the same self-mode region, the Re of the model need not be equal to that of the prototype. According to the self-mode definition of Reynolds number, when the Re of the vent exceeds 60,000, the flow enters the self-mode region.
The calculation formula of the on-way resistance is as follows [40,41]:
Δ P m = λ L ρ v ¯ 2 2 D
v ¯ = A v v A t
The linear scale of the experimental model to the gas tunnel is 1:5 and the velocity scale is 1:1; the similarity is verified by calculation. In practical engineering, the exhaust velocity of the gas tunnel is generally 1 m/s~9 m/s. We use Equation (1) to calculate the respective Re of the vents of the experimental model and the gas tunnel. The results show that the gas flow in both vents is in the same self-mode region. It can be seen from Equation (4) that, as long as the friction factors of the experimental model and the gas tunnel are the same, the on-way resistances of the two are equal. Therefore, the organic glass with the same friction factor as the internal wall of the tunnel can meet similar conditions.

3. Similarity Experiment

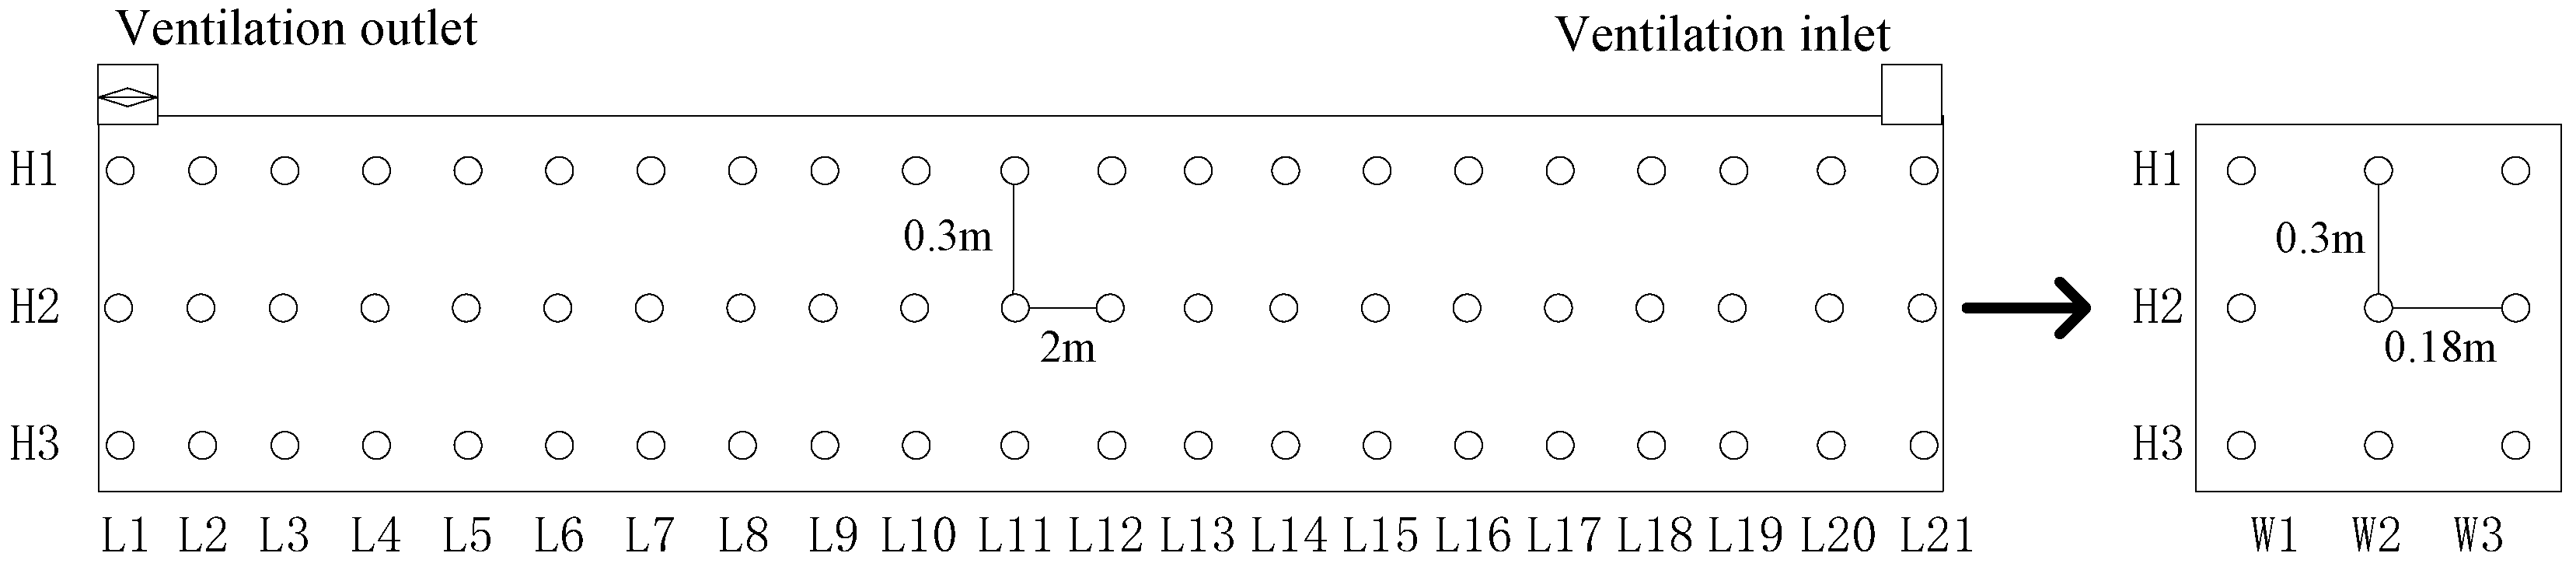
3.1. Experimental Model

Based on the similarity principle, the similarity experimental platform is designed according to the rules that the linear scale of the experimental model to the gas tunnel is 1:5, and the velocity scale and concentration scale are 1:1. As the main component of natural gas is methane, methane is used instead of natural gas in the similarity experiment. The gas pipeline, concrete supports and other ancillary facilities have not been set in the similarity experimental platform because their volumes are relatively small and have little impact on the exhaust. Therefore, the experimental platform is composed of four parts: gas tunnel model, gas leakage system, ventilation system and data acquisition and processing system, as shown in Figure 2. In consideration of the safety of the experiment, the similarity experimental platform of the gas tunnel has been set up at a well-ventilated location.
According to the linear similarity ratio 1:5, the length, width and height of the gas tunnel model are 40 m, 0.4 m and 0.76 m, respectively, and its material is organic glass. The gas tunnel model is processed in sections, connected with flanges and bolts, and rubber seals are added in the middle of flanges. Multiple data acquisition holes are set on the top and both sides of each section to install methane sensors. A small hole is arranged at the bottom of the gas tunnel model to facilitate the arrangement of the leakage pinhole. The ventilation inlet and ventilation outlet are, respectively, set on the top of both ends of the gas tunnel model. The gas leakage system is composed of a methane gas cylinder, a pressure regulating valve, a flowmeter and some gas transmission pipelines. Its function is to provide a specific concentration of methane gas for similarity experiments. The mechanism of the ventilation system in the experiment platform is consistent with that in the actual gas tunnel, and the ventilation mode is natural air intake with fan exhaust. A YNT-2T exhaust fan is installed at the ventilation outlet, and the stepless speed-regulating switch is used to regulate the exhaust velocity of the fan. A hot ball anemometer is used to measure the outlet air velocity. The airflow passing through the thermocouple of the hot ball anemometer causes a change in thermoelectric potential, which is a function of airflow velocity. Therefore, the corresponding airflow velocity value can be calculated based on the change in thermoelectric potential. The data acquisition and processing system is mainly composed of several methane sensors, a data collector and a computer. Its function is to collect the methane concentration at each position in the gas tunnel model during the experimental process. The final similarity experimental platform for the gas tunnel as built is shown in Figure 3.

3.2. Experimental Scheme

Methane sensors are equidistantly arranged in the gas tunnel model, with 189 measuring points in total, as shown in Figure 4. There are 21 rows in the length direction, and the distance between adjacent methane sensors is 2 m; there are 3 rows in the width direction, and the distance between adjacent sensors is 0.3 m; there are 3 rows in the height direction, and the distance between adjacent sensors is 0.18 m. An SJH-type methane sensor is used in the experiment, with a measuring range of 0–100%VOL, a resolution ratio of 0.01%VOL, and a sampling frequency of 10 Hz.
Under the initial condition that the gas tunnel is full of gas, the control variable method is used to simulate the process of gas discharge from the gas tunnel. The variables are different exhaust velocities, ventilation sizes and initial gas concentrations. The most important index to evaluate a ventilation system in engineering is ventilation efficiency, which is generally reflected by gas concentration variation and ventilation duration. Considering the convenience of engineering application, the average gas concentration in the tunnel at a certain time during the ventilation process is selected for subsequent analysis. The calculation formula for average gas concentration is
φ = 1 n i = 1 n φ i
The time from the beginning of exhaust to the time when the gas concentrations at all positions in the tunnel decrease below 1%VOL (the alarm line—refer to GB 50838-2015 “Technical code for urban utility tunnel engineering” [35]) is defined as the ventilation duration.
The experimental steps are as follows: firstly, open the methane cylinder, control the volume of methane entering the gas tunnel model through the pressure regulating valve and flowmeter, and make the methane gas fully diffuse in the gas tunnel model; secondly, after the methane gas sensors at each position in the model meet the preset concentration, set the exhaust velocity, open the fan at the ventilation outlet, and simulate the ventilation process of the gas tunnel; finally, collect the dynamic changes in methane concentration at each monitoring point until the methane concentrations at all monitoring points are less than 1%VOL. Thirteen ventilation scenarios are selected in this experiment, as shown in Table 1.

4. Results and Discussion

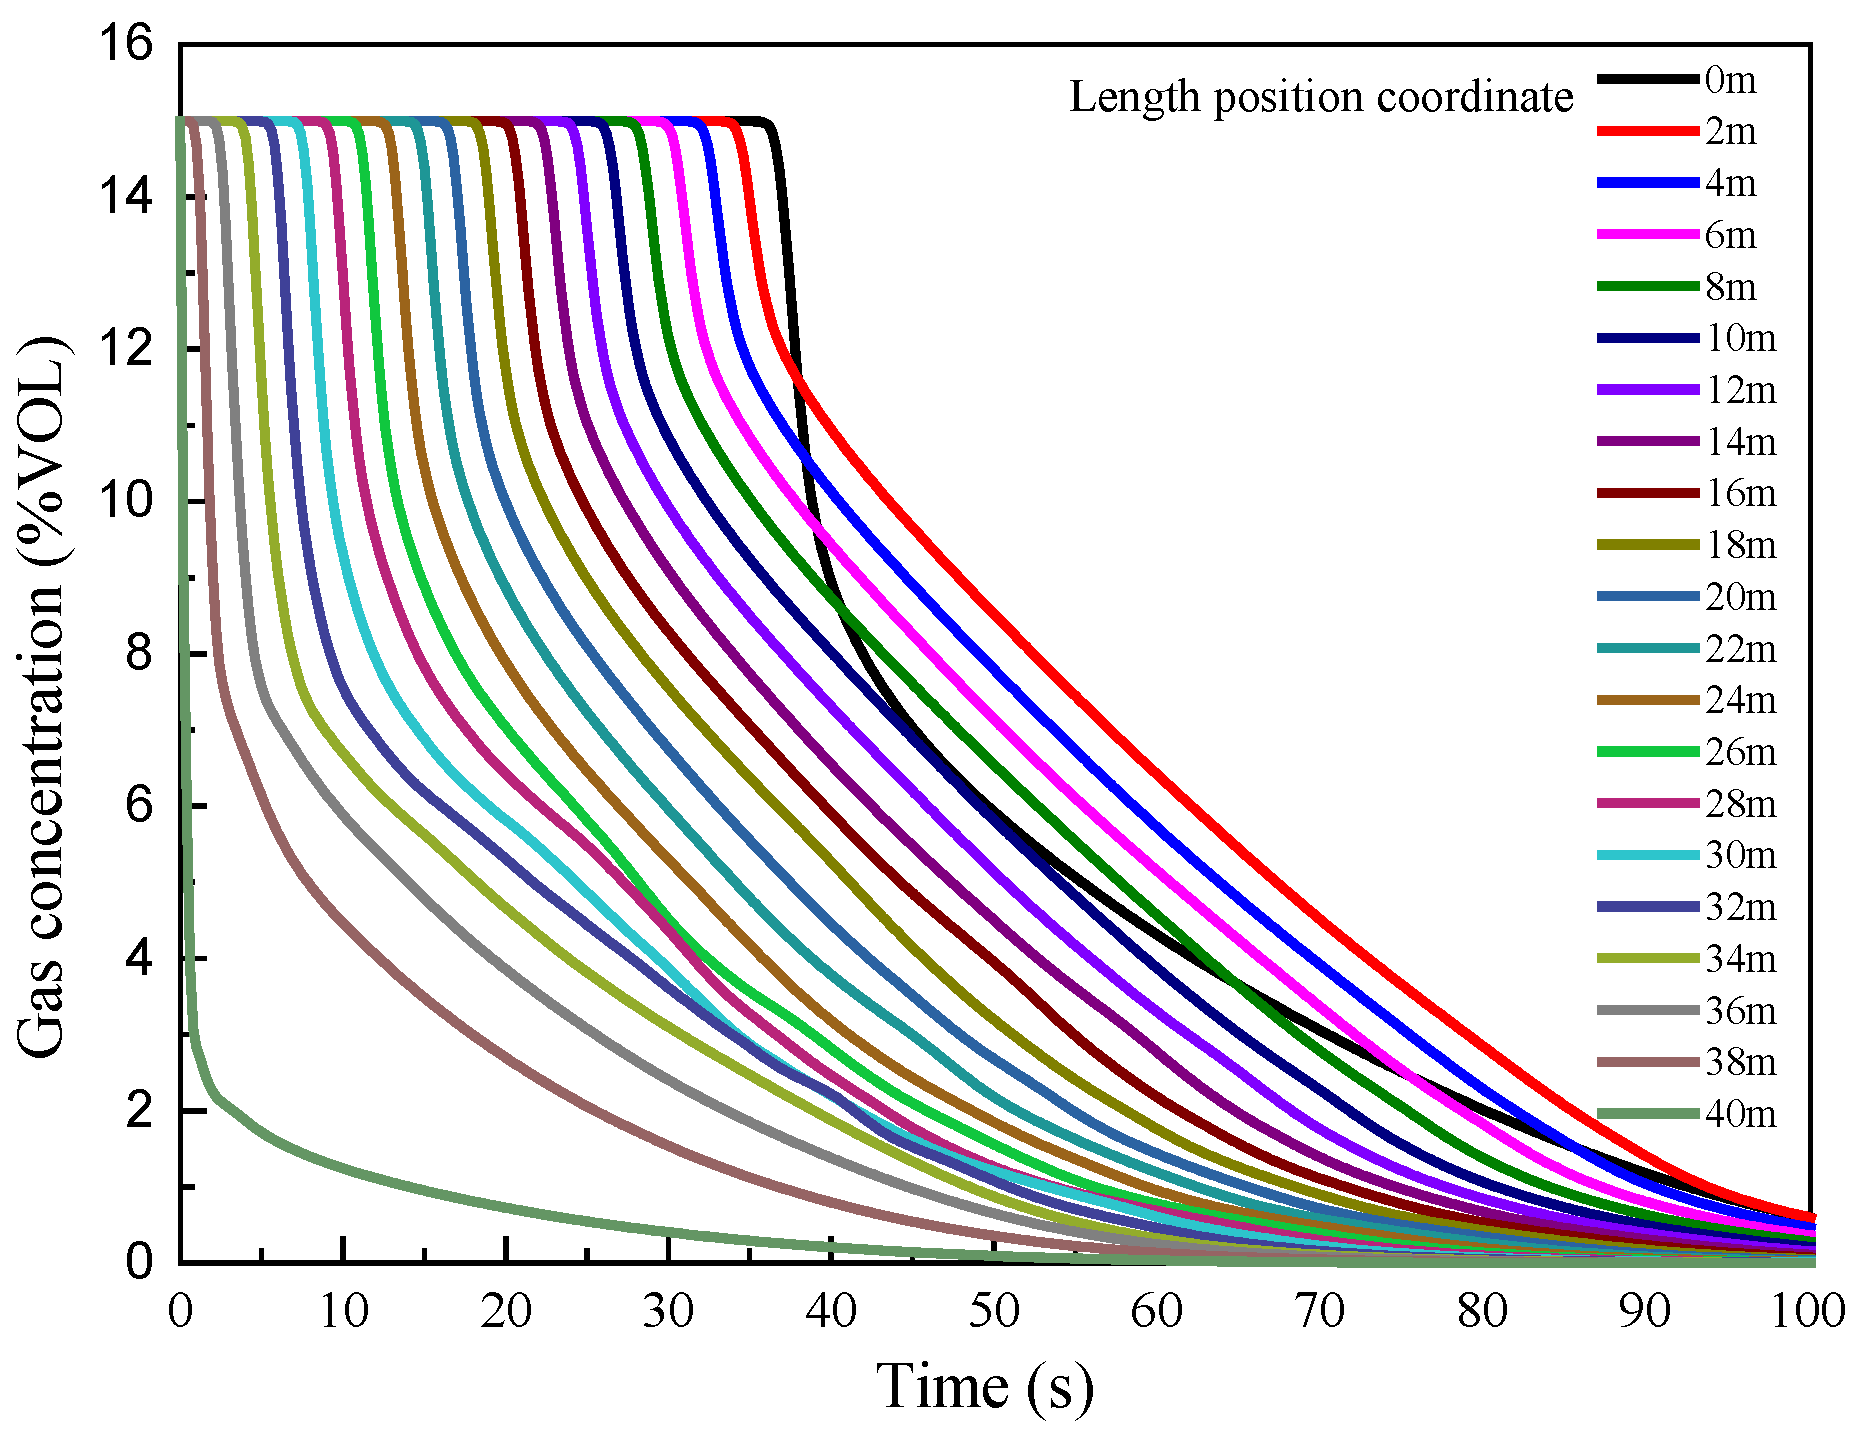
4.1. Concentration Distribution

The ventilation outlet is specified as the coordinate origin for the length direction of the gas tunnel model, and ventilation scenario 3 (in which the initial gas concentration is 15%VOL, the equivalent diameter of the vent is 0.2 m and the exhaust velocity is 5 m/s) is selected to observe the distribution and evolution of the gas concentration in the model space during the ventilation process, as shown in Figure 5. Excepting the ventilation outlet, the time–concentration curves at other locations are arranged regularly and distributed in the form of an “asymptote”. The farther away from the ventilation outlet, the faster the gas concentration decreases with time. The reason is that the gas moves from the ventilation inlet to the ventilation outlet in the ventilation process; the position far away from the ventilation outlet is occupied by air, while the position close to the ventilation outlet supplements some of the gas from the movement. The gas concentration at the ventilation outlet starts to be lower than that at other nearby locations within a period of time after 38 s, due to the fact that the amount of gas replenished at the ventilation outlet is far less than the amount of gas discharged.

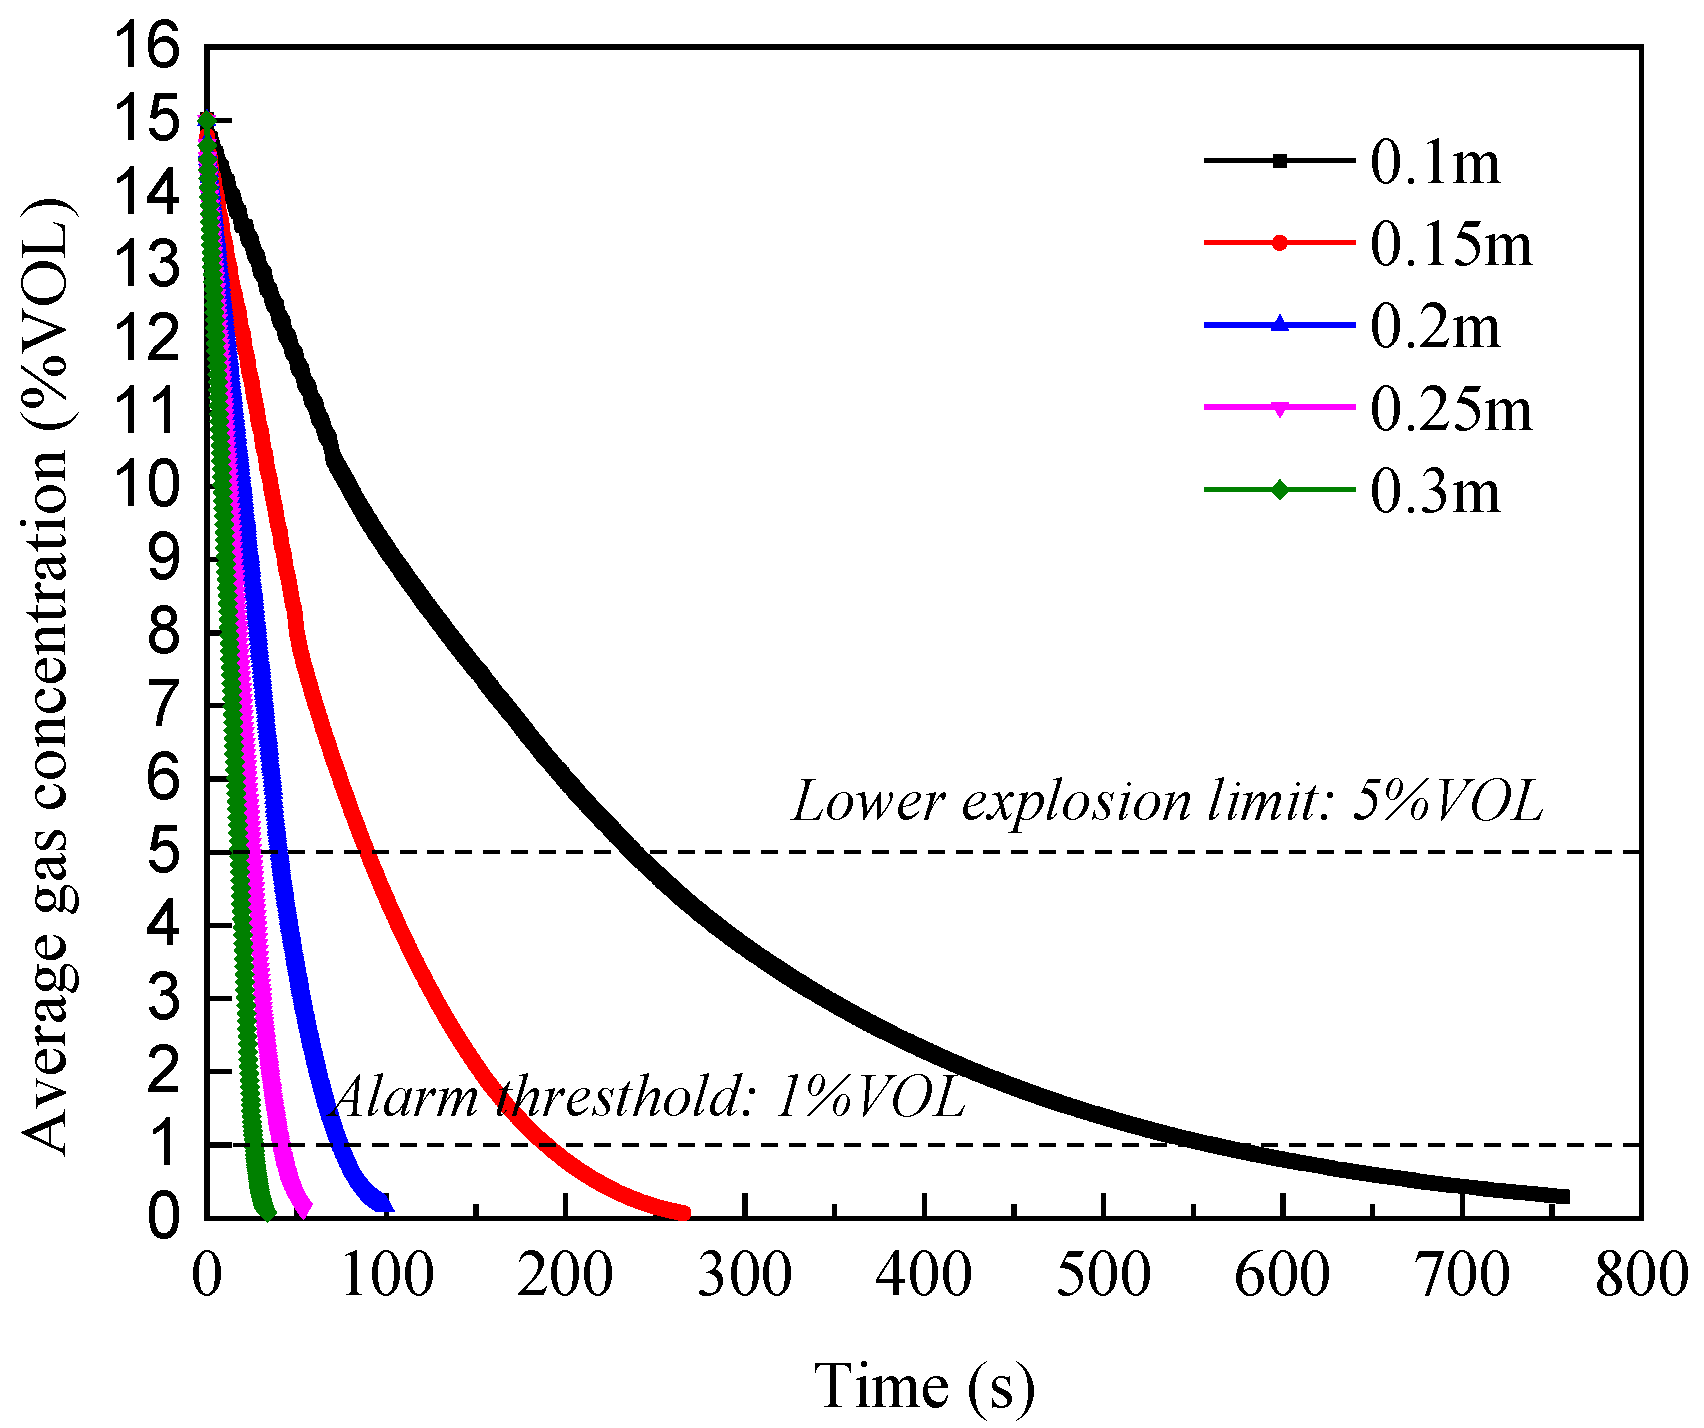
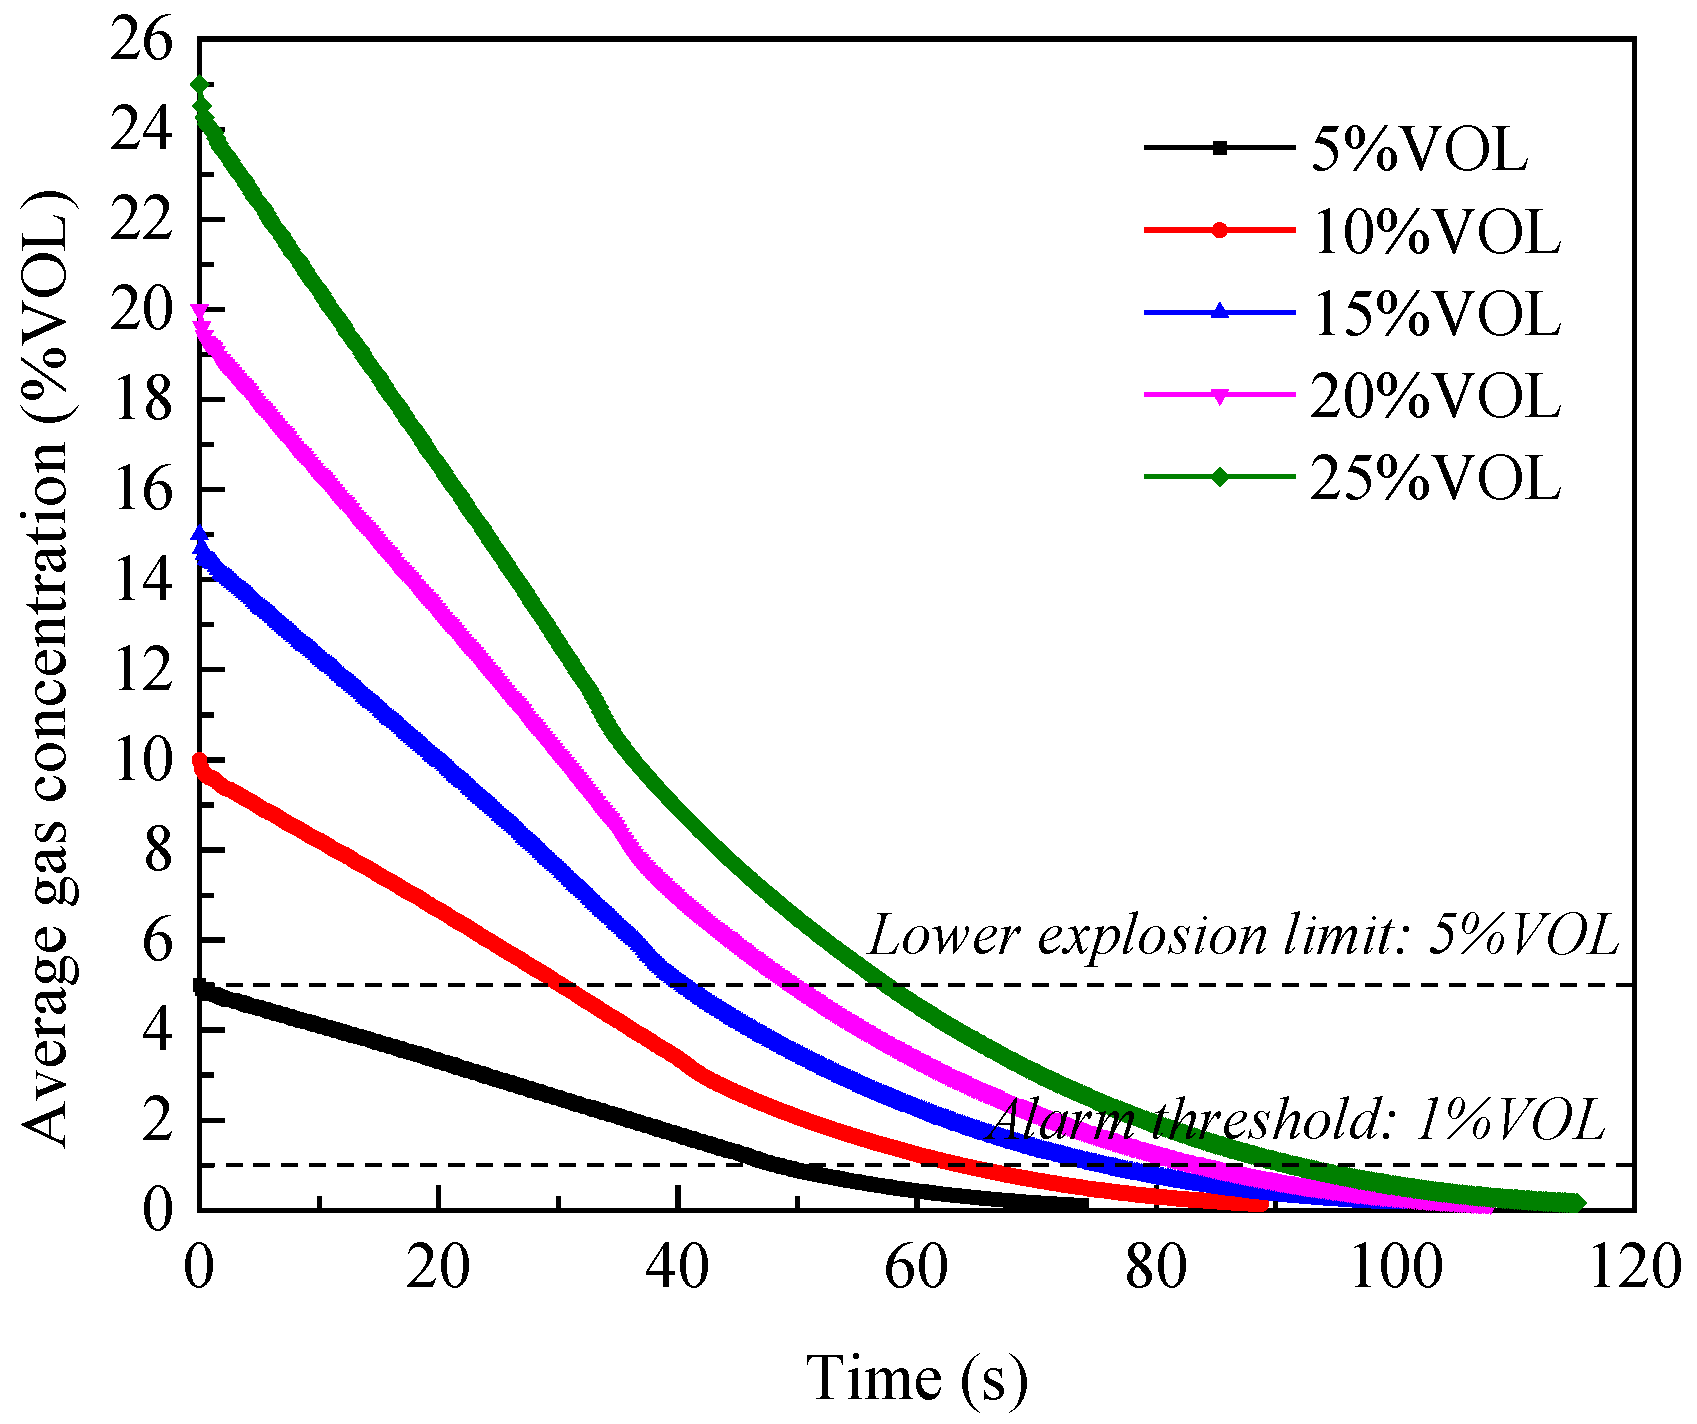
4.2. Concentration Variation

When the initial gas concentration in the model is 15%VOL and the equivalent diameter of the vent is 0.2 m, the variations of the average gas concentration in the tunnel with time under different exhaust velocities are shown in Figure 6. The exhaust velocity has a significant influence on the efficiency of gas discharging from the tunnel. The greater the exhaust velocity, the faster the gas concentration in the tunnel decreases. Nevertheless, when the exhaust velocity exceeds 5 m/s, the decreasing rate of the average gas concentration does not increase significantly.
Figure 7 shows the change curves of the average gas concentration under different ventilation sizes when the initial gas concentration in the model is 15%VOL and the exhaust velocity is constant at 5 m/s. It can be seen that the equivalent diameter of the vent also has a greater impact on the efficiency of gas discharging from the tunnel. The larger the equivalent diameter of the vent, the more quickly the gas concentration in the tunnel decreases. However, when the equivalent diameter of the vent exceeds 0.2 m, the increasing trend for the decreasing rate of the average gas concentration gradually slows down.
When the exhaust velocity is 5 m/s and the equivalent diameter of the vent is 0.2 m, the variations of the average gas concentration in the model with time are shown in Figure 8. Obviously, the increase in the initial gas concentration increases the amount of gas discharged from the tunnel within a unit time, that is, the decreasing rate of the average gas concentration in the tunnel increases. But the higher the initial gas concentration, the longer the ventilation duration required.
By observing all the change curves in Figure 6, Figure 7 and Figure 8, it can be found that each curve is composed of a straight line and a curve, and the segmentation time points are different. In order to further study the relationship between the average gas concentration and time, the curves in Figure 6, Figure 7 and Figure 8 are piecewise fitted, and the results are shown in Table 2, Table 3 and Table 4.
It can be found, from Table 2, Table 3 and Table 4, that the relationship between the average gas concentration in the tunnel and time can be fitted into a linear formula and an exponential formula. In the exhaust state of the tunnel, the average gas concentration decreases linearly in the initial period of time, and the decreasing rate remains unchanged; after a certain period of time, the average gas concentration decreases exponentially, and the decreasing rate gradually decreases. The greater the exhaust velocity, equivalent diameter of the vent and initial gas concentration, the smaller the subsection time point of the curve.

4.3. Ventilation Duration

When the initial gas concentration in the model is 15%VOL and the equivalent diameter of the vent is 0.2 m, the ventilation duration under different exhaust velocities is as shown in Table 5. It can be seen that the exhaust velocity has an obvious impact on the ventilation duration. When the exhaust velocity is 1 m/s, the ventilation duration is 852 s. When the exhaust velocity increases to 9 m/s, the ventilation duration is only 45 s.
When the initial gas concentration in the model is 15%VOL and the exhaust velocity is 5 m/s, the ventilation duration under different equivalent diameters of the vent is as shown in Table 6. It can be seen that the ventilation size also has a notable impact on the ventilation duration. When the equivalent diameter of the vent is 0.1 m, the ventilation duration is 756 s. When the equivalent diameter of the vent increases to 0.3 m, the ventilation duration is only 33.6 s.
When the exhaust velocity is 5 m/s and the equivalent diameter of the vent is 0.2 m, the ventilation duration under different initial gas concentrations in the model is as shown in Table 7. It can be seen that the initial gas concentration has some influence on the ventilation duration. However, compared with the exhaust velocity and ventilation size, the impact is relatively small. When the initial gas concentration in the model is 5%VOL, the ventilation duration is 73.8 s. When the initial gas concentration in the model increases to 25%VOL, the ventilation duration is 115.2 s.
In order to further study the relationships between ventilation duration and exhaust velocity, equivalent diameter of the vent and initial gas concentration, the data in Table 5, Table 6 and Table 7 are drawn into curves and fitted with formulas, as shown in Figure 9, Figure 10 and Figure 11.
It can be seen from Figure 9, Figure 10 and Figure 11 that, with the increase in exhaust velocity and equivalent diameter of the vent, the ventilation duration decreases following a power function, and, when the exhaust velocity exceeds 5 m/s and the equivalent diameter of the vent exceeds 0.2 m, the decreasing trend gradually slows down. With the increase in initial gas concentration, the ventilation duration increases in a power function and the increasing trend gradually slows down.
For practical engineering applications, according to the similarity principle, the experimental data are converted into the ventilation data of the actual standard gas tunnel. Taking exhaust velocity, equivalent ventilation diameter and initial gas concentration as variables, the calculation model of ventilation duration is fitted as follows:
τ S = 2008.011 v 1.3328 d 2.901 φ o 0.287
The application limits of the model are 1 ≤ v ≤ 5, 0.5 ≤ d ≤ 1.5, and 5 ≤ φ o ≤ 25. In the design of gas tunnel, the scientific and reasonable exhaust velocity and equivalent diameter of the vent can be calculated through the given alarm removal time. Similarly, after the leakage accident, the safe and timely rescue time can be determined according to the ventilation parameters of the tunnel and the monitored gas concentration.

5. Conclusions

In this paper, the dynamic ventilation characteristics for the ventilation system of a gas tunnel under various scenarios are obtained through similarity experiments. The conclusions are as follows:
(1)
In the exhaust state, the time–concentration curves of almost all positions in the gas tunnel are arranged in a regular manner and exhibit an “asymptote” distribution;
(2)
The variation rule of average gas concentration in the tunnel decreases linearly with time at the beginning and exponentially after a certain period of time. The segmented time point is negatively correlated with exhaust velocity, equivalent diameter of the vent and initial gas concentration;
(3)
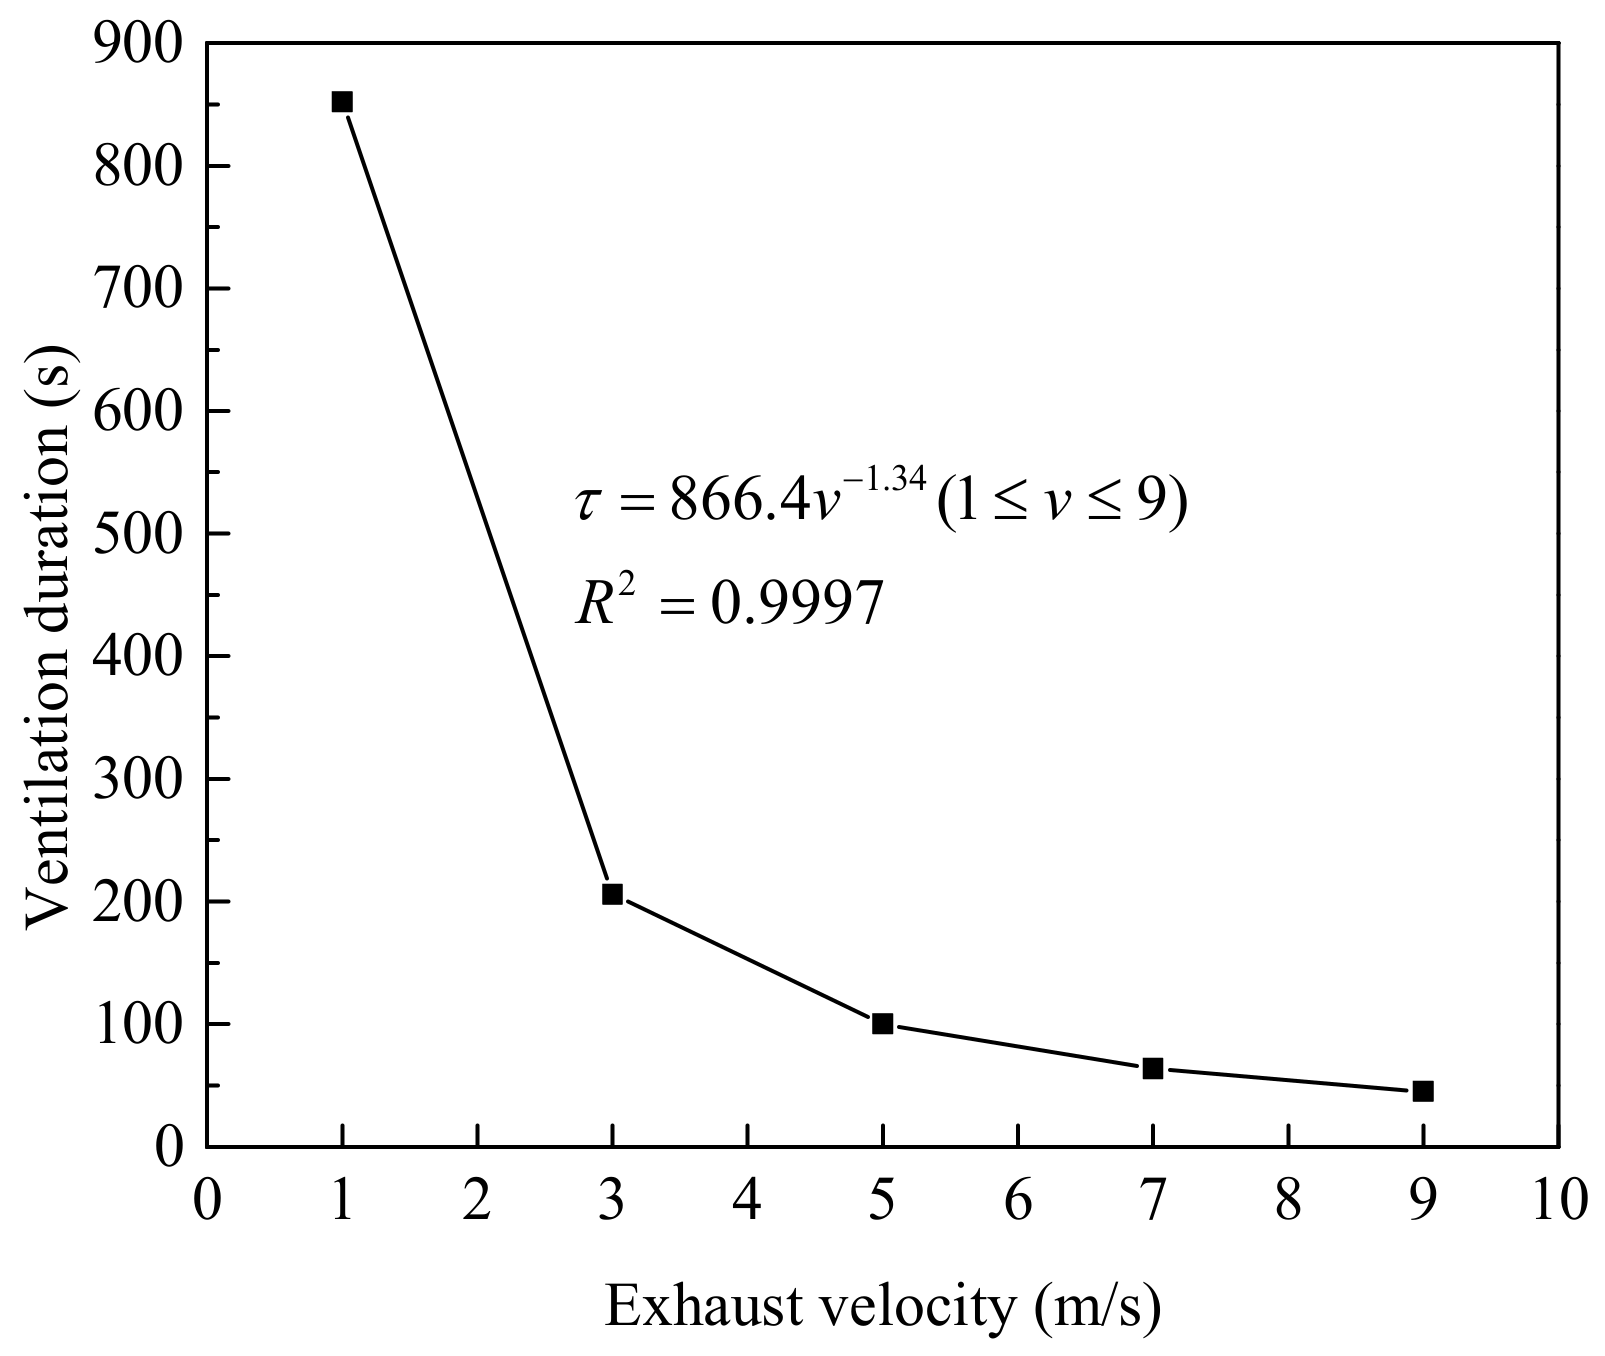
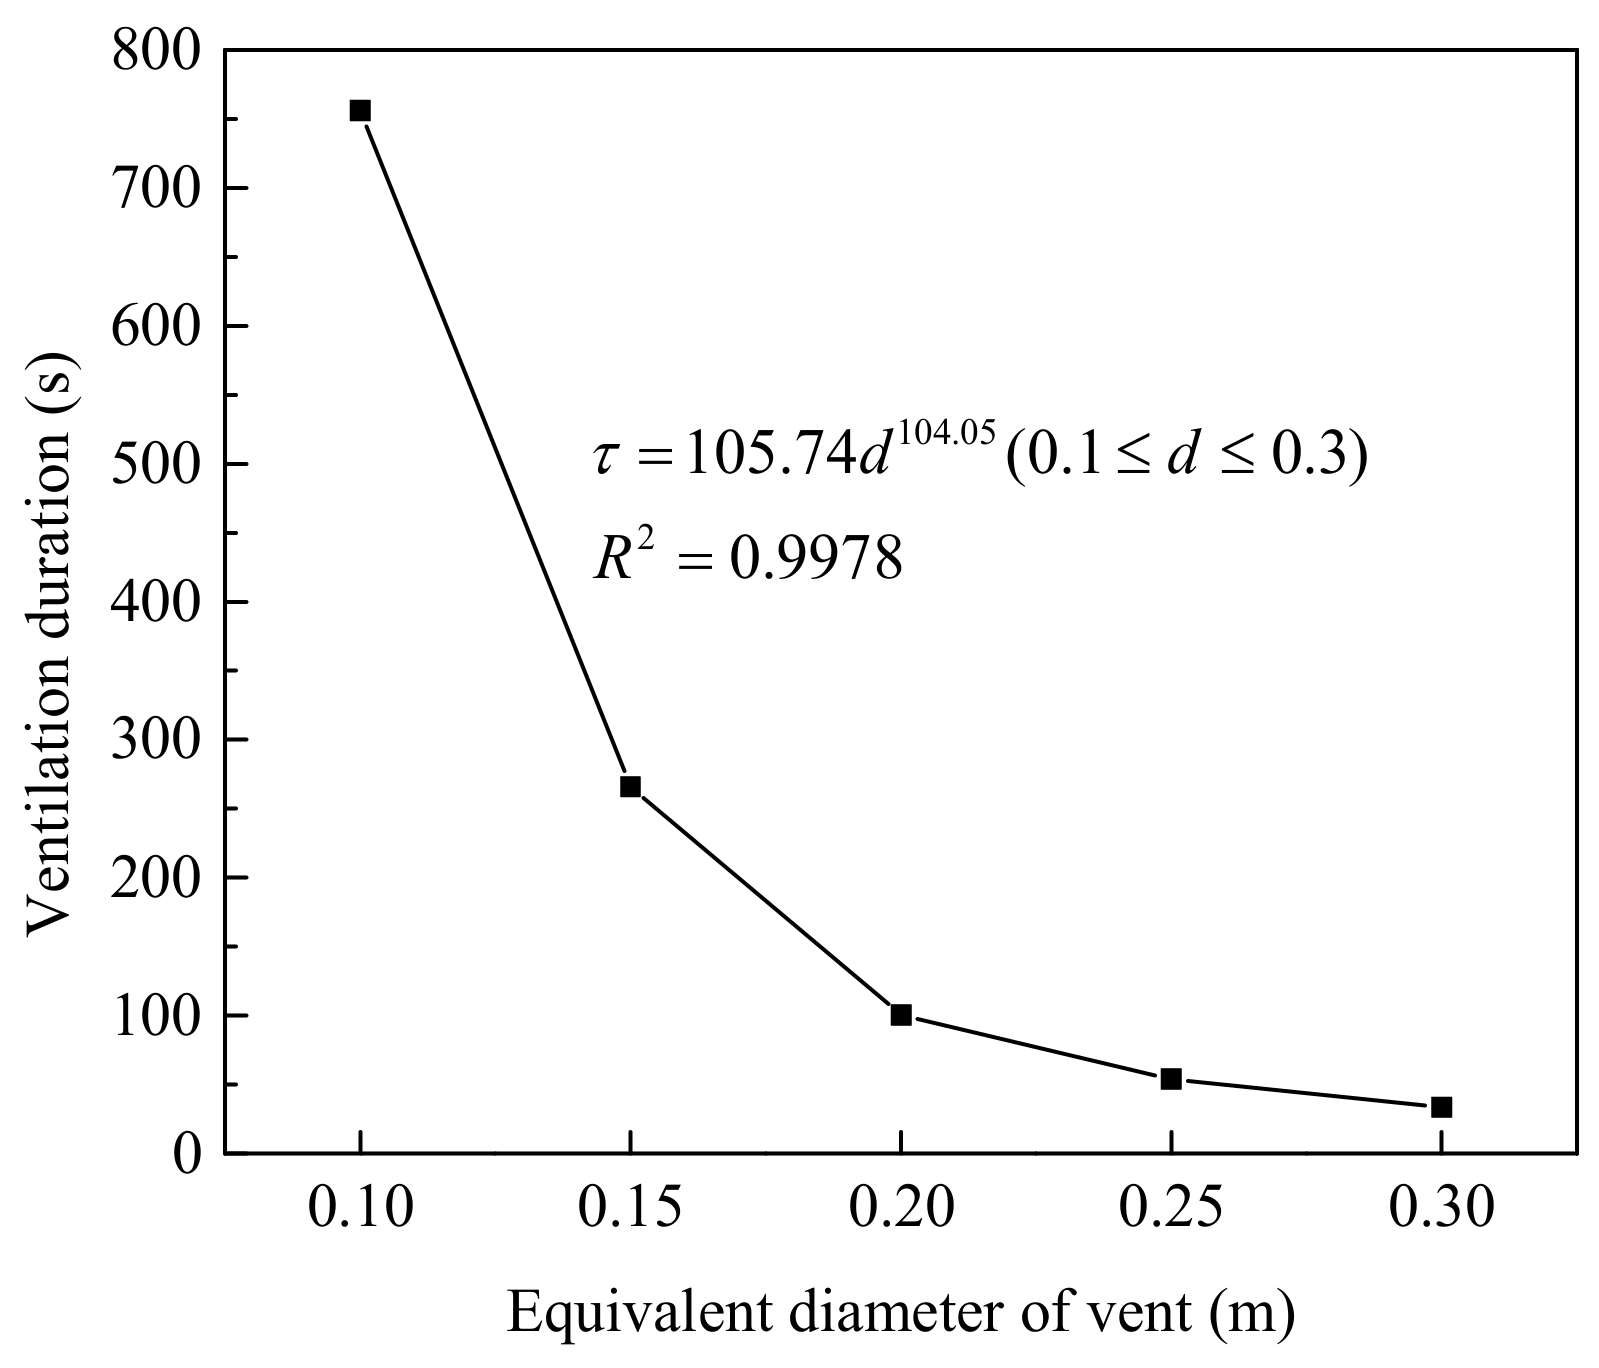
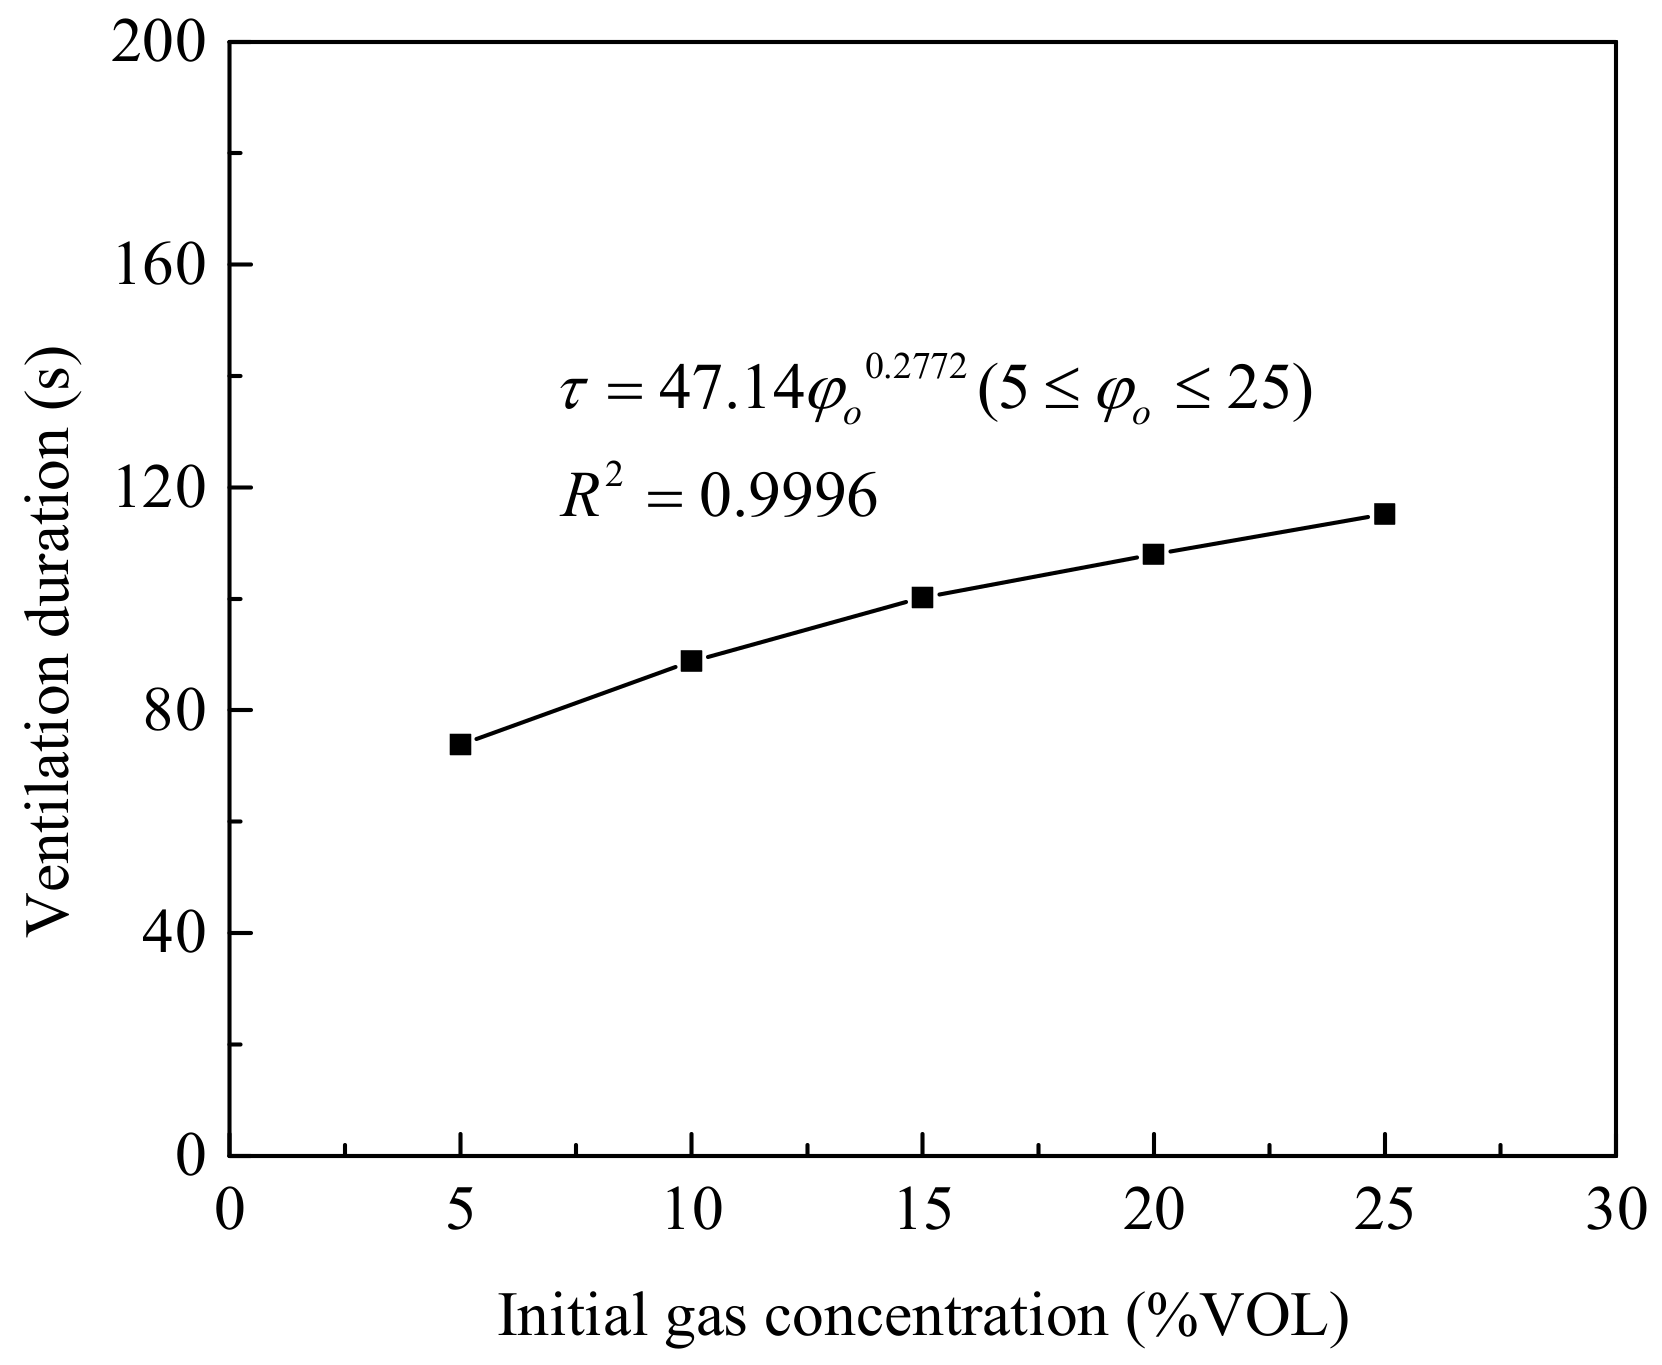
The ventilation duration has a power function relationship with exhaust velocity, equivalent diameter of the vent and initial gas concentration. On these bases, a calculation model for the ventilation duration of actual standard gas tunnels is established, and the application scope of the model is determined;
(4)
The larger the exhaust speed and ventilation size, the higher the ventilation efficiency, but its increasing trend gradually slows down;
(5)
When the exhaust velocity exceeds 5 m/s and the equivalent diameter of the vent exceeds 0.2 m, the decreasing rate of the average gas concentration does not increase significantly, and the decreasing trend of the ventilation duration gradually slows down. Therefore, according to the similarity principle, taking efficiency, economy and other factors into account, the optimized exhaust velocity should be 5 m/s, and the equivalent diameter of the vent should be 1 m in practical engineering.

Author Contributions

P.Z.: Methodology, Validation, Formal analysis and Writing—original draft; H.-Q.L.: Investigation, Data curation, Writing—review and editing and Visualization. All authors have read and agreed to the published version of the manuscript.

Funding

This research is supported by the Xiong’an New Area Science and Technology Innovation Project of National Key Research and Development Program of China (No. 2022XAGG0147), and the Scientific Research Project Funded by Ningbo University of Technology (No. 2130011540018).

Institutional Review Board Statement

Not applicable.

Informed Consent Statement

Not applicable.

Data Availability Statement

The datasets supporting the conclusions of this article are included within this article.

Conflicts of Interest

The authors declare no conflict of interest.

Nomenclature

A t cross-sectional area of gas tunnel (m2)
A v area of vent (m2)
a, b, cscaling parameters
Dequivalent diameter of gas tunnel cross section (m)
dequivalent diameter of vent (m)
Llength through which gas flows (m)
lperimeter of vent
nnumber of methane sensors
Δ P m on-way resistance (Pa)
ReReynolds number
Tair temperature (K)
ttime (s)
vexhaust velocity (m/s)
v ¯ average gas velocity in tunnel (m/s)
φ average gas concentration (%VOL)
φ i gas concentration detected by the i-th methane sensor (%VOL)
φ o initial gas concentration (%VOL)
λ friction factor
μ gas viscosity (kg/m•s−1)
ρ gas density (kg/m3)
τ ventilation duration (s)
τ S ventilation duration of fire-retarding division of standard gas tunnel (s)

References

  1. Liu, R.; Ren, S.; Fan, J.; Wu, F.; William, N. The air flow structure and gas dispersion behavior in gas tunnel construction through bench cut method. Therm. Sci. 2019, 23, 1417–1424. [Google Scholar] [CrossRef]
  2. Han, L.; Liu, H.L.; Zhang, W.G.; Ding, X.M.; Chen, Z.X.; Feng, L.; Wang, Z.Y. Seismic behaviors of utility tunnel-soil system: With and without joint connections. Undergr. Space 2022, 7, 798–811. [Google Scholar] [CrossRef]
  3. Canto-Perello, J.; Curiel-Esparza, J. Risks and potential hazards in utility tunnels for urban areas. Proc. Inst. Civ. Eng. Munic. 2003, 156, 51–56. [Google Scholar] [CrossRef]
  4. Legrand, L.; Blanpain, O.; Buyle-Bodin, F. Promoting the urban utilities tunnel technique using a decision-making approach. Tunn. Undergr. Space Technol. 2004, 19, 79–83. [Google Scholar] [CrossRef]
  5. Broere, W. Urban underground space: Solving the problems of today’s cities. Tunn. Undergr. Space Technol. 2016, 55, 245–248. [Google Scholar] [CrossRef]
  6. Yang, Y.M.; Xiong, Y.; Li, Y.Q.; Meng, X.K.; Wang, P.; Cai, T.Y. Temperature and structural responses of a single-section utility tunnel throughout fire exposure. Front. Struct. Civ. Eng. 2022, 16, 1351–1364. [Google Scholar] [CrossRef]
  7. Lee, J.; Lee, Y.; Park, S.; Hong, C. Implementing a Digital Twin of an Underground Utility Tunnel for Geospatial Feature Extraction Using a Multimodal Image Sensor. Appl. Sci. 2023, 13, 9137. [Google Scholar] [CrossRef]
  8. Liang, Y.T.; Yang, Y.L.; Guo, S.D.; Tian, F.H.; Wang, S.F. Combustion mechanism and control approaches of underground coal fires: A review. Int. J. Coal Sci. Technol. 2023, 10, 24. [Google Scholar] [CrossRef]
  9. Yang, W.X.; Xing, J.C.; Li, J.X.; Ling, J.H.; Hao, H.X.; Yan, Z.Q. Impacts of opening baffle of city road tunnels on natural ventilation performance. Front. Struct. Civ. Eng. 2013, 7, 55–61. [Google Scholar] [CrossRef]
  10. Xie, B.C.; Han, Y.X.; Huang, H.; Chen, L.N.; Zhou, Y.; Fan, C.G.; Liu, X.P. Numerical study of natural ventilation in urban shallow tunnels: Impact of shaft cross section. Sustain. Cities Soc. 2018, 42, 521–537. [Google Scholar] [CrossRef]
  11. Shao, Z.Z.; Tan, B.; Hu, R.L.; Song, X.Z.; Guo, Y.; Li, T.Z.; Fu, S.H.; Chen, C.H.; Wang, H.Y. Effect of periodic wide atmospheric pressure change on CO emission in closed goaf. Int. J. Coal Sci. Technol. 2023, 10, 57. [Google Scholar] [CrossRef]
  12. Colella, F.; Rein, G.; Borchiellini, R.; Carvel, R.; Torero, J.L.; Verda, V. Calculation and design of tunnel ventilation systems using a two-scale modelling approach. Build. Environ. 2009, 44, 2357–2367. [Google Scholar] [CrossRef]
  13. Liu, Q.; Nie, W.; Hua, Y.; Peng, H.T.; Liu, C.Q.; Wei, C.H. Research on tunnel ventilation systems: Dust diffusion and pollution behaviour by air curtains based on CFD technology and field measurement. Build. Environ. 2019, 147, 444–460. [Google Scholar] [CrossRef]
  14. Zhou, Y.; Yang, Y.; Mao, Z.L.; Bu, R.W.; Gong, J.H.; Wang, Y.X.; Yi, L.; Liang, Y. Analytical and numerical study on natural ventilation performance in single- and gable-slope city tunnels. Sustain. Cities Soc. 2019, 45, 258–270. [Google Scholar] [CrossRef]
  15. Hua, Y.; Nie, W.; Liu, Q.; Yin, S.; Peng, H.T. Effect of wind curtain on dust extraction in rock tunnel working face: CFD and field measurement analysis. Energy 2020, 197, 117214. [Google Scholar] [CrossRef]
  16. Xie, Z.W.; Xiao, Y.M.; Jiang, C.X.; Ren, Z.L.; Li, X.Q.; Yu, K.C. Numerical study on fine dust pollution characteristics under various ventilation time in metro tunnel after blasting. Build. Environ. 2021, 204, 108111. [Google Scholar] [CrossRef]
  17. Xue, Y.G.; Gong, H.M.; Kong, F.M.; Yang, W.M.; Qiu, D.H.; Zhou, B.H. Stability analysis and optimization of excavation method of double-arch tunnel with an extra-large span based on numerical investigation. Front. Struct. Civ. Eng. 2021, 15, 136–146. [Google Scholar] [CrossRef]
  18. Dastan, A.; Rahiminejad, M.; Sabz, M.; Abbasi, M.; Mokhtari, A.; Sadrizadeh, S.; Abouali, O. CFD simulations of a semi-transverse ventilation system in a long tunnel. Undergr. Space 2023, 11, 153–170. [Google Scholar] [CrossRef]
  19. Li, Z.; Liang, B.; Xu, M. Urban tunnel body landscape driving comprehensive evaluation study based on biomass-sensing automobile field experiment. Appl. Sci. 2023, 13, 11102. [Google Scholar] [CrossRef]
  20. Guo, X.S.; Fan, N.; Liu, Y.H.; Liu, X.L.; Wang, Z.K.; Xie, X.T.; Jia, Y.G. Deep seabed mining: Frontiers in engineering geology and environment. Int. J. Coal Sci. Technol. 2023, 10, 23. [Google Scholar] [CrossRef]
  21. Zhao, H.B.; Tu, S.H.; Liu, X.; Ma, J.Y.; Tang, L. Study of energy-efficient heat resistance and cooling technology for high temperature working face with multiple heat sources in deep mine. Int. J. Coal Sci. Technol. 2023, 10, 35. [Google Scholar] [CrossRef]
  22. Li, C.X.; Yang, R.S.; Wang, Y.B.; Kang, Y.Q.; Zhang, Y.T.; Xie, P. Theoretical and numerical simulation investigation of deep hole dispersed charge cut blasting. Int. J. Coal Sci. Technol. 2023, 10, 15. [Google Scholar] [CrossRef]
  23. Song, S.K.; Ren, T.; Dou, L.M.; Sun, J.; Yang, X.H.; Tan, L.H. Fracture features of brittle coal under uniaxial and cyclic compression loads. Int. J. Coal Sci. Technol. 2023, 10, 9. [Google Scholar] [CrossRef]
  24. Yoo, J.O.; Kim, J.S.; Ra, K.H. A numerical study of the effects of the ventilation velocity on the thermal characteristics in underground utility tunnel. J. Korean Tunn. Undergr. Space Assoc. 2017, 19, 29–39. [Google Scholar] [CrossRef]
  25. Lu, H.F.; Huang, K.; Fu, L.D.; Zhang, Z.H.; Wu, S.J.; Lyu, Y.; Zhang, X.L. Study on leakage and ventilation scheme of gas pipeline in tunnel. J. Nat. Gas Sci. Eng. 2018, 53, 347–358. [Google Scholar] [CrossRef]
  26. Zhang, H.T.; Zhao, Y.F. Study on underground utility tunnel fire characteristics under sealing and ventilation conditions. Adv. Civ. Eng. 2020, 2020, 9128704. [Google Scholar] [CrossRef]
  27. Zhang, J.H.; Dong, Y.; Chen, Y.D.; Sun, H.S.; Wu, J.K.; Liu, W.L.; Chen, J.R.; Pan, S.Q. Numerical simulation of gas ventilation mode in highway gas tunnel. Geofluids 2021, 12, 5549168. [Google Scholar] [CrossRef]
  28. Vauquelin, O.; Mégret, O. Smoke extraction experiments in case of fire in a tunnel. Fire Saf. J. 2002, 37, 525–533. [Google Scholar] [CrossRef]
  29. Ingason, H.; Li, Y.Z. Model scale tunnel fire tests with longitudinal ventilation. Fire Saf. J. 2010, 45, 371–384. [Google Scholar] [CrossRef]
  30. Zhao, Y.C.; Zhu, G.Q.; Gao, Y.J. Experimental study on smoke temperature distribution under different power conditions in utility tunnel. Case Stud. Therm. Eng. 2018, 12, 69–76. [Google Scholar] [CrossRef]
  31. Li, S.; Liu, X.F.; Wang, J.X.; Zheng, Y.L.; Deng, S.M. Experimental reduced-scale study on the resistance characteristics of the ventilation system of a utility tunnel under different pipeline layouts. Tunn. Undergr. Space Technol. 2019, 90, 131–143. [Google Scholar] [CrossRef]
  32. Zhang, P.; Lan, H.Q. Effects of ventilation on leakage and diffusion law of gas pipeline in utility tunnel. Tunn. Undergr. Space Technol. 2021, 105, 103557. [Google Scholar] [CrossRef]
  33. Qian, Q. Present state, problems and development trends of urban underground space in China. Tunn. Undergr. Space Technol. 2016, 55, 280–289. [Google Scholar]
  34. Zhang, P.; Lan, H.Q.; Yu, M. Reliability evaluation for ventilation system of gas tunnel based on Bayesian network. Tunn. Undergr. Space Technol. 2021, 112, 103882. [Google Scholar] [CrossRef]
  35. GB 50838-2015; Technical Code for Urban Utility Tunnel Engineering. Ministry of Housing and Urban-Rural Development of the People’s Republic of China: Beijing, China, 2015.
  36. Auvity, B.; Bellerose, M.; Tateyama, T. Experimental study of the unsteady aerodynamic field outside a tunnel during a train entry. Exp. Fluids 2001, 30, 221–228. [Google Scholar] [CrossRef]
  37. Zhu, P.G.; Tong, X.N.; Chen, L.; Wang, C.W.; Song, H.; Li, X.Y. Influence of opening area ratio on natural ventilation in city tunnel under block transportation. Sustain. Cities Soc. 2015, 19, 144–150. [Google Scholar] [CrossRef]
  38. Wang, X.; Wang, M.N.; Qin, P.C.; Yan, T.; Chen, J.; Deng, T.; Yu, L.; Yan, G.F. An experimental study on the influence of local loss on ventilation characteristic of dividing flow in urban traffic link tunnel. Build. Environ. 2020, 174, 106793. [Google Scholar] [CrossRef]
  39. Manzano-Miura, N.; Gloutak, D.; Bewley, G.P. Characterization of a turbulent flow with independent variation of Mach and Reynolds numbers. Exp. Fluids 2022, 63, 44. [Google Scholar] [CrossRef]
  40. Smith, D.R.; Gildfind, D.E.; Mee, D.J.; James, C.M.; Allsop, B.V. Magnetohydrodynamic drag force measurements in an expansion tunnel using a stress wave force balance. Exp. Fluids 2020, 61, 180. [Google Scholar] [CrossRef]
  41. Liu, Y.L.; Wang, Y.Z.; Li, J.H.; Tao, Y.Z.; Qiu, X. Experimental study on the large-scale turbulence structure dynamics of a counterflowing wall jet. Exp. Fluids 2022, 63, 159. [Google Scholar] [CrossRef]
Figure 1. Schematic diagram of a fire-retarding division.
Applsci 13 12783 g001
Figure 2. Overall structure diagram of the similarity experimental platform.
Applsci 13 12783 g002
Figure 3. Similarity experimental platform of the gas tunnel.
Applsci 13 12783 g003
Figure 4. Layout of methane sensors.
Applsci 13 12783 g004
Figure 5. Time–concentration curves at each position of the gas tunnel model.
Applsci 13 12783 g005
Figure 6. Variation of average gas concentration under different exhaust velocities.
Applsci 13 12783 g006
Figure 7. Variation of average gas concentration under different equivalent vent diameters.
Applsci 13 12783 g007
Figure 8. Variation in average gas concentration under different initial concentrations.
Applsci 13 12783 g008
Figure 9. Variation of ventilation duration with exhaust velocity.
Applsci 13 12783 g009
Figure 10. Variation of ventilation duration with equivalent vent diameter.
Applsci 13 12783 g010
Figure 11. Variation of ventilation duration with initial gas concentration.
Applsci 13 12783 g011
Table 1. Ventilation scenarios.
No.Initial Gas Concentration (%VOL)Equivalent Diameter of the Vent (m)Exhaust Velocity (m/s)
1150.21
2150.23
3150.25
4150.27
5150.29
6150.15
7150.155
8150.255
9150.35
1050.25
11100.25
12200.25
13250.25
Table 2. Relationship between concentration and time under different exhaust velocities.
Exhaust Velocity (m/s)Linear RelationshipExponential Relationship
Linear CurveGoodness of Fit R2Exponential CurveGoodness of Fit R2
1 φ = 0.0505 t + 14.583 ( 0 < t 93.6 ) 0.999 φ = 16.074 e 0.0045 t ( 93.6 < t 852 ) 0.9974
3 φ = 0.142 t + 14.567 ( 0 < t 49.6 ) 0.9998 φ = 36.776 e 0.025 t ( 49.6 < t 205.8 ) 0.9654
5 φ = 02365 t + 14.67 ( 0 < t 39 ) 0.9995 φ = 62.684 e 0.055 t ( 39 < t 100.2 ) 0.982
7 φ = 0.3375 t + 14.745 ( 0 < t 32.6 ) 0.9996 φ = 148.72 e 0.105 t ( 32.6 < t 63.6 ) 0.9875
9 φ = 0.4345 t + 14.714 ( 0 < t 28 ) 0.9999 φ = 479.38 e 0.18 t ( 28 < t 45 ) 0.9938
Table 3. Relationship between concentration and time under different equivalent vent diameters.
Equivalent Diameter of Vent (m)Linear RelationshipExponential Relationship
Linear CurveGoodness of Fit R2Exponential CurveGoodness of Fit R2
0.1 φ = 0.0615 t + 14.796 ( 0 < t 85.6 ) 0.9992 φ = 17.79 e 0.005 t ( 85.6 < t 756 ) 0.9939
0.15 φ = 0.1315 t + 14.668 ( 0 < t 52.4 ) 0.9997 φ = 35.418 e 0.02 t ( 52.4 < t 265.8 ) 0.9465
0.2 φ = 0.2365 t + 14.67 ( 0 < t 39 ) 0.9995 φ = 62.684 e 0.055 t ( 39 < t 100.2 ) 0.982
0.25 φ = 0.3765 t + 14.682 ( 0 < t 30.8 ) 0.9998 φ = 258.68 e 0.14 t ( 30.8 < t 54 ) 0.9899
0.3 φ = 0.5385 t + 14.641 ( 0 < t 23.8 ) 0.9999 φ = 5788.5 e 0.33 t ( 23.8 < t 33.6 ) 0.9929
Table 4. Relationship between concentration and time under different initial gas concentrations.
Initial Gas Concentration (%VOL)Linear RelationshipExponential Relationship
Linear CurveGoodness of Fit R2Exponential CurveGoodness of Fit R2
5 φ = 0.0805 t + 4.9088 ( 0 < t 47.8 ) 0.9998 φ = 63.045 e 0.085 t ( 47.8 < t 73.8 ) 0.994
10 φ = 0.1595 t + 9.8054 ( 0 < t 42.2 ) 0.9995 φ = 56.506 e 0.065 t ( 42.2 < t 88.8 ) 0.9857
15 φ = 0.2365 t + 14.67 ( 0 < t 39 ) 0.9995 φ = 62.684 e 0.055 t ( 39 < t 100.2 ) 0.982
20 φ = 0.314 t + 19.518 ( 0 < t 36.6 ) 0.9996 φ = 75.698 e 0.055 t ( 36.6 < t 108 ) 0.9765
25 φ = 0.3925 t + 24.636 ( 0 < t 35 ) 0.9997 φ = 86.856 e 0.05 t ( 35 < t 115.2 ) 0.972
Table 5. Relationship between ventilation duration and exhaust velocity.
Exhaust Velocity (m/s)13579
Ventilation duration (s)852205.8100.263.645
Table 6. Relationship between ventilation duration and equivalent diameter of the vent.
Equivalent Diameter of the Vent (m)0.10.150.20.250.3
Ventilation duration (s)756265.8100.25433.6
Table 7. Relationship between ventilation duration and initial gas concentration.
Initial Gas Concentration (%VOL)510152025
Ventilation duration (s)73.888.8100.2108115.2
Disclaimer/Publisher’s Note: The statements, opinions and data contained in all publications are solely those of the individual author(s) and contributor(s) and not of MDPI and/or the editor(s). MDPI and/or the editor(s) disclaim responsibility for any injury to people or property resulting from any ideas, methods, instructions or products referred to in the content.

