1. Introduction
As electrochemical energy converters, fuel cells offer high levels of efficiency with a favorable ratio of electricity generated to heat emitted (range 1:1 to 2:1 compared with 1:2 in conventional electricity generation). This makes them fundamentally interesting for electricity generation, even on a larger scale, not only using hydrogen as fuel but also using internal reforming of longer-chain hydrocarbons [
1,
2].
Especially regarding the use of Solid Oxide Fuel Cells (SOFCs) for power generation (both for domestic energy supply, as well as for industrial co-generation and electricity supply), the service life and robustness of the fuel cell stacks and the system components still represent a high hurdle. Application of SOFCs in stationary energy production systems requires operating times of considerably more than 40,000 h for market penetration. Today’s fuel cell components are not yet qualified for long-term, reliable operation beyond 4 years (approx. 35,000 h), which is necessary for market introduction. They show a continuous loss of performance during operation (‘degradation’), which leads to the critical potential limit for anode reoxidation being undershot or an unreasonably high loss of performance [
3,
4,
5]. If there is a loss of around 15 to 25% in relation to the nominal power, the product would be classified as defective. On the other hand, they show failure due to thermo-mechanical loads in unsteady operation (e.g., during load changes and thermal cycles). The phenomena of these stationary and transient performance losses are largely known [
4,
5,
6,
7,
8,
9].
The main degradation effects in SOFC stacks have already been qualitatively described and categorized. This knowledge is available in the literature [
10]. However, the exact mechanisms are unknown and controversial. For example, there are quite different theories in the literature as to how chromium poisoning of cathodes occurs, what the driving forces are, and how the mechanism can be countered [
11,
12]. The same applies, for example, to sulfur poisoning of anodes, etc. [
13,
14], as well as the weighting of individual effects in the overall context of a stack. In addition, recent long-term tests [
9] show that unforeseen or underestimated phenomena can lead to sudden failure after longer stack running times (19,000 h).
On the other hand, the quantitative description of the phenomena is still largely missing. In addition to many qualitative descriptions of the degradation effects [
12,
13], there are only semi-empirical descriptions [
14] of the mechanisms and some model descriptions of individual effects [
13,
14]. These, in turn, hardly allow any conclusions to be drawn about essential driving parameters, nor do they provide insights into the mechanisms of action that would allow predictions and extrapolations, including lifespan prognosis.
Nevertheless, the exact mechanisms are still controversial or have not yet been investigated and understood in sufficient depth. It involves a variety of corrosive and thermodynamic processes, as well as microstructural changes in the materials, which are clearly influenced by the high operating temperatures between 600 and 850 °C. It is not clear which part of the degradation is caused by pure thermal effects and what is caused or intensified by the current drawing. Investigating them is difficult, lengthy, and often not accessible to direct inspection or observation during ongoing operations because they occur within the closed stack.
There is a need for systematic examination of the preparation procedures and characterization of electrodes, e.g., [
15,
16,
17,
18] and the behavior of (porous) materials as it is strongly related to their microstructure and defines their contribution in phenomena related to fluids (liquid or gaseous) transportation. The main characteristics of a material’s microstructure are its porosity and tortuosity. In a review, Bultreys et al. [
19] conclude that every characterization method, independent of being old or new, has its own features, making it strong for a certain characterization. There are different methods and techniques for obtaining information about a material’s microstructural characteristics, as described below:
Methods that permit the measure of these characteristics in three-dimensional (3D) samples but without optical observation of the material itself, like mercury intrusion porosimetry. In such cases with no possibility for visual observation and description of the real pore system, theoretical models that are based on idealistic pore models like spherical or cylindrical pores to describe the microstructure. Using this technique, the total porosity, the total pore cumulative volume, the total specific surface area, the average pore radius, the bulk density, and the tortuosity can be determined.
Methods for measuring microstructural characteristics using microscope images of materials with suitable cross sections and software. Microscopic methods provide a detailed picture of the microstructure of the specimen’s surface to which they are limited [
20]. In this case, the actual pore network is described but with specific limitations in the simulation of the third dimension of samples.
X-rays can penetrate materials in varying depths depending on the number of protons in the nucleus, and the transmitted intensity I of monochromatic X-rays passing through an object can be calculated using Beer’s law [
21]. X-ray tomography is a very promising technique that can fill the gap between the two cases described before. It produces 3D images of the internal structure of the respective material with spatial resolution of less than 1 µm, depending on the device used. The technique complements the higher resolution 2D microscopy, the lower resolution 3D ultrasonic imaging, and also FIB-SEM techniques where the observed volume is much less than in the Micro-Computed Tomography (µ-CT) [
22]. Wilson et al. [
23] estimated the tortuosity by applying the diffusion equation in the reconstructed 3D-pore space of electrodes obtained by FIB-SEM [
24,
25].
The µ-CT technique maps a 3D picture and porosity data between different sample parts. Phases and features can be identified because they of their different absorption properties. The rotation of the sample makes it possible to reconstruct the features from 2D pictures. Afterward, using mathematical operations, we reconstruct the images to a 3D object, where each voxel (volume element or 3D-Pixel) represents the X-ray absorption at this point [
2,
26].
The µ-CT method enables us to obtain detailed characterization of microstructure, permeability at micro-scale, phase volume fractions and their connectivity, spatial distributions, orientations, alignment, and connectivity of microstructural features as well as to quantify the relationship between microstructure and transport properties. Further, µ-CT enables the upscaling of permeability using simulations as proposed, e.g., by Liu et al. [
27]. In a study of Krakowska et al. [
28] it was shown that the X-ray computed micro-tomography, as modern, non-invasive method provides information about the pore space properties of different rocks. The main advantage between FIB-SEM analysis [
20,
29] and µ-CT lies in the huge volume difference that is observed as FIB samples are typically 10 × 10 × 10 µm
3 (for example, 8000 µm
3 in [
30]) as compared to volumes of up to several mm
3 with µ-CT [
31]. That gives a better overview of the microstructural changes taking place during long-term experiments.
Electrochemical Impedance Spectroscopy (EIS) is a powerful method for the characterization of materials and electrochemical cells. It is widely used in SOFCs and SOCECs in order to follow specific resistances and explain degradation mechanisms, e.g., [
32,
33,
34].
This work combines structural properties like tortuosity and porosity with the general changes in the anode microstructure derived from SEM and µ-CT and electrical properties derived from EIS (specific resistance). The main point is to show that there is a difference in the degradation of SOFC anodes regarding microstructure and, thus, a specific resistance increase due to pure thermal (chemical) treatment. This is helpful for the time invested in the forming step of the anode (reduction of NiO to Ni), which should be as short as possible. Further, we compare it with the case when additional current is drawn, thus producing water in the anode compartment. In this respect, the influence of humidifying the fuel is investigated as well.
2. Materials and Methods
In this study, electrolyte-supported button cells with a 23 mm diameter electrolyte made of stabilized zirconia with 3% Y2O3 were examined. The anode and cathode had a diameter of 10 mm. The anode material was a nickel/10% gadolinia doped ceria (Ni/GDC) cermet with an active layer directly on the electrolyte support and a contact layer on top. Nickel was used as an additional contact. Strontium-doped lanthanum manganate (LSM) was used as standard cathode material.
All materials used in the present study are state-of-the-art SOFC materials, as the goal is to avoid microstructure degradation of standard materials and to extend their service time in SOFCs and not to test more novel or exotic materials.
In order to find out the different contributions (chemical and electrical) to the total degradation, we performed thermal and electrochemical experiments with similar cells under the same conditions. The only difference was that during the electrochemical experiments, a current of 230 mA/cm
2 was drawn. The cells have been contacted during the thermal treatment, similarly to the electrochemical experiments. The time was varied between 100 h and 1000 h while the temperature was kept constant at 850 °C. Further, in all electrochemical experiments, a current density of 230 mA/cm
2 was set over the entire duration of the experiment. The used hydrogen fuel was humidified by passing H
2 through a bubble saturator at room temperature (25 °C), leading to a humidified gas composed of 3 vol.% H
2O/H
2 (3.17 kPa) as reported, e.g., in [
35]. The addition of steam was achieved by passing He, as a carrier gas, through a saturator at room temperature (25 °C).
The experimental conditions for all cells are summarized in
Table 1.
During the electrochemical experiments, impedance spectra (EIS) were regularly taken. After the chemical (thermal) and electrochemical treatment, all samples were investigated using scanning electron microscopy with energy dispersive spectroscopy (SEM/EDS) and micro-computed tomography (µ-CT).
Electrochemical Impedance Spectroscopy (EIS) measurements were conducted using a potentionstat–galvanostat (BIOLOGIC SP-150 (BioLogic, Seyssinet-Pariset, France)) equipped with a frequency response analyzer (FRA). EIS data were collected over the frequency range of 1 MHz–1 MHz, using a stimulus of 10 mV amplitude. The EIS experiments were performed at open current–voltage (OCV) at certain times from 0 to 1000 h.
The equivalent electrical circuit applied for the calculation of internal resistances consists of a two—time constant model equivalent circuit considering the overall solution resistance of the cell (RS) in series with two parallel RC components followed by a Warburg element (W). Linear Sweep Voltammetry (LSV) from the OCV to the short-circuit of the cell was carried out for the construction of polarization curves in order to assess the stack performance.
The SEM analysis was performed using a FEI Helios NanoLab™ 600, equipped with a high-resolution electron column with a Field Emmission Gun (FEG) electron source and a light element X-ray EDS detector. The samples were impregnated using a low viscosity epoxy resin, and after curing, they were ground using diamond abrasives and polished with diamond suspensions with 7, 3, and 1 µm particle diameter. On the samples, we deposited a 20 nm thin carbon layer in order to avoid charging, thus improving the image stability under the electron beam.
X-ray tomography was performed using a BRUKER SkyScan2011™ X-ray nano-tomograph with spatial resolution of <100 nm pixel size (isotropic) using an X-ray source of 20–80 kV, a focal spot size of <400 nm, and a 12 bit CCD detector. The spatial resolution in volume terms is according to the manufacturer equal to or better than that of synchrotron tomography.
The samples used in the µ-CT have had dimensions of about 0.2 × 1.5 × 3 mm
3 (X, Y, Z). For the µ-CT measurements, the following parameters were set up: Source Voltage (kV) = 50, Source Current (µA) = 180, Z-spacing = 1, Pixel size (µm) = 1.500. The distance from the object to the source was 4.95 mm and 150.040 mm from the camera to the source. The exposure time for each frame was 2000 ms. The resulting image pixel size was 0.35 µm. From the µ-CT runs, we obtained a series of 2D images of slices, which then need to be reconstructed by post-alignment, smoothing, beam-hardening correction, and ring-artifacts removal to a 3D distribution of the local linear attenuation coefficient and stored as a 3D image or a stack of virtual 2D slices. The reconstructed 3D volume can be used to obtain quantitative results (so called morphometric parameters) after using the software package CT-Analyser (Bruker
®), version 1.15.4.0, delivered with the instrument. Among many parameters that can be extracted from the tomographs [
31], time-dependent changes in the porosity and tortuosity of the microstructure are of interest to this study.
Morphometric parameters are calculated by CT-analyzer either in direct 3D, based on a surface-rendered volume model, or in 2D from individual binarized cross section images as we distinguish between different types of analysis for 3D and 2D measurement. Using a histogram and manually set threshold values, we obtained binary sets of the 2D pictures and, from them, the morphometric parameters. It is of utmost importance to choose carefully the threshold values as the porosity depends strongly on them. We used porosity values calculated from single 2D pictures using the Fiji™ software Release 1.52d package in order to adjust the starting threshold values. Information on important morphometric parameters can be found in the manuscript of the Bruker ScyScan 2011 nano-tomograph (Bruker, Billerica, MA, USA) [
31].
The tortuosity factor τ (or simple tortuosity) is defined as the change in transport properties through a porous medium due to non-linearity in the path. It can describe the electrical current, heat transfer, or mass transport interchangeably. As an example, the effective diffusion coefficient is defined as
with ε being the volume fraction of the conductive phase and τ the tortuosity factor in this direction. For τ = 1, the diffusion path is direct. As τ, by definition, must be ≥1, the diffusion is slower because the path is no more direct [
36,
37].
TauFactor
® is a MatLab
® application for simply and efficiently calculating the reduction in diffusive transport caused by convolution in the geometry of heterogeneous media based on microstructural image data [
38]. Tortuosity factors have been calculated using the same µ-CT pictures by using TauFactor
®.
3. Results
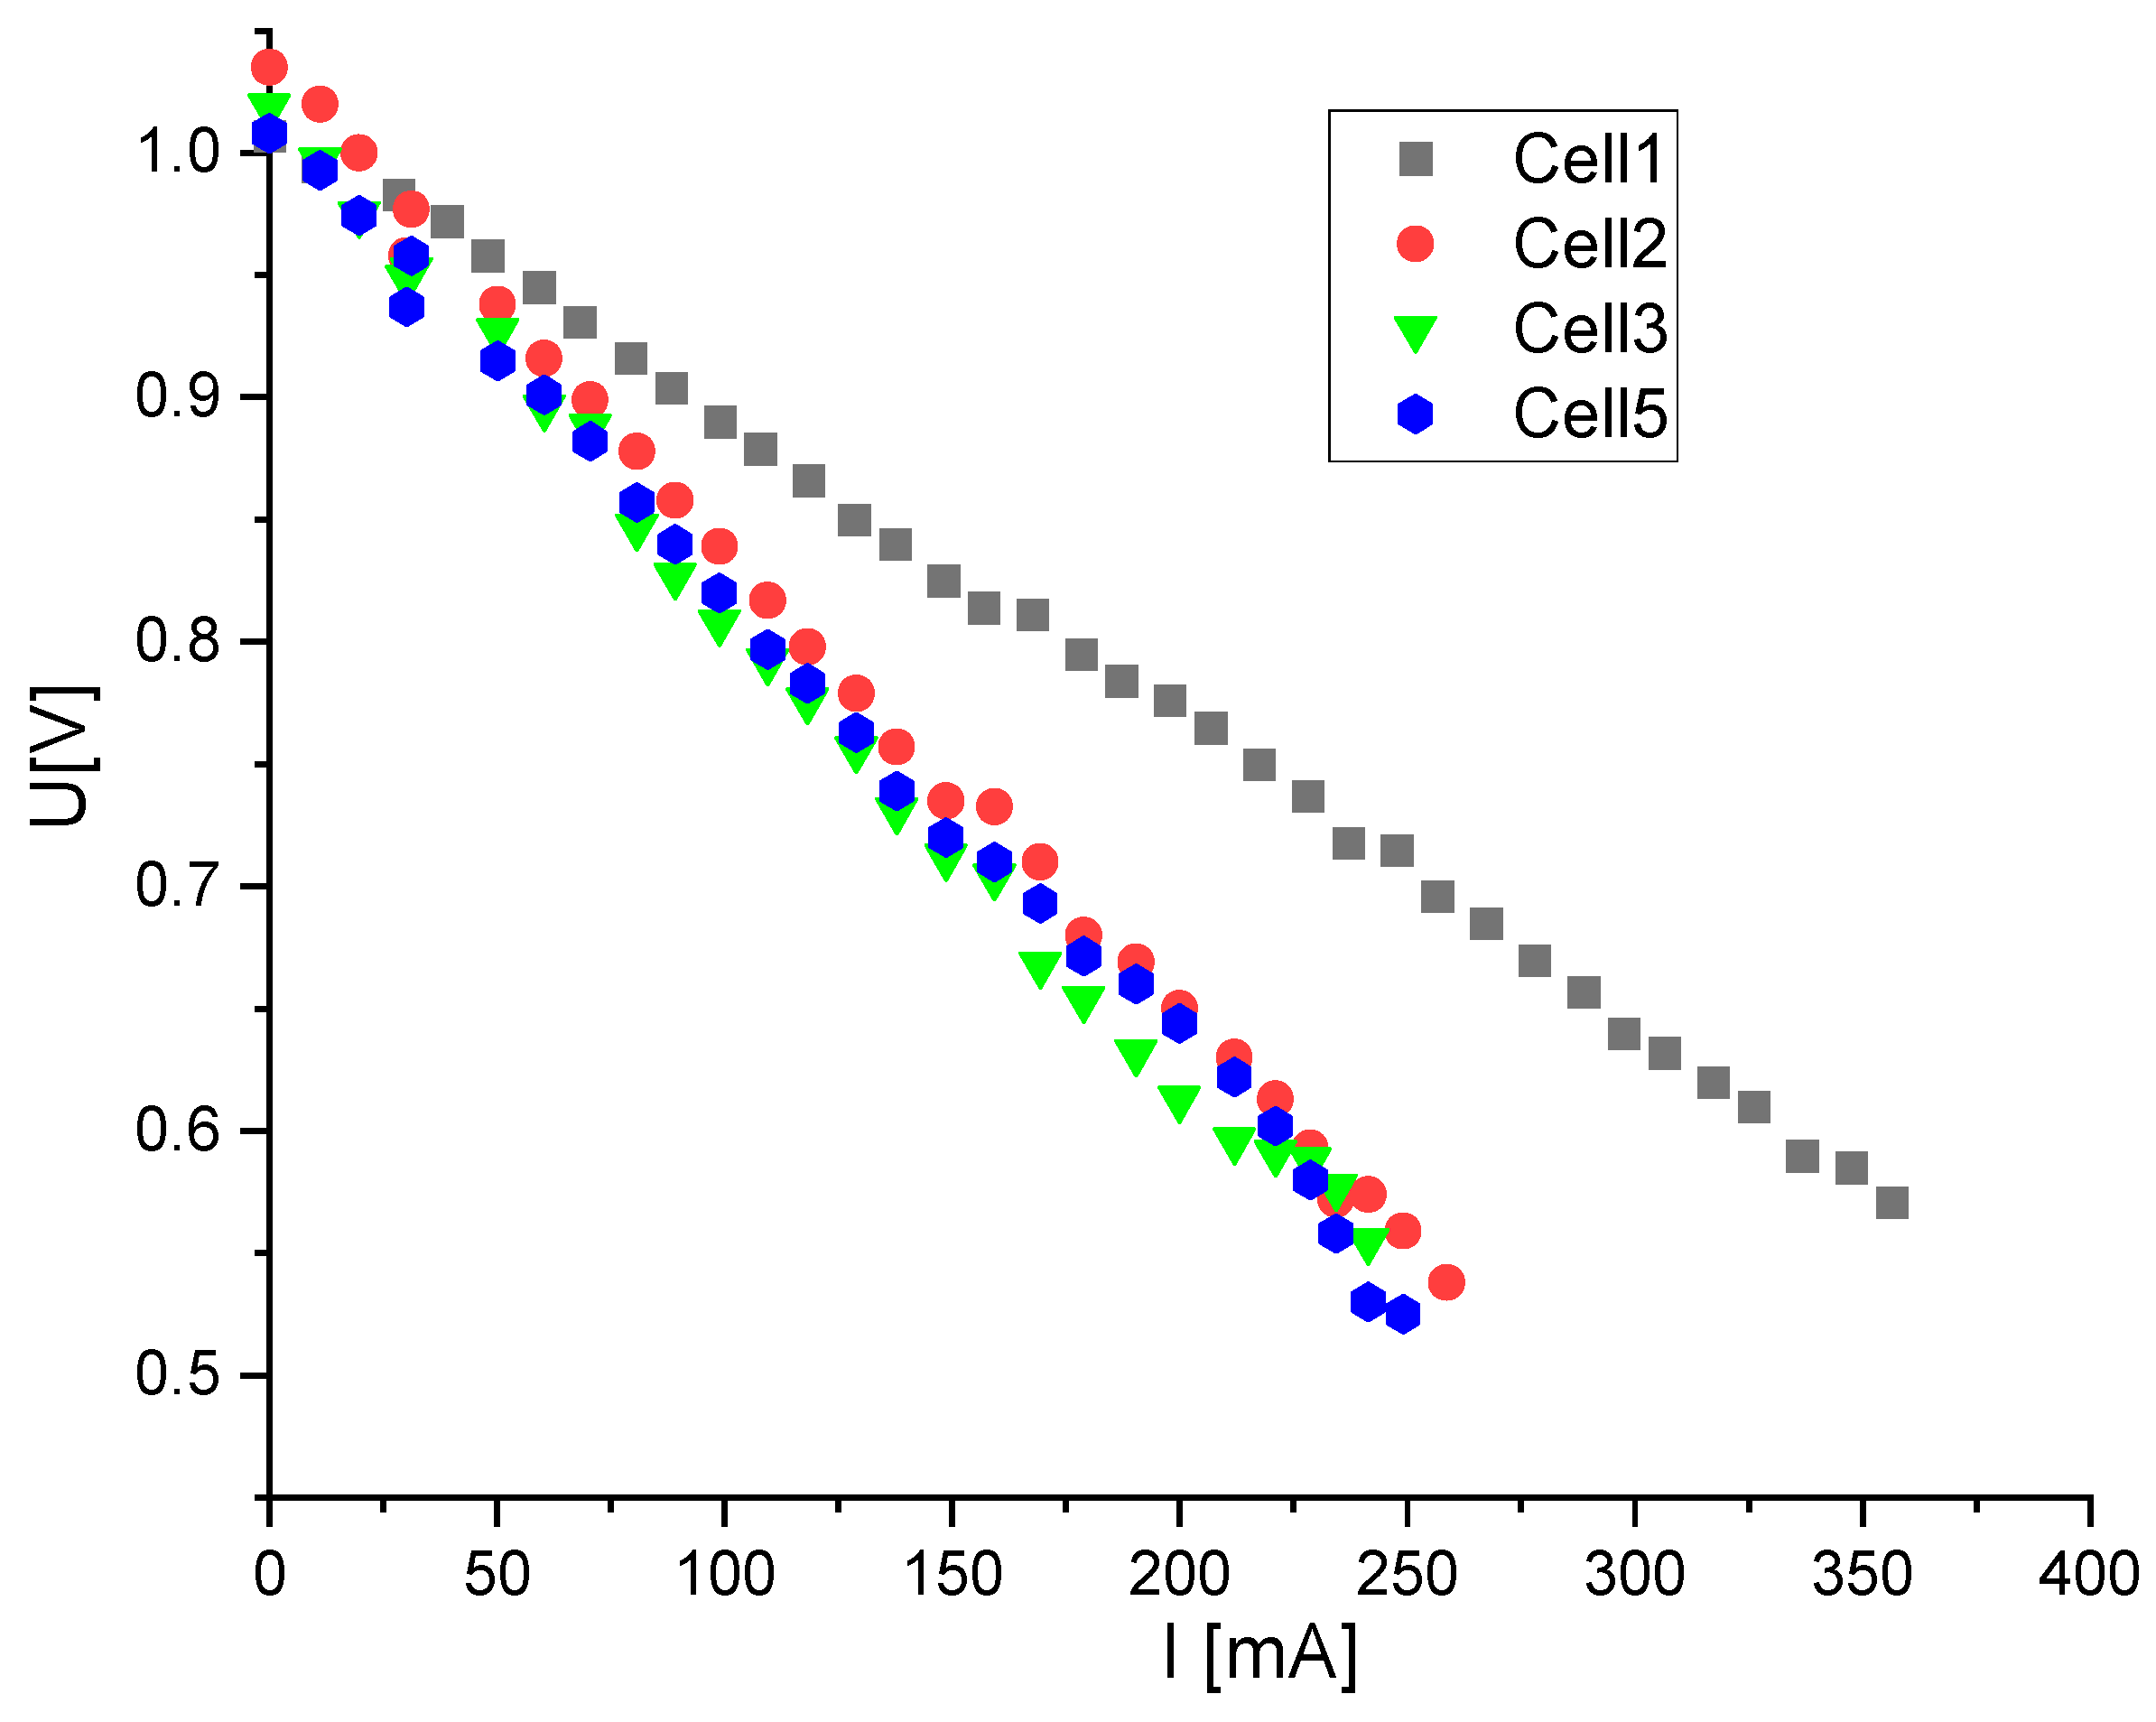
Prior to each electrochemical experiment, a U/I curve of each sample has been taken to exclude contact problems (
Figure 1).
In general, SOFCs are running by drawing current as long as the voltage is not dropped below 0.7 V. Experience shows that at higher currents, high fuel utilizations increase the possibility of lean hydrogen conditions in parts of the anode compartment (near the exit) and thus partial oxidation of the nickel in the anode is given. Redox cycles of the nickel in the anode lead to a breaking of the contact points between anode particles (ni and NiO have different molar volumes) and thus to a strong anode degradation. In our case, it is clear from the U–I curves shown in
Figure 1 that there was no diffusion polarization at the set gas flows and other experimental conditions. So, it was no problem to define the lower voltage limit as 0.6 V and to draw current until this limit was just not exceeded. A comparable current density of 230 mA/cm
2 could be set for all samples.
3.1. Impedance Spectroscopy
From the impedance spectra of the thermally aged samples under dry conditions (
Figure 2a), it is evident that the resistance is higher compared to the sample under wet conditions (
Figure 2b).
In the electrochemical experiments (
Figure 2), the influence of the anode gas humidification is also clearly measurable, although this time, it is the opposite of that in the thermal aging experiments. Here, the total resistance is smaller in dry than in wet H
2.
From an analysis of the measured Nyquist plots in
Figure 2c,d and an appropriate combination of the impedance elements, the following equivalent circuit model (ECM) that fits the measured impedance data can be proposed (
Figure 2e).
Figure 3 shows the development of the obtained specific resistance of the cells as a function of the aging time (both thermal and electrochemical). The influence of the moisture in the anode compartment is very clear in the thermal aging tests. In dry conditions, the specific resistance increases significantly with time in contrast to the wet thermal aging test. The increase of the specific resistance after 250 h under thermal treatment in dry conditions is especially remarkable.
Electrochemically (besides the current drawing, practically the same experiment), the situation is such that the specific resistance under wet conditions is the same as in the thermal test. In the dry electrochemical test, the specific resistance does not increase as significantly as in the thermal test. This is probably because, in electrochemical experiments, there is always a certain amount of moisture on the anode side due to the water being produced. This effect is stronger under the selected test conditions due to the high fuel utilization of approx. 60% (determined by mass spectroscopy), which leads to a high proportion of moisture in the anode. The observed difference in the development of the specific resistance between thermal and electrochemical experiments can stem only from processes related to the current draw. Besides, the increased humidity under high fuel utilization, possibly local ohmic heating, leads to changes in the local chemistry and microstructure.
From the above impedance spectra, it is obvious that, with a few exceptions, the greatest influence on the total resistance is caused by low-frequency processes, i.e., the gas transport in the electrodes, and fewer processes, such as the oxidation reaction of the fuel or electronic or ionic transport phenomena [
39].
U–t curves (not presented here) of electrochemically aged cells for 1000 h under dry and wet conditions have shown by linear extrapolation that the mean value of the voltage drop after 1000 h with non-humidified fuel gas is ca. 183 mV/year, whereas humidified fuel gas results in a loss of only 53 mV/year, which is clearly less than 3% and 1% per year respectively. During the long-term tests, a voltage change has been observed. According to that, after approx. 200 h, the cell appears to recover in both cases, and the loss for t > 250 h is 122 mV/year under dry conditions and an average of 96 mV/year when running with wet fuel gas, again being smaller than 2% and 1% per year, respectively. These changes are in accordance with microstructure relaxation, as described in the results and discussion sections.
3.2. SEM and µ-CT Analysis
In this chapter, SEM and µ-CT results, which show changes in the microstructure of the cells under thermal and electrochemical treatment, are presented and compared to the reference cell, which has been only reduced and additionally compared to each other depending on the treatment time (100 h and 1000 h) and fuel gas humidity (dry-3% humidity).
3.2.1. Reference Cell
The EDX results of the reference (Cell 6) are presented in
Figure 4. The colors show the constituent elements of the anode. A good and homogeneous distribution of the elements Ni Gd and Ce is found. The grain size ranges between approx. 1 µm near the interface and approx. 8 µm (for a few) grains in the contact layer. These images are intended to serve as a comparison with the images of the other samples in series F in order to document microstructural changes as a function of thermal and electrochemical loading over time.
The SEM images were also used for microstructure analysis, and an initial value for the 2D porosity was calculated using ImageJ
® software 1.52d [
40]. The porosity resulting from this analysis is, of course, only indicative, as the 2D image from which it is calculated is not necessarily representative of the total volume of the anode. The samples were examined using computer tomography to determine the total porosity, as shown in
Figure 5.
For the reference Cell 6, the total porosity (open and closed) resulting from the µ-CT is 31.58%. The 2D analysis resulted in a slightly increased porosity for the contact layer of 37.2% and a porosity of 29.8% for the active layer.
3.2.2. Thermal Treated Samples
The SEM/EDX results of Cell 7 and Cell 8 are presented in
Figure 6a,b. These samples were only subjected to thermal stress for a period of 100 and 1000 h, respectively, under dry conditions. The samples were contacted like the samples in regular electrochemical experiments. In the cathode and anode compartments, the respective gases (O
2 and dry H
2) were flowing.
The color bar in
Figure 6 shows the constituent elements of the anode. The grain size in Cell 7 ranges between approx. 1 µm near the interface and approx. 8 µm for some grains in the contact layer. The distribution of the elements Ni and Ce is homogeneous, but nickel coarsening of the grains, especially close to the surface, is observed after just 100 h of aging at 850 °C in a dry atmosphere. Pores are also found on the nickel particles.
The grain size in Cell 8 ranges after 1000 h between approx. 1 µm near the interface and approx. 10 µm for some grains in the contact layer. An inhomogeneous distribution of the elements Ni and Ce over time is observed by comparing Cell 7 and Cell 8. Increased Ni coagulation is observed in the volume but especially on the surface of the anode. The micropores observed after 100 h (Cell 7) disappear when the nickel particles are compacted after 1000 h. A comparison with the reference Cell 6 clearly shows the differences in the microstructure after thermal treatment of 1000 h, with the nickel distribution suffering more than the GDC structure. This is reflected in the strong specific resistance increase on Cell 8 after 250 h, as the loss in contact points leads to a resistance increase.
Images from the anode sections of both cells (not shown) were also used for microstructure analysis, and an initial value for the 2D porosity was calculated. The total porosity (open and closed) resulting from the µ-CT (not shown as the reader cannot extract any information from those pictures) is 31.45% for Cell 7. The 2D analysis presented based on SEM micrograph shows a slightly increased porosity for the contact layer of 33.8% and a porosity of 27.7% for the active layer. For Cell 8, the total porosity (open and closed) resulting from the µ-CT (not shown) is 36.08%. The 2D analysis results in a slightly increased porosity for the contact layer of 36.5% and a porosity of 31.04% for the active layer.
SEM/EDX micrographs of Cell 9 and Cell 10 are presented in
Figure 6c,d. These samples were subjected to thermal stress with humidified atmosphere in the anode compartment for a period of 100 and 1000 h, respectively. The samples were contacted like samples in regular electrochemical experiments. In the cathode and anode compartments, the respective gases (O
2 and humidified H
2 with 3% H
2O) were flowing.
The grain size in Cell 9 ranges after 100 h thermal treatment in humidified H2 between approx. 1 µm near the interface and approx. 10 µm for some grains in the contact layer. A good and homogeneous distribution of the elements Ni, Gd, and Ce was found. The nickel distribution is visually almost the same as the reference Cell 6. Only a slight nickel coagulation is observed on the surface, which is comparable to Cell 7 (dry, 100 h) but without the pores in the coagulated Ni particles observed there. On the other hand, the nickel distribution in Cell 10 (after 1000 h) shows a strong nickel coagulation on the surface, which is, however, less pronounced inside the layer compared to sample Cell 8 (dry, 1000 h). The nickel particles on the surface are coagulated and form elongated, layer-like Ni grains. The concentration of smaller Ni particles is observed around bigger GDC particles.
The total porosity resulting from the µ-CT is 35.63% for Cell 9. The 2D analysis presented based on an SEM micrograph shows practically the same porosity for the contact layer of 35.06% and a porosity of 29.3% for the active layer. For Cell 10, the total porosity resulting from the µ-CT is much higher and reaches 48.91%. The 2D analysis shows practically the same porosity values for the contact layer of 48.3% and a porosity of 36.3% for the active layer.
3.2.3. Electrochemically Treated Samples
SEM/EDX results of Cell 1 and Cell 3 are presented in
Figure 7a,c. These samples were subjected to electrochemical loading in a dry atmosphere for a period of 100 h in a dry and humid atmosphere, respectively. The samples were contacted with platinum on the cathode side and nickel on the anode side. Dry O
2 and H
2 flowed through the cathode and anode compartments at 25 mL/min. The load was kept constant at 230 mA/cm
2 throughout the experiments.
The grain size of Cell 1 ranges between approx. 1 µm near the interface and approx. 6 µm for some grains in the contact layer. A good and homogeneous distribution of the elements Ni, Gd, and Ce is found. The nickel distribution is already impaired after just 100 h as compared to the reference Cell 6. In the volume of the anode layer, only a slight nickel coagulation is observed, but a strong one is observed on the surface.
The grain size in Cell 2 electrochemically treated for 1000 h in dry conditions (
Figure 7b) ranges between approx. 1 µm near the interface and approx. 10 µm for some grains in the contact layer. A severely impaired nickel distribution is found compared to the reference Cell 6. Strong nickel coagulation is observed both in bulk and on the surface. This leads to a kind of compaction of the contact layer as nickel appears to surround the GDC particles. On the other hand, the situation is different when the fuel is humidified (Cell 5,
Figure 7d). A good nickel distribution is observed, but the porosity is increased by 5% (
Figure 8), and the tortuosity is the lowest of all treated cells (
Table 2), meaning that fuel can easily reach many reaction sites on the anode. This is reflected also in the very low specific resistance of the Cell 5 (
Figure 3).
3.3. Total Porosity and Tortuosity Factors
The porosity of Cell 1 resulting from the 2D SEM image is 38.65% for the contact layer and 34.75% for the active layer and thus slightly higher than the 34.63% total porosity calculated from the µ-CT measurements. The total porosity resulting from the µ-CT is 32.69% for Cell 2. The 2D analysis results in a slightly lower porosity for the contact layer of 29.15% and a porosity of 32.91% for the active layer, confirming the visually determined compaction of the anode. Analogous results are obtained for Cells 3 and 5. The total porosity based on µ-CT increases between 1–5% depending on the treatment, as shown in
Figure 8.
In
Table 2, the tortuosity factors for all cells are tabulated. The tortuosity factors increase at the beginning of the treatment (100 h) and relax with time.
4. Discussion
The cells were then examined for microstructural changes using FESEM and µ-CT, and the results are correlated with the ones of long-term electrochemical experiments. In the thermal tests, the porosity increases more strongly with humidified fuel gas with time, regardless of whether the current is drawn or not. This can be attributed to an increased reaction rate of reaction R2 (v.i.), which runs preferably under these conditions. Further, in dry conditions performed thermal tests, coarsening seems to be the main reason for degradation, especially at the beginning of the treatment coarsening is obvious (
Figure 6a). Overall, we observed that, with only thermal loading, the increase in porosity is higher than in the electrochemical tests. This can be ascribed to some nickel losses due to the higher mobility of the volatile nickel hydroxide species, as reported by Hagen et al. [
3].
In contrast to nickel microstructure, which is strongly changed due to the nickel coagulation and maybe losses in thermal treatment, the GDC microstructure remains largely intact even after 1000 h. The increased porosity under humid conditions does not affect the specific resistance in the electrochemical experiments as it does not so dramatically change the percolation in the Ni and GDC subnets. A sufficient nickel distribution with humidified fuel gas leads to a lower specific resistance of the cell despite an increase in porosity.
The tortuosity in the two directions (2 and 3) is not perpendicular to the electrolyte (direction 1) and either remains unchanged or decreases slightly, consistent with the above statement that the GDC framework largely persists. The tortuosity factor increases significantly perpendicular to the electrolyte, probably due to the strong nickel coagulation on the anode surface, which is obvious in compacted anode layers in SEM micrographs (e.g.,
Figure 7b). This hinders the access of fuel to the active layer and leads to the increased specific resistance of all cells with time (
Figure 3).
Since the molar volume of Ni is only 60% compared to that of NiO, reducing the anode initially increases the porosity. However, this also represents a weakening of the entire anode structure and thus promotes later compaction of the anode over time due to high-temperature creep and diffusion processes. The clamping pressure applied to contact the electrodes does not appear to have a significant influence on the anode microstructure since, in this case, the tortuosity in directions 2 and 3 should also increase over time. It is also clear that the tortuosity in direction 1 (
Table 2), which increases extremely after 100 h, relaxes over time and almost returns to normal values. An explanation of this phenomenon is not possible with the available data and would be only a matter of speculation. For example, creep processes in the percolated Ni particles, or localized redox processes that cause an increase in the porosity due to the difference in the molar volume of Ni and NiO could be possible explanations for the relaxation of the microstructure. As reported by Matsoui et al. [
41] for Ni–YSZ anode electrodes, it is also possible that the anode degradation could be due to surface oxidation (R1 and R2) of nickel owing to the higher local partial pressure of steam close to electrochemically active sites [
42,
43].
The question that now needs to be answered is why the tortuosity increases in direction 1 and why the nickel prefers to collect on the surface. Capillary forces are unlikely to play a role because the temperatures are not sufficient to give the nickel the necessary flowability. However, the temperatures are sufficient to influence the Ni creep behavior [
44,
45], which is strongly determined by diffusion processes in the nickel polycrystals. According to Maier et al. [
46], the nickel self-diffusion coefficient at 830 °C is 3.74 × 10
−13 cm
2/s, which corresponds to an average diffusion depth of approx. 2.76 µm/h. At approx. 890 °C, the average diffusion depth is 3.5 µm/h. These values are more than sufficient to create the image observed after several 100 h in the anodes of this study.
The nickel coagulates in large, flat “grains” on the surface or around larger GDC particles. The above-mentioned diffusion coefficients, which are relatively large under the prevailing thermodynamic conditions, favor coarsening and/or Ostwald ripening, whereby larger grains grow more strongly to the disadvantage of smaller ones due to their energetic stability and thus lead to abnormal grain growth under formation of pores. This can also explain the observed microporosity in nickel grains, e.g., [
41]. This seems to be the only logical explanation for Ni coagulation toward the surface under these conditions. It influences the tortuosity in direction 1 up to 1000 h, but the GDC framework holds (at least up to the upper time limit of 1000 h in this study), and the tortuosity in directions 2 and 3 either remains unchanged or decreases slightly as the pores had been covered with nickel during the experiment. The fact that the coagulation is already very strong after 100 h and does not increase linearly up to 1000 h is probably due to the so-called strong chemical interaction between Ni and GDC (Strong Metal–Support Interaction—SMSI) [
32], which may result in a total withdrawal of nickel from the anode cermet.
Electrochemically, the situation is such that the specific resistance under wet conditions is the same as in the thermal test. From an “electrochemical” perspective, given the electrochemical boundary conditions chosen in this study, there is no big difference between dry and wet electrochemical aging. On the other hand, under dry conditions, a strong increase in specific resistance was expected, analogous to the dry thermal aging test. However, in the dry electrochemical test, the specific resistance does not increase as significantly as in the thermal test. This is probably because, in electrochemical experiments, there is always a certain amount of moisture on the anode side due to the water that is produced in the anode department. Given the selected test conditions, this is sufficient to lead to a high proportion of moisture in the anode department due to the high fuel utilization of approx. 60% (determined by mass spectroscopy).
5. Conclusions
The goal of the present study was to quantify microstructure degradation phenomena on anodes that can be attributed to chemical and/or electrochemical sintering, to possibly find out the underlying mechanisms, and to propose countermeasures. It has been shown that it is possible to distinguish between the thermal (chemical) and the electrochemical part of the microstructure degradation. Humidity is an important factor that affects the microstructure in the long term. This was obvious during the dry electrochemical test, where the results were better than expected due to the water that was produced during the reaction.
The samples have been thermally aged for times from 0 to 1000 h, and additional samples of the same type are subjected to electrochemical loading over the same period in dry and humid conditions.
Tortuosity and porosity change with time depending on the humidity of the fuel, and the EIS results confirm through the increasing specific resistance the influence of the changes on the microstructure on the electrochemical properties of the cells.
It has been found that there is a difference in the microstructure and degradation of the cells if we perform a typical chemical (thermal) treatment or if we draw current in a typical electrochemical experiment. This is the case, for example, during the formation of the cell or the stack. This must be performed in a time as short as possible.
Humidity plays an important role in this degradation process as it helps keep the specific resistance very low compared to the higher specific resistance in dry conditions.
Electrochemical experiments lead to a different picture of the microstructure and specific resistances. We performed EIS after 25, 50, 100, 250, 500, 750 and 1000 h). These data show that during the long-term electrochemical experiments, the microstructure and, thus, the cell performance (specific resistance) change. A more detailed EIS study using the distribution of relaxation time (DRT) method [
32] will follow in order to show the development of different physicochemical processes involved in the measured overall specific resistance.
Additional modeling and experimental work with several samples under changing conditions needs to be performed in order to be able to elucidate the exact mechanisms of porosity and tortuosity changes and correlate them with electrochemical analysis data for achieving a more general degradation model of SOFC anodes.


