Article

Study on the Seismic Response of Shield Tunnel Structures with the Preload Loss of Bolts

1
State Key Laboratory of Intelligent Geotechnics and Tunnelling, College of Civil and Transportation Engineering, Shenzhen University, Shenzhen 518060, China
2
Key Laboratory of Coastal Urban Resilient Infrastructures, Ministry of Education, Shenzhen University, Shenzhen 518060, China
3
China Railway 22nd Bureau Group Shenzhen Construction Co., Ltd., Shenzhen 518107, China
*
Author to whom correspondence should be addressed.
Appl. Sci. 2023, 13(23), 12889; https://doi.org/10.3390/app132312889
Submission received: 30 October 2023 / Revised: 23 November 2023 / Accepted: 25 November 2023 / Published: 30 November 2023
(This article belongs to the Section Civil Engineering)

Abstract

:
Shield tunnels can experience preload loss in their connecting bolts during the operational phase, leading to changes in tunnel structure stiffness, which, in turn, affect the seismic performance of shield tunnels. A refined three-dimensional model of shield tunnel was established using the finite element method to study the impact of preload loss in connecting bolts on the seismic dynamic response of shield tunnels. An artificial viscoelastic boundary was used to simulate the propagation of seismic waves from an infinitely distant field. This study investigated the effects of different levels of preload loss on the seismic response of shield tunnels. In addition, the Arias intensity, which can reflect the degree of seismic impact on structures, was used to analyse the extent of damage to the tunnel. The conclusions drawn from the study are as follows: As the level of preload loss increases, the tightness of the segments during the static phase gradually deteriorates, and the maximum joint opening during the seismic loading phase continues to increase. Post-earthquake non-recoverable ellipticity and radial deformation progressively increase with an increase to preload loss level. Overall tunnel damage becomes more significant with the degree of preload loss increases depending on the Arias intensity. Preload loss leads to a decrease in the overall structural stiffness and an increase in longitudinal relative displacement. In conclusion, preload loss also affects structural failure mode and seismic performance. These research findings are of reference value for enhancing the seismic performance of shield tunnel structures and ensuring engineering safety.

1. Introduction

Shield tunnelling is an efficient, fast, and environmentally friendly method for underground transportation construction [1,2]. The method has become an indispensable part of urban infrastructure development in the process of urbanization. Seismic resistance was not considered when building underground structures in the past. However, seismic safety for these structures has gained significant attention with increasing instances of seismic damage to underground structures. A shield tunnel is a typical underground structure. The seismic dynamic responses of shield tunnels have become a current research hotspot [3,4].
Extensive studies on shield tunnels have been conducted using various methods, including theoretical analysis, numerical simulations, and shake table tests. Geng et al. and He et al. [3,5,6] proposed the modified seismic coefficient method for internal forces in deep-buried tunnel structures subjected to seismic effects. Regarding the dynamic response of shield tunnels, researchers have not only conducted extensive research on the tunnel’s structure but also analysed various factors that could potentially influence the seismic performance of the tunnel. Xu et al. [7] investigated the impact of damping layers on the dynamic response of tunnels, confirming that a damping layer can effectively reduce the seismic response of a tunnel’s secondary lining. Zhang et al. [4] studied the influence of key segment positioning on the mechanical characteristics of tunnel structures and further proposed an optimization scheme for shield tunnel segment assembly. Dong et al. [8] established a shield tunnel model that incorporates segment joints and analysed the impact of segment types on the seismic response of tunnel structures. Xu et al. [9] employed numerical simulation to analyse the seismic response of tunnels at various burial depths, taking into account seismic peak intensity and concrete strength. Liu et al. [10] utilized the finite element method to analyse the dynamic response of subway shield tunnels under the influence of the El-Centro earthquake. Wang et al. [11] investigated the structure–soil interaction of shield tunnels in complex geological strata, as well as the damage characteristics of tunnel structures under seismic effects. In addition, researchers have also conducted relevant studies using shake table tests. Liang et al. [12] designed shake table tests to study the characteristics of seismic wave propagation in different strata and discovered a turning point in the seismic wave amplification factor. Given the substantial size of actual shield tunnel segments and their complex joints, it is challenging to simulate experiments for long-distance shield tunnels. Bao et al. [13] proposed a method to simplify long-distance shield tunnels into equivalent rings and homogeneous circular rings, providing a reference for the design of shake table tests for complex shield tunnels. Tao et al. [14] conducted large-scale shake table tests based on subway structures, using the seismic response of cast-in-situ subway stations as a reference, to study the seismic performance and response of subway structures. Currently, researchers primarily focus on factors affecting the seismic performance of shield tunnels, including assembly methods, geological conditions (soft soil, hard rock), and seismic wave characteristics (seismic frequency, peak ground acceleration). There is limited research on the influence of joint performance in shield tunnels.
As discontinuous structures, shield tunnels use bolts to connect adjacent segmental blocks. Therefore, the effectiveness of bolted connections directly affects the overall stiffness of shield tunnels. The relative stiffness between the structure and the foundation is one of the decisive factors affecting the performance of shield tunnels under seismic loading. Hence, the performance of connections directly influences the seismic performance of shield tunnels. In recent years, high-strength bolts have been widely used in shield tunnel engineering due to their excellent durability and load-bearing capacity. Preload is applied to connect the adjacent segments by applying a specific torque to high-strength bolts, greatly improving the initial stiffness of the shield tunnel. This compensates for the weakening of the overall stiffness of the structure due to connections. However, the preload of bolts would experience varying degrees of loss during the construction and use of shield tunnels [15]. The reasons for preload loss include construction errors, temperature changes, long-term formation load, and long-term vehicle vibration. It is not difficult to see that there is a significant risk of preload loss in the bolts of shield tunnels during long-term operation.
Zhang et al. [16] obtained the variation laws of bending moments and stress on bolted joints considering preload under static loads by using finite element method. Zhu et al. [17] analysed the influence of different bolt forms on the load-bearing performance of joints via full-scale testing methods. Zhang et al. [18,19] found that bent bolts had better overall performance under different bending moments and axial force conditions compared with straight bolts and inclined bolts. The results show that preloading can enhance the mechanical characteristics of bent bolt joints by strengthening the bolt’s capacity to secure the pipe seam and minimize the overall structural deformation. Sun et al. [20] analysed the effect of bolt preload on convergence deformation. The results found that insufficient bolt preload could lead to reduced longitudinal seam rotational stiffness, indirectly affecting the overall circumferential stiffness of the tunnel. Currently, extensive research has been conducted on the preload of shield tunnels [21,22,23,24,25]. Previous studies have shown that the loss of preload significantly affects the overall stiffness of shield tunnel structures. However, the current research primarily focuses on static analysis of preloading. There is still a significant gap in the study of the dynamic response of shield tunnel structures after preload loss.
Therefore, in this research, the finite element method was used to establish a three-dimensional refined model of shield tunnels. The relationship curve between bolt preload force and temperature was determined and uses a cooling method to assign different initial preload forces to the bolts. Furthermore, artificial viscoelastic boundaries are introduced to consider the seismic loads from an infinitely distant field. This allows for the investigation of the seismic performance of shield tunnels under preload force loss conditions. This study can provide valuable insights for the seismic design of shield tunnels, enhance the awareness of preload force among engineering professionals, and serve as a reference for the assessment of seismic resilience in shield tunnels.

2. Numerical Simulation

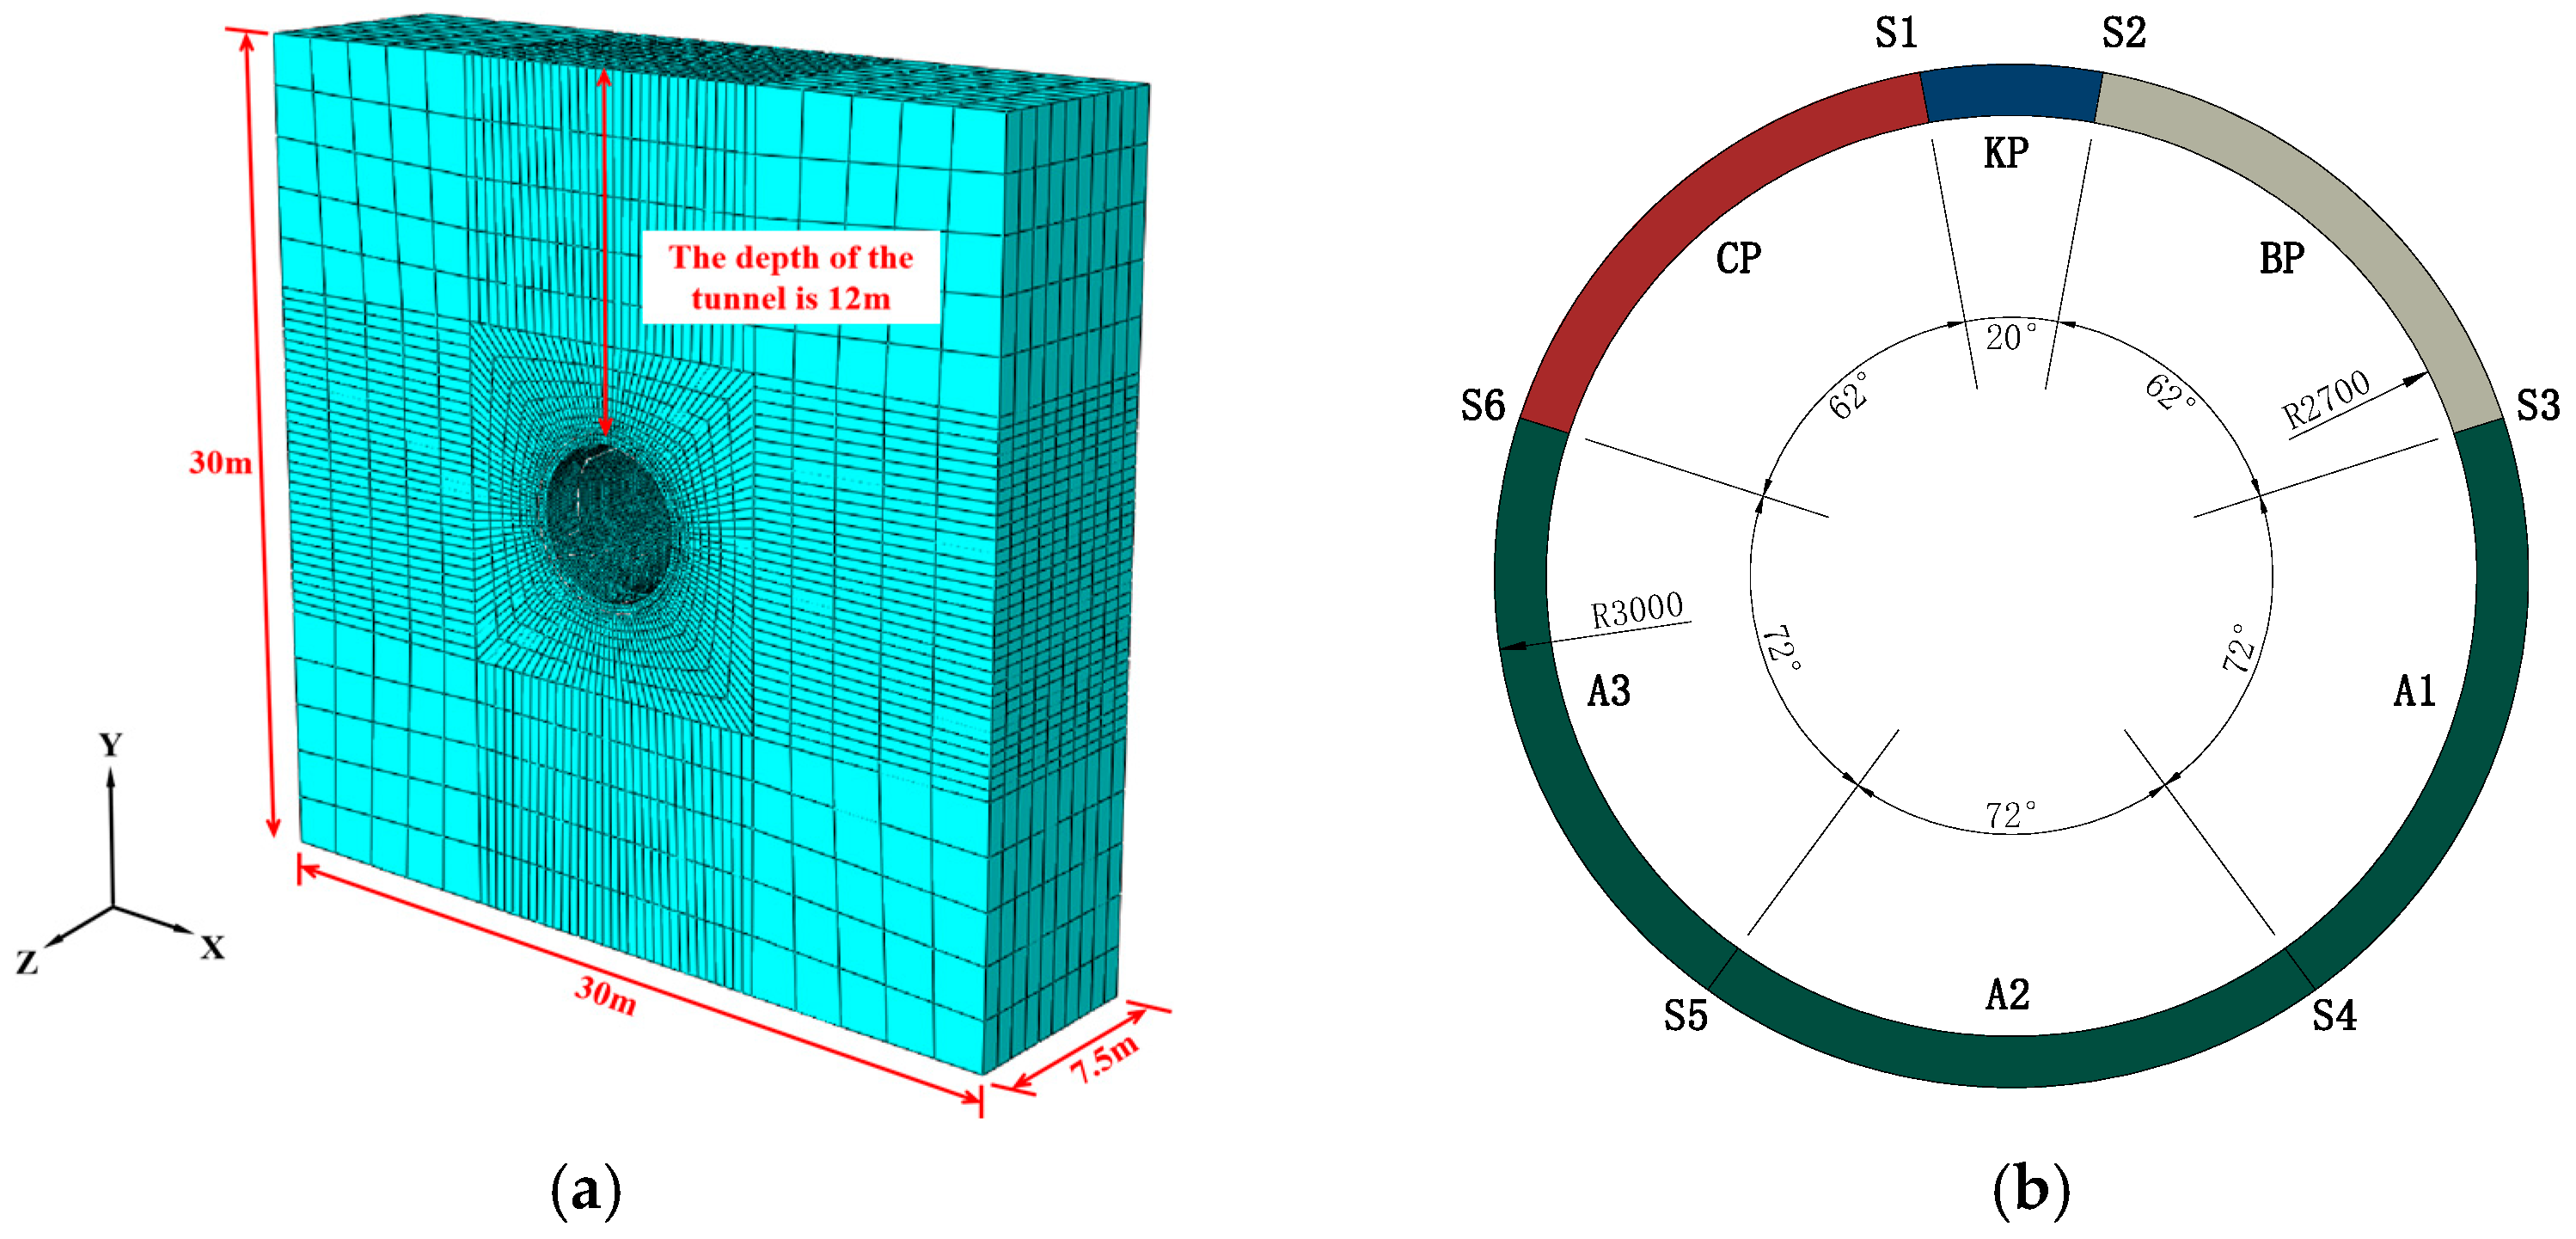
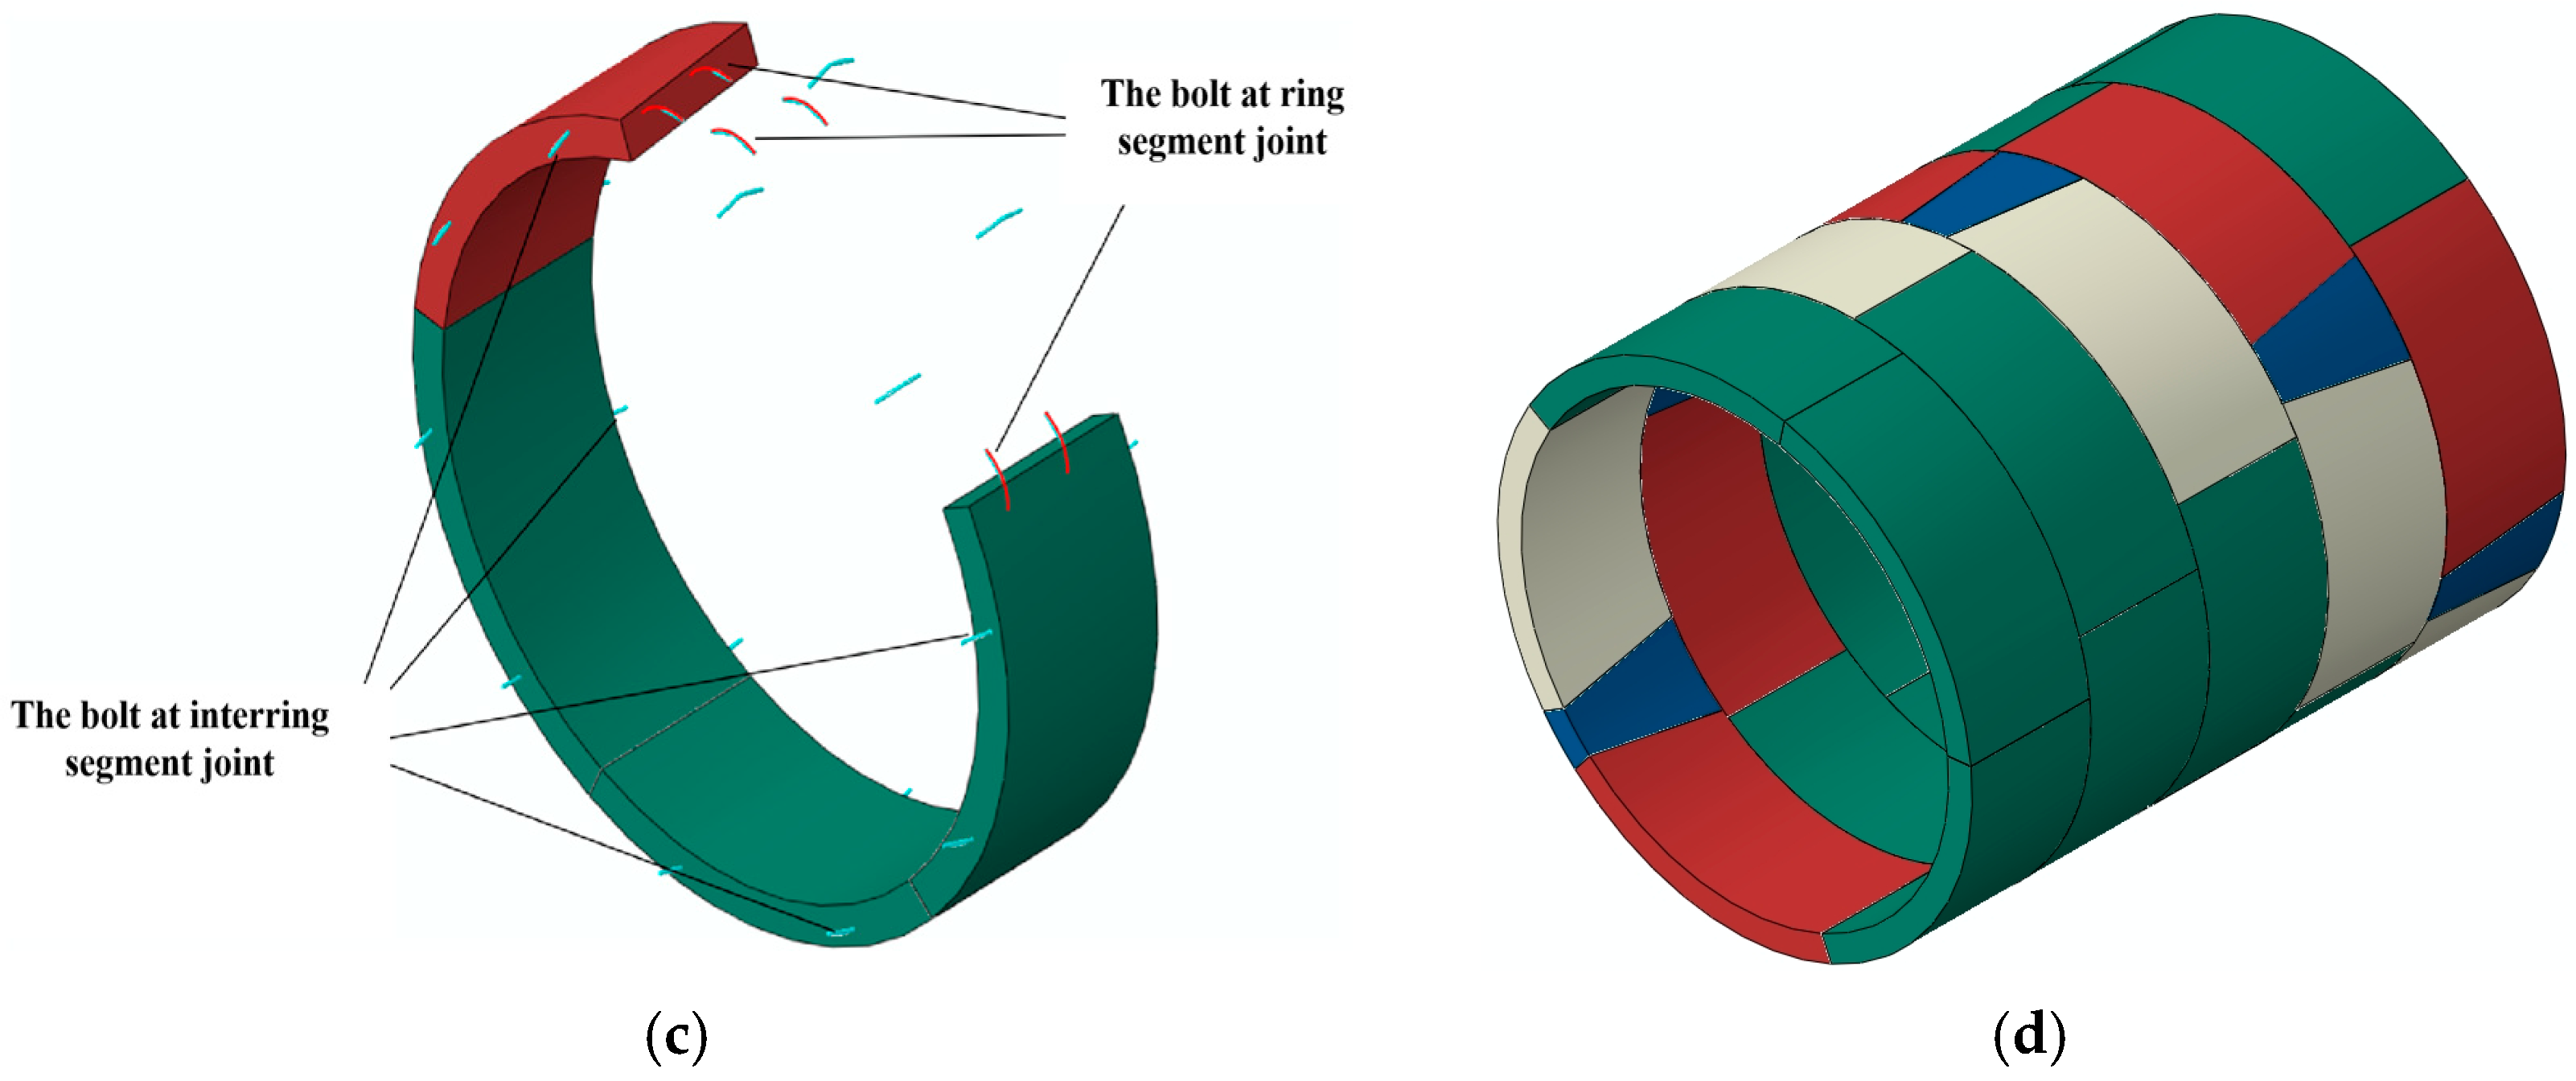
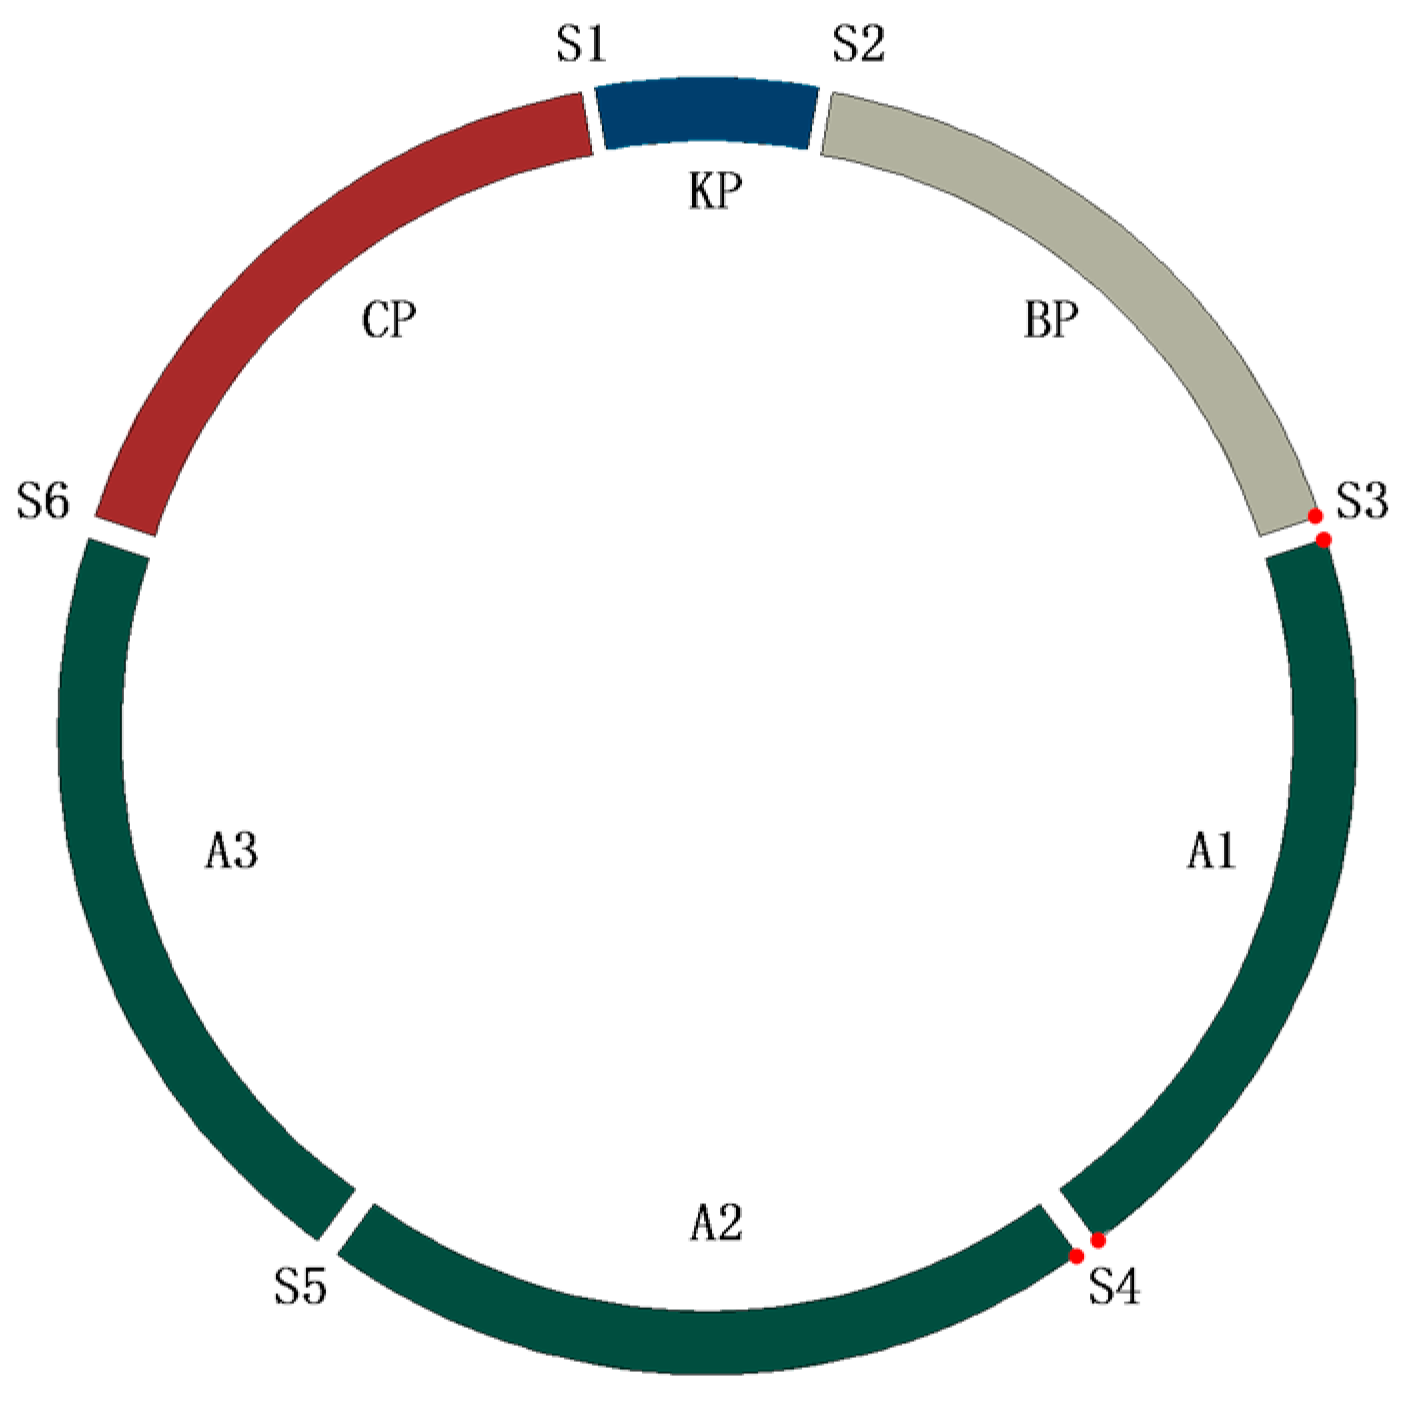
2.1. Soil-Shield Tunnel Model

A 3D model of the soil-tunnel is established, as shown in Figure 1a. The dimensions of the strata are 30 m (width) × 30 m (height) × 7.5 m (length). The tunnel is buried at a depth of 12 m. The outer boundary distance from the tunnel is twice the tunnel diameter to effectively avoid the boundary effects [26,27]. The shield tunnel dimensions are depicted in Figure 1b, with an outer diameter of 6 m, an inner diameter of 5.4 m, a segment thickness of 0.3 m, and a ring width of 1.5 m. A single tunnel ring is composed of six segments, including three standard segments (A1/A2/A3), two adjacent segments (CP/BP), and one key segment (KP). The segments of each ring are connected with 12 pieces of grade 8.8 circumferential bolts. Adjacent rings are connected via 10 pieces of grade 8.8 longitudinal bolts, as shown in Figure 1c. Five rings of the shield tunnel have been selected for the study. The segments between adjacent rings are staggered with a deviation angle of 72°, as shown in Figure 1d.

2.2. Material Parameters

The high-strength bolts are simplified using beam elements. The material constitutive model adopts a double line elastoplastic strengthening model, with an elastic modulus in the plastic hardening phase set to 1/100 of the elastic modulus in the elastic phase. The nominal diameter of the grade 8.8 ultra-high-performance bolt is 30 mm, with a tensile strength of 800 MPa and a yield strength of 640 MPa. A concrete damaged plasticity (CDP) constitutive model is used to reflect the nonlinear behaviour of concrete segments. The dilatancy angle is set to 38°. The uniaxial stress–strain curve for concrete materials is determined based on the Chinese national standard GB50010-2010 (Code for Design of Concrete Structures) [28]. The concrete parameters are listed in Table 1.
A Mohr–Coulomb constitutive model is employed to describe the behaviours of uniform strata. The dilatancy angle is 0.01°, and the friction angle is 40°. For meshing, both the concrete segments and the soil are represented using three-dimensional hexahedral eight-node solid elements (C3D8R). The physical and mechanical parameters of the materials are listed in Table 2.
There are three types of contact in this model. Contact between adjacent segments and contact between the strata and the tunnel both use surface-to-surface contact. The surface-to-surface contact employs a Coulomb friction with a friction coefficient of 0.35 for tangential contact. It employs a hard contact for normal contact, allowing for separation after contact. The connection between the segments and the bolts is achieved via embedded contact, meaning that beam elements representing the bolts are embedded within the solid concrete segments.

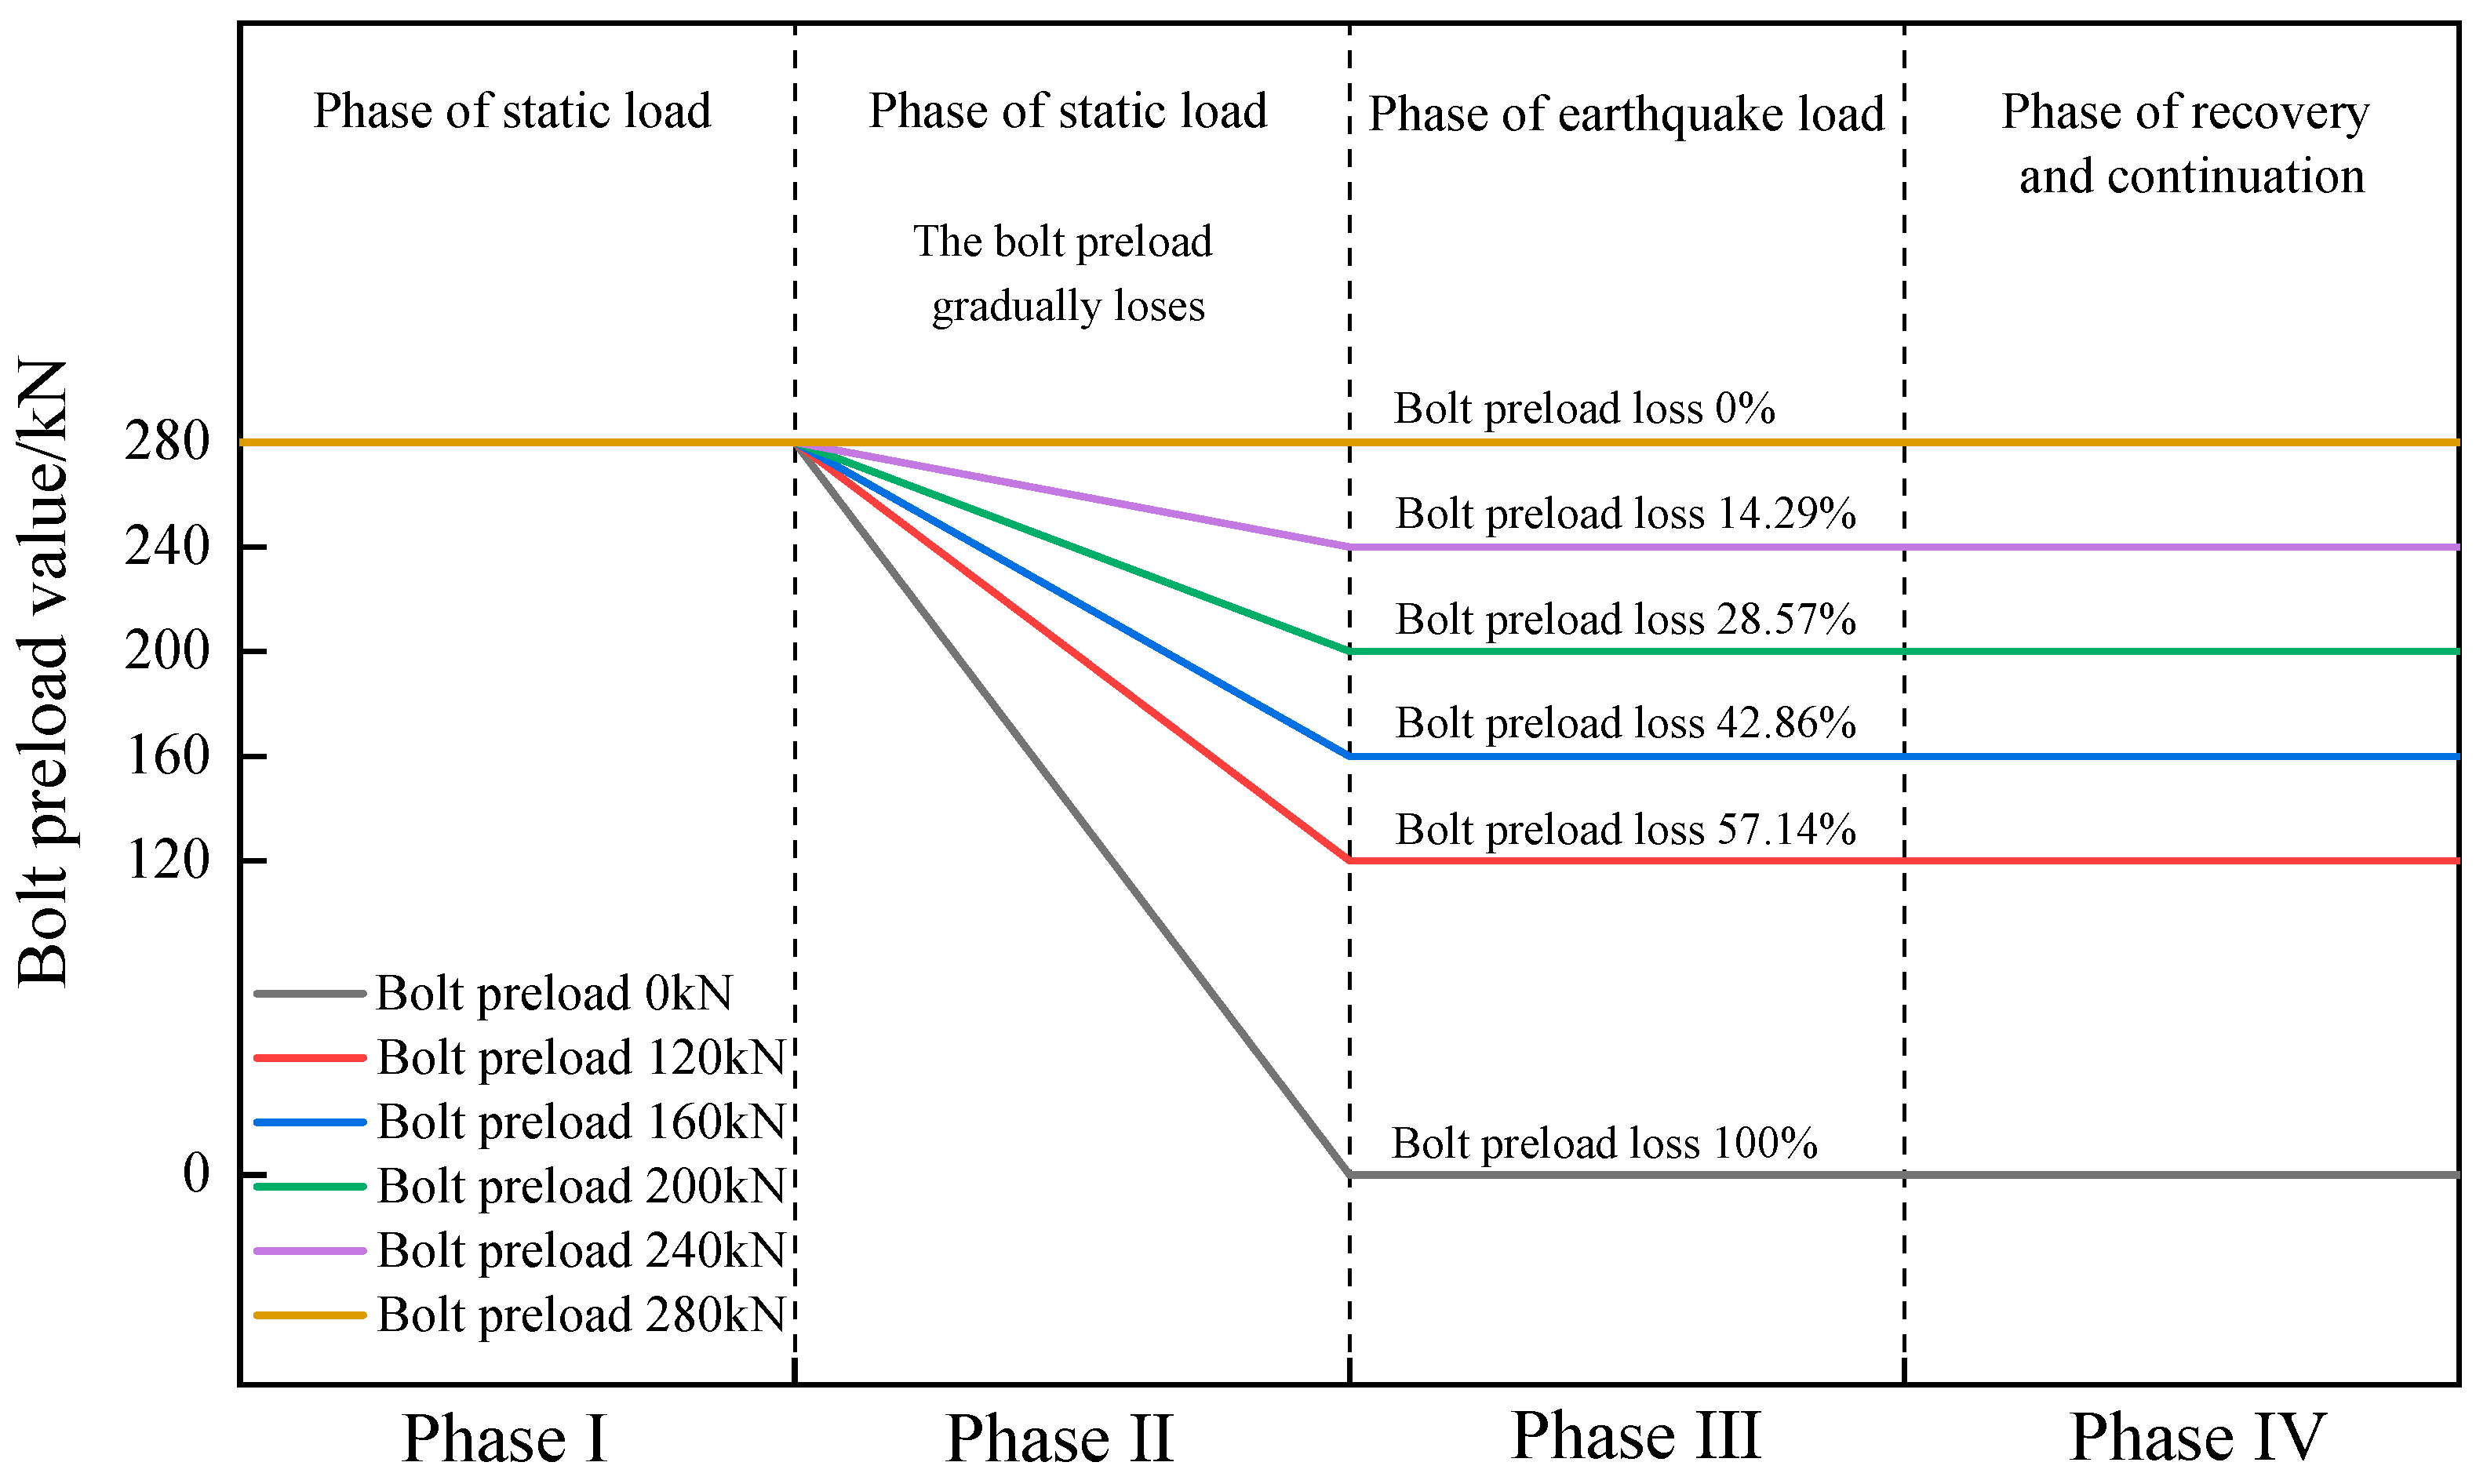
2.3. Method of Applying Preload

There are several methods to apply preload to the steel bars, including the multi-points constraints method, initial stress method, rebar layer method, assembly load method, and cooling method. The cooling method leverages the thermal expansion and contraction properties of steel. It applies temperature loads to the preload steel bars, causing them to contract. It can provide a certain level of preload to the concrete [29]. The cooling method is used to apply preload to high-strength bolts in this study. The coefficient of thermal expansion for steel is taken as 1.25 × 10⁻⁵ m/°C. A linear relationship is established between the temperature load values applied to the bolts and the preload values. During the elastic yield stage of the preload bolt material, a decrease of 1 °C corresponds to a preload value of 1855.503 N applied to the high-strength bolts when preload is applied using the cooling method. The preload value specified in the standards for high-strength bolts is 280 kN [30], corresponding to a temperature stress value of 150.902 °C. The preload values at different temperatures are as shown in Table 3.
Figure 2 illustrates the progression of applying bolt preload. In the first stage, the high-strength bolt preload is applied under static loading conditions, set at 280 kN (no preload loss has occurred during this stage). The second stage simulates different degrees of preload loss, where the preload values change from initial values to various loss degrees as listed in Table 3. The third stage is the seismic loading stage. The fourth stage is the period after seismic loading, which includes recovery and continued usage.

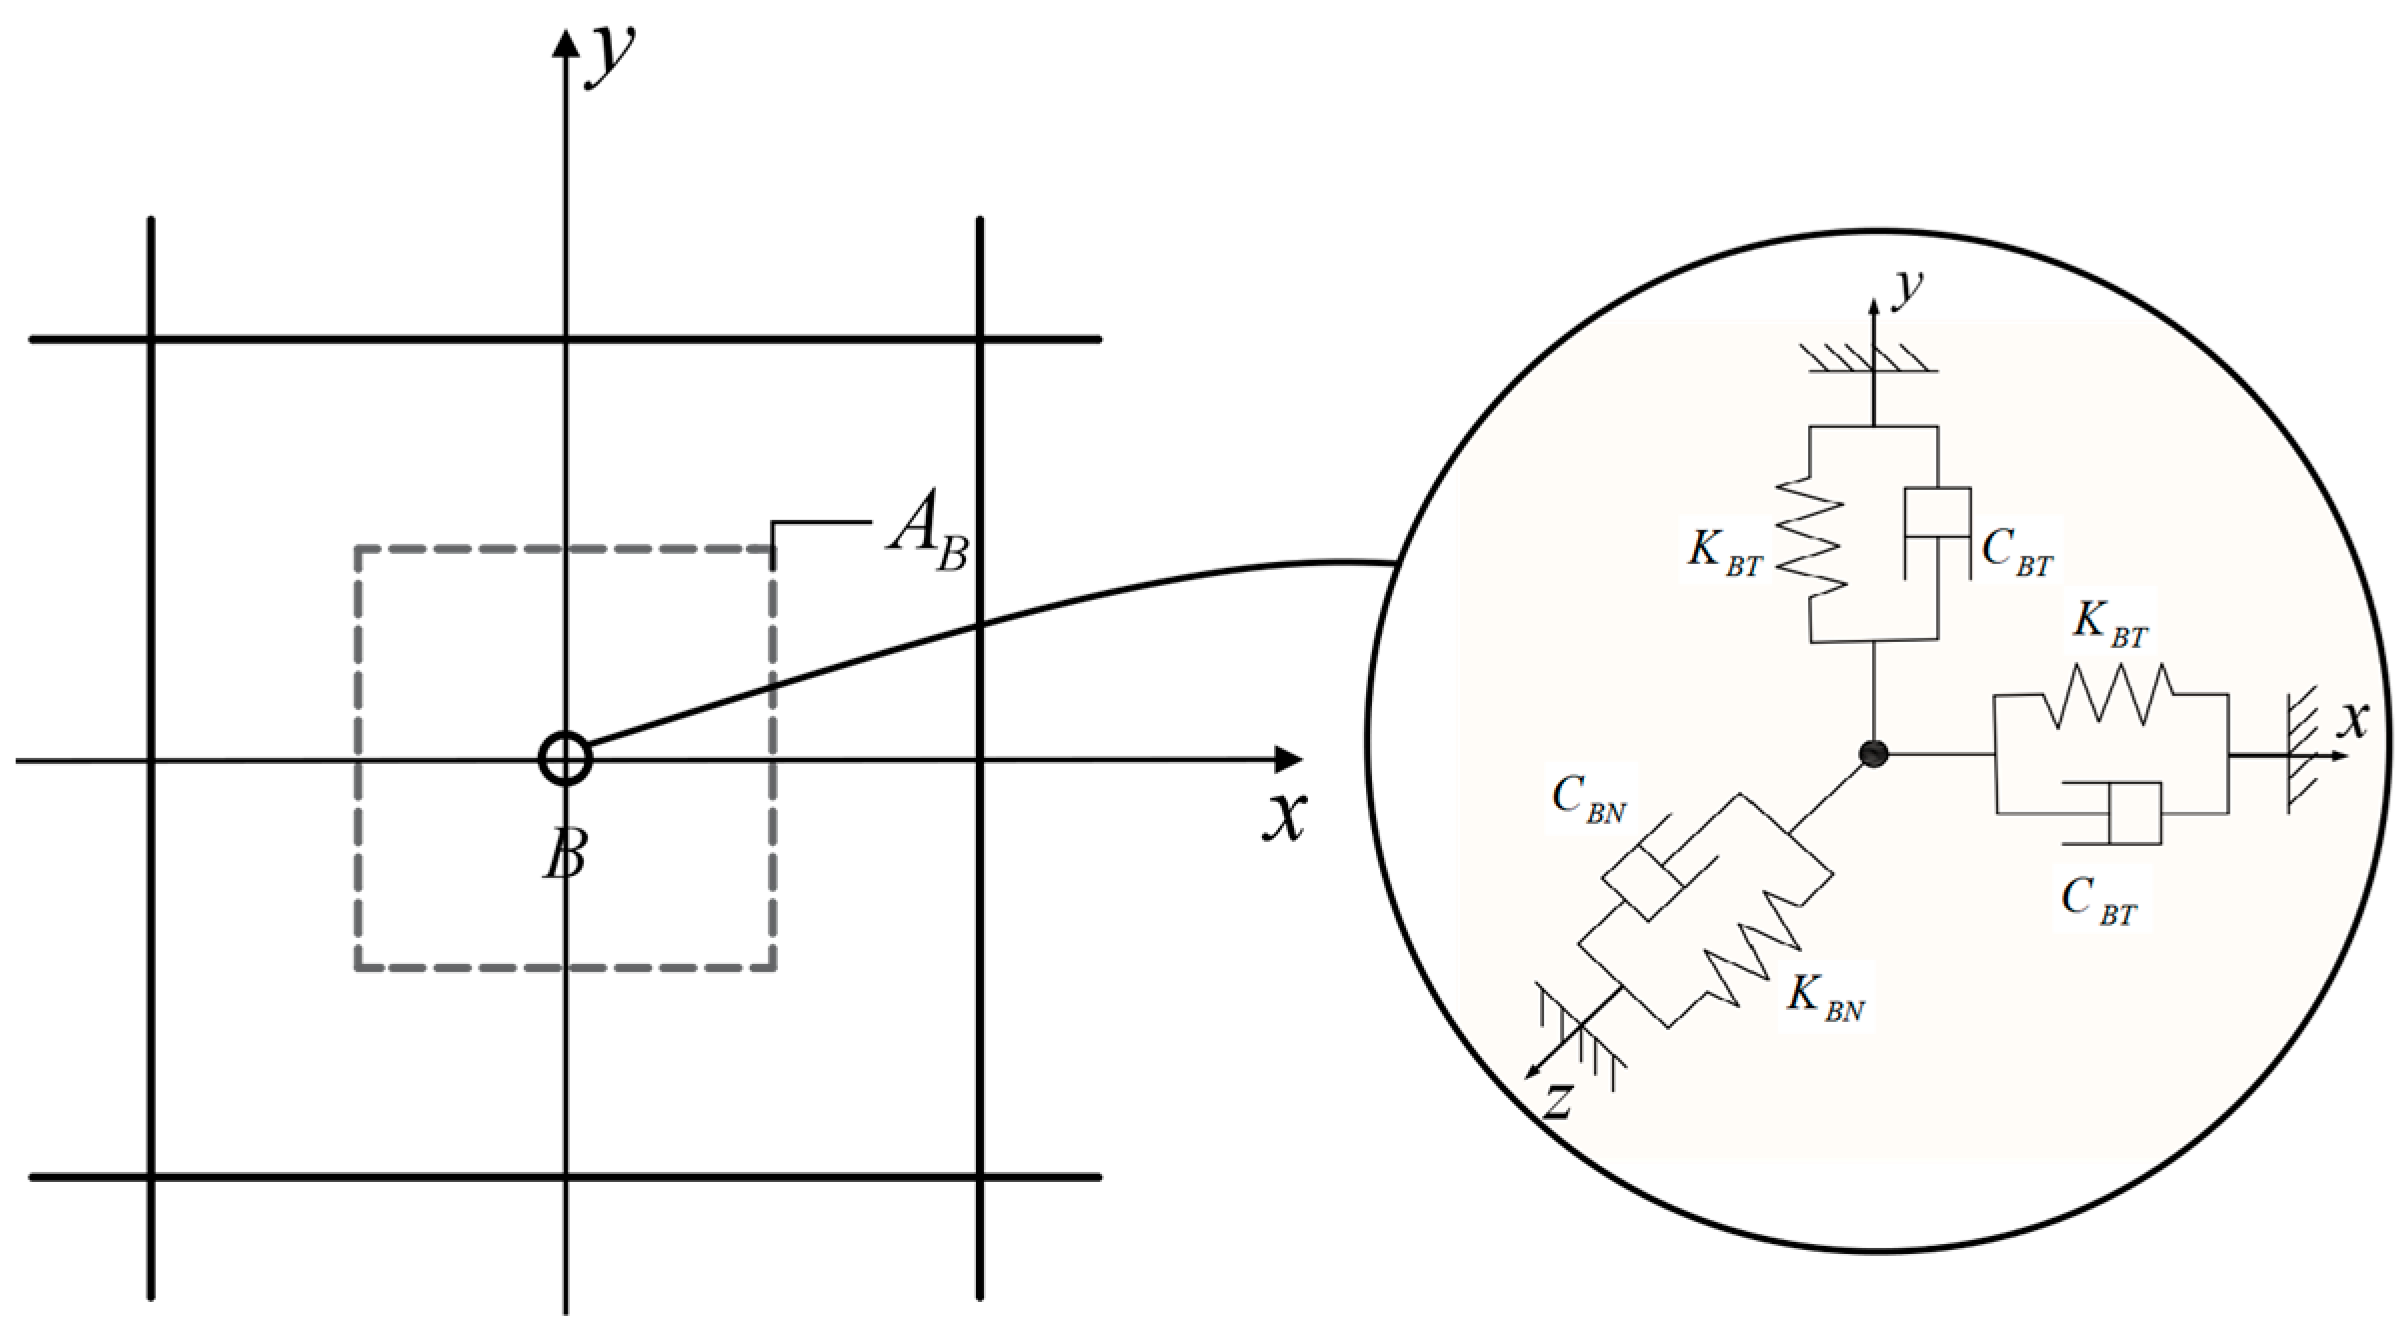
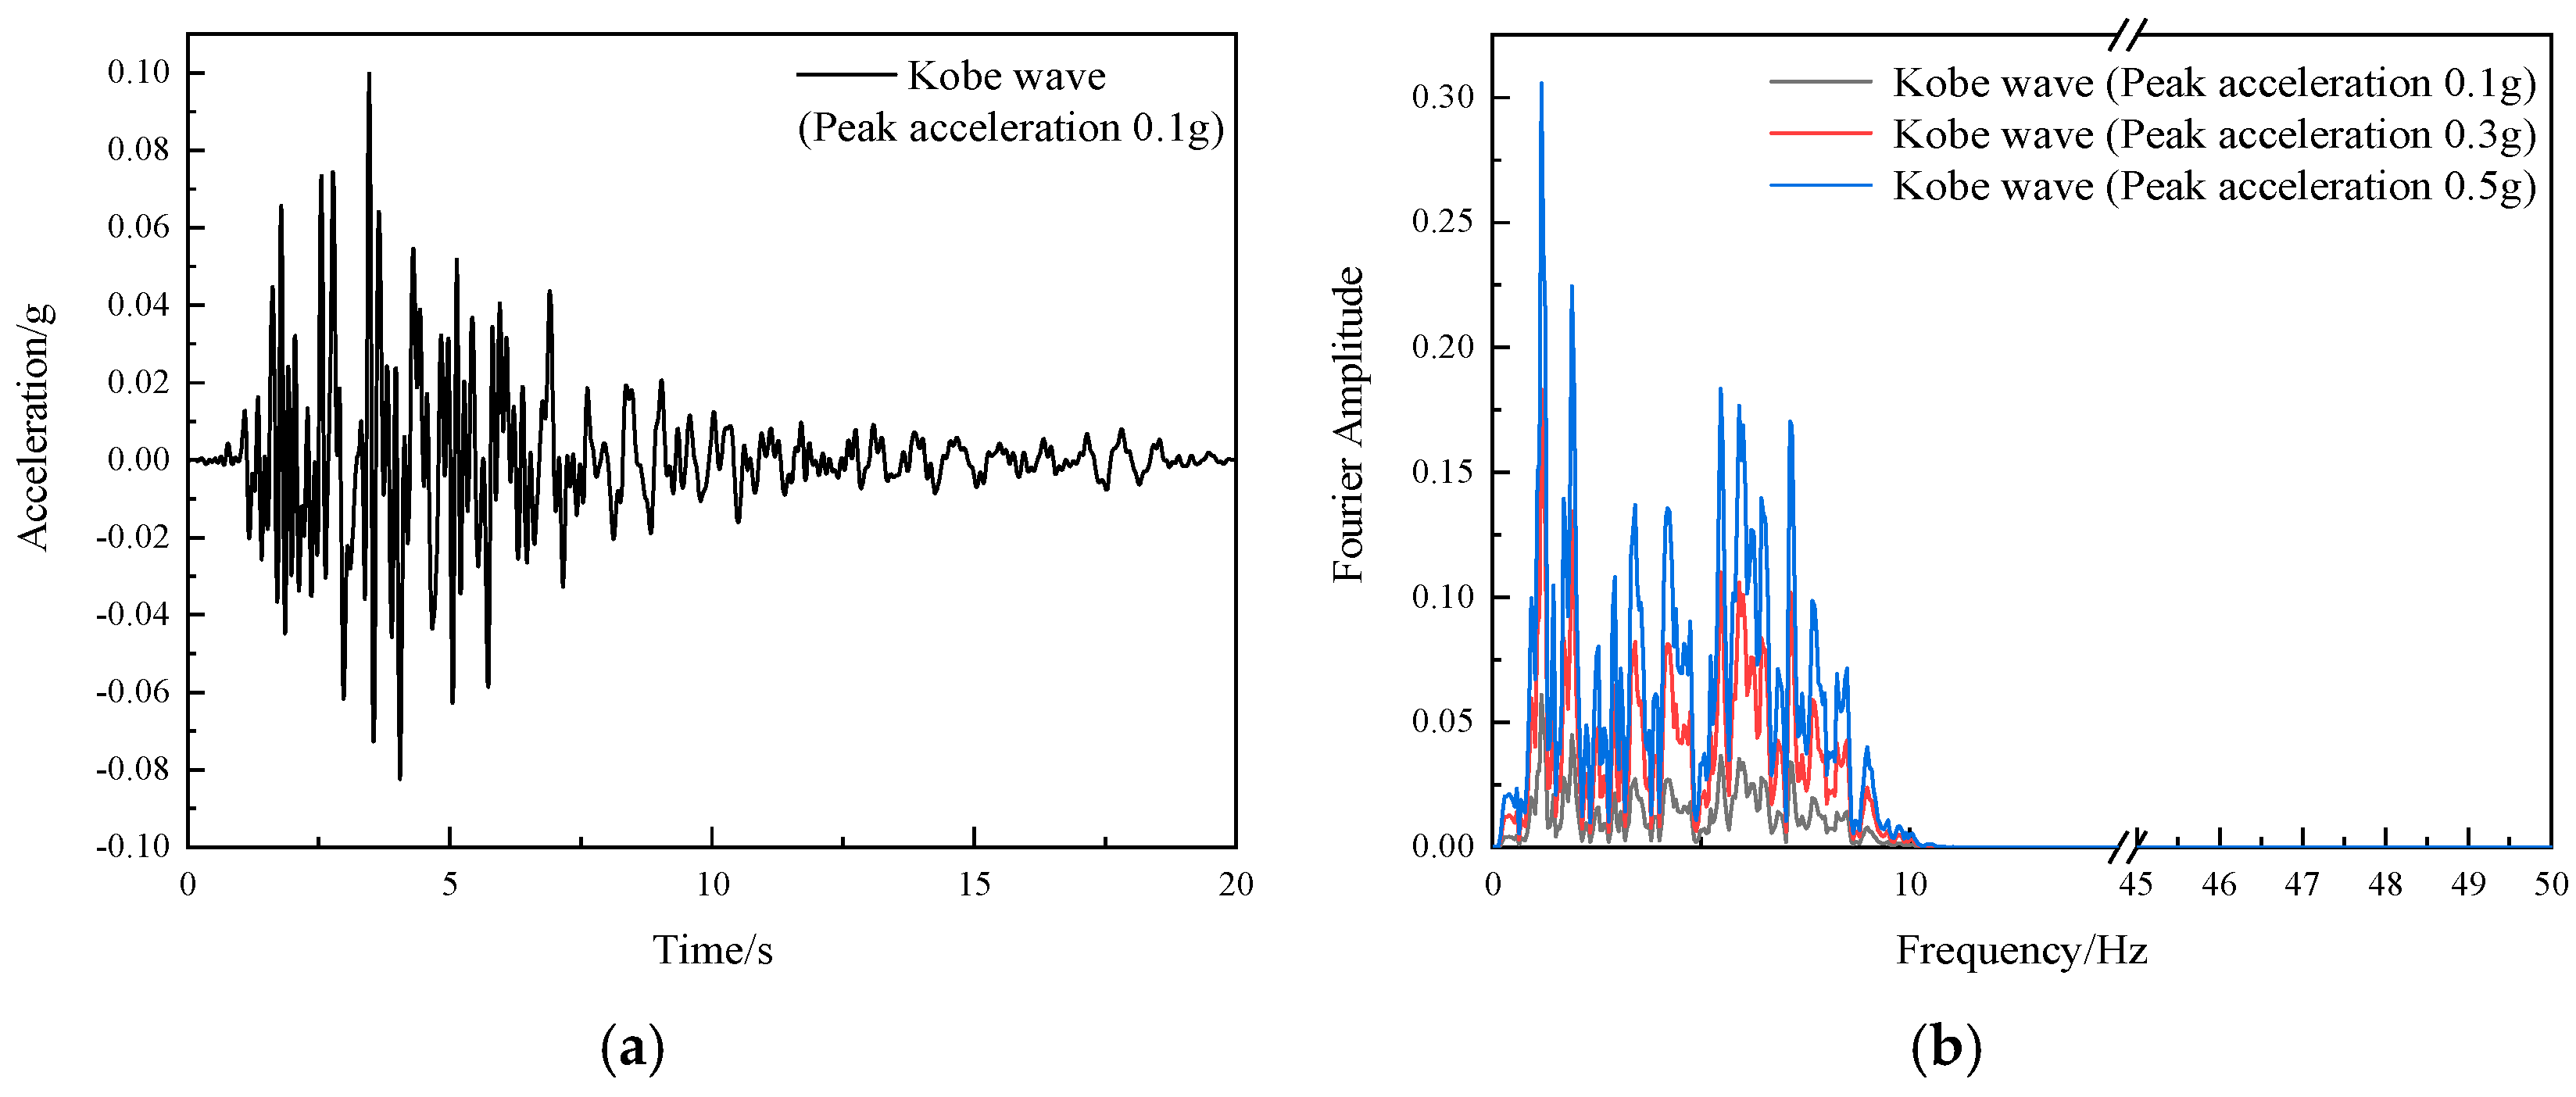
2.4. Seismic Wave and Boundary Conditions

Seismic energy should be dissipated into the far-field foundation under seismic loading. Therefore, it is necessary that outgoing scattering waves do not reflect at the finite domain boundaries of the model. Artificial viscoelastic boundaries can absorb the energy radiating outward from the computation domain. Hence, artificial viscoelastic boundaries not only can effectively simulate the radiation-damping effects of semi-infinite space media, but also provide a good representation of the elastic-restoring behaviour of semi-infinite foundations [31]. Simulating infinite boundaries is achieved by applying three-directional spring dampers to finite element mesh nodes, as illustrated in Figure 3.
The formulas for calculating the mechanical parameters of springs and dampers are as follows:
K B T = α B T G R , C B T = ρ C S K B N = α B N G R , C B N = ρ C P
where K B T , K B N are the stiffness coefficients of the tangential spring and normal spring, respectively; C B T , C B N are the damping coefficients of the tangential damper and normal damper, respectively; α B N is the correction factor for the normal spring stiffness, and its value is 1.33; α B T is the correction factor for the tangential spring stiffness, and its value is 0.67; G is the shear modulus of the medium, ρ is the density of the medium; R is the distance from the wave source to the artificial boundary node; C S , C P represent the shear wave velocity and longitudinal wave velocity of the medium, respectively.
The spring dampers cannot constrain boundary displacements. Therefore, seismic loads need to be applied in a concentrated manner on nodes. The node influence area is determined by applying a unit load to the model, as shown in the following:
F B = ( K B u B f f + C B u ˙ B f f + σ B f f n ) A B
where K B is the spring stiffness; C B is the damping coefficient; σ B f f is the stress tensor in the free field; u B f f = [ u   v   w ] is the displacement vector in the free field; u ˙ B f f = [ u ˙   v ˙   w ˙ ] is the velocity vector in the free field; n is the cosine vector in the outward normal direction to the boundary; A B is the cosine vector in the outward normal direction to the boundary [32,33,34,35].
Kobe waves with peak ground accelerations (PGA) of 0.1 g, 0.3 g, and 0.5 g were selected for the study based on the current national standard GB 50909-2014 (Seismic Design Code for Urban Rail Transit Structures) [36]. The acceleration time history and Fourier spectrum curve for the 0.1 g peak ground acceleration Kobe wave are shown in Figure 4. The time histories for 0.3 g and 0.5 g accelerations can be obtained via scaling. The seismic waves have a duration of 20 s. The selected Kobe wave has a peak ground acceleration that occurs at 3.46 s into the seismic wave. It should be noted that seismic waves are input at the bottom of the model in the form of shear waves.

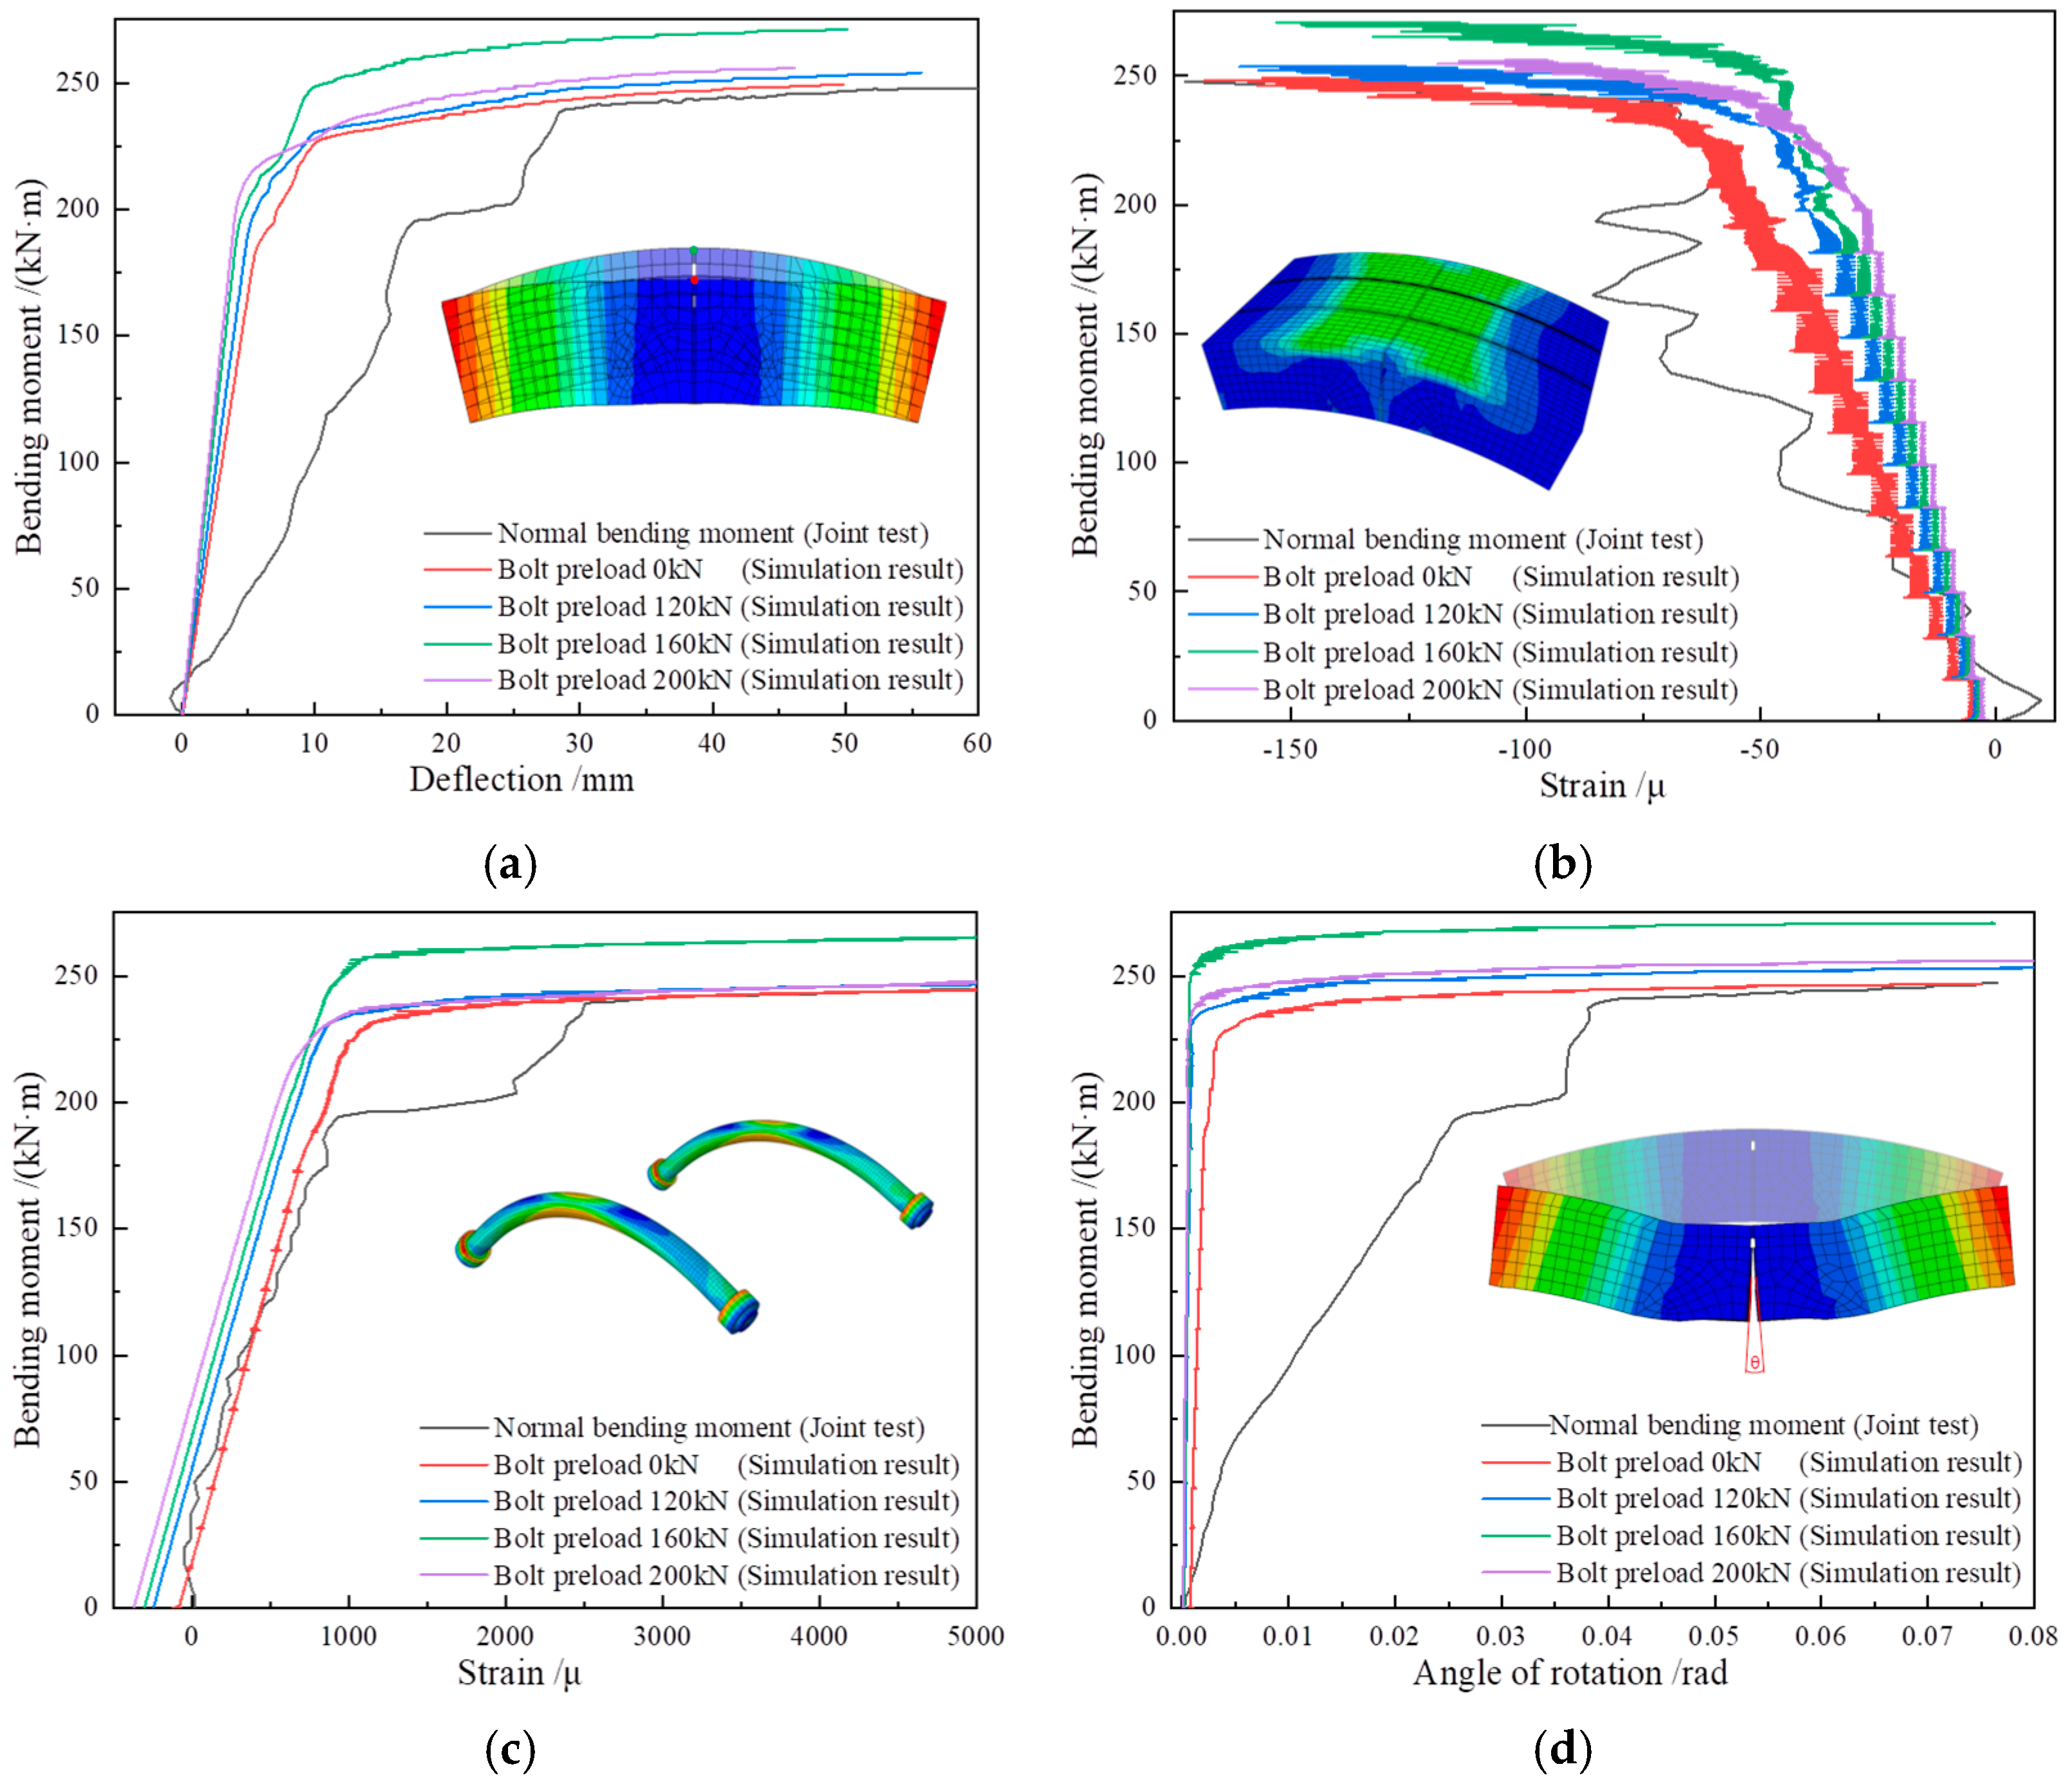
3. Validation of Joints Model

To validate the modelling process and the accuracy of data extraction, modelling verification tests for relevant joints were conducted following the modelling approach of this study. Material parameters for all components were derived from reference literature for control experiments. A solid model of the segment joint was established and subjected to model loading verification. With regard to the placement and loading conditions of the joint test blocks during the experimental process, the constraints and loading application in the finite element simulation are depicted in Figure 5. At the two end sections, only the vertical displacement at the bottom and the vertical rotation along the symmetrical axis of the segment were constrained. The loading used local pressure loading with a limited area, neglecting the influence of the segment’s curved surface on the vertical forces [37,38].
During the loading process, the bolt moment is calculated based on an eccentricity (M/N) of 0.3 m, with horizontal force N incrementally loaded by 50 kN at each stage. Consequently, the vertical load can be obtained from Equations (3) and (4). The loading continues until the horizontal force reaches 600 kN, after which the horizontal force is increased by 25 kN at each stage [12].
P = N + H 1 L L 1
= M N
The numerical simulation results and experimental data are shown in Figure 6, where component deflection, concrete cross-section strain, bolt cross-section strain, and joint opening value are compared. It can be observed that the variation patterns of the numerical simulation results closely match the experimental results. Although there are errors in vertical deformation and joint opening, this is mainly due to the boundary conditions not being able to fully replicate real-world conditions and the influence of gravity. In summary, it can be concluded that the numerical simulation has correct material parameters.
To further investigate the impact of preload on the segment joint, the cooling method was used to apply varying levels of preload to the connecting bending bolts. It has been observed that under the influence of static overload, the impact of different preload levels on the structural performance of segment joints is quite significant. Preload can effectively reduce the deformation of the segments in the initial stages. Additionally, the simulated ultimate bearing moment of the joint without preload is 246.42 kN·m. However, with a preload force of 160 kN, it increases to 270.84 kN·m, which represents a 9.02% improvement. Similarly, based on the comprehensive comparison of joint simulations at various preload levels, it has been found that the application of a preload of 160 kN has a more pronounced constraining effect on joint deformation compared to no preload and 120 kN preload. Furthermore, in comparison to the condition with preload of 280 kN, the ultimate bearing capacity of the structure is greater. Therefore, it can be concluded that the optimal preload for bolts in this study is 160 kN. Additionally, based on Figure 6c, it has been observed that preload can tighten the adjacent segments, preventing the joint opening under relatively small loads.

4. Result Analysis

4.1. Joints Opening Analysis

S3 and S4 were selected for analysing the joints opening phenomenon, and the locations of monitoring points are shown in Figure 7. The curves of joints’ opening value in phase III and IV are shown in Figure 8a,b.
It can be observed that in phase III, the opening value of the joints continuously varies with the fluctuation of seismic loads and is positively correlated with the seismic intensity. The maximum joints’ opening value during the seismic stage was statistically, as shown in Figure 8c,d. It can be seen that as the level of preload loss increases, the joints’ opening value exhibits an increasing trend and the opening value of S4 is greater than that of S3. When the PGA = 0.3 g for S3, as shown in Figure 8c, preload loss causes the opening value to increase by 1077% compared to the condition without preload loss, whereas for S4, it increases by 247%. When the PGA = 0.5 g, as shown in Figure 8d, the opening value is much greater than PGA = 0.3 g, for S3, preload loss causes the opening value to increase by 50% compared to the condition without preload loss, whereas for S4, it increases by 40%. In summary, the maximum opening value at the segment joints increases with the level of preload loss, and the increase in PGA during earthquakes further amplifies this deterioration, making the impact of preload loss more pronounced.

4.2. Ellipticity Analysis

Ellipticity is often used to describe the overall deformation of shield tunnels, and it can be calculated by Equation (5). However, it should be noted that the major and minor axes of the elliptical deformation of the shield tunnel are not fixed under the influence of seismic loads. Figure 9a shows the time–history curves of radial displacements extracted from four reference points, including the left and right arch waist, vault, and bottom of the shield tunnel. It can be observed that the horizontal deformation of the shield tunnel cross-section is significantly greater than the vertical deformation. Therefore, it is assumed that the horizontal direction is the major axis, and the vertical direction is the minor axis.
T = D H D V D 0
where, D H and D V are the deformations of major and minor axis; D 0 is the design outer diameter of the shield tunnel.
The elliptical deformation of the shield tunnel is shown in Figure 9b. It can be observed that the ellipticity varies with the fluctuation of seismic wave, but for the majority of the time, it remains positive. This indicates that the shield tunnel exhibits lateral elliptical deformation. The maximum ellipticity occurs at 7.55 s. Additionally, it is noticeable that the influence of seismic intensity is much greater than the effect of preload, and as the PGA increases, the overall ellipticity deformation also increases. When PGA is 0.1 g, the maximum ellipticity is 0.707‰, while the PGA is 0.5 g, the ellipticity is 7%, which represents an increase of 943% compared to PGA = 0.1 g. To more intuitively depict the influence of preload loss on ellipticity changes, the initial deformation difference between the end of the fourth stage and the beginning of seismic loading in the third stage is extracted as shown in Figure 9. This represents the non-recoverable deformation induced by seismic loading. It is observed that as the level of preload loss increases, the non-recoverable ellipticity deformation after the seismic event gradually increases. This indicates that preload can effectively control the overall post-seismic deformation of the structure and reduce the overall deformation during the entire process.

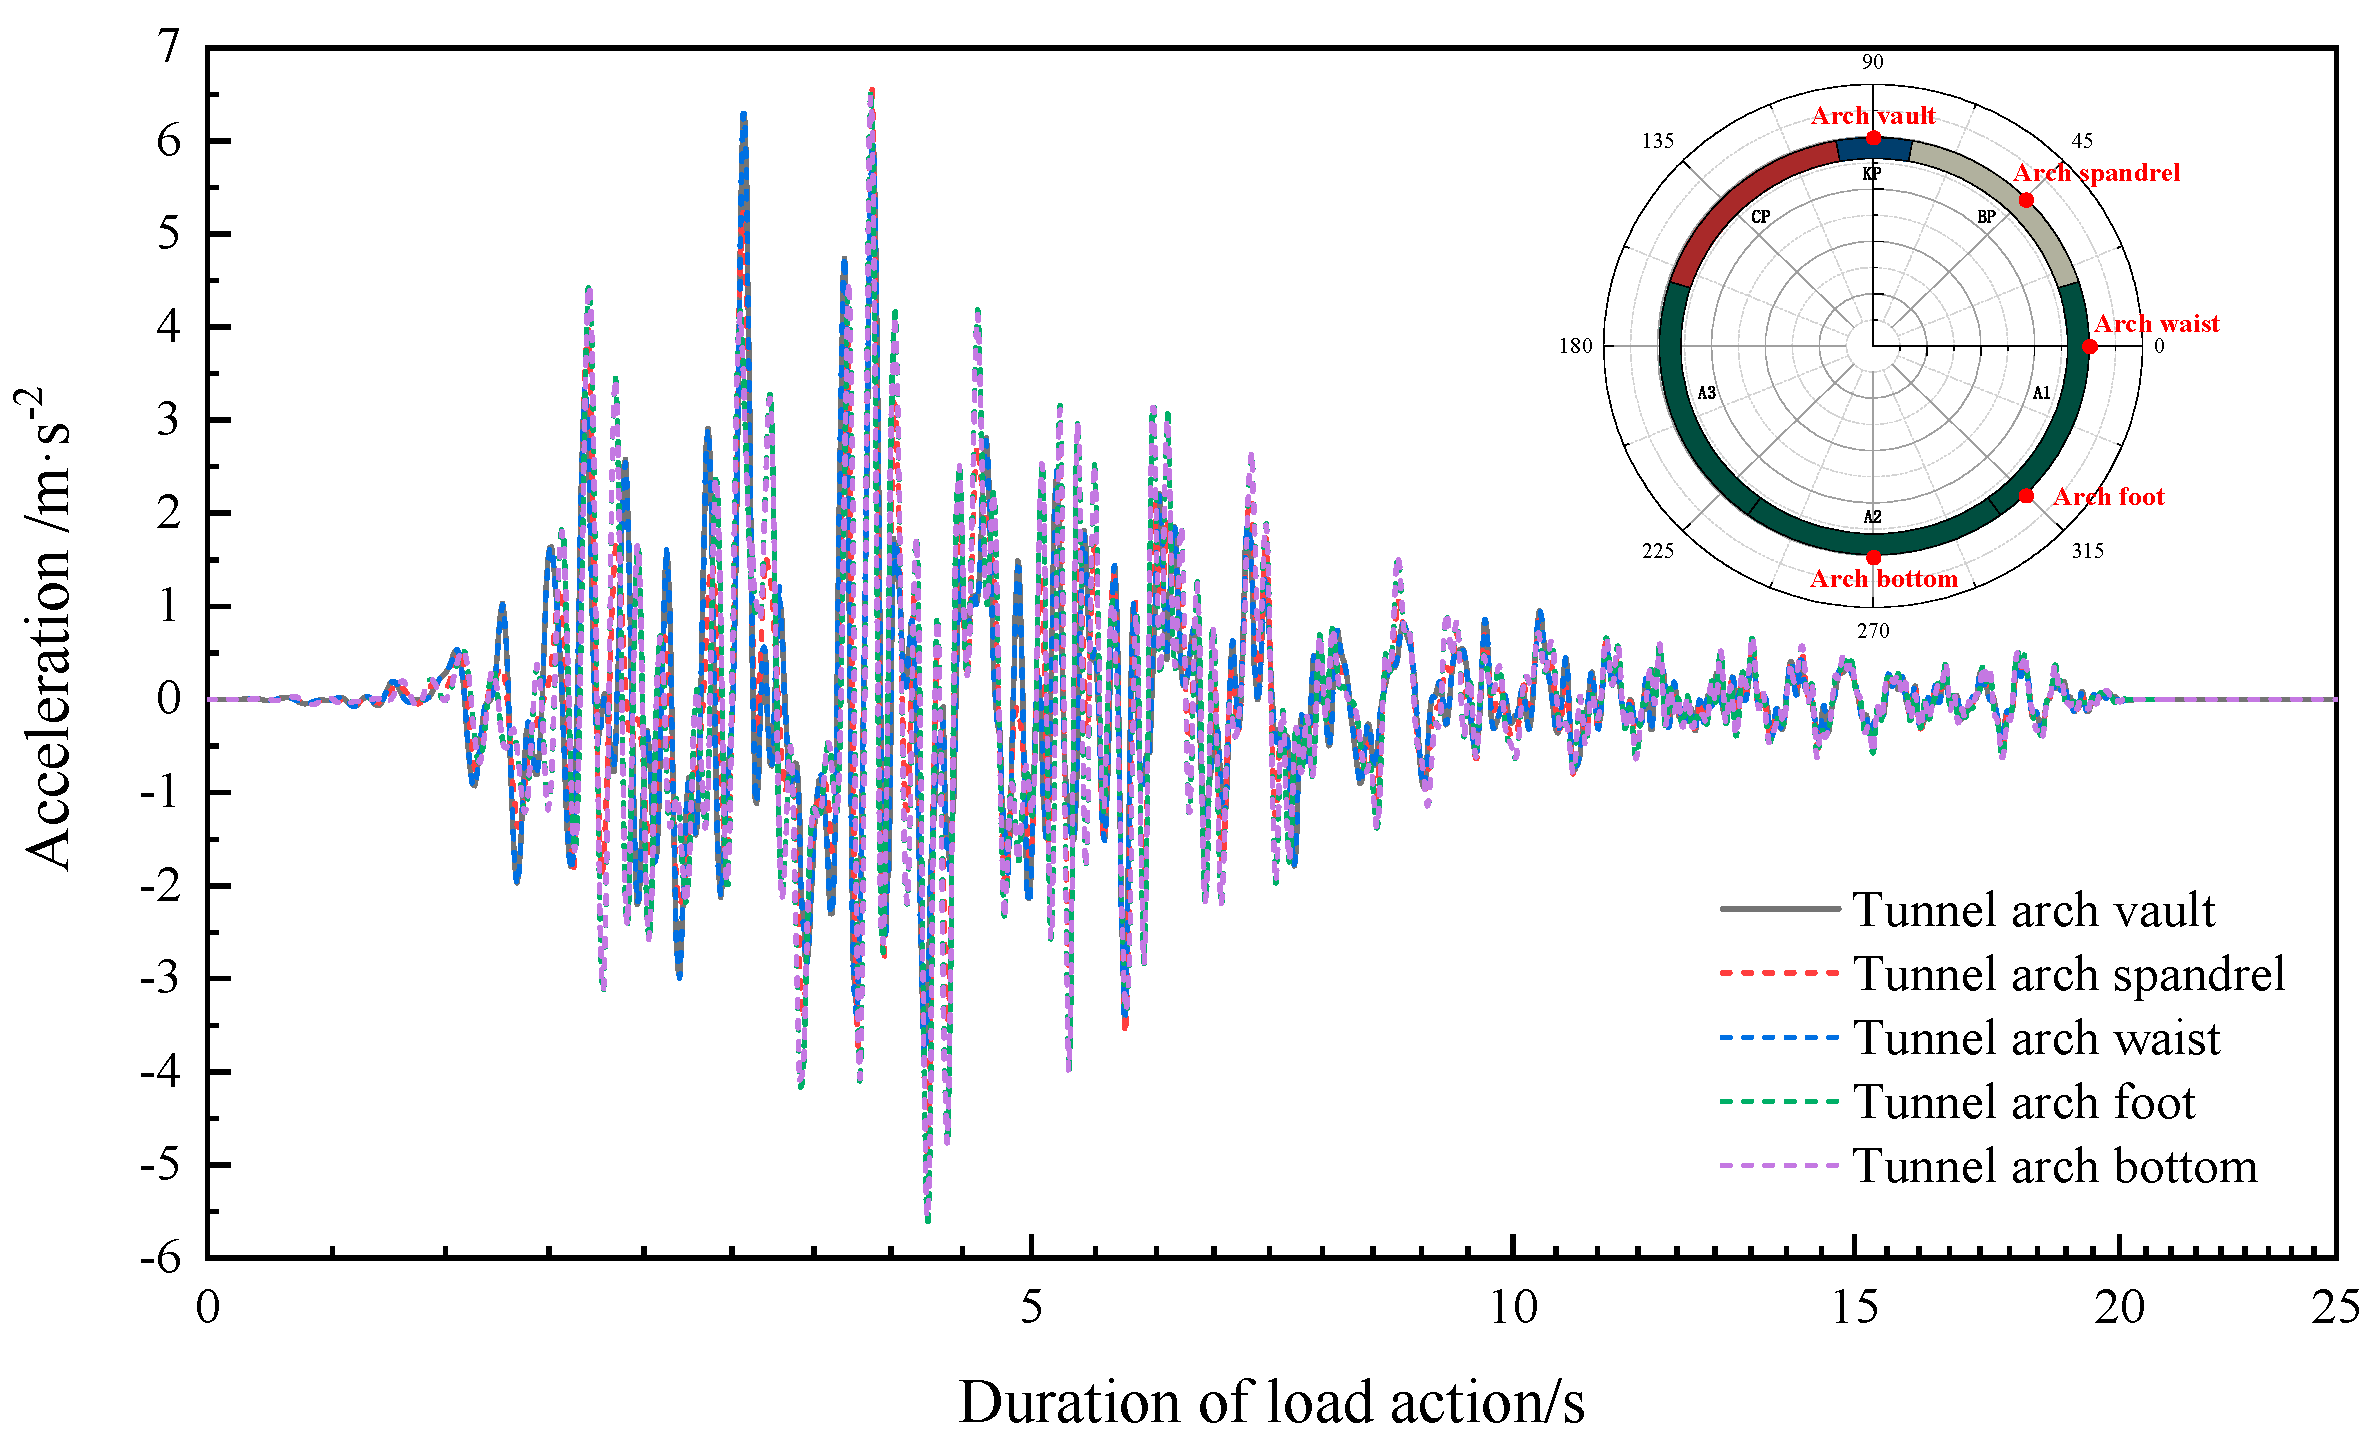
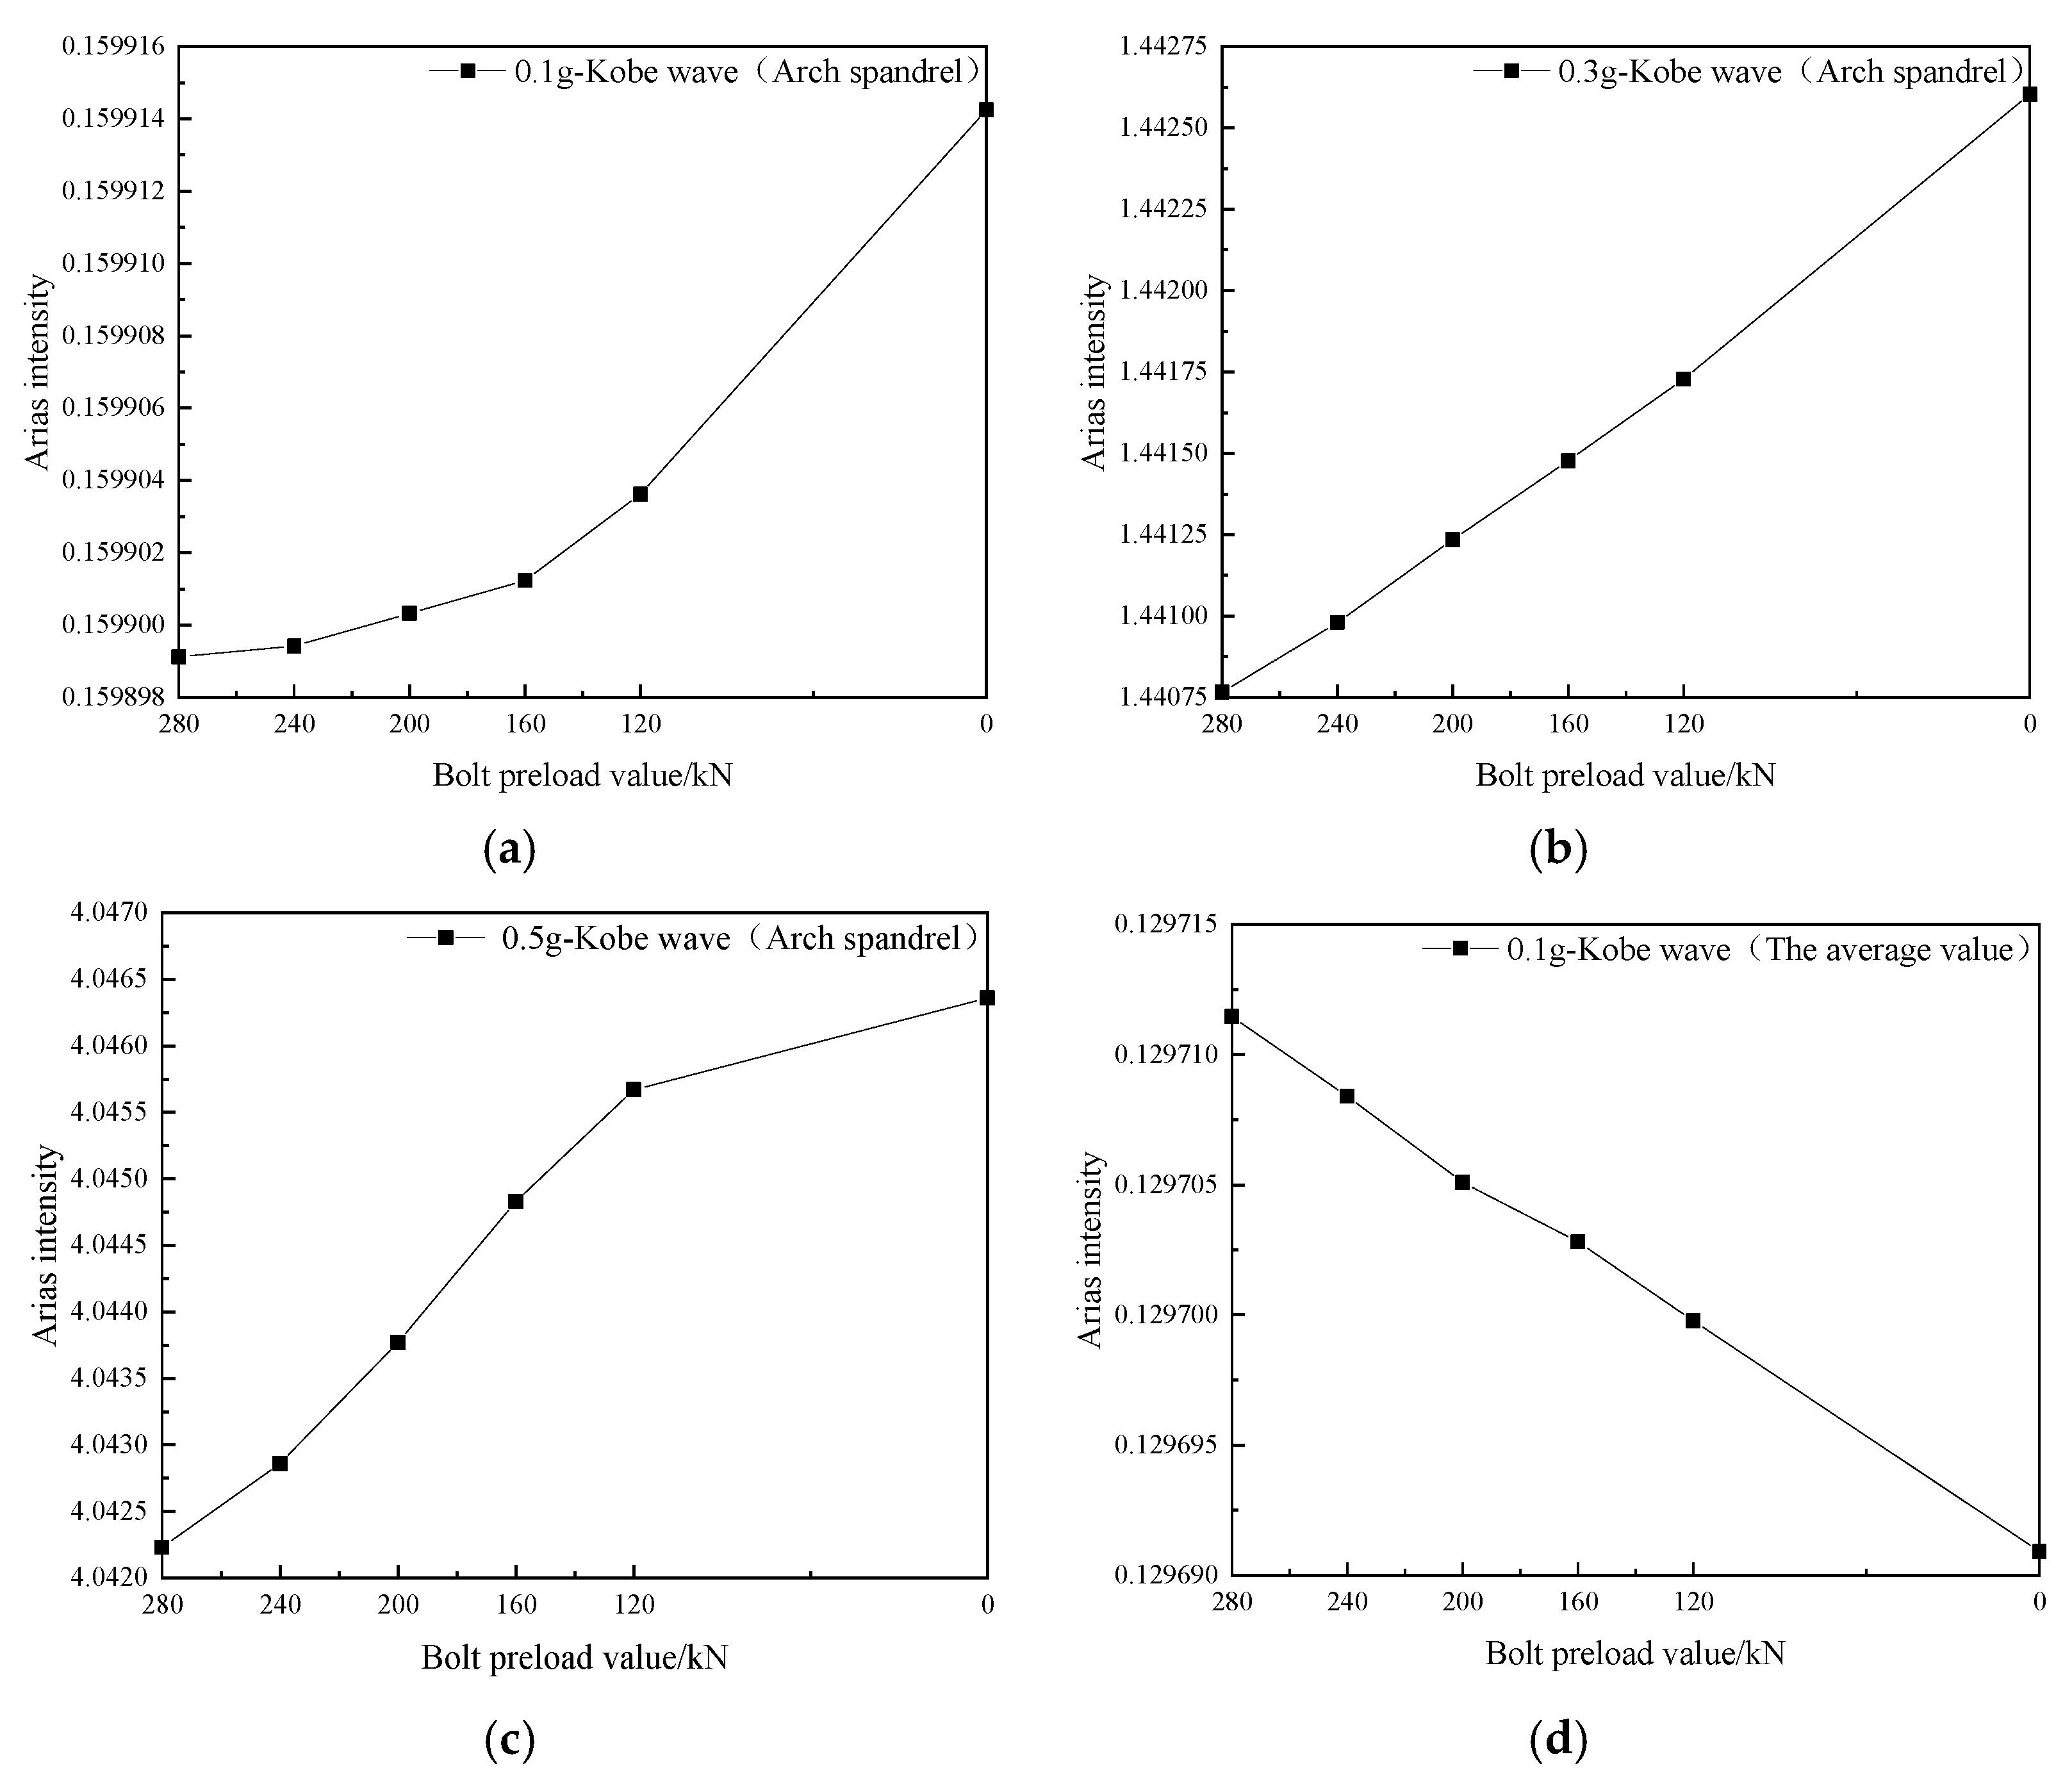
4.3. Acceleration Response Analysis

Five monitoring points, named the arch vault, spandrel, foot and bottom, are selected at 45-degree intervals along the circumferential centre line. Acceleration time–history curves are extracted for each operating condition. Figure 10 shows the time–history curves of acceleration at various points under a seismic wave with a PGA of 0.5 g when the bolt preload force is 280 kN. In terms of time, the peak acceleration at each monitoring point appears sequentially from the arch bottom to the arch foot, waist, spandrel and vault, following the direction of seismic wave propagation. Based on the observed patterns of peak acceleration under different levels of preload loss, it becomes apparent that peak acceleration cannot provide an intuitive reflection of the impact of varying preload loss levels on the structure. According to existing research, what controls earthquake-induced damage is not the peak values recorded in seismic records but the combined effects of the spectral components, duration, and amplitudes of seismic motion. To further evaluate the extent of structural damage during seismic loading, the Arias intensity I a was introduced as a measure in this research [39,40,41,42,43].
The Arias intensity, introduced by Arias in 1970, represents the energy input to a single-degree-of-freedom system per unit mass. It encapsulates both the amplitude and duration information of seismic motion and has a strong correlation with the destructive effects of seismic events and finds widespread application in seismic hazard analysis. It can be calculated by Equation (6).
I a = arccos λ g 1 - λ 2 0 T a x 2 ( t ) d t π 2 g 0 T a x 2 ( t ) d t
where a x ( t ) is the acceleration time–history in the x-direction; T is the record time; g is gravity; λ is the damp ratio of structure, 0.05.
According to the compiled results of the Arias intensity at various monitoring points, it can be observed that the maximum values occur at the arch spandrel for all conditions. The Arias intensity at the arch spandrel is shown in Figure 11a–c. As the level of preload loss increases, the values under the influence of seismic waves with various PGA all exhibit an increase trend. When the PGA is 0.1 g, at lower levels of preload loss, the increase is gradual, but it gradually becomes more significant as the level of loss increases. The early-stage impact of preload loss is smaller compared to the later stages. At a PGA of 0.3 g, there is a relatively uniform increase in the trend with the loss of preload. When the PGA is 0.5 g, with increasing level of preload loss, the growth rate gradually decreases, indicating that the early-stage impact of preload loss is more pronounced. Additionally, based on the results extracted from monitoring points at different positions in the structure, it can be observed that some points may exhibit a decreasing trend with the increase in preload loss level. Therefore, it is considered to take the average of the Arias intensity at the five reference points, as shown in Figure 11d–f. When the PGA is 0.1 g, the average Arias intensity at each monitoring point gradually decreases with the increasing level of preload loss. This is likely due to the fact that as preload is lost to a certain extent, the overall stiffness of the structure is reduced, which hinders the transfer of seismic energy. With an increase in the level of preload loss, the Arias intensity at the arch spandrel observation point exhibits a gradual decrease in trend. Numerically, this difference is 2.055 × 10⁻⁵. A similar trend is also observed when the PGA is 0.3 g and 0.5 g, where the Arias intensity gradually increases, with corresponding differences of 1.030 × 10⁻³ and 1.565 × 10⁻³, respectively. This leads to an increase in the Arias intensity of 0.088% and 0.048%, respectively.
When the average Arias intensity under different PGA and using a 40 kN loss as a reference level is normalised, it was found that when the level of preload loss is relatively low (14.29% loss), the structural damage impact at a peak acceleration of 0.1 g accounts for 5% of the total damage. However, when the peak acceleration is 0.5 g, the damage accounts for 15% of the total. This indicates that in the early stages of preload loss, higher PGA leads to a more significant structural damage impact due to preload loss. As the level of preload loss increases, the impact, especially in the later stages, becomes more pronounced for 0.1 g in comparison.

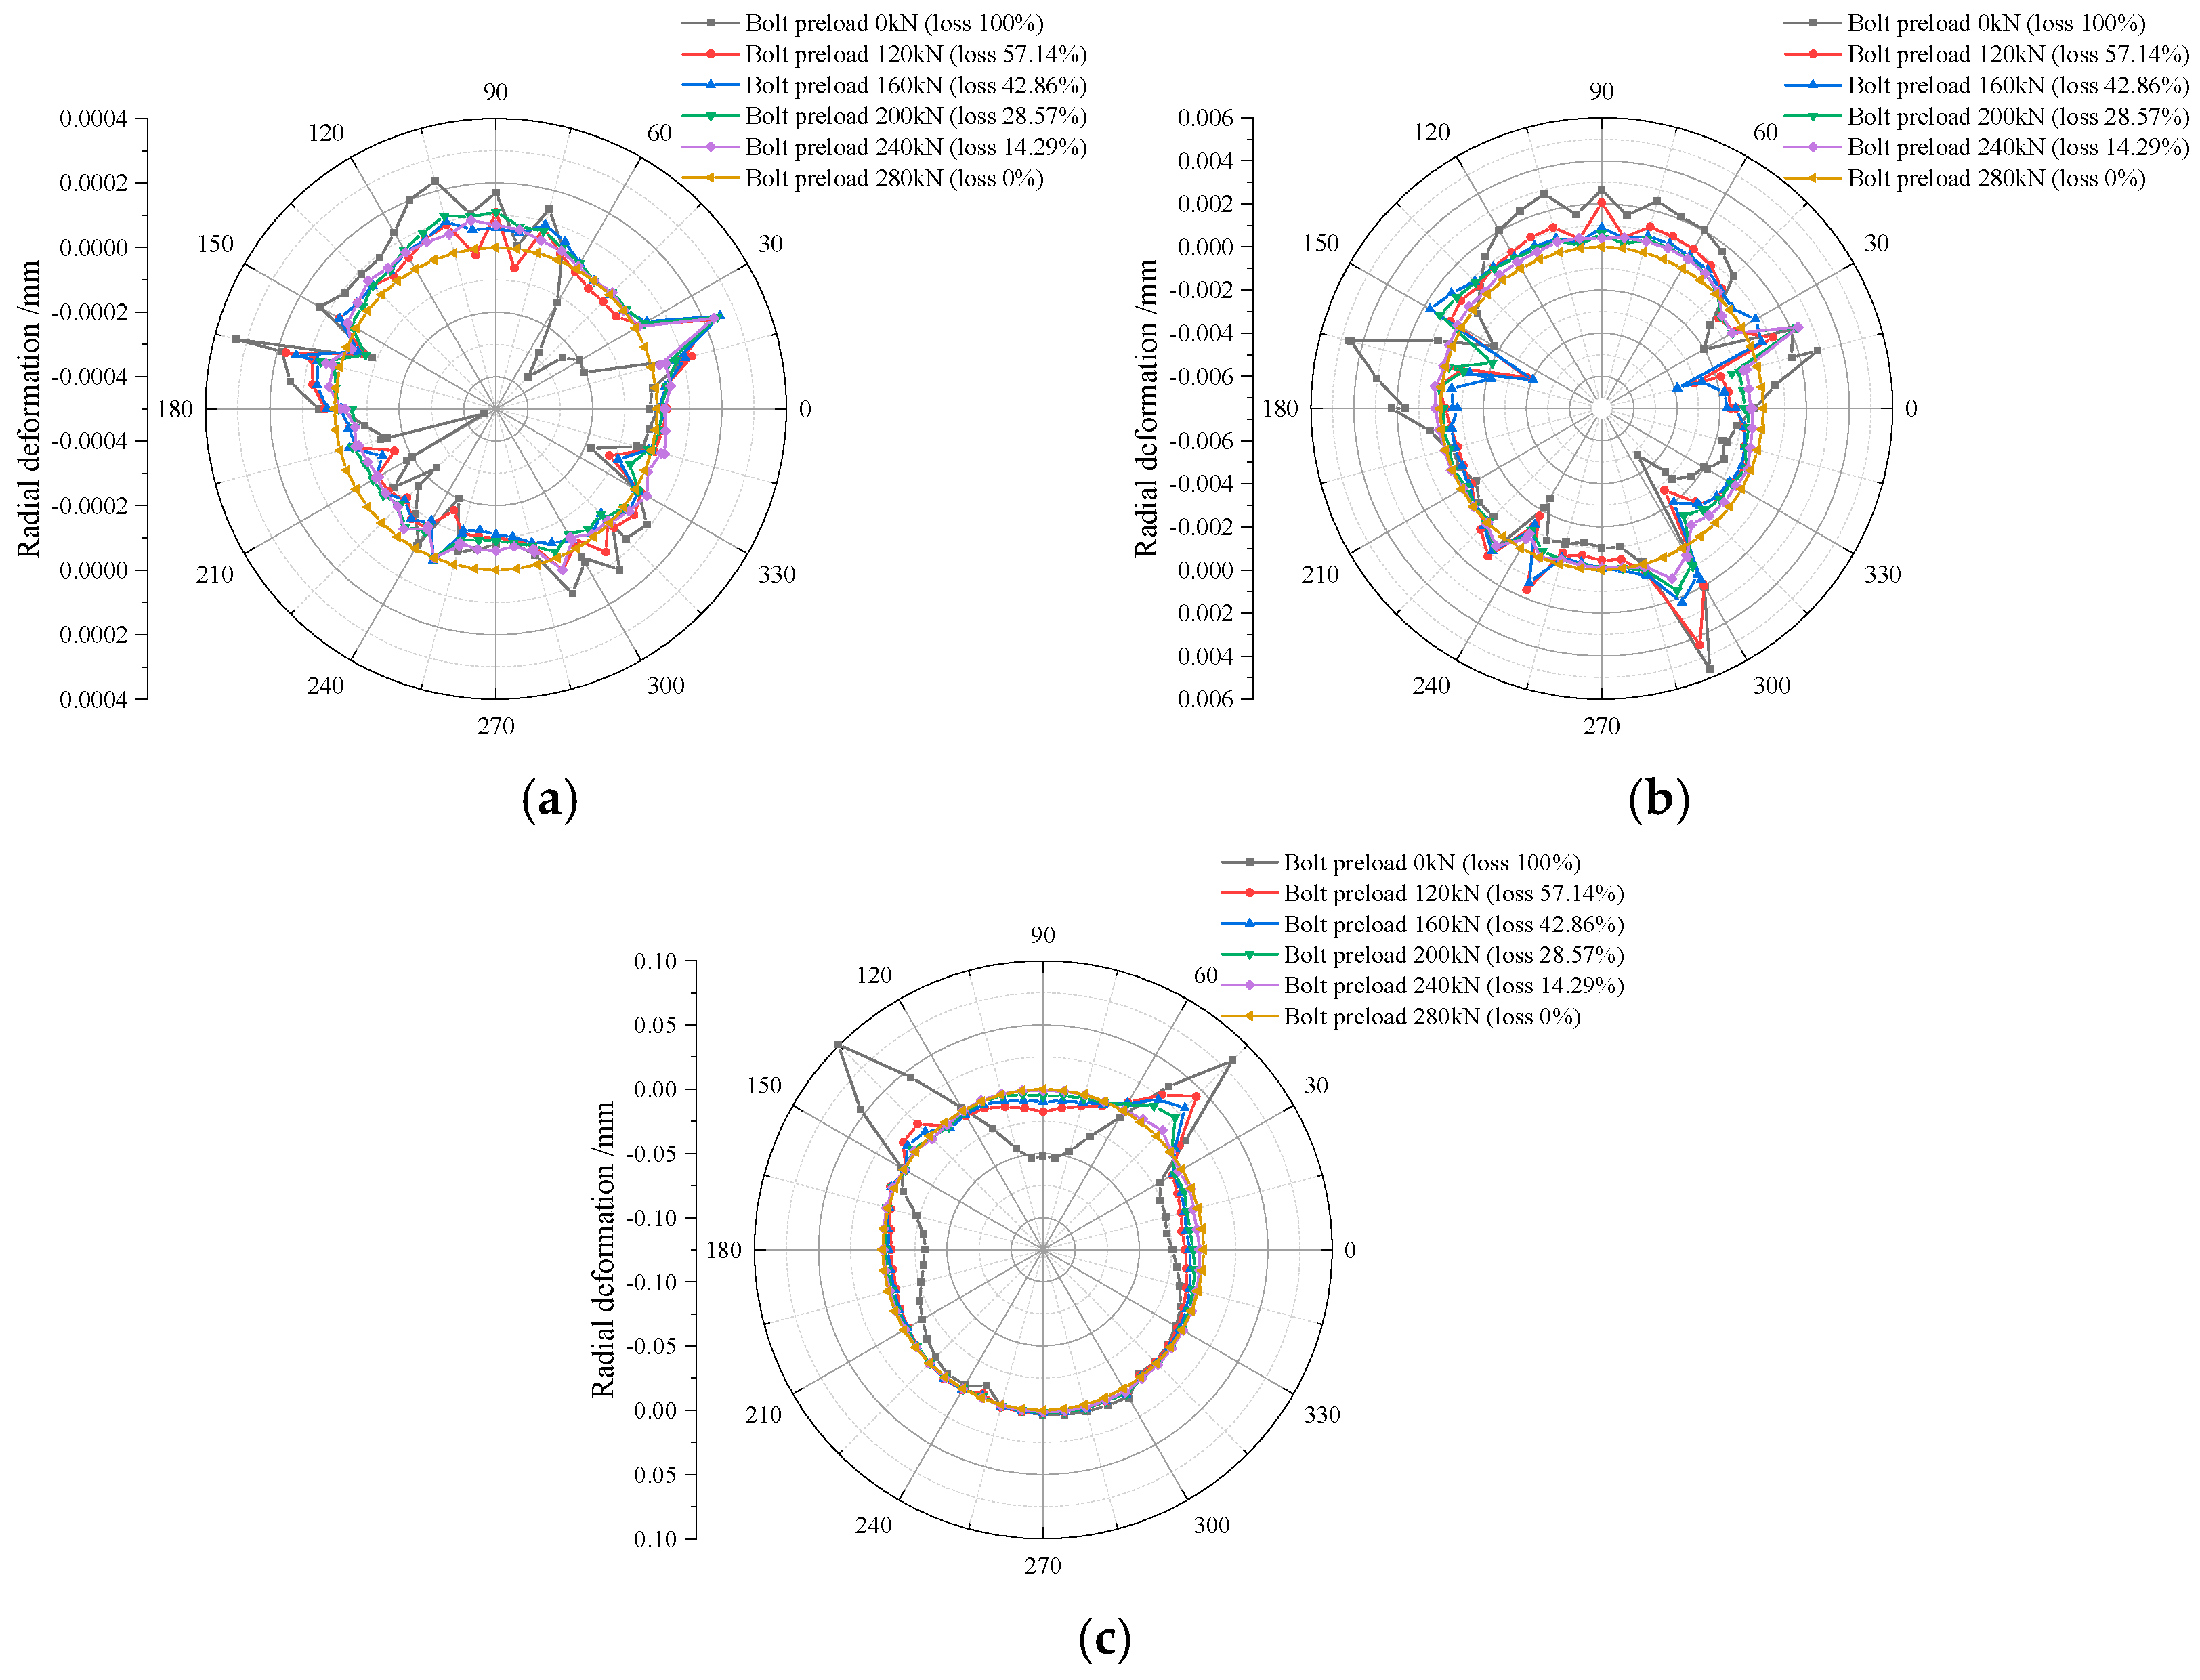
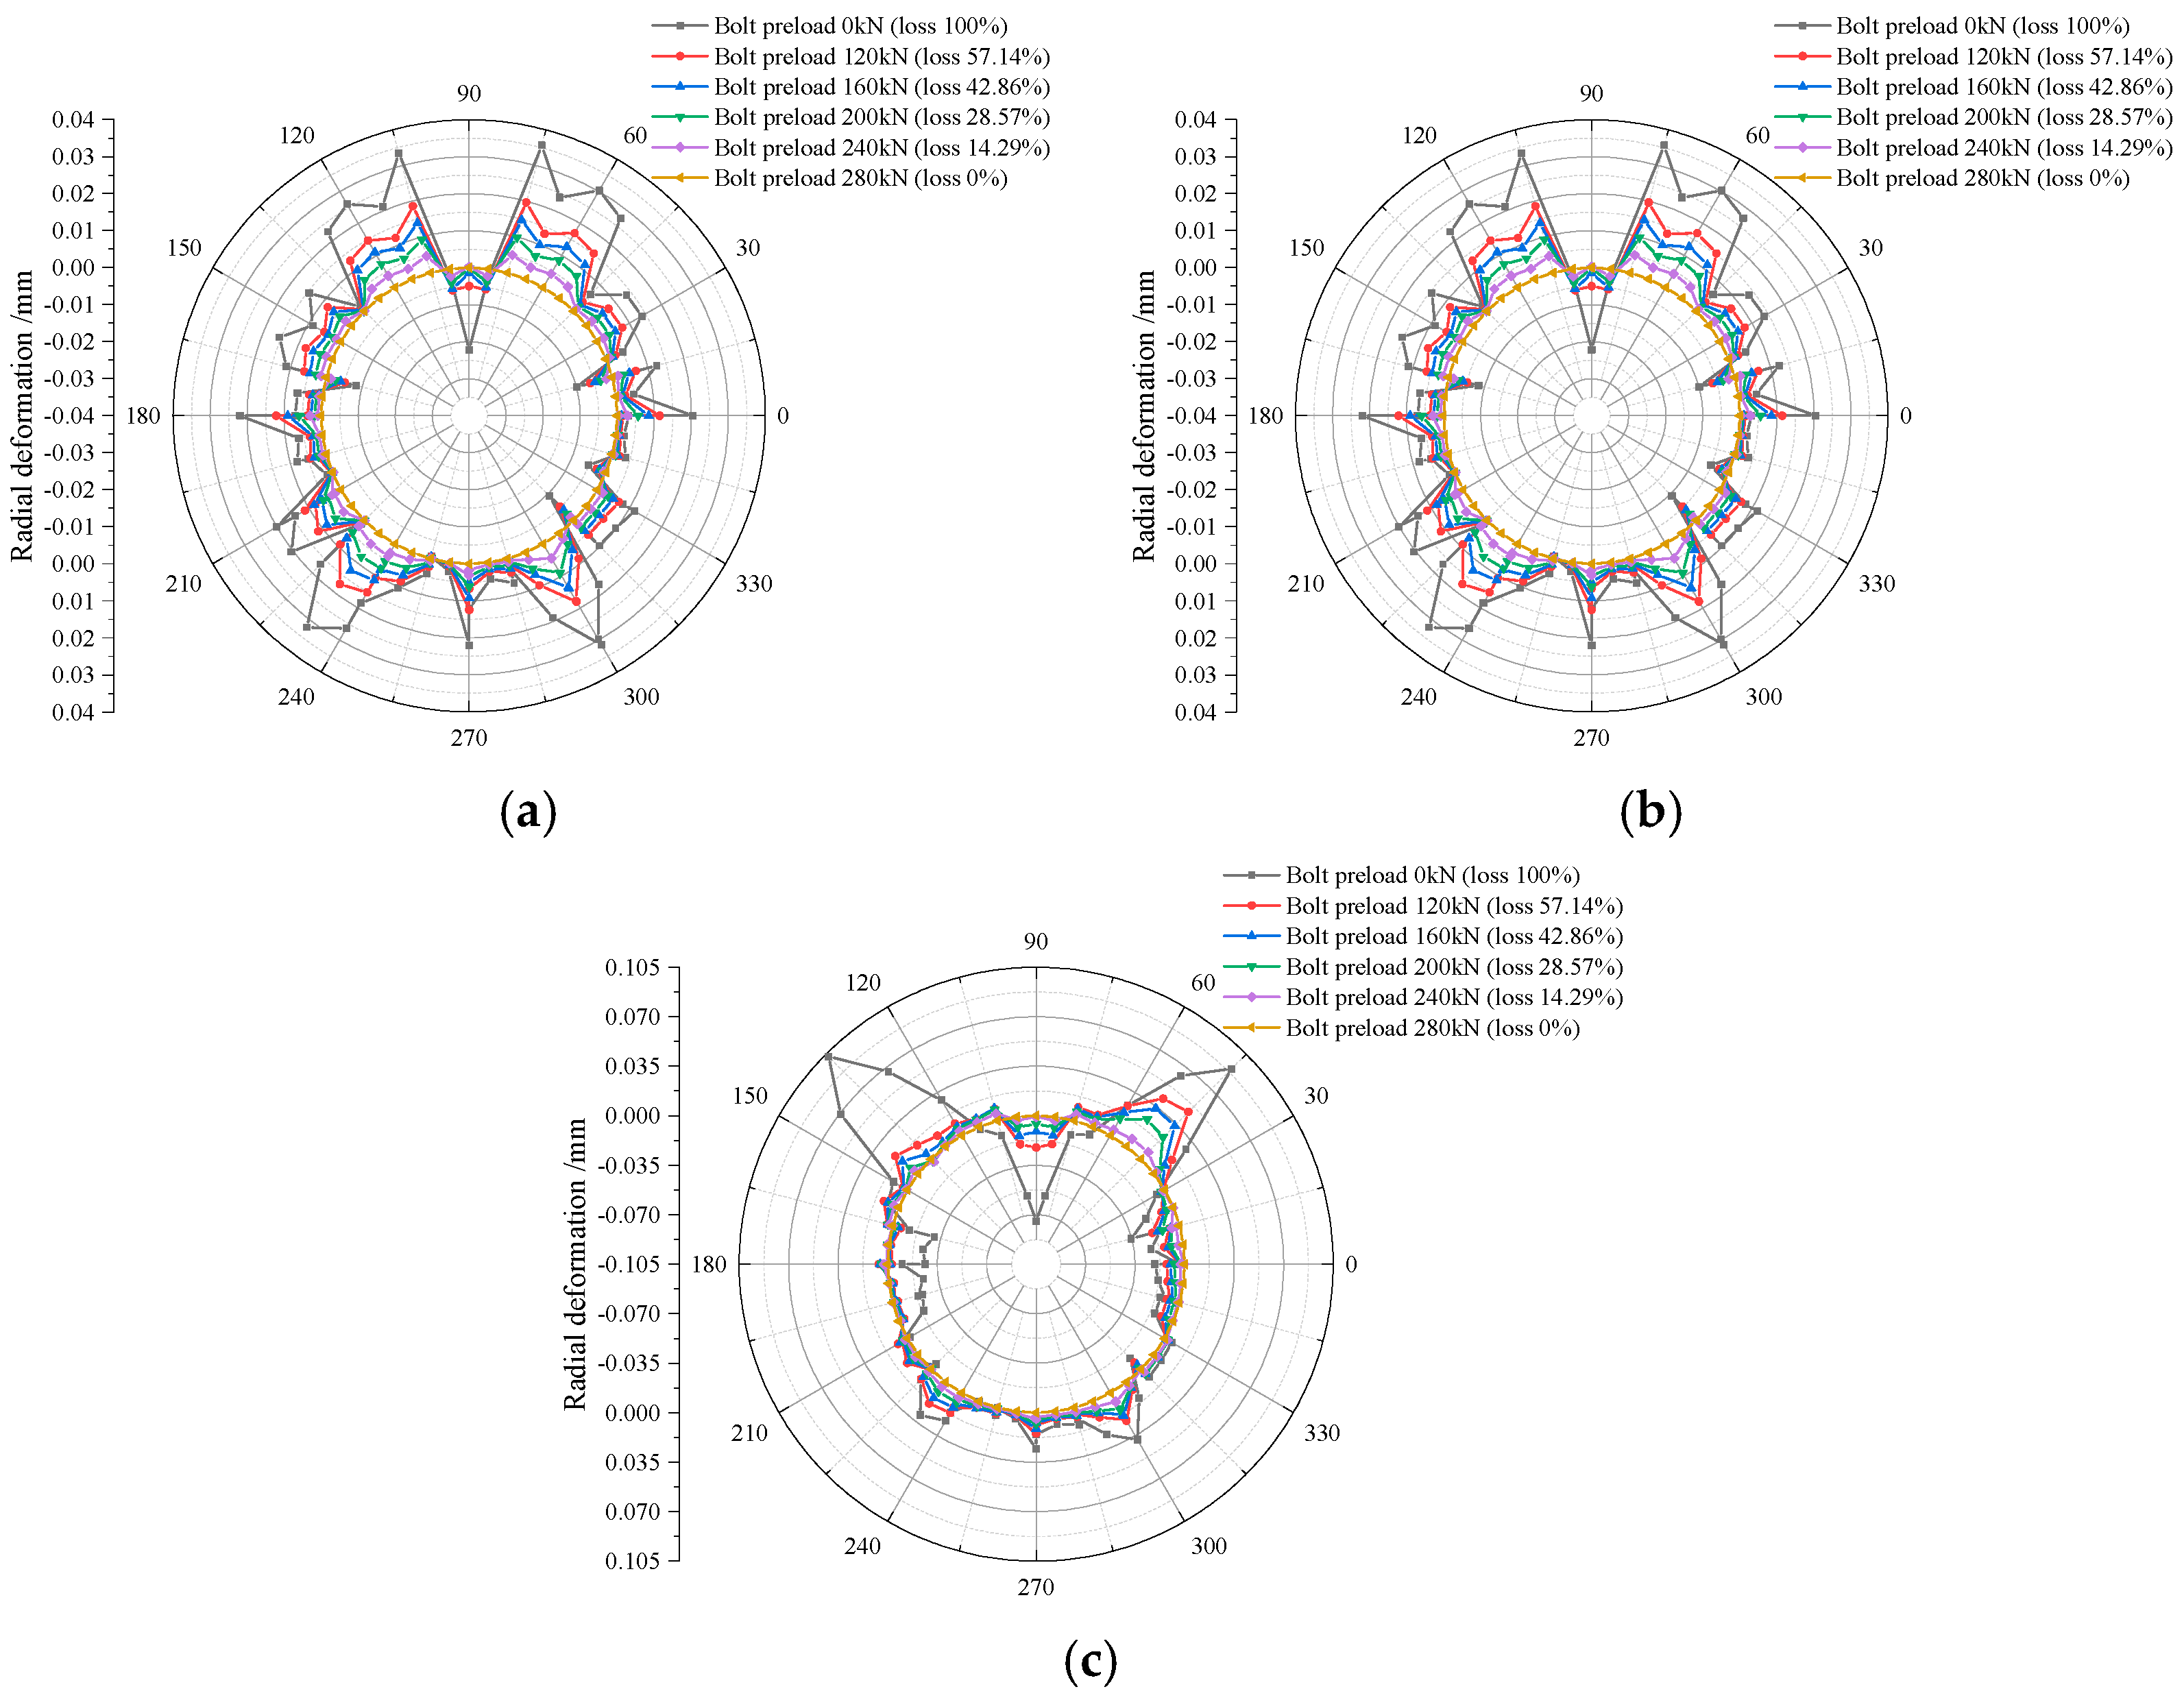
4.4. Radial Deformation Analysis

Radial deformation was taken at various points along the circumferential centre line of the middle ring at the end of the first stage, the end of the second stage, and the end of the fourth stage. The differences were calculated to obtain the following parameters: radial displacement deformation caused by preload loss during the static stage (end of the second stage-end of the first stage); radial displacement deformation caused by different preload loss rates under dynamic loading (end of the fourth stage-end of the second stage); non-recoverable deformation caused by preload loss during the entire stage (end of the fourth stage-end of the first stage). To facilitate the observation of the impact of preload loss, all data are compared by taking the normal condition (with a preload of 280 kN) as the reference, and the tunnel structure deformation is compared by calculating the differences.
Figure 12 illustrates the influence of preload loss in the static phase on the structural radial displacement deformation. It can be observed that the radial deformation exhibits a distribution pattern symmetric about the 90–270° axis. As the level of preload loss increases, the radial deformation of the segment gradually increases, and the radial deformation is mostly positive. This indicates an outward expansion of the segment ring. The maximum relative deformation is 0.035 mm and occurs when the preload is completely lost. In terms of overall structural deformation, compared to the situation with no preload loss, there is a tendency for inward contraction only at the crown and some joint locations. In this case, the relative deformation between the inner and outer segments (offset) is 0.038 mm when no preload is lost. However, when preload is completely lost, it is 0.094 mm, an increase of 147.37%. This indicates that as the degree of preload loss increases, the overall stiffness of the segment ring decreases.
Figure 13a–c is the radial deformation of the segments under seismic loading. It can be observed that the radial deformation of the segments is positively correlated with the degree of preload loss. As the intensity of seismic loads increases, the difference in radial deformation between the cases with no preload and with preload gradually increases. This indicates that the effect of bolt preload increases with the strengthening of seismic load intensity. When the PGA is 0.1 g, the segments in the range of 180°–285° exhibit an inward contraction tendency under various conditions. The deformation is positively correlated with the degree of preload loss, and the overall pattern presents a central symmetrical shape about the 135–315° axis.
The overall unrecoverable deformation is shown in Figure 14a–c. It can be observed that during the dynamic phase with PGA = 0.1 g and 0.3 g, the influence on the radial deformation of the structure remains relatively consistent. However, when the PGA is 0.5 g, it is evident that as the degree of preload loss increases, the unrecoverable radial deformation gradually increases. Furthermore, compared to the static phase, the impact of dynamic loads on unrecoverable deformation is more pronounced during this phase.

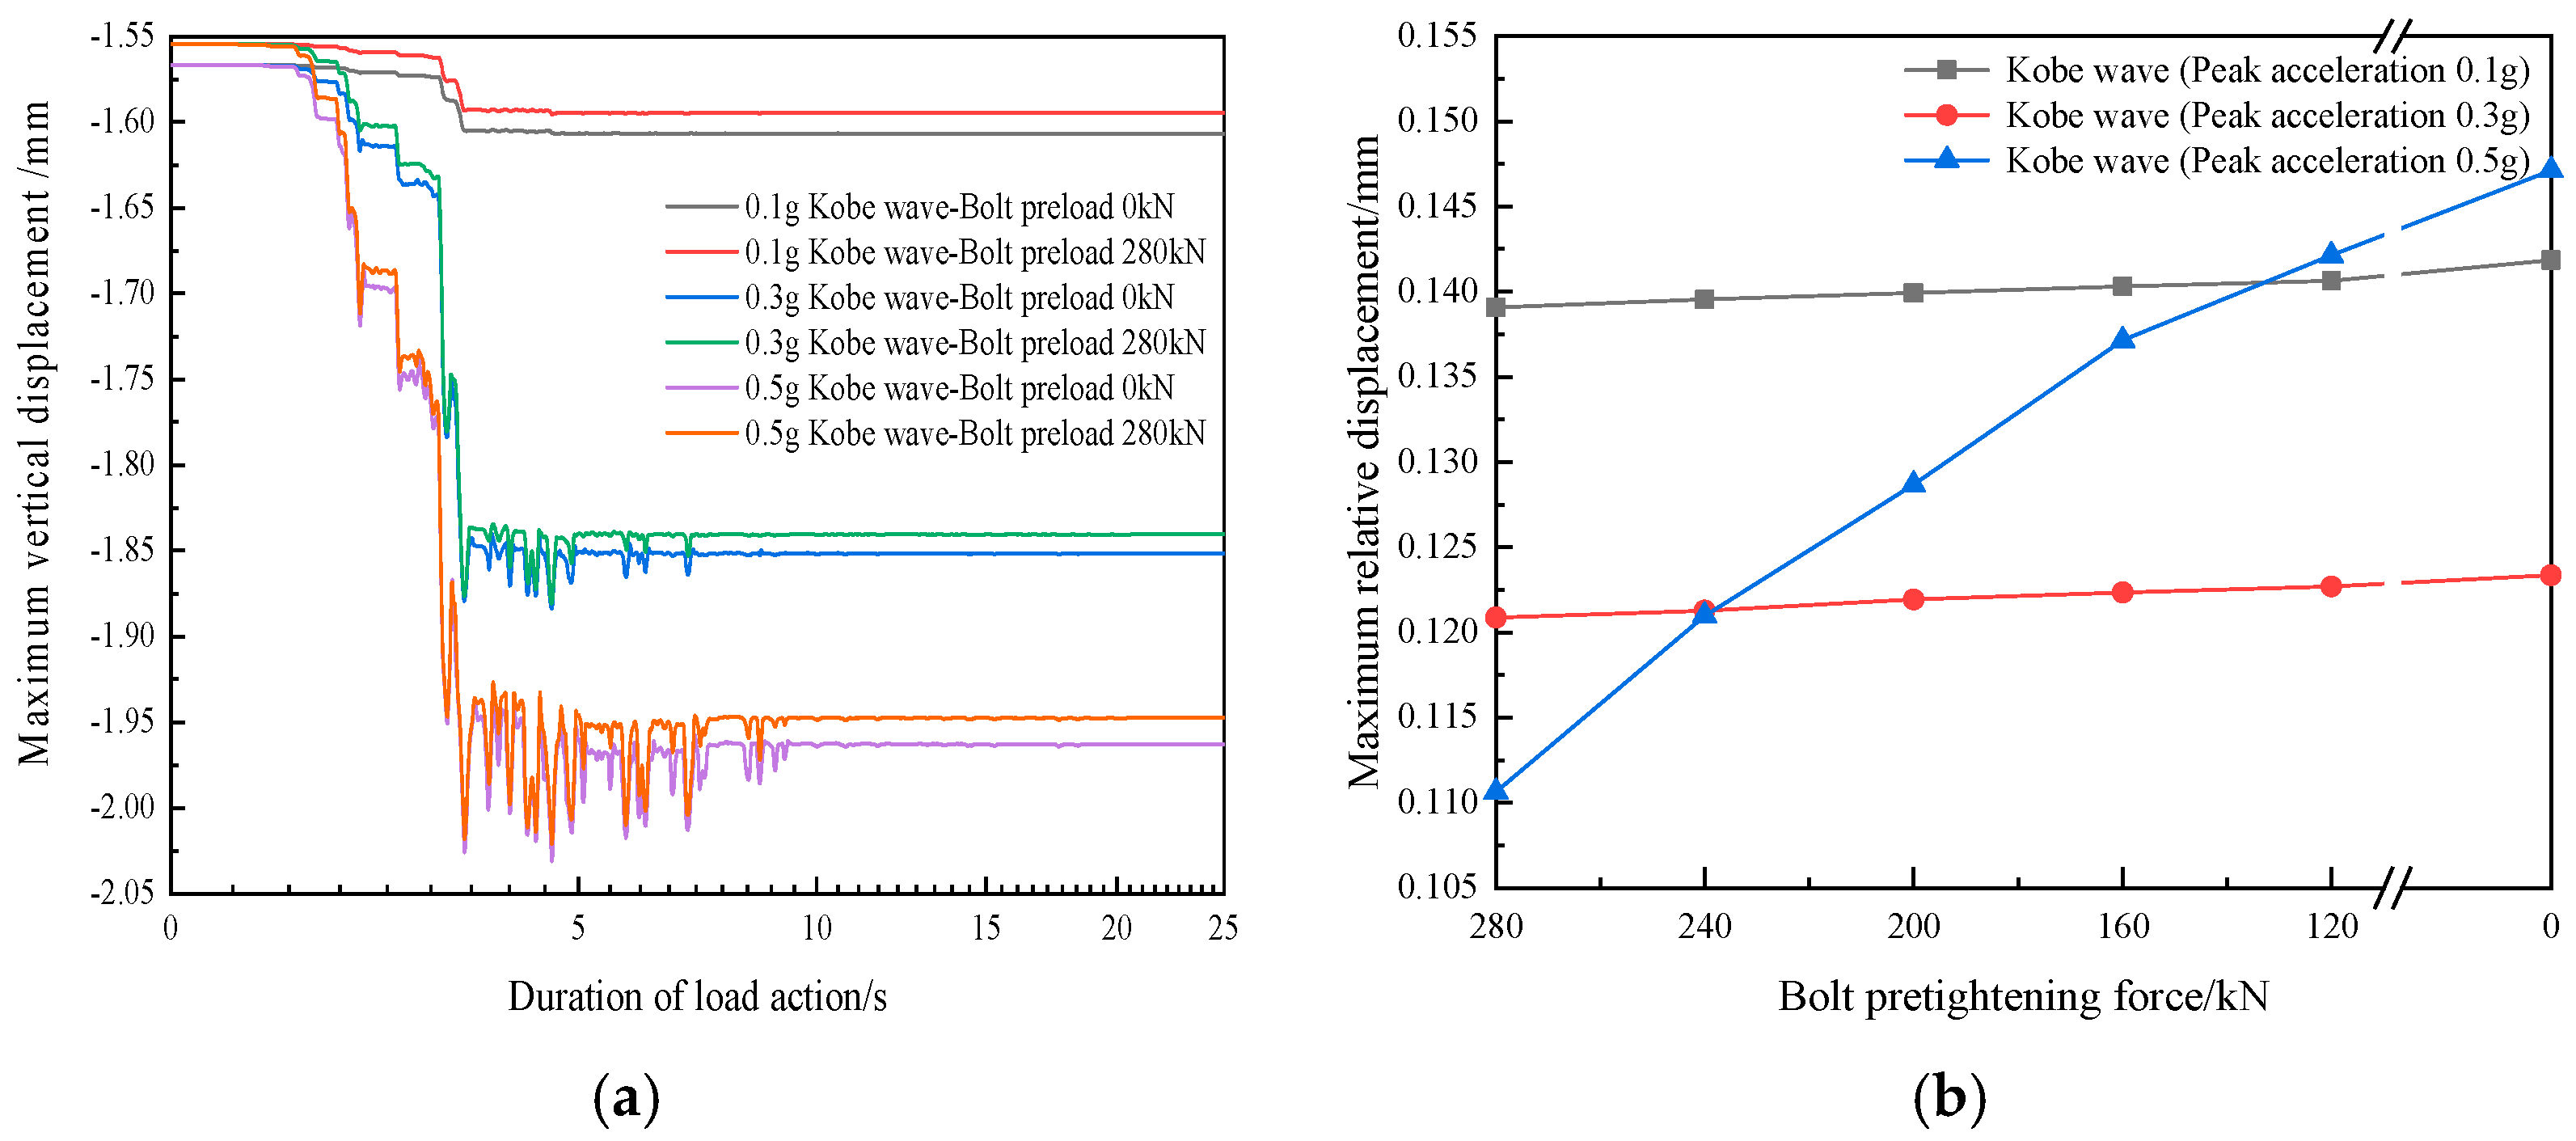
4.5. Settlement Analysis

Under the influence of seismic loads, large-span shield tunnel structures are prone to experiencing uneven settlement along their longitudinal axis. To investigate the impact of different degrees of preload loss on the structural longitudinal strength and deformation, vertical displacement time history curves at the bottom centre of the tunnel were selected under different PGAs for both normal conditions and cases where preload is completely lost, as shown in Figure 15a. It can be observed that tunnel settlement increases with the increasing intensity of seismic loads. Under the same seismic intensity, the presence of preload reduces the settlement of the shield tunnel. For seismic peak accelerations of 0.1 g, 0.3 g, and 0.5g, in cases where preload is not lost, the settlement at the bottom increased by 1.24%, 0.54%, and 0.51%, respectively.
To study the influence of preload loss on the longitudinal stiffness of the shield tunnel, the relative settlement of the entire structure can be obtained by taking the difference between the maximum vertical displacement at the bottom centre and the average vertical displacement at both ends, as shown in Figure 15b. Under the influence of seismic loads, the overall relative settlement of the structure increases with the degree of preload loss. This indicates that the application of preload has an optimizing effect on the reduction of longitudinal stiffness under seismic loads. In this case, the relative settlement along the depth direction at different preload loss levels can be used as an indicator to measure the reduction in longitudinal stiffness of a multi-ring shield tunnel. Taking the peak acceleration of 0.5 g as an example, with an increase in the degree of preload loss, the relative settlement shows an increasing trend. When the preload loss reaches 57.14% (corresponding to a preload force of 120 kN), the vertical displacement increases by 28.46%. In the case of complete preload loss, the vertical relative displacement increases by 32.97%. According to existing literature, the specific method for calculating stiffness reduction is related to the magnitude of static loads applied. Due to the complex loading conditions experienced by this structure during the dynamic phase, it is not possible to accurately calculate the reduction in longitudinal stiffness. However, based on the results of this study, it is clear that preload loss has a significant diminishing effect on the longitudinal stiffness of the structure.

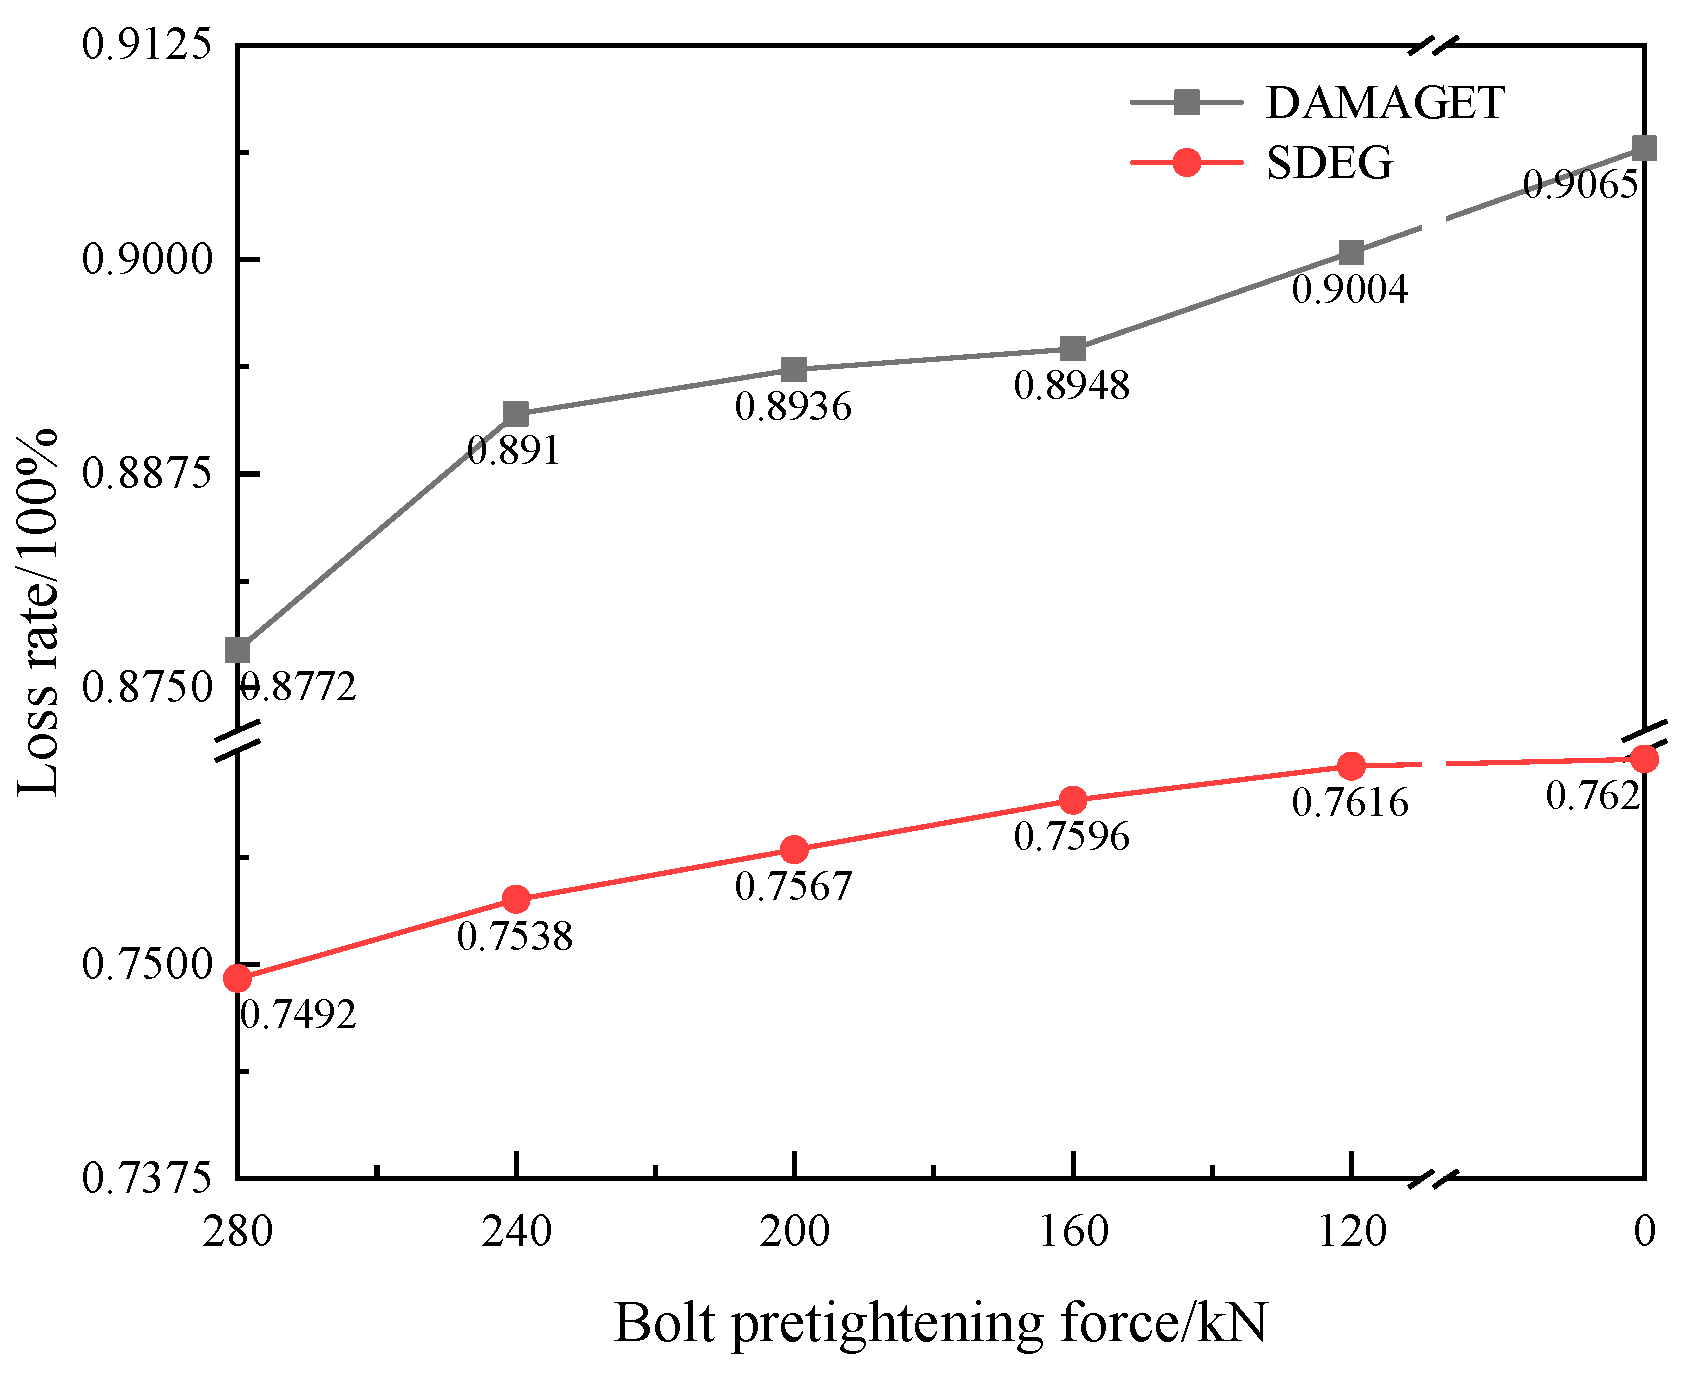
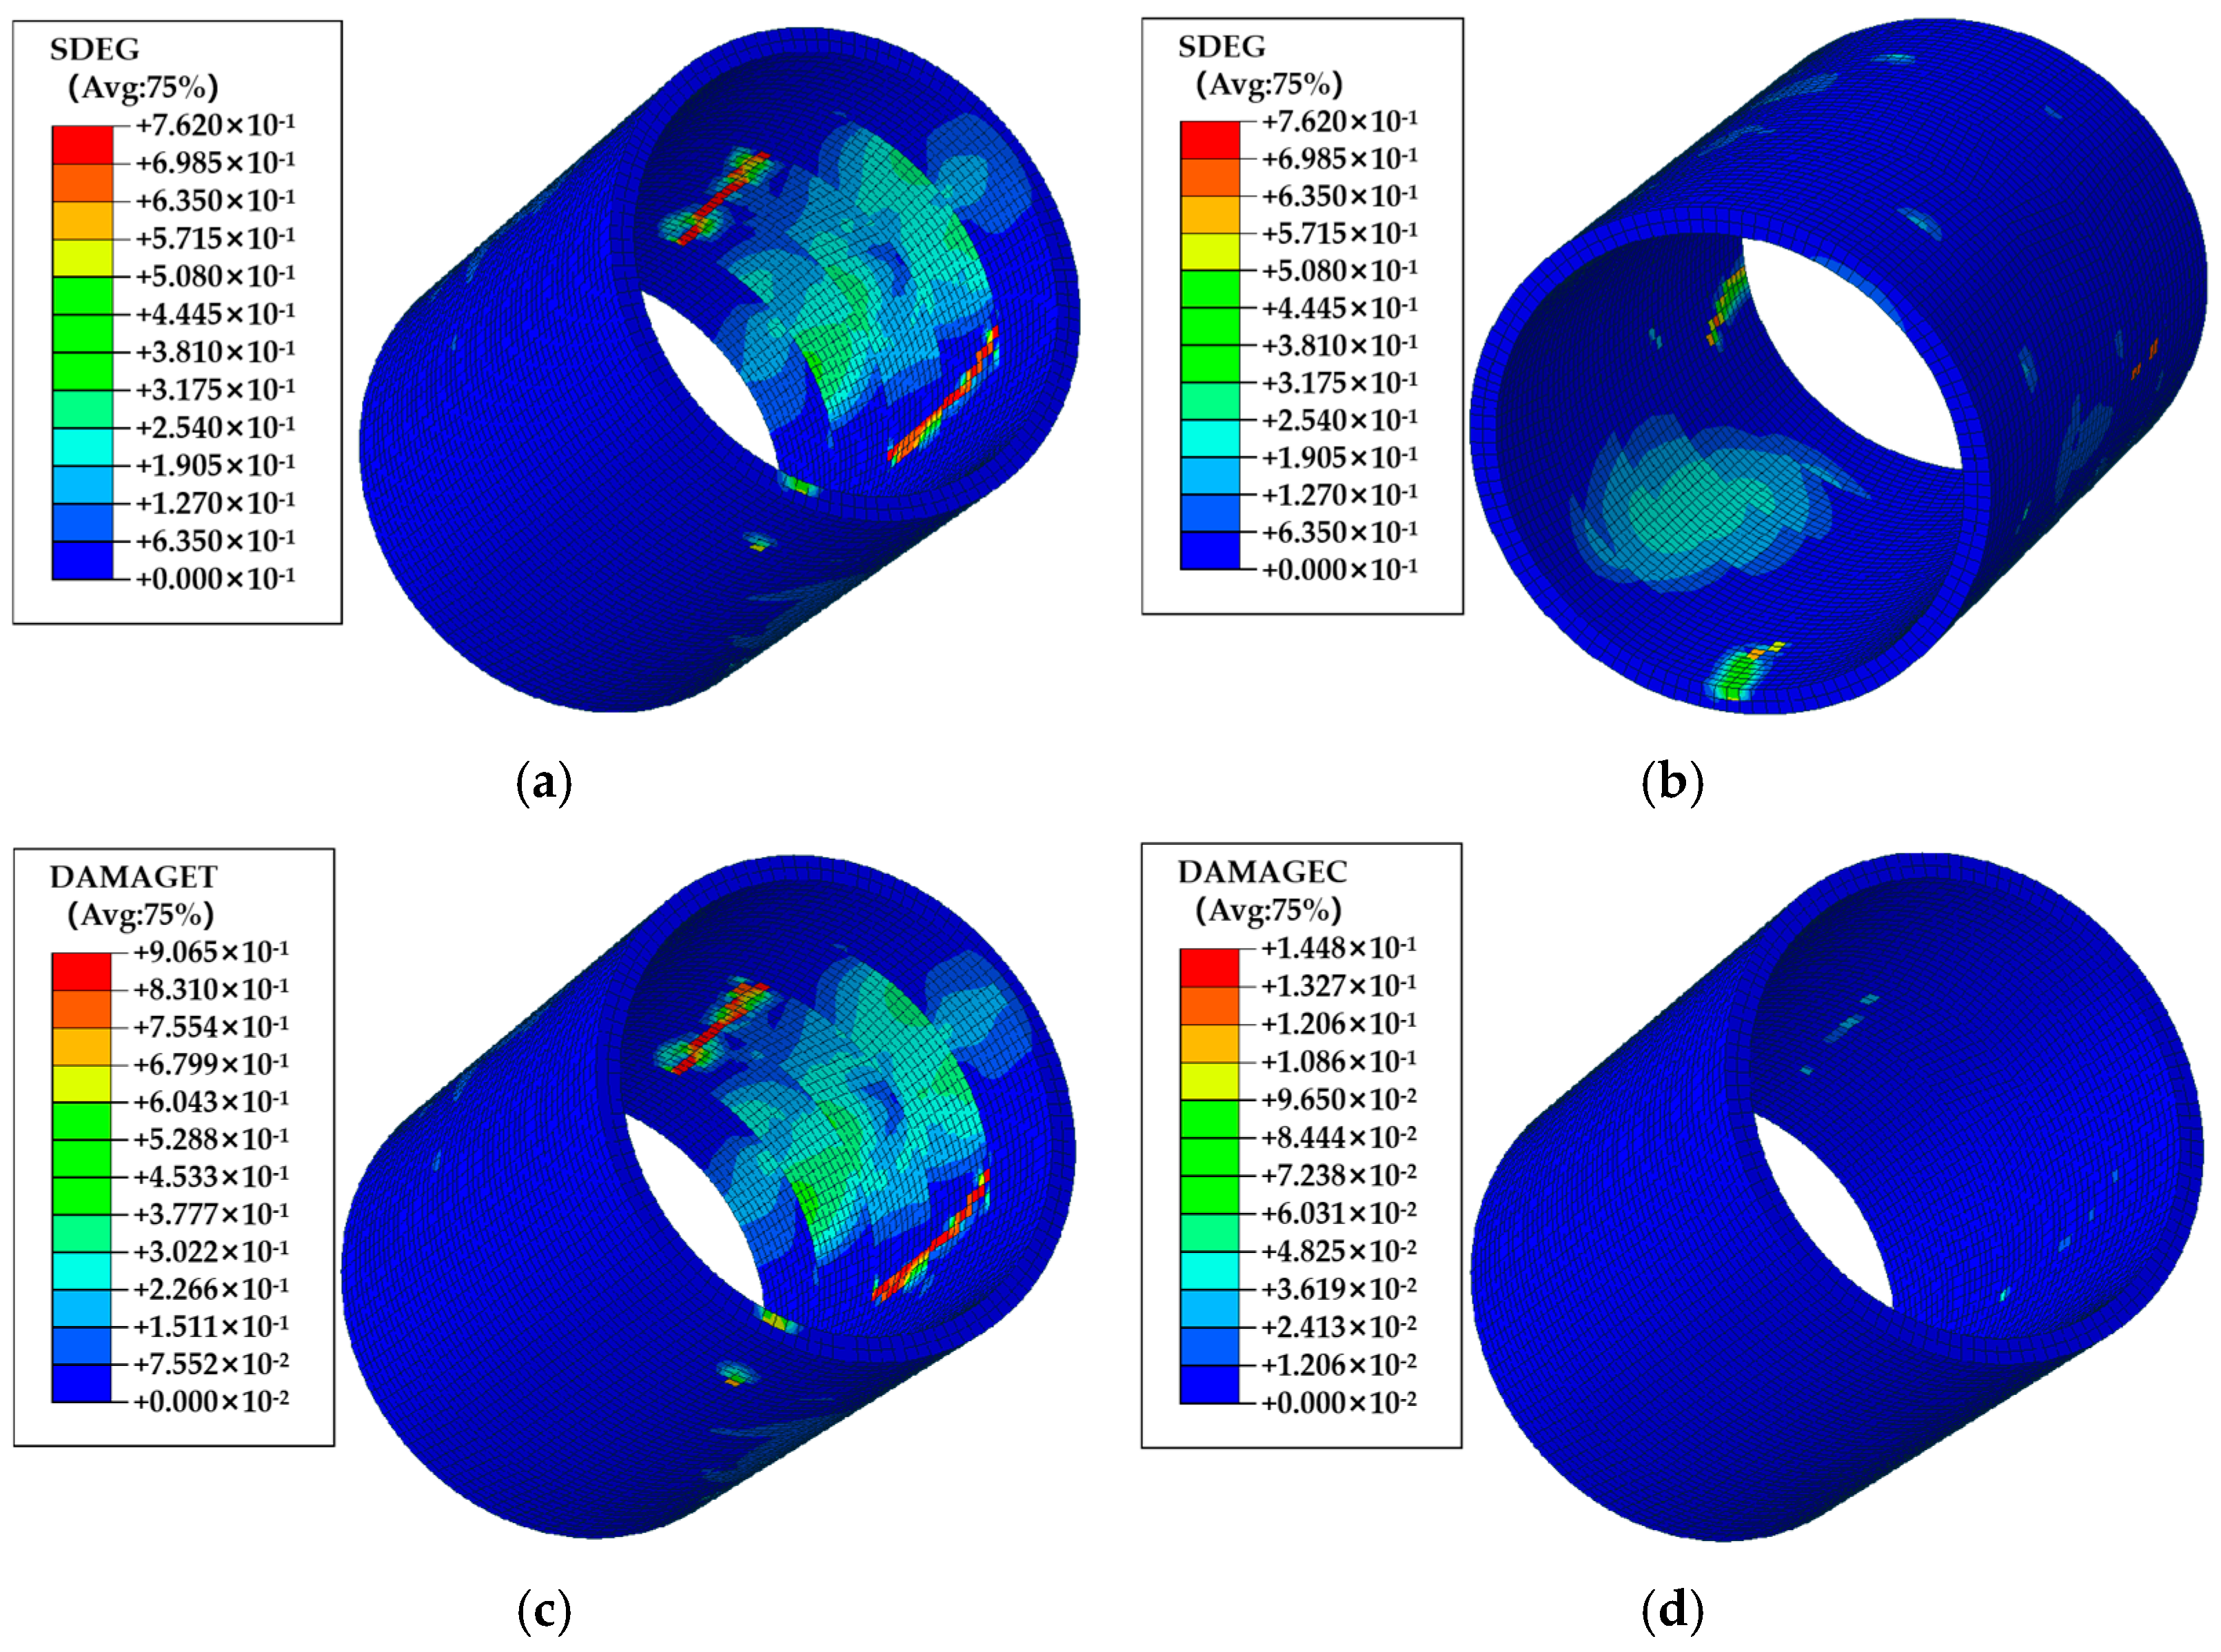
4.6. Tensile Damage Analysis

To analyse the mechanical behaviour and damage condition of the shield tunnel structure, a damage reduction stiffness variable SDEG is used to characterize the damage degree of the segmental structure [44,45]. This parameter reflects the remaining load-bearing capacity of the structure. When SDEG = 0, it indicates an intact structure; when 0 < SDEG < 1, it signifies a gradual reduction in stiffness and the occurrence of damage; when SDEG = 1, it means that the stiffness has completely degraded to zero, and the structure has failed.
When the PGA was 0.1 g or 0.3 g, the shield tunnel did not exhibit significant damage. The tensile damage factor for the segment was only 0.42. Therefore, taking the condition with a PGA of 0.5 g as an example, the structural damage state is analysed. As shown in Figure 16 for a PGA of 0.5 g, the overall tensile damage and stiffness degradation of the structure are illustrated. It can be observed that with the decrease in preload, both the tensile damage factor and stiffness degradation rate increase. Analysing the slope of the stiffness degradation curve, it can be seen that with an increase in the degree of preload loss, the stiffness degradation slope gradually decreases. This suggests that the impact of early changes in bolt preload loss on stiffness degradation is more significant than in the later stages. Additionally, as the preload loss rate increases, the local tensile damage rate of concrete segments significantly increases.
The damage cloud diagram of the shield tunnel structure after an earthquake with PGA of 0.5 g under the condition of complete preload loss is shown in Figure 17. It can be observed that structural damage mainly occurs at the crown, shoulder, inside of the arch bottom, and outside of the arch waist, as well as at the key segments, as shown in Figure 17. Figure 17a and Figure 17b, respectively, show the damage cloud diagrams at the crown and the arch bottom. By comparing the stiffness degradation cloud diagram at the most prominent damage location, the crown (Figure 17a), with the tensile and compressive damage cloud diagrams (Figure 17c,d), it is found that the distribution of stiffness degradation is closely aligned with the tensile damage cloud diagram. Therefore, it can be inferred that the primary reason for the overall structural stiffness degradation is the tensile damage of the concrete segments. Additionally, based on Figure 17, it can be seen that the overall tensile damage of the structure increases as preload loss gradually occurs. This suggests that applying preload to the bolts can optimize the overall structural performance to some extent and reduce local tensile damage to the concrete segments.
For the study of the impact of preload on the segment joints, the BP block and the A1 block were selected for analysis. Figure 18a–c show the structural damage maps of the overlap block under different preload loss conditions after the seismic wave load with PGA of 0.5 g. It was observed that the damage was concentrated at the inner side of the arch shoulder, and with an increase in the degree of preload loss, the damage showed a clear upward trend. Figure 18d,e illustrate the structural damage maps of the standard block at the arch waist under different preload loss conditions after the seismic wave load with a peak acceleration of 0.5 g. While it may not be the primary location of structural damage based on numerical values, an increase in damage values is observed with an increase in preload loss. By comparing the damage maps, it can be concluded that preload loss leads to an overall increase in damage in this area.

5. Conclusions

A three-dimensional finite element model of the soil-structure system with viscoelastic artificial boundaries was established to study the effect of high-strength bolt preload force loss on the seismic response of the tunnel structure at the segment joints. The research investigated the impact of different levels of preload force loss on various aspects, including overall structural damage, segment joint opening, ellipticity, Arias intensity, radial strain, and more. The following conclusions were drawn:
(1) During the early stages of seismic loading, the joint areas are subjected to compression. As seismic loads act, the joints’ opening value continuously fluctuates, with more pronounced peaks in gap size as the peak acceleration increases. Under different seismic waves, with increasing levels of preload loss, the peak gap size of the tunnel segments also increases. Preload can effectively reduce the gap size of the tunnel segments and prevent excessive amplitudes of cyclic loading, thereby preventing issues such as water leakage at the segment joints, aging of rubber gaskets, fatigue damage to local components, and local tensile damage to concrete segments.
(2) Preload exerts a certain restraining effect on the radial deformation of the structure. As the degree of preload loss intensifies, the circumferential restraint capacity on the overall deformation of the structure gradually weakens, leading to an increase in the radial deformation of the tunnel segments. The Arias intensity, as a measure of structural damage, shows an increasing trend with the worsening of preload loss. This increasing trend is more significant as the PGA increases.
(3) The influence of seismic waves with PGA of 0.1 g and 0.3 g on the radial displacement of the structure remains relatively consistent. However, under the effect of seismic waves with a PGA of 0.5 g, it becomes evident that the irreversible radial deformation gradually increases with the intensification of preload loss. Compared to the static phase, the dynamic loads have a more pronounced effect on the irreversible deformation.
(4) Under the influence of seismic loads with different PGA, the relative longitudinal settlement of the structure increases with the preload loss rate increases. This suggests that the application of preload has an optimizing effect on the reduction in longitudinal stiffness and the control of vertical deformation in the multi-ring structure under seismic loads. As the preload loss rate increases, the stiffness reduction gradually becomes more significant. The influence of preload loss on stiffness reduction is more pronounced in the initial stages of preload loss changes compared to the later stages. Additionally, as the preload loss rate increases, the rate of localized tensile damage to concrete segments significantly increases. This indicates that preload plays a crucial role in enhancing the overall structural performance.
(5) After the application of seismic loads, local structural damage primarily occurs at the crown, shoulder, inner part of the arch bottom, outer part of the arch waist, and the top block. The main type of damage observed is tensile damage to the concrete segments.

Author Contributions

R.T. wrote the first draft of the paper and performed all the simulations. H.C. put forward technical route of numerical simulation. J.S., X.W. and Z.L. edited the paper and investigated the simulation work. X.B. and X.C. provide fund support and the method of data processing. All authors have read and agreed to the published version of the manuscript.

Funding

This research is fully supported by the national Natural Science Foundation of China (No. 52022060 & 52090084) and the Shenzhen Science and Technology Program (Grant No. KQTD20200909113951005).

Institutional Review Board Statement

Not applicable.

Informed Consent Statement

Not applicable.

Data Availability Statement

The data presented in this study are available on request from the corresponding author. The data are not publicly available because it constitutes a component of an ongoing study.

Conflicts of Interest

Author Ziming Liu is employed by the China Railway 22nd Bureau Group Shenzhen Construction Co., Ltd. The remaining authors declare that the research was conducted in the absence of any commercial or financial relationships that could be construed as a potential conflict of interest.

References

  1. Chen, X.; Li, K.; Bao, X.; Hong, C.; Fu, Y.; Cui, H. Innovations in the Development of Digital and Intelligent Construction of Urban Shield Tunnels. J. Basic Sci. Eng. 2021, 29, 1057–1074. [Google Scholar] [CrossRef]
  2. Chen, X.; Shen, J.; Bao, X.; Wu, X.; Tang, W.; Cui, H. A review of seismic resilience of shield tunnels. Tunn. Undergr. Space Technol. 2023, 136, 105075. [Google Scholar] [CrossRef]
  3. He, C.; Geng, P. Research on Practical Seismic Analysis Methods of Shield Tunnel. China J. Highw. Transp. 2020, 33, 15–25. [Google Scholar] [CrossRef]
  4. Zhang, J.; He, C.; Geng, P.; Chen, P.; Lu, Z. Study on bending state nonlinearity of shield-tunnel ring joints. Eng. Mech. 2018, 35, 35–44. [Google Scholar] [CrossRef]
  5. He, C.; Geng, P.; Yan, Q.; Feng, K. Status of seiemic analysis methods for traffic yunnel and their applicability suggestions in China. J. Earthq. Tsunami 2013, 7, 1350026. [Google Scholar] [CrossRef]
  6. Geng, P.; Tang, J.; Quan, Q.; He, C.; Yan, Q. Shaking table test for tunnel with shock absorption layer though fault zone. J. Cent. South Univ. Sci. Technol. 2013, 44, 2520–2526. [Google Scholar]
  7. Xu, H.; Li, T.; Xia, L.; Zhao, J.X.; Wang, D. Shaking table tests on seismic measures of a model mountain tunnel. Tunn. Undergr. Space Technol. 2016, 60, 197–209. [Google Scholar] [CrossRef]
  8. Dong, F.; Zhang, D.; Fang, Q.; Zhu, W.; Chen, L.; Tai, Q. Seismic Response Analysis of Large-Diameter Shield Tunnels Considering the Segment Joint Effect. Mod. Tunn. Technol. 2015, 52, 111–120. [Google Scholar] [CrossRef]
  9. Xu, H.; Li, T.; Xu, J.; Wang, Y. Dynamic Response of Underground Circular Lining Tunnels Subjected to Incident P Waves. Math. Probl. Eng. 2014, 2014, 1350026. [Google Scholar] [CrossRef]
  10. Liu, N.; Men, Y.; Peng, J.; Chu, C.; Liu, Y. Dynamic response of shield metro tunnel in earthquake load. Hydrogeol. Eng. Geol. 2010, 37, 58–62. [Google Scholar] [CrossRef]
  11. Wang, Q.; Geng, P.; Chen, C.; Chen, J.; He, C. Determination of seismic response of reinforced tunnel portal slope using shaking table tests. Tunn. Undergr. Space Technol. 2023, 136, 105072. [Google Scholar] [CrossRef]
  12. Liang, J.; Xu, A.; Ba, Z.; Wu, Z.; Yan, Q.; Zhu, Y. Seismic response of ultra-large diameter shield tunnel in upper-soft and lower-hard site: Shaking table tests and numerical simulations. Soil Dyn. Earthq. Eng. 2023, 164, 107634. [Google Scholar] [CrossRef]
  13. Bao, Z.; Yuan, Y.; Yu, H. Multi-scale physical model of shield tunnels applied in shaking table test. Soil Dyn. Earthq. Eng. 2017, 100, 465–479. [Google Scholar] [CrossRef]
  14. Tao, L.; Shi, C.; Ding, P.; Yang, X.; Bao, Y.; Wang, Z. Shaking table test of the effect of an enclosure structure on the seismic performance of a prefabricated subway station. Tunn. Undergr. Space Technol. 2022, 125, 104533. [Google Scholar] [CrossRef]
  15. Sun, W.; Guan, Z.; Chen, Y.; Pan, J.; Zeng, Y. Modeling of Preload Bolted Flange Connection Structure for Loosening Analysis and Detection. Shock. Vib. 2022, 2022, 7844875. [Google Scholar] [CrossRef]
  16. Zhang, G.; Zhang, W.; Li, J.; Zhou, X.; Liu, W.; Qi, J. Study on Assembly and Tensile Performance of Circumferential Anchor Joint for Shield Tunnel Considering Roughness and Size of Structure. KSCE J. Civ. Eng. 2023, 27, 2263–2274. [Google Scholar] [CrossRef]
  17. Zhu, Y.; Liu, X.; Zhang, C.; Zhang, C. Contrast test research on longitudinal joint withdifferent forms of bolts in metro shield tunnel. J. Rail Way Sci. Eng. 2015, 12, 1427–1435. [Google Scholar] [CrossRef]
  18. Zhang, W.; Qi, J.; Zhang, G.; Niu, R.; Zhang, C.; He, L.; Lyu, J. Full-scale experimental study on failure characteristics of the key segment in shield tunnel with super-large cross-section. Tunn. Undergr. Space Technol. 2022, 129, 104671. [Google Scholar] [CrossRef]
  19. Zhang, W.; Zhang, G.; Li, H.; Gao, W.; Guo, W.; Gao, P. Waterproof Performance of Sealing Gaskets and Impact of Construction Loads on Segment Joints in Shield Tunnel. China J. Highw. Transp. 2020, 33, 130–141. [Google Scholar] [CrossRef]
  20. Sun, F.; Li, W.; Li, C. Response Relationship between Longitudinal Joint Opening and Convergence Deformation of River Crossing Shield Tunnel. Chin. J. Undergr. Space Eng. 2023, 19, 309–318. [Google Scholar]
  21. Yin, J.; Jin, H.; Gong, Q.; Zhou, S. Effect of Circumferential Bolt Corrosion on Ultimate Bearing Capacity of Shield Tunnel. Chin. J. Undergr. Space Eng. 2020, 16, 508–515. [Google Scholar]
  22. Zhang, D.; Chen, C. Time-dependent Reliability Analysis of Shield Tunnel Structure under Corrosion Conditions of Segment Rebars and Bolts. Mod. Tunn. Technol. 2021, 58, 111–120. [Google Scholar] [CrossRef]
  23. Zeng, D.; He, C. Numerical Simulation of Segment Joint Bending Stiffness of Metro Shield Tunnel. J. Southwest Jiaotong Univ. 2004, 39, 744–748. [Google Scholar] [CrossRef]
  24. Li, F.; Gou, C.; Xu, D. Study on Structure Inner Forces Affected by Shield Tunnel Segment Joint Bending Stiffness. J. Wuhan Univ. Technol. 2013, 35, 73–78. [Google Scholar] [CrossRef]
  25. Peng, Y.; Gong, C.; Ding, W.; Lei, M.; Shi, C.; Wang, Y. Fluid-structure coupling model of shield tunnel considering seepage of segmental joints. China Civ. Eng. J. 2022, 55, 95–108. [Google Scholar] [CrossRef]
  26. Bao, X.; Li, P.; Cui, H.; Zhu, H. Dynamic Response of Complex Soft Clay due to Mero Tunnel Operation. Mod. Tunn. Technol. 2018, 55, 53–60. [Google Scholar] [CrossRef]
  27. Bao, X.; Xia, Z.; Ye, G.; Fu, Y.; Su, D. Numerical analysis on the seismic behavior of a large metro subway tunnel in liquefiable ground. Tunn. Undergr. Space Technol. 2017, 66, 91–106. [Google Scholar] [CrossRef]
  28. GB50010-2010; Code for Design of Concrete Structures. State Standard of the People’s Republic of China: Shanghai, China, 2011; p. 133.
  29. Zhang, W.; Zhang, Q.; Cao, W. Study on Stress and Deformation of Bolt Joints of Shield Tunnel under Static and Seismic Action. KSCE J. Civ. Eng. 2021, 25, 3146–3159. [Google Scholar] [CrossRef]
  30. JGJ 82-20112011; Technical Pecification for High Strength Bolt Connections of Steel Structures. State Standard of the People’s Republic of China: Shanghai, China, 2011; p. 78.
  31. Gao, F.; Zhao, F. Study on transformation method for artificial boundaries in static-dynamic analysis of underground structure. J. Vib. Shock. 2011, 30, 165–170. [Google Scholar] [CrossRef]
  32. Liu, J.; Wang, Z.; Zhang, K.; Pei, Y. 3d finite element analysis of large dynamic machine foundation considering soil-structure interaction. Eng. Mech. 2002, 19, 34–38. [Google Scholar] [CrossRef]
  33. Liu, J.; Gu, Y.; Du, Y. Consistent viscous-spring artificial boundaries and viscous-spring boundary elements. Chin. J. Geotech. Eng. 2006, 28, 1070–1075. [Google Scholar]
  34. Gu, Y.; Liu, J.; Du, Y. 3D consistent viscous-spring artificial boundary and viscous-spring boundary element. Eng. Mech. 2007, 24, 31–37. [Google Scholar] [CrossRef]
  35. He, J.; Ma, H.; Zhang, B.; Chen, H. Method and realization of seismic motion input of viscous-spring boundary. J. Hydraul. Eng. 2010, 41, 960–969. [Google Scholar] [CrossRef]
  36. GB 50909-20142014; Code for Seismic Design of Urban Rail Transit Structures. State Standard of the People’s Republic of China: Shanghai, China, 2014; p. 185.
  37. Zuo, L.; Li, G.; Feng, K.; Ma, X.; Zhang, L.; Qiu, Y.; Cao, S.; Feng, L. Experimental analysis of mechanical behavior of segmental joint for gas pipeline shield tunnel under unfavorable compression-bending loads. Tunn. Undergr. Space Technol. 2018, 77, 227–236. [Google Scholar] [CrossRef]
  38. Zheng, G.; Zhang, X.; Zhang, T.; Sun, J.; Qiu, H.; Diao, Y. Numerical study on mechanical behavior and ultimate bearing capacity of shield segment joints under different load conditions. Tunn. Undergr. Space Technol. Inc. Trenchless Technol. Res. 2023, 139, 105204. [Google Scholar] [CrossRef]
  39. Travasarou, T.; Bray, J.D.; Abrahamson, N.A. Empirical attenuation relationship for Arias Intensity. Earthq. Eng. Struct. Dyn. 2003, 32, 1133–1155. [Google Scholar] [CrossRef]
  40. Liu, J.M.; Gao, M.T.; Xie, J.J. Spatial Variability and Attenuation of Arias Intensity during the 1999 Chi-Chi Mw 7.6 Earthquake, Taiwan. Bull. Seismol. Soc. Am. 2015, 105, 1768–1778. [Google Scholar] [CrossRef]
  41. Amiri, G.G.; Mahmoodi, H.; Amrei, S.A.R. Seismic hazard assessment of Tehran based on Arias intensity. In Proceedings of the 2008 Seismic Engineering Conference Commemorating the 1908 Messina and Reggio Calabria Earthquake, PTS 1 and 2, Reggio Calabria, Italy, 8–11 July 2008. [Google Scholar] [CrossRef]
  42. Liu, J.M.; Wang, T.; Wu, S.R.; Gao, M.T. New Empirical Relationships between Arias Intensity and Peak Ground Acceleration. Bull. Seismol. Soc. Am. 2016, 106, 2168–2176. [Google Scholar] [CrossRef]
  43. Campbell, K.W.; Bozorgnia, Y. A Comparison of Ground Motion Prediction Equations for Arias Intensity and Cumulative Absolute Velocity Developed Using a Consistent Database and Functional Form. Earthq. Spectra 2012, 28, 931–941. [Google Scholar] [CrossRef]
  44. Chao, L.; Zhuohua, P.; Jie, C.; Xiangyun, H.; Yadong, L.; Weiyun, C. Development of crack and damage in shield tunnel lining under seismic loading: Refined 3D finite element modeling and analyses. Thin-Walled Struct. 2023, 185, 110647. [Google Scholar] [CrossRef]
  45. Jin, H.; Yu, K.; Gong, Q.; Zhou, S. Load-carrying capability of shield tunnel damaged by shield shell squeezing action during construction. Thin-Walled Struct. 2018, 132, 69–78. [Google Scholar] [CrossRef]
Figure 1. Stratum–structure model. (a) Stratum–structure model. (b) Layout of segment rings of tunnel. (c) Connection bolts at the joint of shield tunnel segment. (d) Refined model of lining ring.
Applsci 13 12889 g001aApplsci 13 12889 g001b
Figure 2. Load application stage.
Applsci 13 12889 g002
Figure 3. Three-dimensional artificial viscoelastic boundary.
Applsci 13 12889 g003
Figure 4. The acceleration time–history and Fourier spectrum of Kobe earthquake motion. (a) Acceleration time course curve (0.1 g Kobe). (b) The seismic wave Fourier spectrum.
Applsci 13 12889 g004
Figure 5. Pipe segment joint test. (a) Test loading machine. (b) Test loading model.
Applsci 13 12889 g005
Figure 6. Results of positive joint. (a) Component deflection. (b) Concrete cross-section strain. (c) Bolt cross-section strain. (d) Joint opening value.
Applsci 13 12889 g006
Figure 7. Joints opening monitoring point.
Applsci 13 12889 g007
Figure 8. Shield tunnel segment joint opening value. (a) Joints’ opening value at S3. (b) Joints’ opening value at S4. (c) Maximum opening value (PGA = 0.3 g). (d) Maximum opening value (PGA = 0.5 g).
Applsci 13 12889 g008
Figure 9. Ellipticity of the tunnel. (a) Radial deformation of segments. (b) Time-history of changes in ellipticity. (c) Non-recoverable ellipticity deformation.
Applsci 13 12889 g009
Figure 10. The acceleration of the monitoring points.
Applsci 13 12889 g010
Figure 11. Arias intensity at the monitoring points. (a) Arias intensity of arch spandrel with 0.1 g. (b) Arias intensity of arch spandrel with 0.3 g. (c) Arias intensity of arch spandrel with 0.5 g. (d) Average Arias intensity with 0.1 g. (e) Average Arias intensity with 0.3 g. (f) Average Arias intensity with 0.5 g. (g) Proportion of loss at each stage.
Applsci 13 12889 g011aApplsci 13 12889 g011b
Figure 12. Radial deformation amount in the static phase.
Applsci 13 12889 g012
Figure 13. Radial deformation amount in the dynamic phase. (a) PGA = 0.1 g. (b) PGA = 0.3 g. (c) PGA = 0.5 g.
Applsci 13 12889 g013
Figure 14. The radial deformation amount cannot be recovered. (a) The overall unrecoverable radial deformation, PGA = 0.1 g. (b) The overall unrecoverable radial deformation, PGA = 0.3 g. (c) The overall unrecoverable radial deformation, PGA = 0.5 g.
Applsci 13 12889 g014
Figure 15. Maximum longitudinal relative displacement. (a) Vertical displacement time history. (b) Maximum relative settlement.
Applsci 13 12889 g015
Figure 16. Structural damage rate under seismic load of 0.5 g.
Applsci 13 12889 g016
Figure 17. Cloud map of structural damage under seismic load. (a) SDEG of inner side of the crown. (b) SDEG of inner side of the arch bottom. (c) Tensile damage. (d) Compression damage.
Applsci 13 12889 g017
Figure 18. Cloud map of structural damage under seismic load. (a) Damage of segment BP when preload is 280 kN. (b) Damage of segment BP when preload is 160 kN. (c) Damage of segment BP with no preload. (d) Damage of segment A1 when preload is 280 kN. (e) Damage of segment A1 when preload is 160 kN. (f) Damage of segment A1 with no preload.
Applsci 13 12889 g018
Table 1. Uniaxial stress–strain relationship and concrete damage parameters.
Uniaxial Compression Uniaxial   Tension
Stress (MPa)Inelastic StrainDamage FactorStress (MPa)Cracking StrainDamage Factor
26.892003.42393900
38.4556.60.2086663.2576970.30.125466
34.99710.90.3092872.7015601.10.349736
28.69216.20.4200162.1694531.80.495345
23.00621.20.5135881.5613943.20.650423
18.64025.80.5867911.0450345.80.778459
15.40130.20.6433770.67589710.70.867185
12.98534.30.6875650.43070320.50.922839
9.72542.00.7510140.27229440.00.955944
6.31556.60.8242670.17133478.70.975075
3.62484.50.8900160.107651156.00.985949
1.784148.00.9415180.067876308.00.992065
0.032288953.00.996891
Table 2. Material parameters.
MaterialYoung’s Modulus (MPa)Poisson’s RatioMass DensityDamping Ratio
Silty clay1260.351.850.09
Concrete34,5000.202.420.02
Bolt210,0000.37.850.05
Table 3. The preload value corresponds to the temperature applied.
Preload
(kN)
Preload Loss Rate
(%)
Temperatures
(°C)
Carrying Capacity Redundancy (kN)
2800−150.86172.39
24014.29−129.31212.39
20028.57−107.76252.39
16042.86−86.21292.39
12057.14−64.66332.39
01000372.39
Disclaimer/Publisher’s Note: The statements, opinions and data contained in all publications are solely those of the individual author(s) and contributor(s) and not of MDPI and/or the editor(s). MDPI and/or the editor(s) disclaim responsibility for any injury to people or property resulting from any ideas, methods, instructions or products referred to in the content.

