1. Introduction
Technology developments in the field of aviation require continuous research and improvement of aircraft aerodynamic properties. These tests aim to evaluate aerodynamic forces and moments, static and dynamic stability, and aircraft performance. Information about the aerodynamic characteristics of a specific aircraft allows the pilot to have effective and safe control during flight. This is particularly crucial during critical flight phases, including aerobatic and combat maneuvers, as well as those related to takeoff and landing. For instance, to prevent a stall during landing, the pilot needs to know the minimal velocity and the maximum angle of attack, boundaries that allow for a safe approach.
Among relevant research methods, computational fluid dynamics (CFD) simulations are gaining attention due to their low cost and wide range of applications. The CFD method allows to solve issues related to the flow, in particular it enables the simulations of vortices, flow detachment and even the heat transfer and turbulence models became available all at once. Examples of adaptation for this technique can be found in [
1,
2,
3,
4]. In the first two papers, the CFD method was applied to the calculation of bioreactor hydrodynamics [
1], as well as to analyze interactions between the photovoltaic system and its environment [
2]. Furthermore, in [
3], a CFD simulation was also used to determine the temperature field in an urban area and, in [
4], to perform temperature and pressure field estimation in a dry scroll vacuum pump. There are a number of CFD method applications in the field of aerodynamics [
5,
6,
7,
8,
9]. Paper [
5] presents the results of airfoil parameter optimization using machine learning methods in conjunction with CFD simulations. The relationship between the lift-to-drag characteristics and the angle of attack for different airfoils was calculated. Thus, the high costs of experiments and simulations were avoided. In [
6], the CFD and experimental data were used with an artificial neural network to develop a forecasting model of the wing temperature intended for an anti-icing system. Moreover, paper [
7] considers the aerodynamic performance of a vertical-axis wind turbine. In this work, a comparison of two-dimensional (2D) and three-dimensional (3D) CFD models utilizing the unsteady Reynolds-averaged Navier–Stokes (URANS) approach was shown and discussed. Additionally, in [
8], a computational fluid dynamics simulation of flow passage along rotor–stator domains of a gas turbine engine was investigated and analyzed. The results obtained were compared with published data in the literature. In [
9], the CFD method was used for preliminary aerodynamic analysis of a helicopter’s main rotor blade.
Like any computational method, CFD requires validation with representative examples. This validation can be achieved using experimental results obtained in flight tests or based on data acquired from wind or hydrodynamic tunnel tests. Among these research methods, tests in hydrodynamic tunnels are gaining more and more recognition due to their speed, low cost, and wide range of applications [
10]. Hydrodynamic tunnels, using water as a working medium, offer a number of advantages over classic wind tunnels. Water is about 800 times denser than air under standard conditions. Its dynamic viscosity is 50 times higher and it has a lower mass diffusivity, which facilitates the visualization of flow and the study of complex flow dynamics. Wind and water are both considered fluids. Consequently, both media are subject to the principles of fluid mechanics. When studying models in both wind tunnels and hydrodynamic tunnels, the same similarity criteria and dimensionless numbers are applied, taking into account the fluid density. Therefore, due to its higher density, water is more suitable for flow visualization, which is an advantage over wind tunnels, where the visualization medium disperses and it is harder to show the flow. Another benefit of hydrodynamic tunnels is that the model required for testing is smaller, resulting in cost savings. In the case of quantitative research, the obtained results converge for both types of tunnels. In paper [
11], comparative studies were presented, conducted in both hydrodynamic and aerodynamic tunnels, which showed minor discrepancies between the results obtained using these methods. However, hydrodynamic tunnels allow for simultaneous load measurements and high-quality flow visualization above the model surface, enabling a direct correlation between loads and flow images. Additionally, a hydrodynamic tunnel enables testing the aerodynamic properties of an aircraft during dynamic changes in spatial position. A wide range of applications of hydrodynamic tunnels is described in [
11,
12,
13,
14,
15,
16]. The research team in [
11,
12,
13,
14] focuses on the comparative analysis of aircraft streamlining and stability characteristics of a known aircraft, while NASA teams [
15,
16] focus on designing numerical models and verifying their results using experiments in wind and hydrodynamic tunnels. Furthermore, the work [
17] shows the results of a hydrodynamic tunnel test of a micro aerial vehicle. During this study, the aerodynamic coefficients were measured and then used to obtain the aerodynamic derivatives using computational software. Additionally, [
18] presents the results of static characteristic identification using the hydrodynamic tunnel.
Some of the current literature contains references to research results that compare CFD simulation and data obtained with the use of a wind tunnel [
19]. In that work, aerodynamic coefficients were estimated using CFD computation and the wind tunnel test. A comparison of the results shows a considerable difference between the data obtained with these two methods, which can be attributed to the challenges in accurately modeling turbulence, particularly in transitional flow. For this reason, this paper proposes to verify the calculations made using the CFD method through test results in a hydrodynamic tunnel. Research performed in a hydrodynamic tunnel enabled visualization and recording of the aerodynamic properties of the aircraft in the event of substantial dynamic changes in flow, e.g., related to flow detachment, stall and spin recovery, wind shear, and steep landing approach.
The reliability of the presented work consists of a comparative analysis of the results obtained using the CFD method and hydrodynamic tunnel tests of the flow on the same scale. Both cases considered an aircraft model on a 1:50 scale generated using the same CAD model.
The content of this paper is organized as follows: In the first section, the test model geometry based on the General Dynamics F-111 “Aardvark” aircraft is introduced and its reference parameters are defined, as well as the coordinate systems. Next, the simplifications and assumptions used in CFD computation and hydrodynamic tunnel tests are presented. The third section shows the results of the performed studies. Further discussion of the results obtained with both methods is presented. Finally, concluding remarks based on the achieved results are described.
2. Study Object—General Dynamics F-111 “Aardvark”
To perform comparative analyses between the results obtained in the hydrodynamic tunnel and those obtained using the computational fluid dynamics (CFD) method, the authors chose the geometry of the General Dynamics F-111 “Aardvark” combat jet aircraft. This geometry was chosen as the subject of the study due to the full access to its technical documentation necessary for creating a three-dimensional geometric model intended for simulation and experimental research.
The General Dynamics F-111 “Aardvark” aircraft was an American multirole aircraft with variable-sweep wings. It was designed in the 1960s by the General Dynamics company. One of the distinctive features of the aircraft was its variable-sweep wing mechanism, which allowed them to be adjusted in-flight for different flight conditions, from takeoff and landing to high-speed flight. The plane was a multirole design, intended for missions such as ground attack, strategic bombing, interception, and air-to-air combat. It had several variants, including fighter-bomber versions, reconnaissance variants, and specialized air-to-air combat models. The variants differed in terms of armament, equipment, and capabilities. The plane entered service with the United States Air Force and Navy in the 1960s. Its primary role was to engage ground targets during the Vietnam War and the Gulf War [
20].
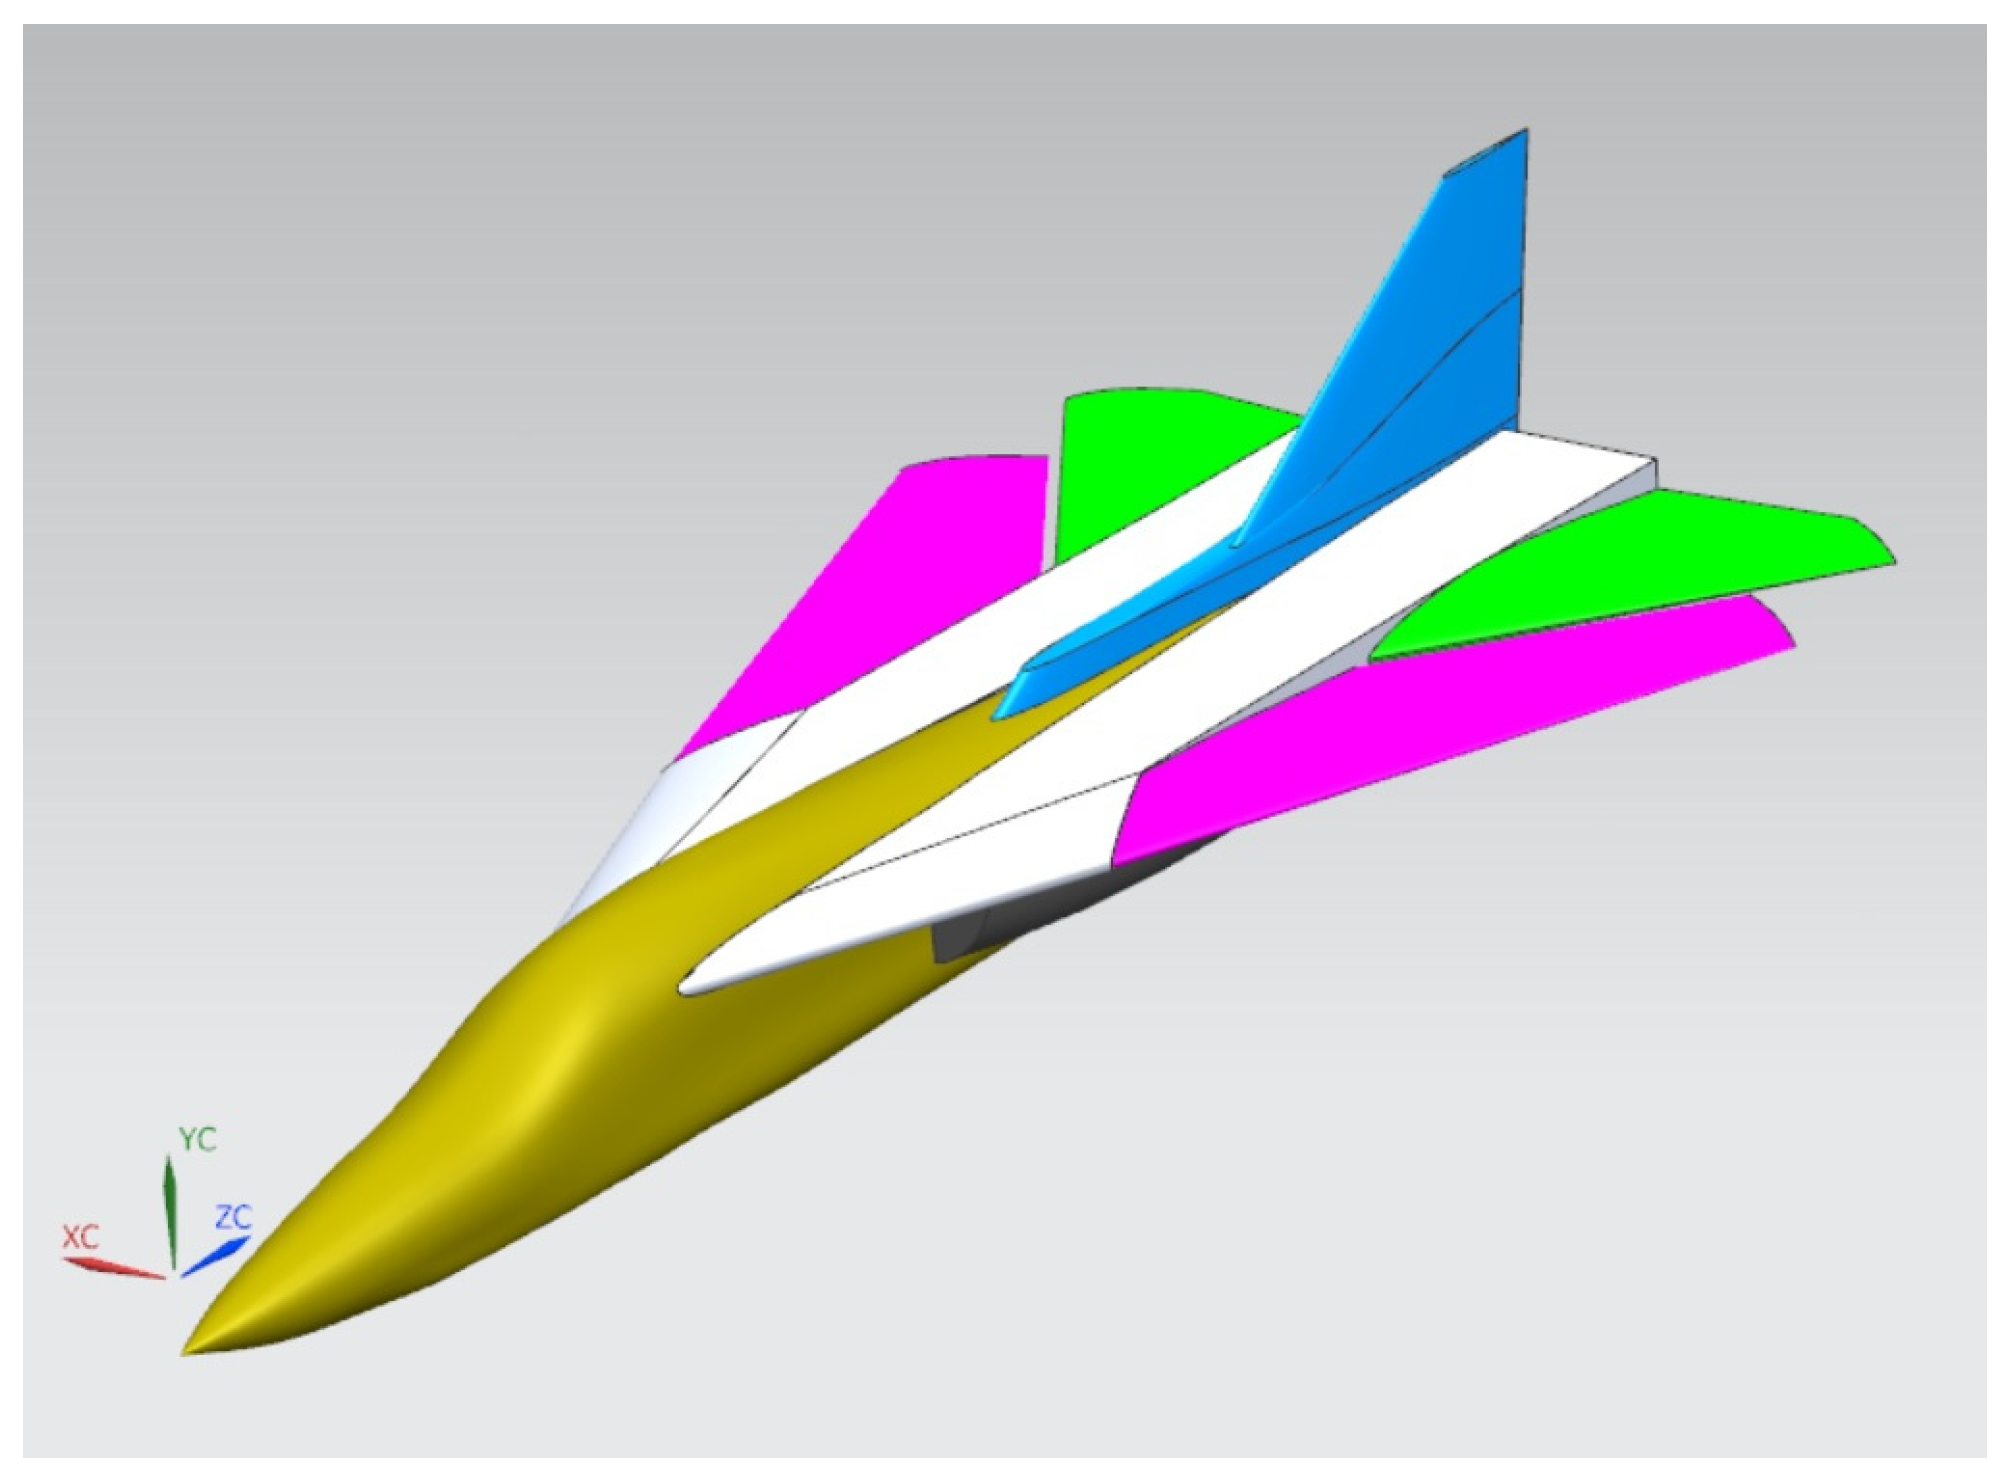
The geometry of the General Dynamics F-111 “Aardvark” aircraft was chosen for comparative analysis because of its specific configuration properties, especially the folding wings. Tests were performed for different angles of attack and also for high values to verify an adequacy between CFD computations in real-scale and hydrodynamic tunnel experiments. Here, both CFD and tunnel tests were performed using the same scale and fluid (water), so the scale influence, as well as flow similarity issues with different fluids, was neglected. Additionally, the same aircraft geometry model was used in these studies, as shown in
Figure 1.
The aircraft model used in comparative tests was created based on a 1:50 scale model using SolidWorks 2022 CAD 3D software to represent the aircraft and its aerodynamic configuration. In this model, certain features such as engine inlet cones, boundary layer separators, and ventral fins were omitted due to their negligible impact on the flow over the upper surface of the wing.
2.1. F-111 Aircraft Model for CFD Method
Regarding the computational aspects of the aerodynamic characteristics of the F-111 aircraft, all calculations were conducted using the ANSYS Fluent code, a widely recognized industry standard for such analyses. The CFD simulation of the hydrodynamic tunnel demands specific settings for the model domain. Since the model is in a closed test chamber, its walls have to be present in the simulation. Moreover, the model has to have an ability to change the angle of inclination, which was treated as the angle of attack in this study. Nevertheless, the symmetry of the flow condition can be assumed along with the symmetry of the geometry. A plane of symmetry can be used, which decreases the computational effort by a half, assuming the same mesh density. The computational domain has a pressure inlet and outlet and is surrounded by walls. The upper wall is a free surface of the water in the experiment, but in this study, the wall condition was assumed. The aircraft geometry is placed in a cylinder which can be rotated to obtain the desired angle of attack, using the sliding mesh calculation ability of ANSYS Fluent. The interface zone (
Figure 2) can match the flow inside and outside the cylinder, even if the meshes on both sides do not match. This zone is invisible to the flow and allows the fluid to move freely through its surface.
The mesh around the model consists of tetrahedral elements with prismatic fragments around all the walls to simulate the boundary layer. The first cell height on the wall is set to obtain the
Y+ parameter around 1, which is suggested in the simulations using the
K-ω SST 4-equation turbulence model (also known as
γ-Reθ) [
21]. The adequate boundary layer parameters were set for water (first layer from the wall height of 0.002 mm, height ratio of 1.2, and 20 layers). The mesh density is shown in
Figure 3. A non-matching interface is shown here, and the flow through the interface does not cause errors in the flow uniformity inside the cylinder. The density of the mesh was set based on the experience and best practices of the authors, and allows reasonably accurate qualitative results to be obtained.
The default model of the water material in ANSYS Fluent was set with a constant density of 998.2 kg/m3 and viscosity of 0.001003 kg/(m s). The density-based solver with an absolute velocity formulation and a steady type of time solution was set. An implicit solution formulation was used with Roe-FDS flux type and second-order flow spatial discretization. Regarding the time discretization, the Courant number was set to 5 with standard underrelaxation factors.
Simulation studies were conducted under steady-state conditions to investigate quasi-static vortices shedding from the wing, as no von Kármán vortex path or similar unsteady phenomena were observed.
In all simulations the two basic coordinate systems were used: the OXYZ–CAD model coordinate system, in which the geometry was drawn; and the AX
AY
AZ
A flow coordinate system, with the center of the cylinder oriented with the flow direction. In this coordinate system, the results are presented in terms of aerodynamic force
Px,
Py, and
Pz, and moment components
Mx,
My, and
Mz, converted into the nondimensional, coefficient form. The aerodynamic force coefficients,
Cx,
Cy, and
Cz, are defined as:
where
ρ is air density,
S denotes the lifting surface, and
V is the flow velocity. The symbols
Px,
Py, and
Pz denote the drag force, side force, and lift force, respectively.
The aerodynamic moment coefficients,
Cmx,
Cmy, and
Cmz, are defined as:
where
MAC is the mean aerodynamic chord. The symbols
Mx,
My, and
Mz denote the roll, pitch, and yaw moments, respectively.
The mean aerodynamic chord is defined in
Figure 4 and its value is shown in
Table 1. As a lifting surface, only the surface of the variable-sweep part of the wing, along with its part submerged in the fuselage, is used as the reference. Such a method of defining the mean aerodynamic chord allows the precise determination of the aerodynamic characteristics of the wing or other parts of the aircraft, which could be more problematic if the horizontal stabilizer is taken into account (green part in
Figure 4).
The aerodynamic characteristic set includes the coefficients of lift, drag, moment, and other parameters that describe how the wing responds to the airflow under various flight conditions. Based on this set of data, the assessment of the stability and controllability of the aircraft can be obtained. This means that one can understand the moments generated on the airframe in different situations and the forces required to control the aircraft’s motion.
2.2. F-111 Aircraft Model for Hydrodynamic Tunnel Tests
In order to obtain the measured data from the experiment in the hydrodynamic tunnel, a CAD model of the aircraft with a special strain gauge balance mount has to be made first (
Figure 5). The balance reference point at the 25% part of the MAC projected at the symmetry plane should be properly placed, with the strain gauge fitting inside the model. This reference point placement should allow for an easy measurement of the model, since slight differences in model mounting will cause a visible difference in the measured moment.
The 1:50 scale model was made using incremental technology. It consists of layers of heat-shrinkable material (PLA). The layers of material were joined together under the influence of temperature. Unfortunately, the effect of the layered structure is to create an uneven surface of the test model. In order to obtain data from the hydrodynamic tunnel test as accurately as possible, the surface quality of the model must be improved. Satisfactory roughness of the model was achieved by grinding and painting the surface.
Creating aircraft models for testing in wind tunnels is a key element of the research process. Essentially, the model must accurately replicate the shape and size of the original aircraft and have similar material properties. Although hydrodynamic tunnels are an effective tool for testing the aerodynamic properties of an aircraft, the process of preparing aircraft models for testing is often complicated, time-consuming, and expensive. The choice of model production technology is crucial because different techniques present unique advantages and limitations. For example, 3D printing is fast and precise, allowing for complex shapes to be created from a variety of materials. However, the cost of 3D printers and printing materials can be very high, especially when using advanced technologies such as selective laser sintering (SLS) or 3D metal printing [
22]. By comparison, CNC machining techniques are capable of producing very high-quality models. However, in order to achieve adequate precision, these techniques require expensive equipment and skilled labor. In addition, the CNC machining process is usually time-consuming, especially when producing complex shapes [
23]. Traditional methods, such as carving, can be relatively cheap, but they are also time-consuming and require a high level of skill. Moreover, hand-made models may not be precise enough for certain applications [
24].
Preparing a model for tunnel testing using 3D printing presents a design challenge. Such models can be prepared employing two different 3D printing technologies: Multi-Jet Modeling (MJM) and Fused Deposition Modeling (FDM). Both 3D printing technologies have unique advantages and disadvantages. MJM technology offers higher precision and accuracy, but is more costly and requires more time to produce. Alternatively, FDM technology is more economically efficient, enables faster production, and offers a greater durability of models, which can be crucial in the context of hydrodynamic research.
The geometry used for CFD simulation has perfect surfaces, and the level of detail accuracy depends only on the designer preparing the model in SolidWorks 2022 CAD software. On the other hand, for a 3D-printed model intended for experimental research, there will always be certain imperfections associated with factors such as the roughness of the layered structure or the mechanical properties of the material.
The key feature of a model is sufficient stiffness of the materials. Hydroelasticity is a real problem in hydrodynamic tunnels, and usually, aircraft models have wings and tail fins that are thin in one direction, causing the surfaces to bend. In transonic wind tunnels, those surfaces are machined using rust-resistant steel. As such, those parts maintain their angle of inclination in the critical range of the angle of attack. If 3D printing is used, those properties of the model have to be tested, otherwise the results will be unreliable.
3. Results
Comparative studies of the aerodynamic properties of the General Dynamics F-111 “Aardvark” aircraft were conducted using ANSYS Fluent software and a hydrodynamic tunnel. In both cases, the model having the same geometry as depicted in
Figure 1 was employed. For calculations conducted in ANSYS Fluent software, the model was imported from a file created in SolidWorks 2022. For tunnel testing, the model was prepared using a 3D printer for the same geometry. For both methods, qualitative results in the form of flow-field images and visualization of the vortex, and quantitative results in the form of aerodynamic characteristics, including the coefficients of lift, drag, and pitching moment for different angles of attack, were obtained.
The simulation and experimental research were planned in a way such that the measurement conditions were as similar as possible. In both cases, the working fluid was water at a temperature of 20 degrees Celsius. The flow velocity of the working fluid was set at 0.3 m/s. For qualitative analysis, studies were conducted for seven angles of attack, specifically 25, 30, 35, 40, 45, and 50 degrees. Due to the strain gauge limitations, quantitative analysis in the hydrodynamic tunnel was performed for angles of attack equal to 0, 2.5, 5, 7.5, 10, 12.5, 15, 17.5, 20, 22.5, 25, 27.5, and 30 degrees. In the CFD analysis, angles of 0, 25, 30, 35, 40, 45, and 50 degrees were used. Additionally, quantitative characteristics in CFD were conducted for the entire structure, but the partial values for its individual components (wings, tail fins, fuselage) were also available. In both methods, aerodynamic characteristics, including the coefficients of lift, drag, and pitching moment, were determined. Below are the results of the studies conducted according to the assumed research plan.
3.1. CFD Simulation with the Use of ANSYS Fluent Software
During the first stage of the studies, the aerodynamic properties of the F-111 “Aardvark” aircraft model were determined using the CFD method and ANSYS Fluent software. The results are grouped in the following parts:
- −
The quantitative results for the entire aircraft and distribution of shares in force and moment component coefficients of each airframe part (
Figure 6,
Figure 7 and
Figure 8).
- −
The qualitative results in the form of pressure distribution in a specified vertical plane near the wing root, where the flow is illustrated with the pathlines released from the area in front of the wing. In this way, the reader can compare the flow and pressure fields in one drawing (
Figure 9 and
Figure 10).
Figure 6.
Distribution of the drag coefficient share along the airframe components.
Figure 6.
Distribution of the drag coefficient share along the airframe components.
Figure 7.
Distribution of the lift coefficient share along the airframe components.
Figure 7.
Distribution of the lift coefficient share along the airframe components.
Figure 8.
Distribution of the pitching moment coefficient share along the airframe components.
Figure 8.
Distribution of the pitching moment coefficient share along the airframe components.
Figure 9.
Pathline visualization of the vortex above the delta configuration of the F-111 aircraft model for the velocity of V = 0.3 m/s and an angle of attack: (a) α = 25°; (b) α = 30°; (c) α = 35°; (d) α = 40°; (e) α = 45°; (f) α = 50°. Pressure is expressed in Pa.
Figure 9.
Pathline visualization of the vortex above the delta configuration of the F-111 aircraft model for the velocity of V = 0.3 m/s and an angle of attack: (a) α = 25°; (b) α = 30°; (c) α = 35°; (d) α = 40°; (e) α = 45°; (f) α = 50°. Pressure is expressed in Pa.
Figure 10.
Pressure distribution above the lifting body of the F-111 aircraft model along with pathline vortex visualization for the velocity of V = 0.3 m/s and an angle of attack: (a) α = 25°; (b) α = 30°; (c) α = 35°; (d) α = 40°; (e) α = 45°; (f) α = 50°. Pressure is expressed in Pa.
Figure 10.
Pressure distribution above the lifting body of the F-111 aircraft model along with pathline vortex visualization for the velocity of V = 0.3 m/s and an angle of attack: (a) α = 25°; (b) α = 30°; (c) α = 35°; (d) α = 40°; (e) α = 45°; (f) α = 50°. Pressure is expressed in Pa.
During the studies, results were obtained for a wide range of angles of attack, up to 50°, which is beyond the stall angle for an aerodynamic design that shares many similarities with strake wings. Beyond the typical stall range, the vortex attachment lift is utilized to prevent a sudden loss of lift. This vortex remains clearly visible throughout the entire range, but at an angle of attack greater than 40°, even this vortex detaches from the trailing edge. The separation also reduces the area of negative pressure above the leading edge of the wing.
Figure 9 and
Figure 10, presenting the qualitative results for the CFD calculation, were compared for the constant speed and changing angle of attack.
Figure 9 shows the behavior and separation of the strake vortex, and
Figure 10 better visualizes the distribution of the pressure above and below the lifting part of the fuselage.
In
Figure 6, the obtained aerodynamic drag coefficients for the entire structure and its individual components are presented. As seen, the most critical angles are α = 25° and α = 40°. At the angle of attack α = 25°, an increase in drag due to the vortex lift appears, while at α = 40°, the vortex detaches from the upper surface, which is observed as a decrease in drag.
Figure 7 depicts the aerodynamic lift coefficients obtained for the entire structure and its individual components. For this characteristic, the critical point is α = 40°, where the “stall” (flow detachment from the airframe effecting in the loss of lift) appears. In
Figure 8, characteristics for the pitching moment are presented. In this case, the critical point is also 40 degrees. The remaining ones, the side force, and the roll and yaw moment components, are assumed to be zero, since the symmetry of flow and geometry were assumed.
Figure 9 presents qualitative results in the form of streamlines released in front of the aircraft seen from the side for seven angles of attack: 25, 30, 35, 40, 45, and 50 degrees. Furthermore, in
Figure 10, the streamlines can be observed on the side view.
3.2. Hydrodynamic Tunnel Tests
During the second stage of the studies, the experimental tests verifying the results obtained in CFD were conducted using the RHRC hydrodynamic tunnel located at the Military University of Technology in the Flow Research Tunnel Laboratory (
Figure 11). This is a compact unit, where all the parts are placed on the main supporting structure made of steel profiles.
The measuring element of the RHRC tunnel is a five-component strain gauge balance (
Figure 12) dedicated to measuring two forces and three moments. This measurement system is not able to determine the drag force, but it can be calculated based on obtained data.
Figure 12 depicts the research model placed on a five-component strain gauge support. The above-mentioned support enables precise manipulation of the model (angles of inclination, pitch, and deviation).
During the hydrodynamic tunnel testing, similarly to the previous simulation studies, a 1:50 scale model of the F-111 “Aardvark” aircraft was used. As mentioned above, this model was 3D printed based on the geometric model prepared in SolidWorks 2022 software. The F-111 model was designed to meet the geometric similarity criteria. Before commencing the tests, it was necessary to input the following values related to the model and measurement zone: reference area, span, MAC, planform area, and tunnel x-section in the hydrodynamic tunnel software.
The results of the aerodynamic property study of the F-111 “Aardvark” aircraft model conducted in a hydrodynamic tunnel are presented in the following section. This section includes a comparison of simulation and experimental results related to quantitative changes in the values of aerodynamic coefficients Cz, Cx, Cmy, as well as the results of the qualitative studies involving the visualization of the flow around the model at different angles of attack. Due to technical conditions, during hydrodynamic tunnel studies, the measurement range was conducted in the range α = <0°, 30°>.
4. Discussion
In this paper, theoretical and experimental investigations aimed at obtaining the aerodynamic performance of the F-111 “Aardvark” aircraft were carried out. First, the aerodynamic coefficients were calculated and the pathline visualization of the vortex was obtained with use of ANSYS Fluent software. Then, the same results were achieved experimentally using a hydrodynamic tunnel. The calculation output was compared with the experiment in two main parts, i.e., as qualitative and quantitative results. For qualitative analysis, studies were conducted for angles of attack ranging from 25 to 50 degrees with a 5-degree increment. Quantitative analysis in the hydrodynamic tunnel, due to limitations of the strain gauges, was performed for angles of attack ranging from 0 to 30 degrees with a 2.5-degree increment. In the CFD analysis, angles ranging from 0 to 50 degrees with a 5-degree increment were used.
Figure 13 and
Figure 14 depict a comparison of the qualitative results obtained using ANSYS Fluent software and the hydrodynamic tunnel. The figure was created by overlaying graphics generated using computational software from a photo derived from the water tunnel testing. A detailed description of the elements being compared is provided in
Figure 13.
In
Figure 13, an overlay of two images is presented, one from the CFD simulation and the other from the visual study at a 25-degree angle of attack. Due to the use of the same CAD model, the F-111 model matches 100%. The dashed lines labeled as “Streamlines” represent the results obtained from CFD. The area labeled as “Turbulent flow” depicts the results obtained in the hydrodynamic tunnel.
From the above figures, it can be concluded that there is a very high level of agreement in the obtained qualitative results.
Figure 15 presents a comparison of the quantitative results (non-zero component of the force and moment coefficients) obtained using ANSYS Fluent software and the hydrodynamic tunnel. In
Figure 16, a comparison of the drag force coefficients is shown, and
Figure 17 shows a comparison of the pitching moment coefficients.
In
Figure 15, a comparison of the quantitative results for the lift force coefficients obtained in CFD and the hydrodynamic tunnel is presented. The difference in results fluctuates within the range of 8% up to an angle of 25 degrees and 7% at an angle of 30 degrees. For the drag force coefficients shown in
Figure 16, the difference is 9% for 25 degrees and 10% for 30 degrees. On the other hand, the deviation for the moment coefficients falls within the range of 9% (
Figure 17). The differences between the CFD studies and hydrodynamic tunnel tests in the lift coefficient (
Figure 15) are rather small, and could be both the effect of the CFD modeling (without a sting and with inadequately resolved vortices or boundary layer) and the experiment (rather than being an effect of the too-low model mount stiffness, it appears to be a difference in the zero position and some difference proportional to the measured force). The difference in the drag coefficient (
Figure 16) is constant along the increase in the angle of attack and is most probably an effect of not including the bottom drag in tunnel tests or not modeling the sting in CFD simulation; however, the consistency of both results suggests that the CFD modeling of the flow was adequate in terms of the modeled phenomena (sudden increase at the same angle of attack). The moment characteristic (
Figure 17) shows that the main factor of differences is rather a difference in the 0 angle of attack between CFD computation and tunnel tests. The increase in the difference between the results with the increase in the angle of attack is small, so the difference source is not at the nose or tail of the aircraft.
The force measurement test in the hydrodynamic tunnel was conducted at 30 degrees due to the presence of significant forces on the strain gauge, which posed a risk of damaging it. Overall, the advantage of the hydrodynamic tunnel tests is the short duration of the experiments. On the other hand, the benefit of CFD is the absence of limitations regarding the range of angles for which measurements are performed. One of the few advantages of CFD over the experiment is its ability to obtain the results divided into real airframe-part zones. Similar information in the experiment is rather hard to obtain and usually unavailable; nonetheless, its value for the designers is unquestionable. At the outset, it is important to note that in order to obtain accurate results in CFD, the operator conducting the calculations must be highly specialized, with years of experience. To perform measurements in a hydrodynamic tunnel, one only needs to be trained in operating the measurement equipment; experience is not required.
5. Conclusions
This paper presents the results of simulation and experimental research on the aerodynamic characteristics of an aircraft model with variable wing geometries in a folded configuration. During these studies, the General Dynamics F-111 “Aardvark” aircraft model was used. It was prepared using Solid Works 2022 software and then made with the use of 3D printer for experimental tests.
Simulation studies were conducted employing the CFD method implemented in ANSYS Fluent software, and experimental tests were performed in a hydrodynamic tunnel. In both cases, the tests were carried out for the same medium (water) and scale, and a similar range of the angle of attack due to the risk of damaging the strain gauge. The aerodynamic coefficients of the force and moment were obtained, as well as the pathline vortex visualization.
The quantitative CFD results are also available for the named zones of the model corresponding to individual aircraft components, which is a significant advantage of this method. The simulations cover a wide range of angles of attack, revealing essential aerodynamic phenomena such as airflow detachment and vortex behavior, especially in critical areas. On the other hand, in the hydrodynamic tunnel, experimental tests were conducted using real water and a specially prepared model of the aircraft with a measurement system. The results of these tests, including aerodynamic forces and moments coefficients, are also presented and compared with CFD computations.
During the comparative analysis of results obtained using ANSYS Fluent software and experimental results from the hydrodynamic tunnel, the aerodynamic coefficient values were compared for angles of attack ranging from 0° to 30°. The maximum value of angle of attack was limited by the technical constraints of the utilized strain gauge weight system in the hydrodynamic tunnel. Nonetheless, for the mentioned range of studies, the results obtained were very consistent. Slight discrepancies between the results obtained using the CFD method and those obtained from the hydrodynamic tunnel allow for the selection of a more convenient method for a given problem.
Upon analyzing the discrepancies between the CFD simulation and hydrodynamic tunnel test results, the main conclusion is that, even if the CFD method does not provide the exact values backing up the tunnel results, it shows the tendency with great accuracy. Therefore, the conclusions regarding the aircraft stability would be valid using both methods when recalculated to real scale and velocity; in other words, to the real Reynolds number.
This comparison of the CFD results with the hydrodynamic tunnel tests contributes to the development of a research methodology in aerodynamics. The benefits of using CFD, such as accurately determining the contributions of individual structural elements for generating aerodynamic forces and moments, are emphasized. Simultaneously, hydrodynamic tunnel experiments validate the results and provide the visualization of the flow behavior under dynamic conditions.
In summary, the article presents a comprehensive approach to aerodynamic research, leveraging the advantages of both CFD and hydrodynamic tunnel testing. This is a significant contribution to advancing knowledge in aerodynamics and enhancing our understanding of flow behavior under various flight conditions.


