Article

Analysis of Topographic Feature Parameters of Dinosaur Valley Ring Tectonic Geomorphology Based on the Advanced Land Observing Satellite Digital Elevation Model (ALOS DEM)

1
Faculty of Land Resources and Engineering, Kunming University of Science and Technology, Kunming 650093, China
2
Application Engineering Research Center of Spatial Information Surveying and Mapping Technology in Plateau and Mountainous Areas Set by Universities in Yunnan Province, Kunming 650093, China
3
Key Laboratory of Mountain Real Scene Point Cloud Data Processing and Application for Universities in Yunnan Province, West Yunnan University of Applied Sciences, Dali 671006, China
*
Author to whom correspondence should be addressed.
Appl. Sci. 2023, 13(24), 13137; https://doi.org/10.3390/app132413137
Submission received: 25 September 2023 / Revised: 30 November 2023 / Accepted: 5 December 2023 / Published: 10 December 2023

Abstract

:
Geomorphological surveys and terrain analysis are essential for geomorphology, hydrology, and geographic information systems (GIS). Terrain characterization parameters are fundamental for comprehending geomorphological processes, delineating landforms, and evaluating geohazards. Hence, this study relies on data from the Gaofen-2 satellite (GF-2) and the Advanced Land Observing Satellite Digital Elevation Model (ALOS DEM). Focusing on the ring tectonics landform of Dinosaur Valley, the research utilizes visual interpretation, GIS terrain parameter extraction techniques, and visual mapping to identify, measure, and analyze terrain features. The results indicate that ALOS DEM can offer accurate geomorphic feature information. The optimal threshold for extracting the surface water system network is 150, and the optimal analysis window for extracting terrain feature parameters is 16 × 16 (0.04 km2), determined through statistical methods. This study reveals distinct double-ring linear features and prominent ring-shaped terrain characteristics by extracting terrain feature parameters and utilizing mathematical and statistical analysis. The topography gradually ascends from the center to the ridgeline and then descends to the valley line, resembling a bowl shape. This study highlights the potential application of ALOS DEM for accurately identifying topographic features in the intricate mountains of the Yunnan Plateau. It establishes a practical research framework for high-precision topographic datasets and geomorphological characterization, facilitating further analysis of the evolution of topographic development and the assessment of tectonic activity.

1. Introduction

Topography is recognized as a fundamental natural geographic feature and a critical determinant of surface processes [1]. The investigation of topographic and geomorphic features consistently holds significant scientific value in enhancing our comprehension of Earth’s surface morphology, the evolution of geomorphic development, and geological history. Within this context, geomorphology encompasses mountains, valleys, plateaus, and rivers, playing a vital role in shaping surface features and influencing the occurrence of natural disasters [2,3]. Given the growing integration of geomorphometry and terrain analysis with associated disciplines, including mathematics, physics, and information science, exploring terrain features has transitioned from qualitative to quantitative research [4]. Furthermore, it furnishes crucial primary data for geomorphology, hydrology, soil science, and geographic information systems (GIS [5]).
Moreover, utilizing high-resolution terrain data can propel the advancement of terrain analysis research. Due to the rapid advancements in photogrammetry, remote sensing (RS) technology and geographic information science have made high-precision topographic data available, facilitating precise mapping and analysis of topographic features. Within this context, terrain feature parameters can be derived from Digital Elevation Model (DEM) [6,7,8] data. Furthermore, terrain feature parameters serve as effective metrics and indicators for investigating regional morphological features and conducting quantitative analysis of topographic and geomorphic features. Presently, they are extensively employed to investigate geomorphic units and diverse studies on geomorphic features, including glacial or aeolian geomorphology.
Various studies characterizing terrain topography have been conducted to date, utilizing the Digital Elevation Model (SRTM DEM) generated by the Shuttle Radar Topography Mission and the Advanced Spaceborne Thermal Emission and Reflection Radiometer Global Digital Elevation Model (ASTER DEM). Furthermore, ASTER DEM was employed for topographic characterization of diverse terrains. For instance, Fang et al. [9] derived a Digital Elevation Model (DEM) from digital topographic maps using interpolation to extract and analyze the topographic features of the Yanwachuan watershed in the loess high plateau gully area. Zhang et al. [10] conducted topographic characterization of the Qilian Mountain Nature Reserve utilizing SRTM DEM data. Madavi Venkatesh [11] utilized SRTM DEM and remote sensing satellite data for morphometric parameter analysis of the Betwa River basin in central India. This enabled an understanding of spatial variations in morphometric parameters for assessing hydrological, geological, and topographic features. Zhang et al. [12] employed SRTM DEM for the geomorphic characterization and morphological delineation of the Qinba Mountain Area. Su et al. [13] examined the geomorphological features of the Niyang River basin using ASTER DEM data.
However, the spatial resolutions of SRTM and ASTER DEM are 90 m and 30 m, respectively [14], introducing accuracy limitations for terrain characterization in smaller areas. Hence, the employment of the Radiometric Terrain Correction (RTC) digital elevation model (DEM) from the Advanced Land Observing Satellite Phased Array L-band Synthetic Aperture Radar (ALOS-PALSAR) with a spatial resolution of 12.5 m is recommended for terrain feature analysis. The 12.5 m spatial resolution of ALOS DEM data meets the requirements for data analysis and mapping with heightened accuracy, representing the globally available DEM data with the highest precision. Moreover, the globally accessible DEM data is freely available [15]. Consequently, the ability to extract terrain characteristic parameters from publicly available high spatial resolution DEM data for identifying and quantitatively analyzing highland mountainous areas with intricate terrain structures is of scientific significance.
The circular landform in Dinosaur Valley, situated in the mountains of the Yunnan Plateau, has garnered considerable attention due to its distinctive circular features captured in remote sensing images. Hence, its topographic characterization holds crucial theoretical significance in the realm of remote sensing geology [16]. However, current studies predominantly concentrate on small-area topographic characterization using UAV data [17,18,19], often neglecting comprehensive consideration of the overall topographic features. In addition, various terrain feature parameters depict terrain features from distinct perspectives. Determining the optimal combination of these parameters holds specific research significance for identifying and quantitatively analyzing terrain features across multiple dimensions. This also presents a novel research concept and foundation for exploring terrain features.
This study focuses on the annular landform in Dinosaur Valley, located in Lufeng City, Chuxiong, Yunnan Province, as the designated study area. Utilizing ALOS DEM data, terrain feature parameters are extracted and optimal combinations are explored for multi-dimensional, qualitative, and quantitative identification, measurement, and analysis of the terrain features. This is achieved through visual interpretation, DEM visualization, and GIS terrain feature extraction and analysis. The study showcases the potential application of ALOS DEM data in characterizing terrain in the intricate mountains of the Yunnan Plateau. It offers precise and efficient technical methods for exploring terrain features, presenting fresh research perspectives and geomorphological foundations for resource and environmental management; sustainable development; and erosion prevention and control in the circumferential landform of Lufeng Dinosaur Valley.

2. Materials and Methods
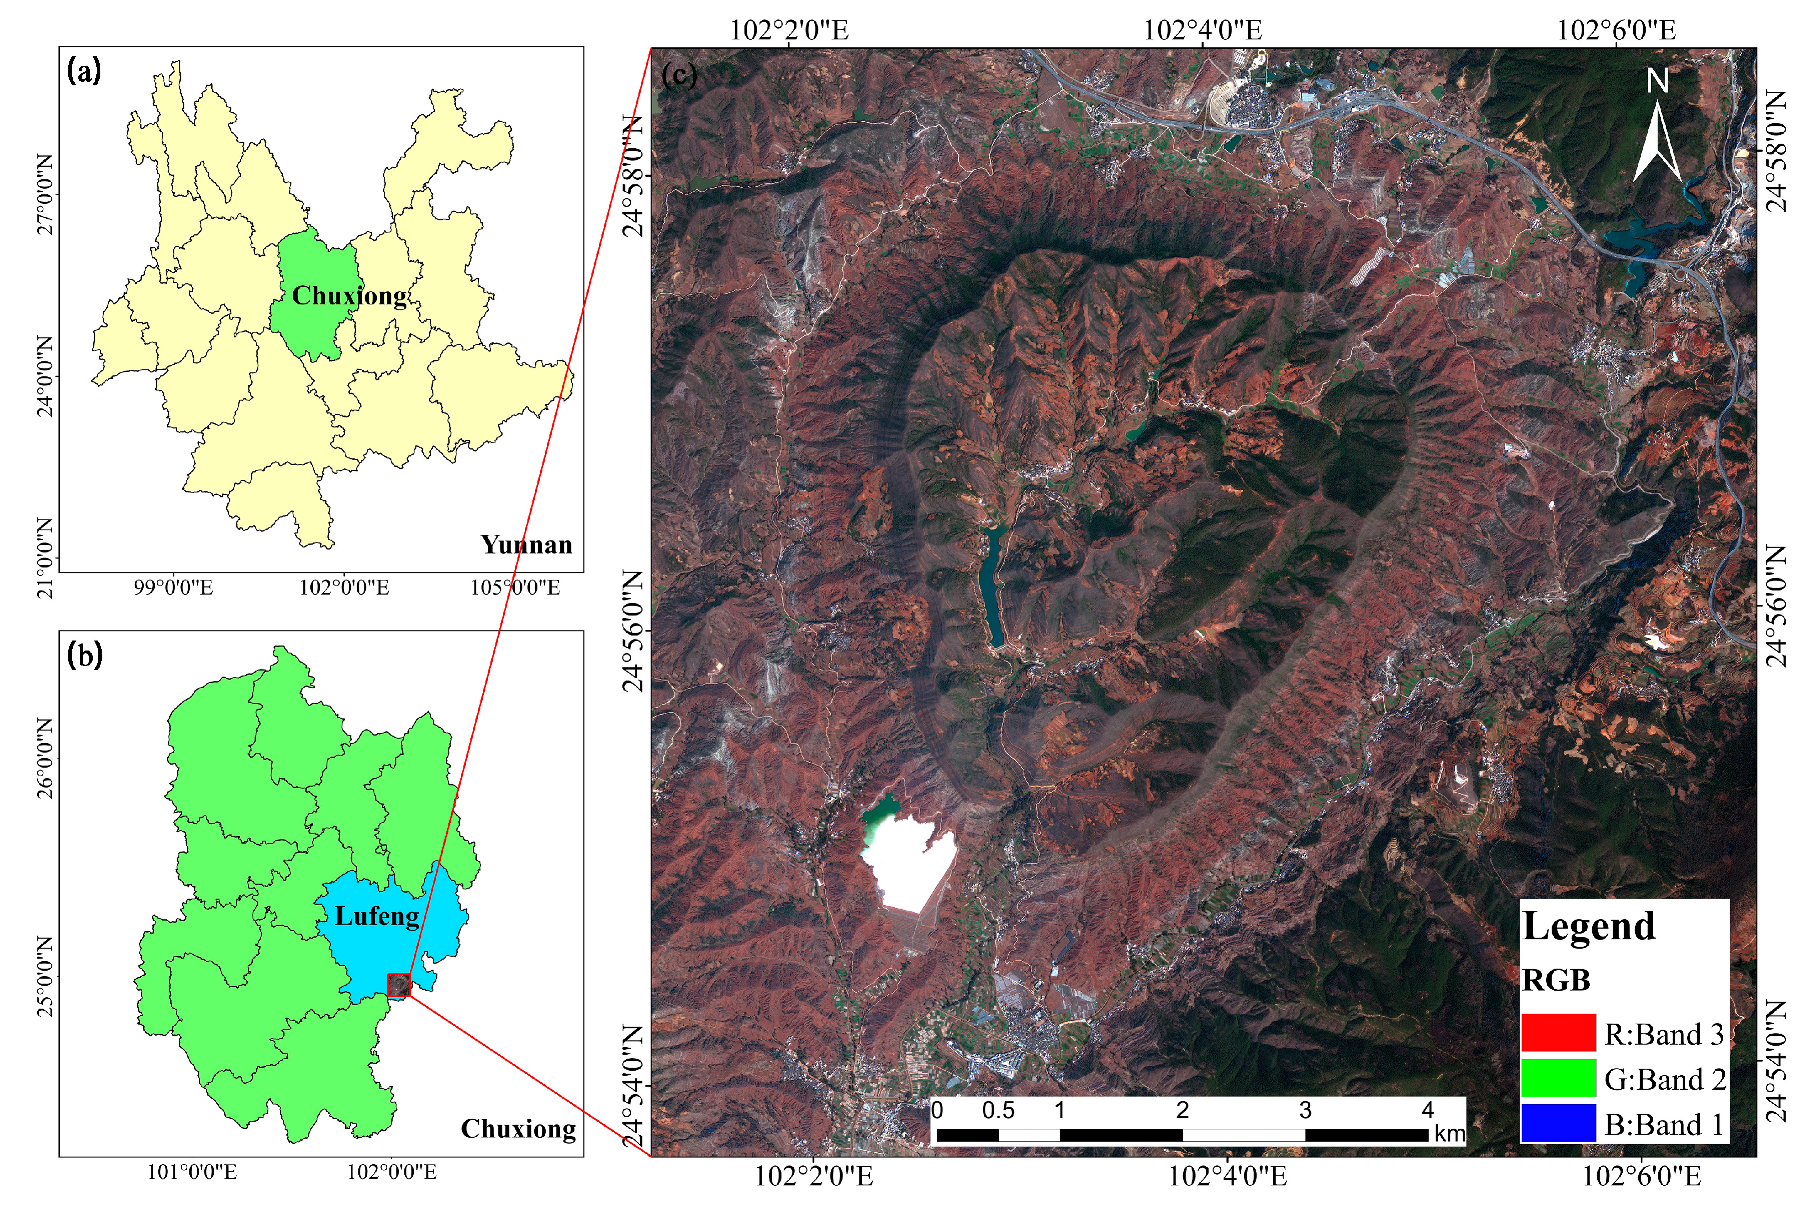
2.1. Study Area

The study area is located in the mountains of the ring tectonic terrain in Chuxiong City (Figure 1a), Lufeng County (Figure 1b), Yunnan Province, China. The geographic coordinates of the area are latitude 24°53′40″~24°58′30″ N, longitude 102°06′20″~102°01′30″ E. The terrain is characterized by high northeast and low southwest areas, as shown in Figure 1. The climate belongs to the subtropical plateau monsoon climate, with significant daily and minor annual differences, and two seasons which are each distinctly dry or wet. The primary strata in the study area include the Quaternary and Tertiary of the Cenozoic; the Cretaceous and Jurassic of the Mesozoic; and the Kunyang Group of the Metazoic. Triassic, Devonian, Ordovician, Cambrian, and Aurignacian strata occur in surrounding areas. The magmatic rocks are mainly purplish-red mudstone with grayish-purple and grayish-green rocks; there are also basal intrusive and ultramafic intrusive rocks [20]. According to the soil survey data of Lufeng City, there are five soil types: brown soil, yellow-brown soil, red soil, purple soil, and rice soil. Among them, purple soil is the most dominant soil type in the jurisdiction, with the most significant proportion, followed by red soil, yellow-brown soil, and rice soil [21].

2.2. Data Sources and Processing

The Gaofen-2 satellite (GF-2) is characterized by high-speed positioning, sub-meter spatial resolution, and fast-maneuvering side-swing capability, which effectively improves the comprehensive observation capability of the satellite [22]. GF-2 plays a vital role in land resource surveys; exemplary urban management; mineral resource monitoring; forest resource surveys; desertification monitoring; geological disaster monitoring; flood monitoring; and post-disaster reconstruction. In this study, the high-resolution remote sensing image covering Lufeng County was acquired via GF-2 (download address: https://data.cresda.cn (accessed on 14 April 2021)) on 13 March 2020, was utilized, and the specific parameters are shown in Table 1.
In remote sensing image acquisition, satellite attitude, speed, altitude, atmospheric disturbance, and other factors cause geometric deformation and information errors in remote sensing images. Therefore, the remote sensing service platform ENVI5.3 was utilized to preprocess the GF-2 images of the study area. First, radiometric calibration and atmospheric correction were performed on the multispectral images; radiometric calibration was performed on the panchromatic images; and the digital number (DN) of the remote sensing image components was converted to radiance and reflectance. Then, the images were orthorectified using DEM data with a resolution of 12.5 m. The calibrated multispectral image was fused with the panchromatic image using the Nearest Neighbor Diffuse (NNDiffuse) panchromatic-sharpening fusion algorithm—recently proposed by the Rochester Institute of Technology (RIT)—resulting in suitable image fusion results [23]. Finally, the fused image is cropped; the preprocessed result is shown in Figure 1c.
The Advanced Land Observing Satellite (ALOS), part of the Advanced Land Observing Satellite-1 project of the Japan Aerospace Exploration Agency (JAXA), offers valuable information for mapping; precise regional land-cover observation; disaster monitoring; and resource surveys. It particularly excels in digital elevation mapping [24]. This study utilizes the ALOS DEM acquired on 31 January 2009 at 15:45, with a spatial resolution of 12 m. The data can be accessed from the open-source website (download link: https://search.asf.alaska.edu (accessed on 29 May 2022)).

2.3. Methods

Utilizing DEM and GF-2 data, ridgelines and valley lines were initially extracted to define the boundaries of the study area. Subsequently, the surface water system of the study area was extracted. The mean-variable-point method was employed to determine the optimal analysis window for terrain feature parameters. Correlation analysis was conducted to identify the optimal combination of terrain feature parameters. Subsequently, correlation analysis, classification, statistical analysis, and mapping were employed to visualize the spatial distribution of topographic features. This facilitated the quantification and analysis of the topographic and geomorphological features of the ring structure in the study area from various perspectives.

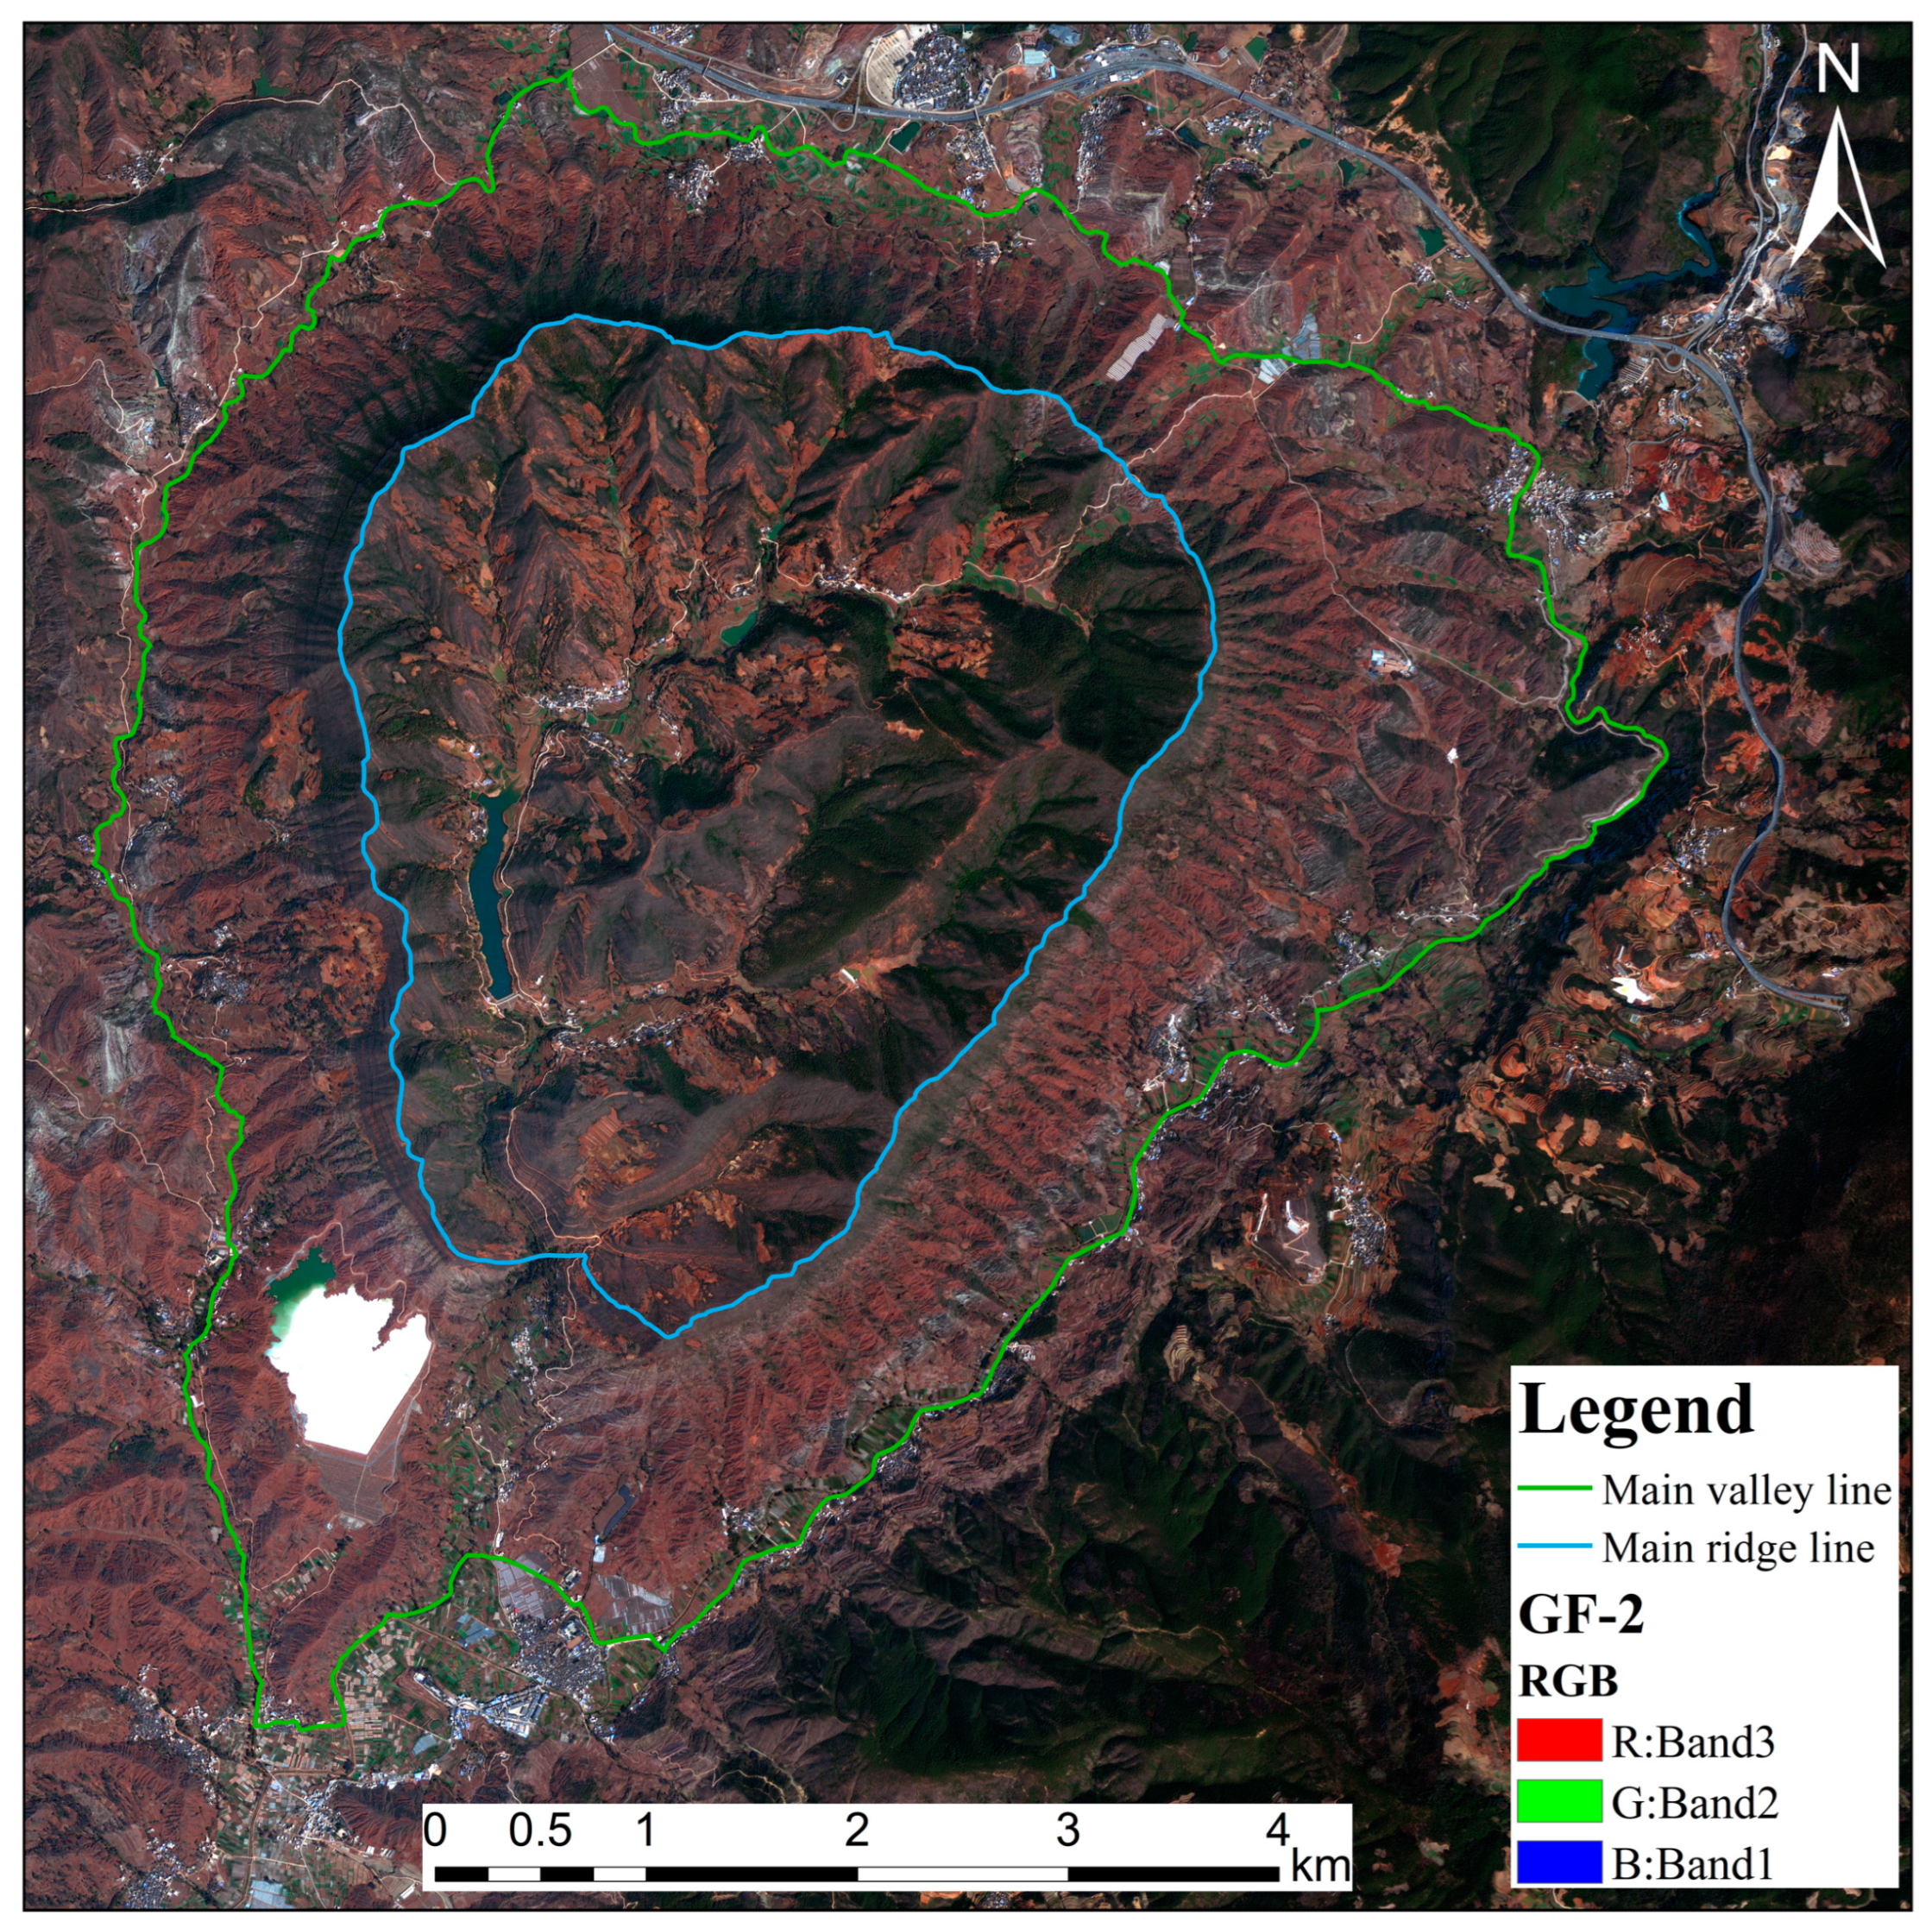
2.3.1. Extraction of Major Ridgelines and Valley Lines

As topographic features, the ridgelines and valley lines exert a certain control on the terrain and geomorphology, which is crucial for investigating topographic and geomorphological characteristics. Using the ArcGIS spatial analysis tool for DEM, we extracted ridgelines (Figure 2a) and valley lines (Figure 2b). Subsequently, in conjunction with the preprocessed GF-2 data, the primary ridgelines (Figure 2c) and valley lines (Figure 2d) were delineated based on visual interpretation, and the region within the valley lines was designated as the study area. Finally, characteristic parameters for the ridgelines and valley lines were statistically calculated (Table 2). For ease of subsequent reference, the ridgelines and valley lines are now denoted as the inner ring (R1) and outer ring (R2), respectively.

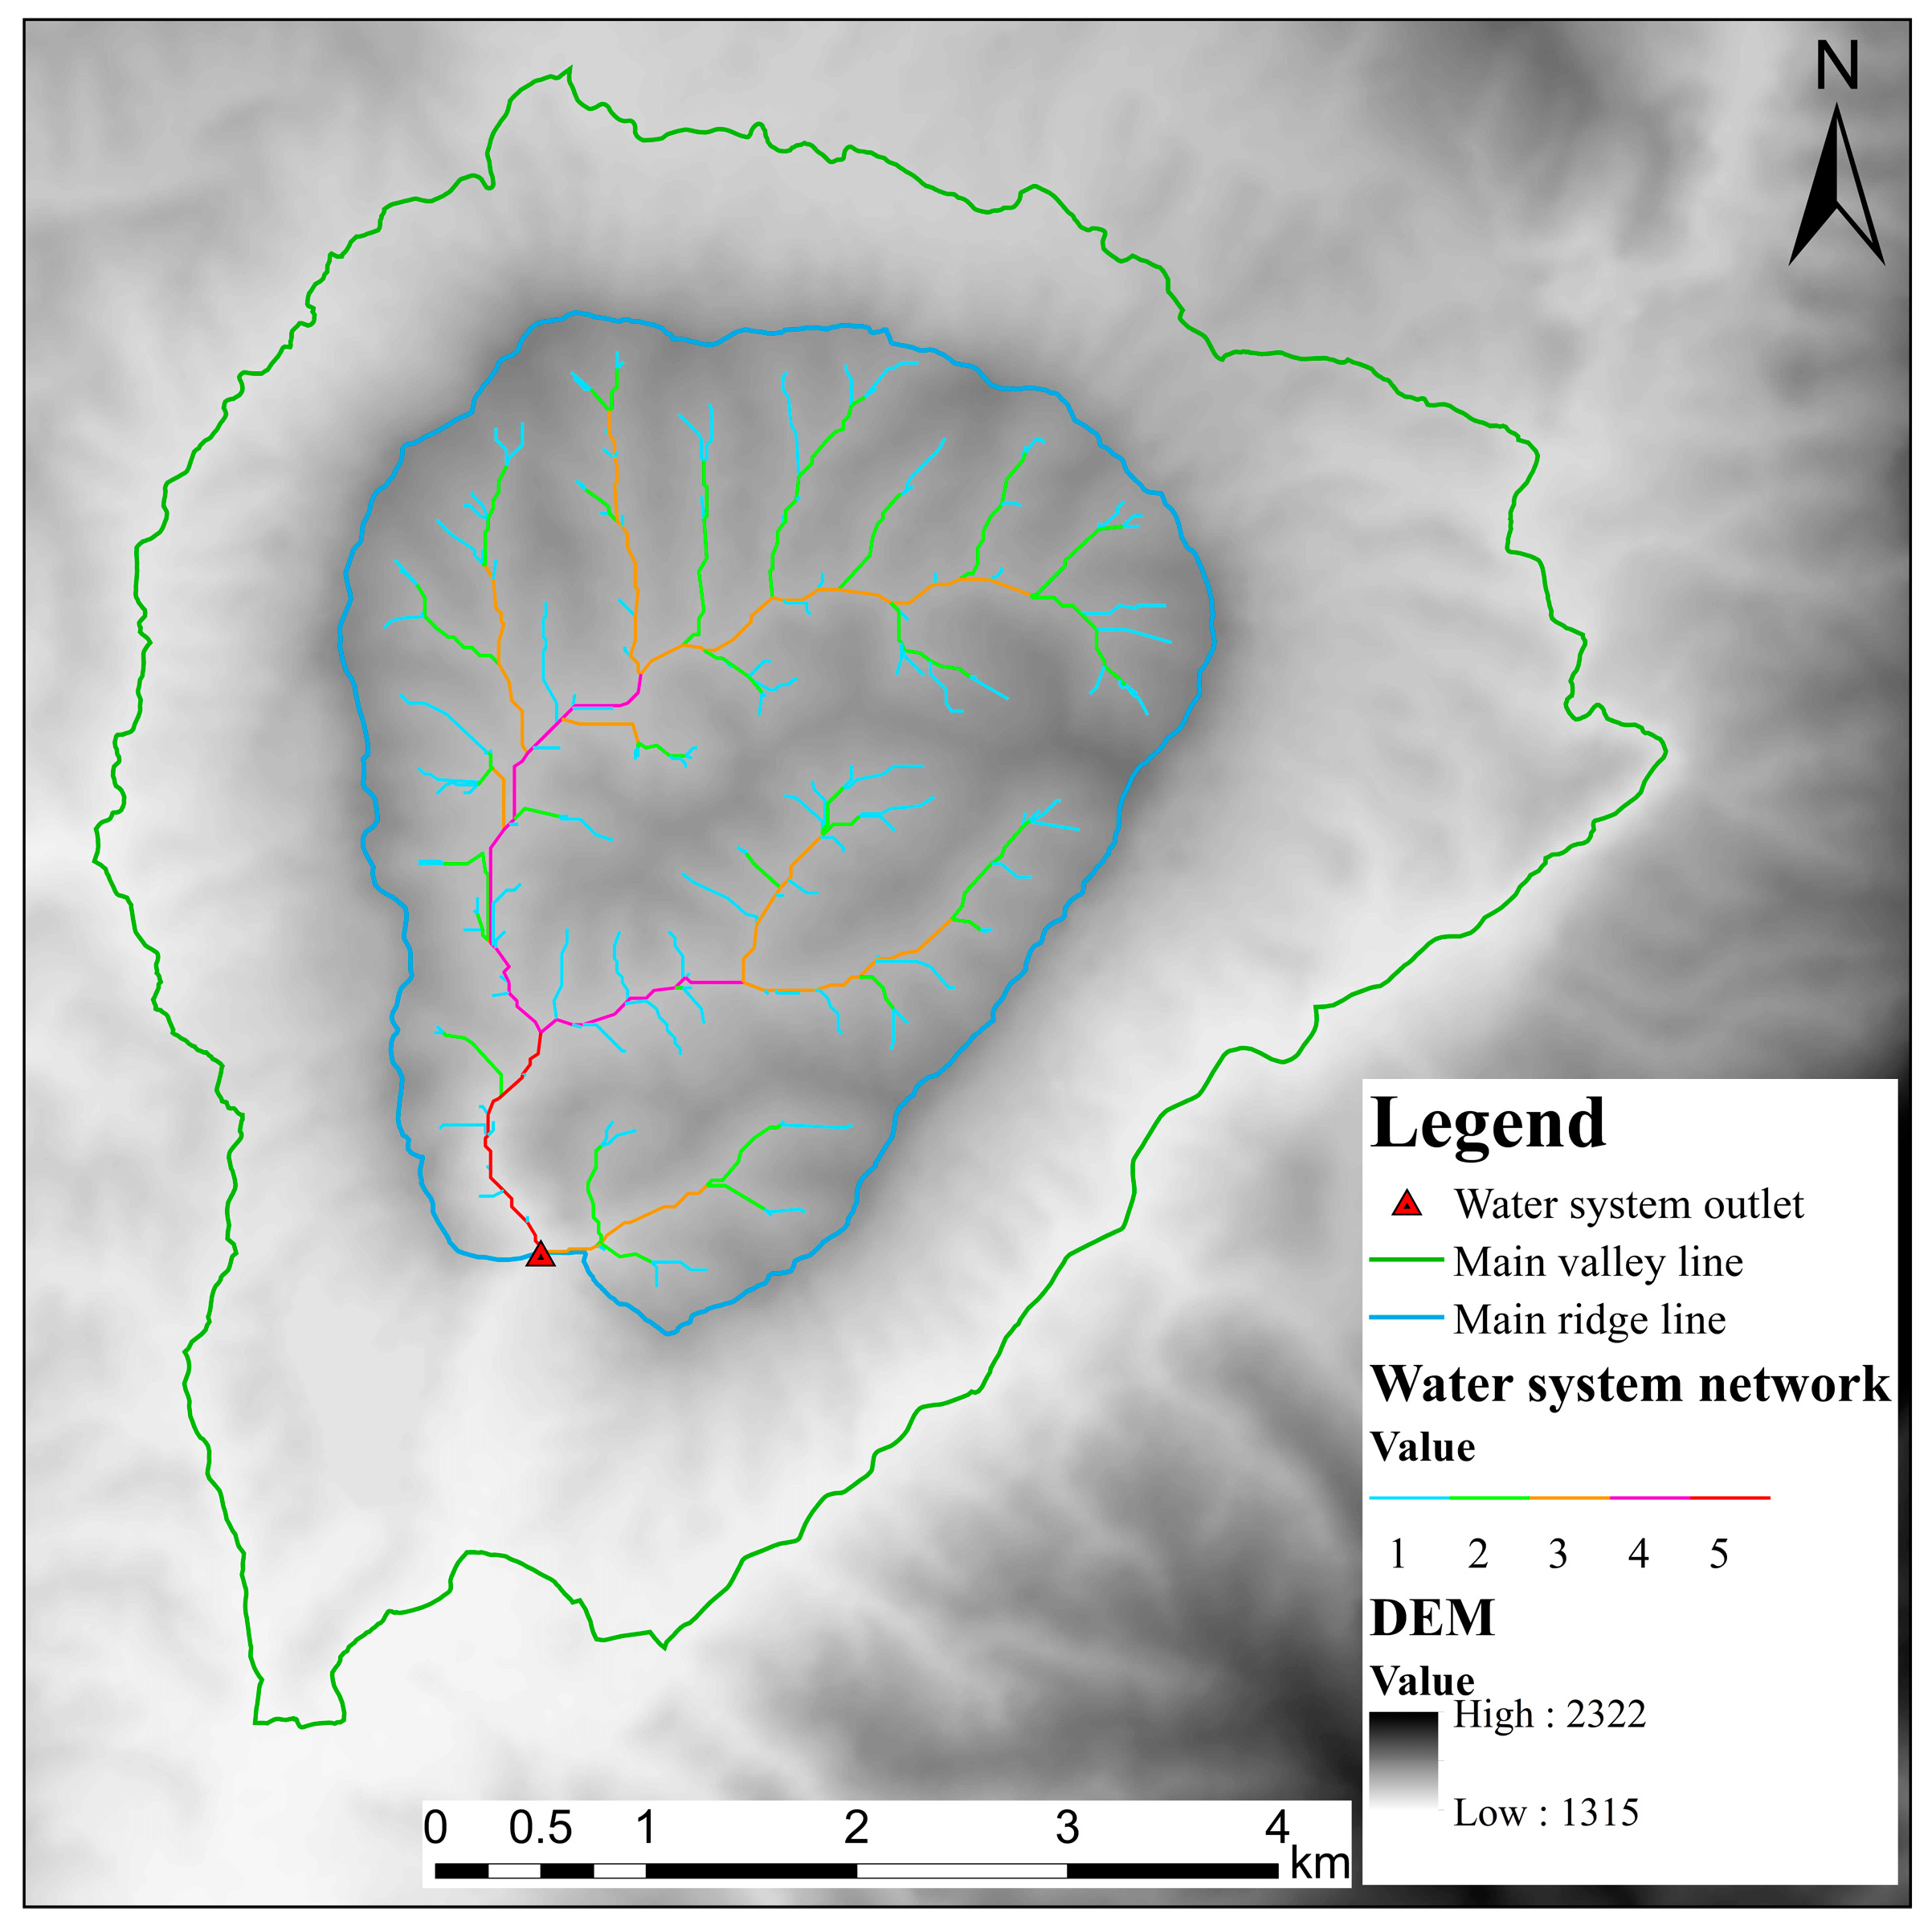
2.3.2. Surface Water System Network Extraction

The type and direction of a surface water system network can reflect topographic and geomorphic features [25]. Using the ArcGIS hydrological analysis tool to calculate the filling depression, flow direction, and flow rate of DEM, the river network was extracted for the area within the inner ring. The extraction of the river network has a strong relationship with the set threshold; the selection of the threshold will affect the scale and morphology of the final extracted river network. In this paper, the threshold relationship curve method for water system density and catchment area [26] was used to determine the optimal flow threshold to extract the surface water system network within the inner ring.
Firstly, a series of catchment area thresholds were selected as 10, 50, 100, 150, 200, 250, 300, 350, 400, 450, and 500 rasters, respectively, (with each raster 12.5 m × 12.5 m in size), and the corresponding water system structure was extracted to calculate the water system density. Curve fitting was performed for the catchment area threshold and the river network density, and the fitted curves are shown in Figure 3.
From Figure 3, it is evident that the relationship curve initially experiences a sharp decrease as the threshold increases, after which the change tends to level off. Analyzing the second-order derivative of the fitted curve, it becomes apparent that the threshold value, starting from 150, leads to a relatively smooth change in the second-order derivative curve of water system density. Furthermore, as the threshold value increases, the rate of change decreases, making this value the optimal threshold.
Subsequently, this optimal threshold value was used to delineate the water system network within the inner ring. Following the river grading method proposed by Strahler [27], we generated the grading diagram of the water system network within the inner ring, and the results of linear measurements of the water system network within the inner ring.

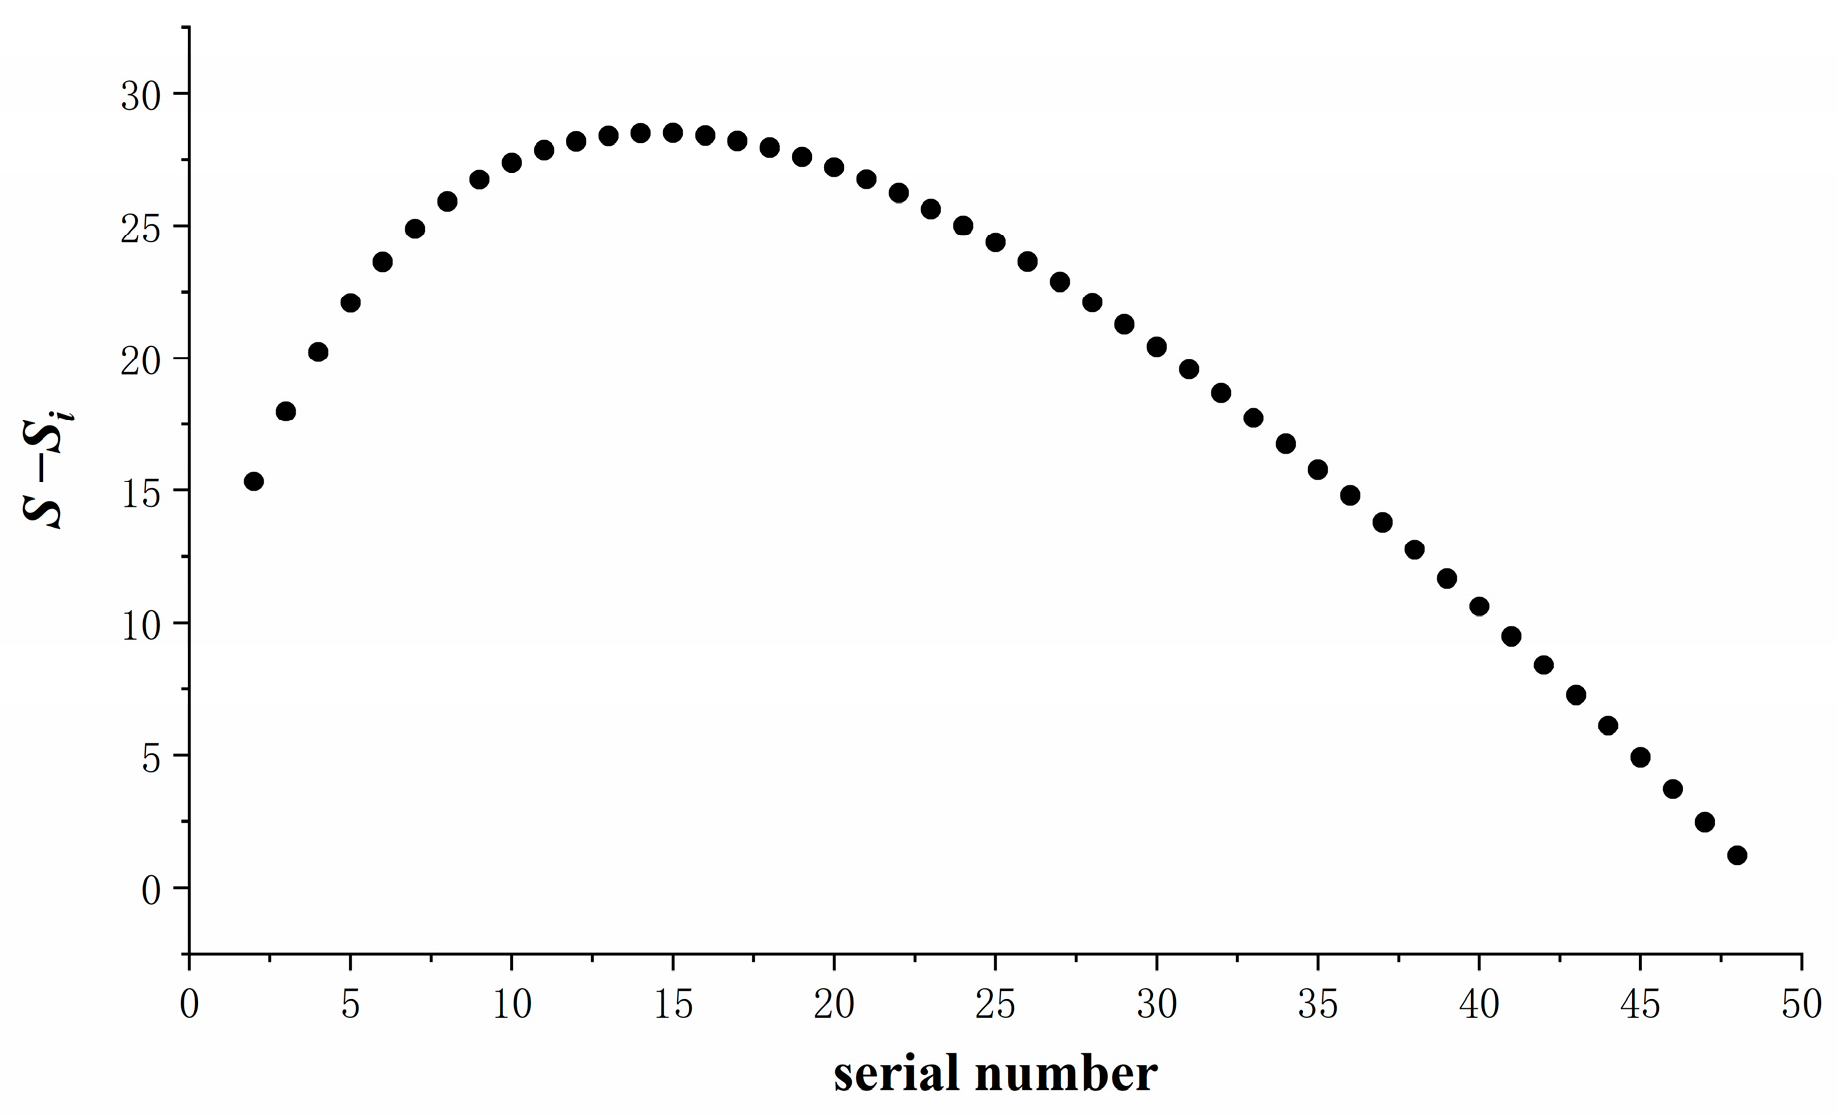
2.3.3. Mean-Variable-Point Analysis Method

In accordance with the theory of geomorphic development, an optimal analysis area for a specific geomorphic type exists, where the maximum elevation difference remains relatively stable. Furthermore, this area can, to a certain extent, maximize the expression of geomorphic integrity [28]. Hence, it is crucial to ascertain the optimal analysis window for terrain characterization parameters. Consequently, the mean-variable-point method [29] was utilized to determine the size of the optimal statistical window for extracting terrain feature parameters in the study area, using the degree of terrain relief as an example.
First, using the Focused Statistics tool of the ArcGIS Neighborhood Analysis Toolbox with the rectangle analysis window type, the statistical cell sizes (2 × 2, 3 × 3, …, 48 × 48) were sequentially calculated to correspond to the relief degree of the land surface. Then, the logarithmic fitting of the terrain undulation degree and the area corresponding to the window was carried out using Excel2021 software, and the fitting equation was obtained: y = 21.273ln(x) − 160.49, as well as the coefficient of determination: R2 = 0.9501, which was a good fit.
The calculation process of the mean-variable-point analysis method is as follows:
(1)
The average terrain relief of N (2 × 2, 3 × 3, …, 48 × 48) under incremental windows is obtained based on the terrain relief formula, and then the unit terrain relief T i is calculated sequentially using the formula:
T i = t i A i
where i is the rectangular analysis window; T i is the topographic relief under the analysis window; t i is the average relief under the analysis window; and A i is the area under the analysis window (m2).
(2)
T i is taken logarithmically ( ln T ) to obtain the sample series X x t , t = 2 , 3 , , 48 .
(3)
The arithmetic mean X ¯ and the sum of squared deviations S for X is computed:
X ¯ = t = j N x i N , S = t = j N x i x ¯ 2
where X ¯ is the arithmetic mean of all samples; N is the total number of samples; S is the total sum of squared deviations.
(4)
Let i = 2, 3, …, N , and for each i divide the sample into 2 segments: x 1 , x 2 , , x i 1 , and x i , x i + 1 , , x N , then compute the arithmetic mean for each segment of samples X i 1 ¯ , X i 2 ¯ , and S i :
S i = t = 1 i 1 x t X i 1 ¯ 2 + t = i N x t X i 2 ¯ 2
where S i is the difference between the sum of squared deviations of the two sample segments.
(5)
Calculate the expected value:
E ( S S i ) = E N 1 i 1 N i + 1 X i 1 ¯ X i 2 ¯ 2 .
A scatterplot was made with serial number i as the horizontal coordinate and S S i as the vertical coordinate (Figure 4), where the vertex, which is the change point, is the point with the largest S S i value.
As shown in Figure 4, the variable point is serial number 15. Therefore, the point corresponds to an optimal analysis window of 16 × 16 and an optimal statistical area of 0.04 km2.

2.3.4. Selection of Optimal Terrain Feature Parameters

Six terrain characterization parameters (slope; slope direction; relief degree of land surface (RDLS); surface roughness; elevation coefficient of variation (ECV); and depth of surface cut) were selected in this study. In order to maximize the expression of terrain feature information, terrain feature parameters with low correlation coefficients were used. Therefore, the correlation analysis of the six selected terrain feature parameters was performed to ultimately select the best combination to reflect the geomorphic features.
In order to eliminate the influence of the magnitude, the topographic feature parameters were first normalized via the polar deviation method (Equation (5)) so that their values were all in the range of 0 to 255.
x i j = x i , j x m i n x m a x x m i n × 255
where x i j is the normalized value, a constant; x i , j is the calculated value of the topographic indicator; x m a x is the maximum value; x m i n is the minimum value.
After the correlation analysis (Table 2), the correlation coefficients of the relief degree of the land surface, the elevation coefficient of variation and the depth of surface cut were all above 0.937, which were highly correlated. Most studies have selected the degree of relief degree of the land surface as the primary terrain characterization parameter for describing the overall morphology of the terrain. Therefore, the relief degree of the land surface was retained, and the elevation coefficient of variation and depth of surface cut were excluded. In this paper, we finally choose four topographic parameters: slope, slope direction, slope direction, relief degree of land surface, and surface roughness.

2.3.5. Extraction of Topographic Factors

Slope and slope direction are two crucial parameters for depicting topographic and geomorphic features, capable of illustrating the undulation pattern of the terrain and its structural characteristics [30]. Initially, the ArcGIS slope and slope direction tools were employed to extract these parameters from the DEM in the study area. Subsequently, the reclassification tool in the spatial analysis toolbox of ArcGIS was used to categorize the slope values.
Following the standards established by the International Geographical Union Commission on Geomorphological Surveys and Geomorphological Mapping (IGU CGSCGM) for the application of detailed geomorphological maps [31], and considering the specific conditions of the study area, the slope values were classified into six grades: 0°–5° (gentle slope); 5°–15° (slow slope); 15°–25° (incline slope); 25°–35° (steep slope); 35°–45° (slanted slope); and >45° (rapid steep slope) grades [32]. Additionally, the slope direction values were divided into nine directions, creating slope and slope direction maps for the study area.
Detailed statistical analyses were conducted using Origin2022 software to gain a comprehensive understanding of the distribution of slope degree and slope direction grades and their respective area proportions.
The degree of topographic relief is a macro-indicator describing the topographic characteristics of a region, which is used to indicate the height difference between the highest and lowest points in a specific area and can compare the regional geomorphology and delineate landform types [33]. The value range of the topographic relief degree in the study area is 0–173 m. According to the topographic relief degree division method [34] and combined with the actual situation of the study area, the ArcGIS reclassification tool was utilized to classify it into four types of terrain: plains (<30 m); plateaus (30–50 m); hills (50–100 m); and mountains (100–200 m). The expressions (Equation (6)) are as follows:
R D L S = H m a x H m i n
where D denotes the degree of terrain undulation, H m a x denotes the maximum elevation value, and H m i n denotes the minimum elevation value.
Surface roughness can effectively represent the degree to which the terrain within a particular area has been eroded and cut. The larger the value, the more complex the terrain and the more severe the erosion [35]. The natural interval point classification method divides the surface roughness reclassification into four classes, with values ranging from low to high. The expression (Equation (7)) is as follows:
R = 1 c o s S
where R denotes surface roughness and S denotes terrain slope.

3. Results and Analysis

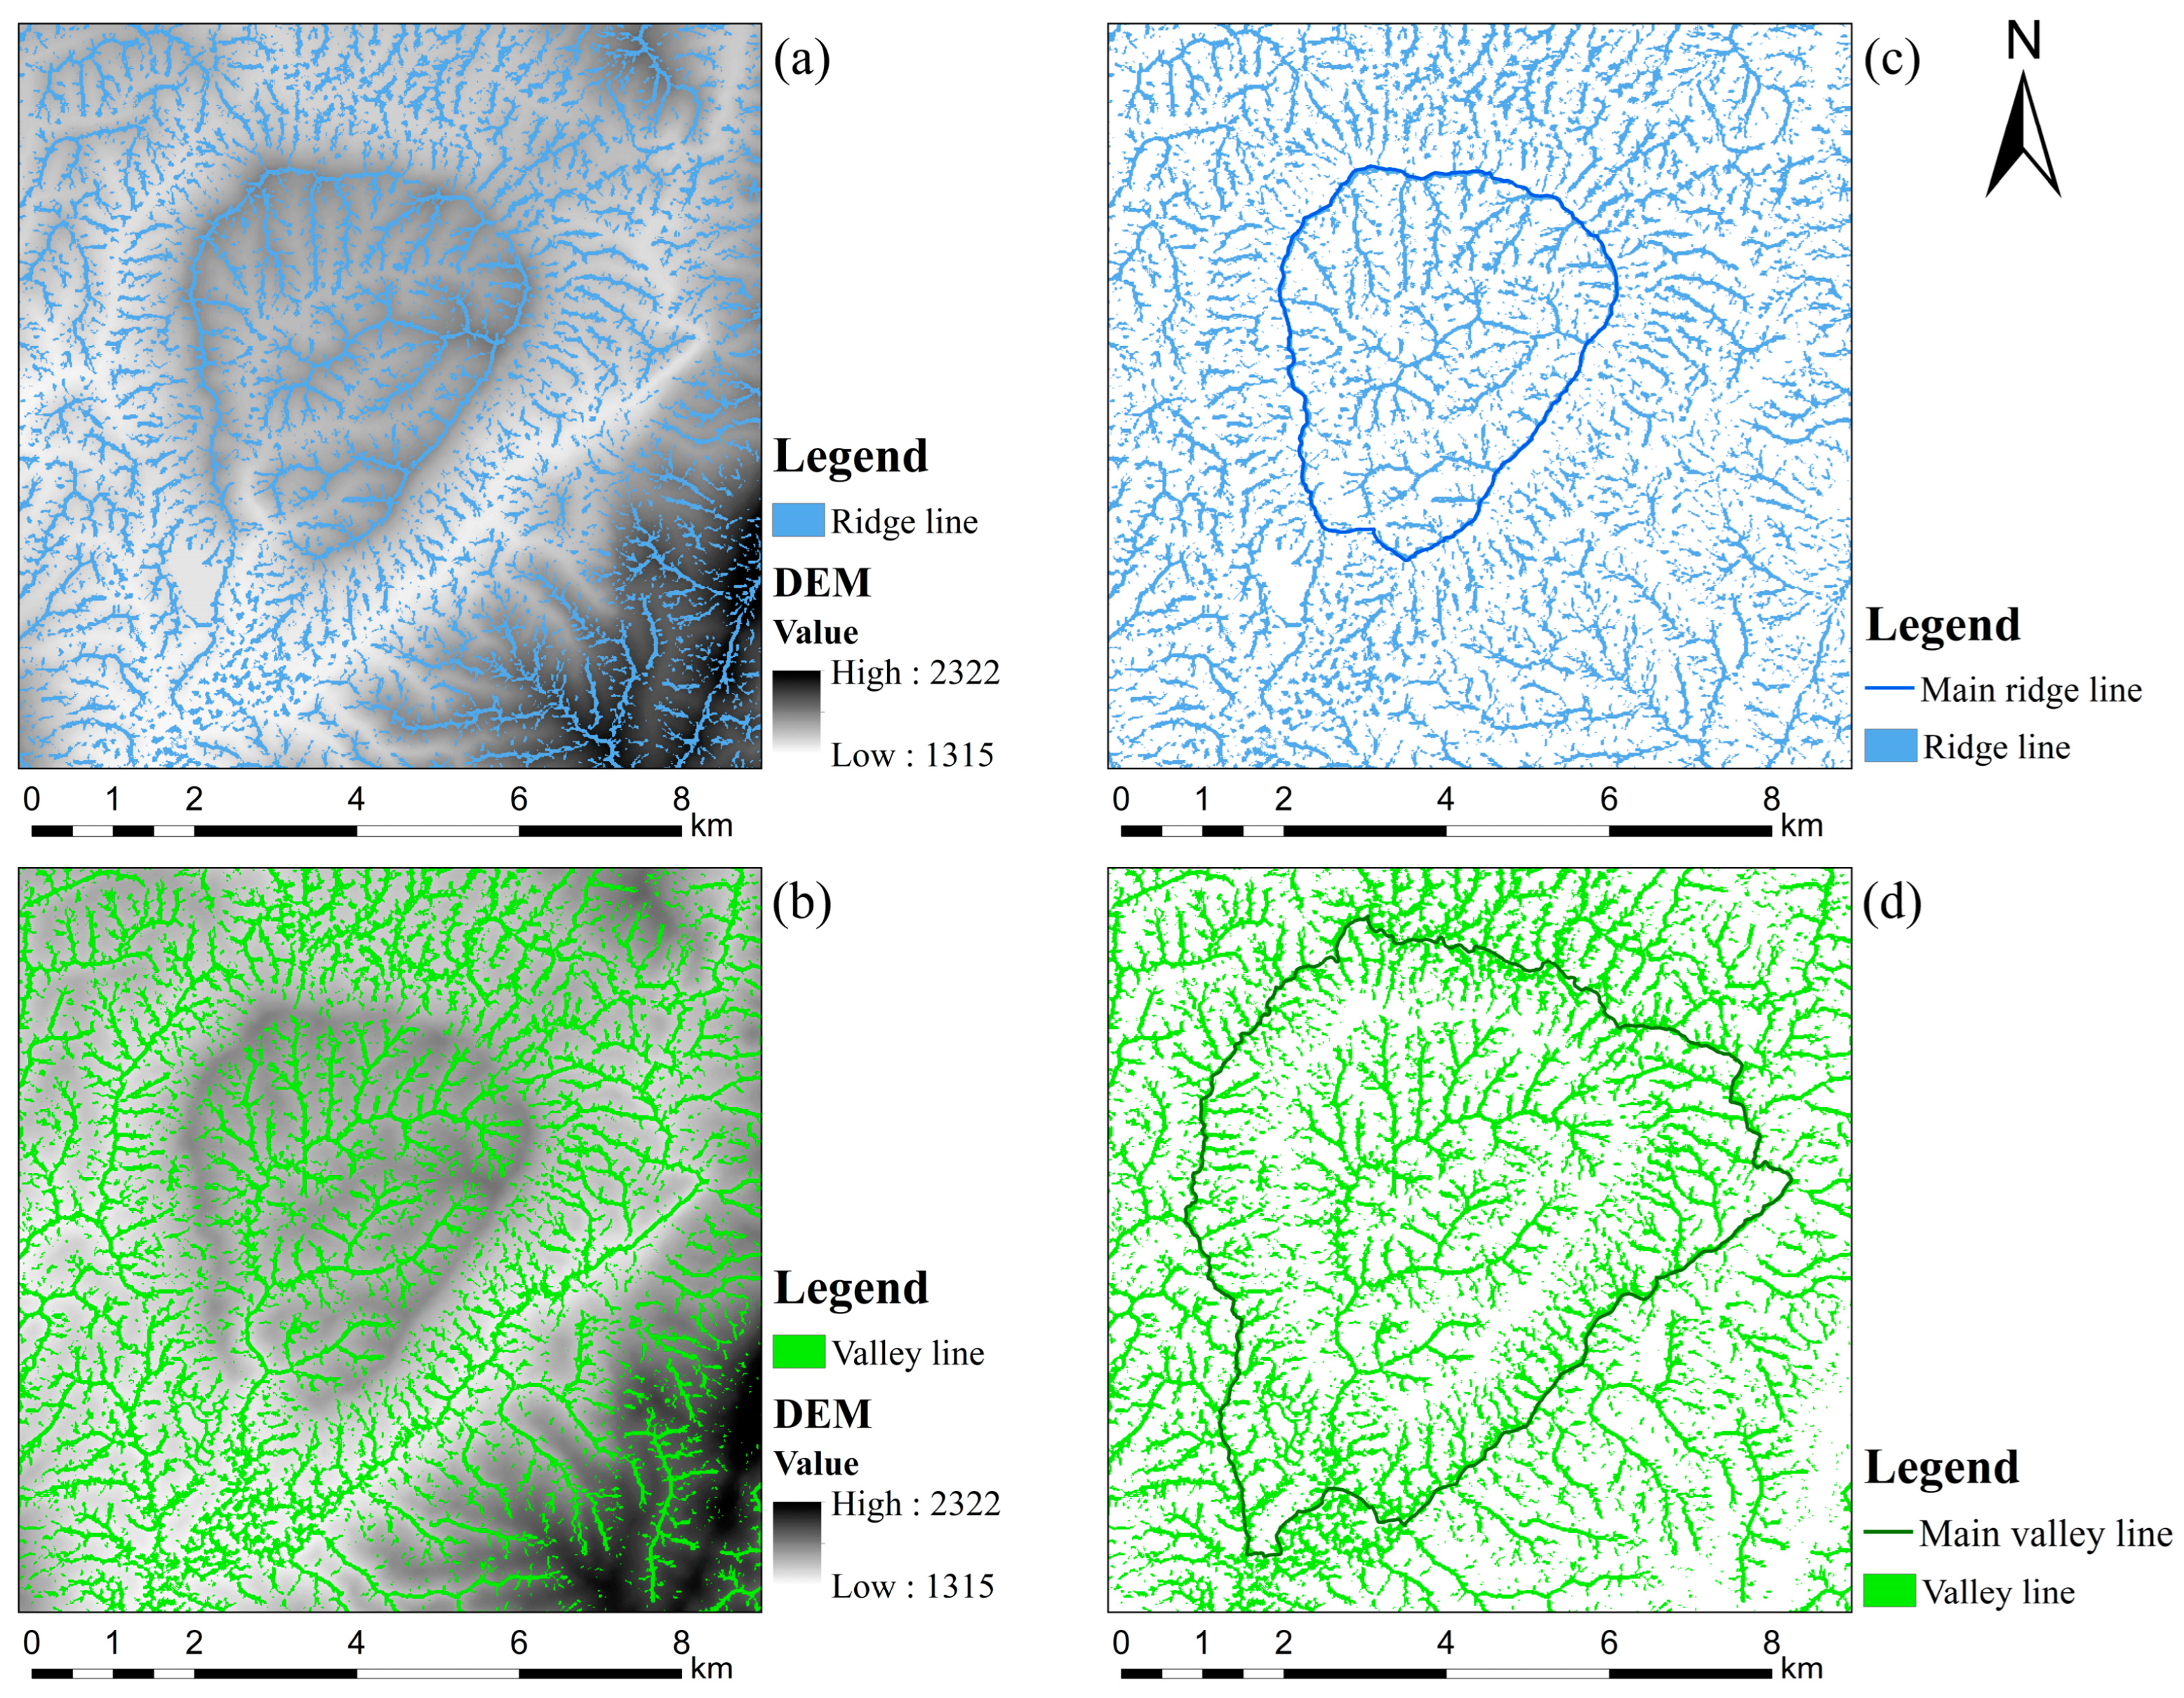
3.1. Ridgeline and Valley Line Mapping Analysis

From Figure 2 and Figure 5, the significant ridgelines and valley lines in the study area show a clear linear pattern of double rings. The inner and outer rings are almost like a “heart.” The ridgelines and valleys exhibit a dense distribution, particularly in the topography of the ring zone between the inner and outer rings, which is characterized by radiating ridges and valleys. ArcGIS was employed for a more detailed characterization of the outer and inner rings, encompassing parameters such as area, perimeter, width, and others (Table 3).
According to the statistics in Table 3, the area ratio of the inner ring to the outer ring is 0.403, the perimeter ratio is 0.539, the east-west width ratio is 0.557, and the north-south length ratio is 0.616.

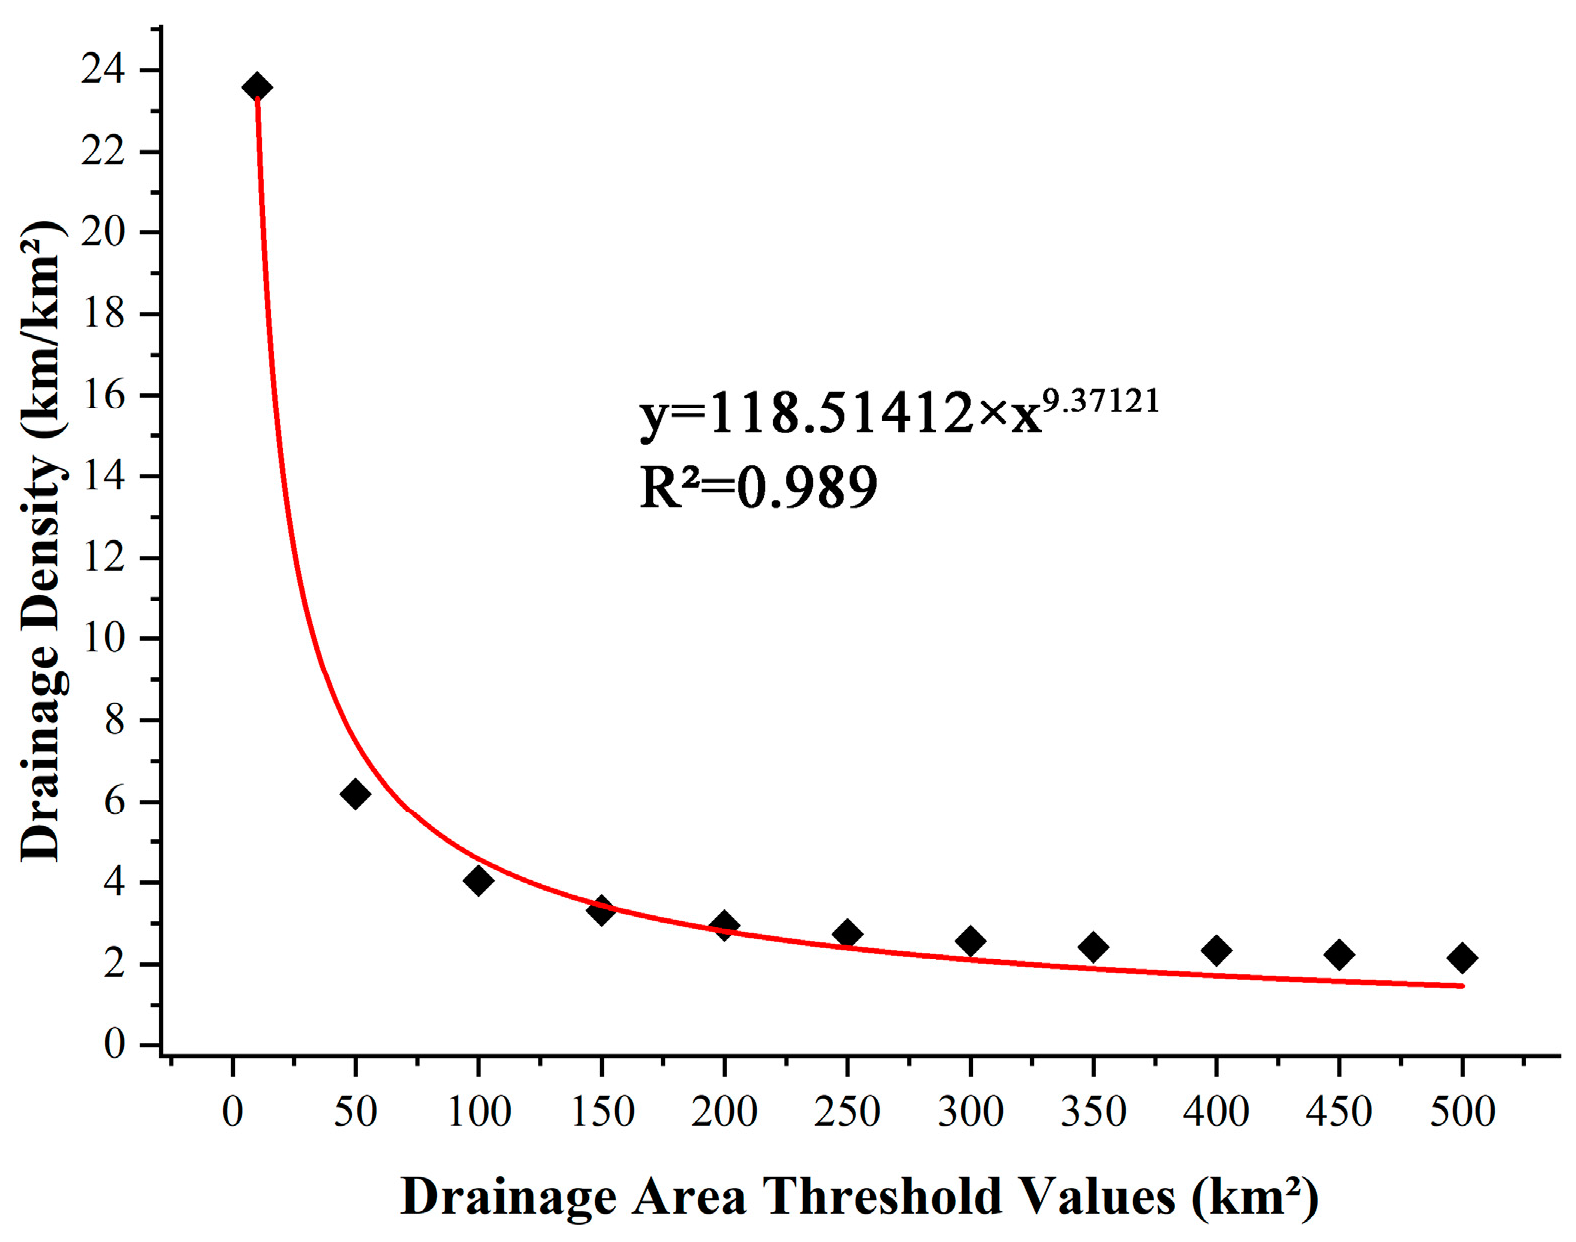
3.2. Characterization of the Surface Water System Network

Based on Figure 6, the river network within the inner loop of the study area originates from the northeast, extends along the southwest, converges to the southwest outlet, and discharges downstream, creating a relatively closed hydrological system. The morphology of the river network takes on a tree branch-like appearance, exhibiting a lattice shape in the central part of the area. The northern part of the area has a denser river network, while sparser rivers characterize the southern part. Overall, the morphology of the river network in the study area is influenced by the topography and terrain features.
The network can be roughly divided into three parts: the first part is a “bow”-shaped fourth-order branch channel in the north, which has a dense network, with more and longer tributaries along the right side of the downstream direction; the second part is a “Y”-shaped fourth-order branch channel in the south-central part of the river; and the third part is a dendritic tertiary branch channel in the south. The tributary systems of the three components meet in the mainstem (Class V) and flow out of a single outlet in a southwesterly direction.
According to the statistics in Table 4, the total length of the water system is 46.519 km, with 281 rivers in total. The water system is graded into five levels, which are positively proportional to the number of rivers. Among them, there are 144 first-class water systems with a total length of 21.400 km, which account for more than half of the river network, indicating that the first-class water systems play a dominant role in geography and geomorphology. There are 64 second-class water systems with a total length of 12.574 km, or 4/9 of the first-class water systems, which means that about every two first-class water systems converge into a second-class water system. There are 41 third-class water systems with a total length of 7.982 km, 23 water systems with a total length of 3.307 km, and 9 water systems with a total length of 1.257 km.

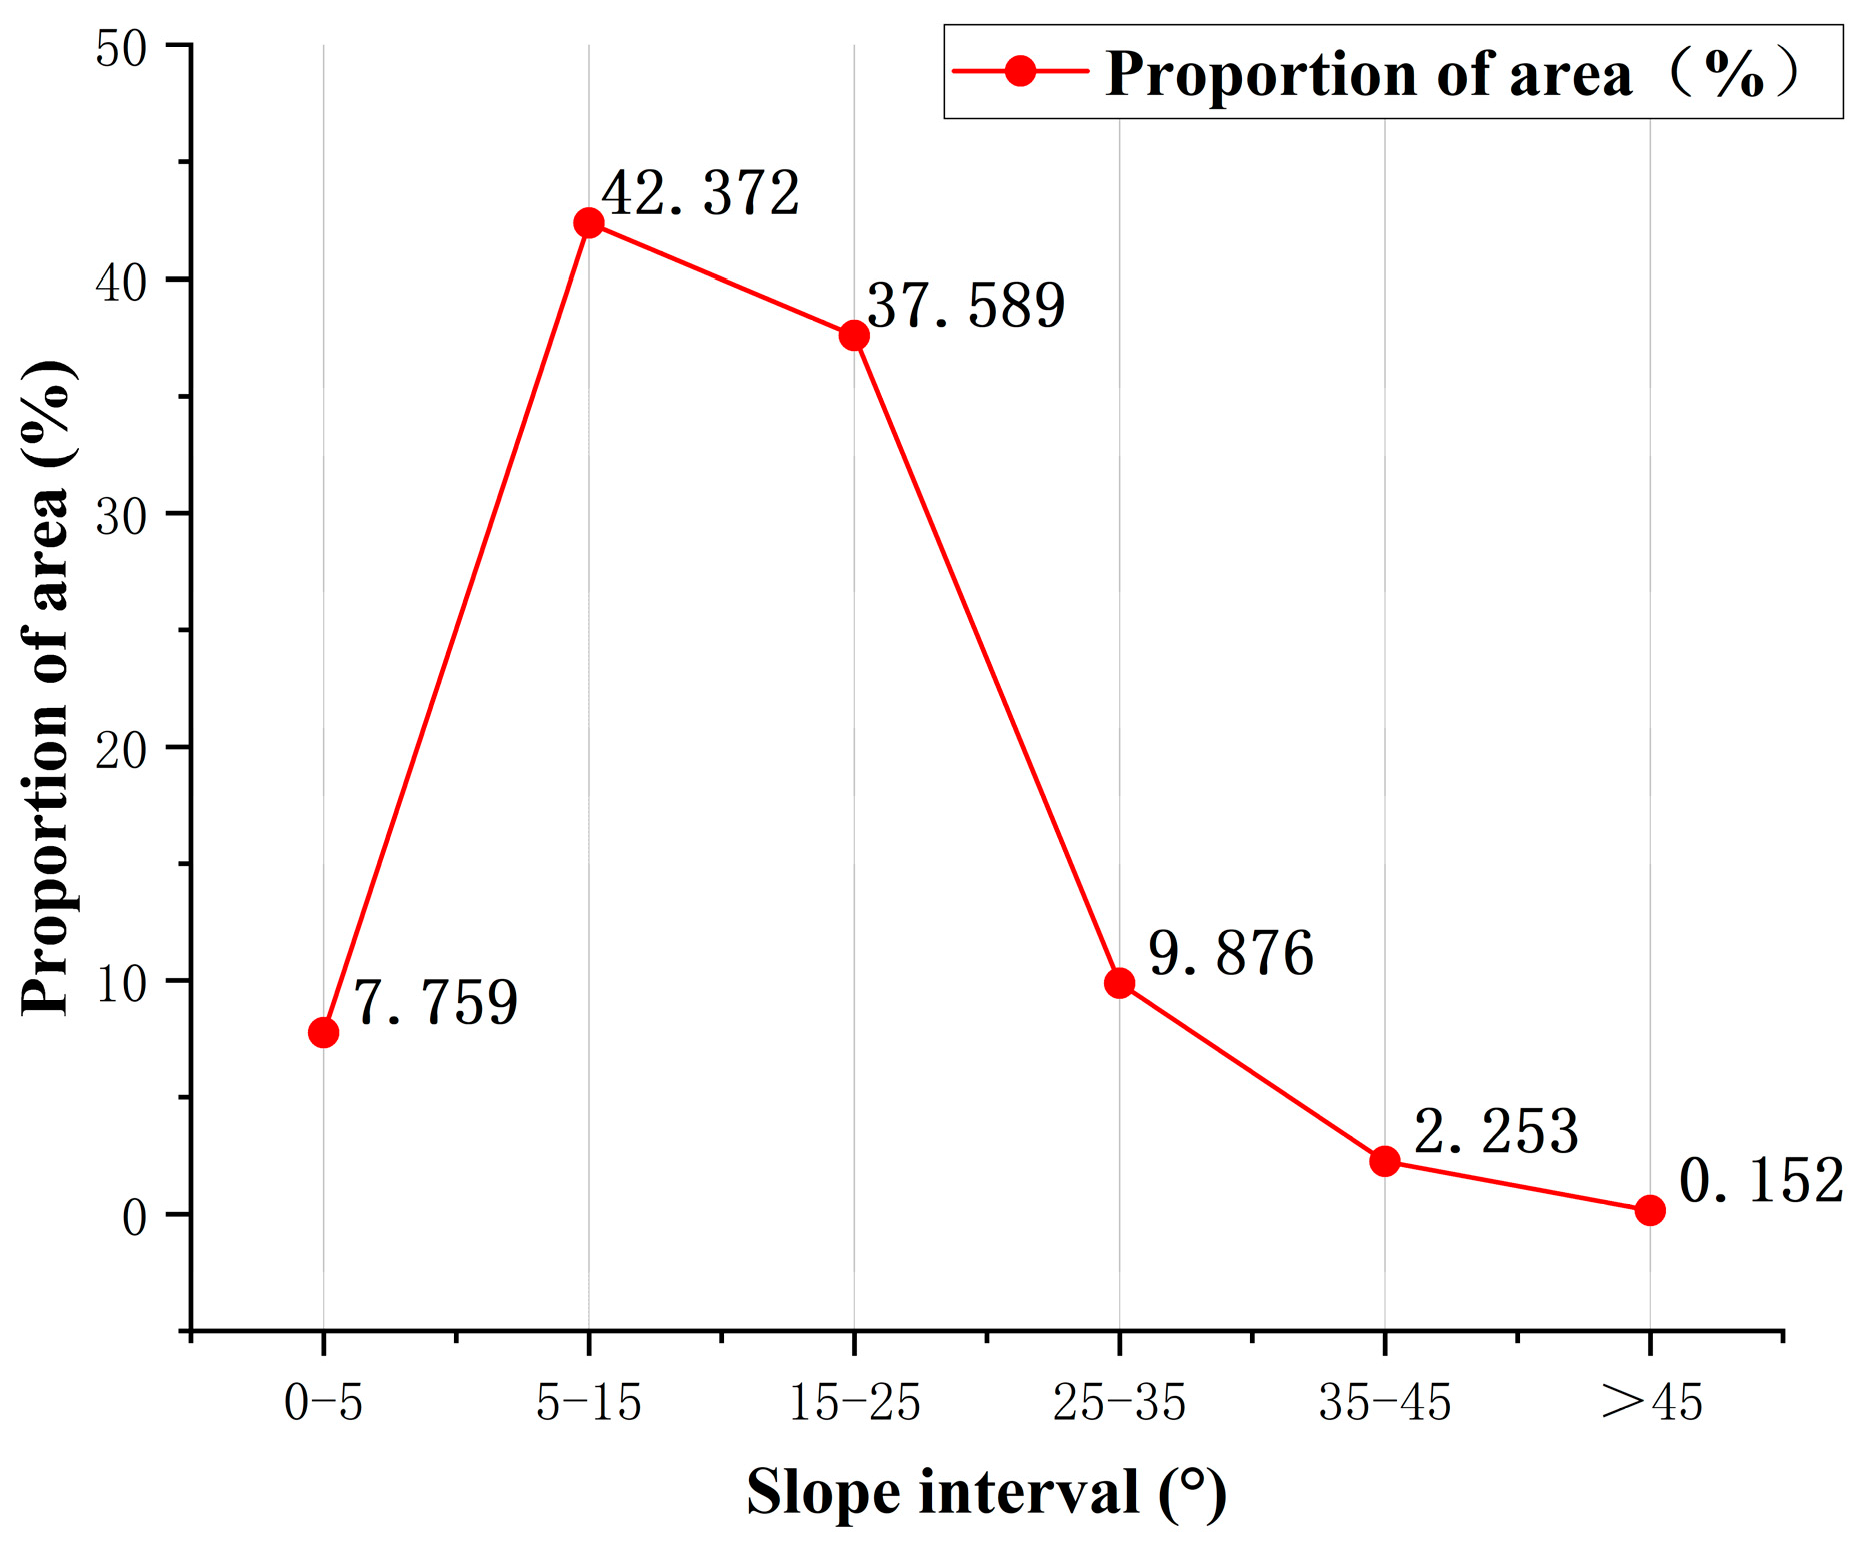
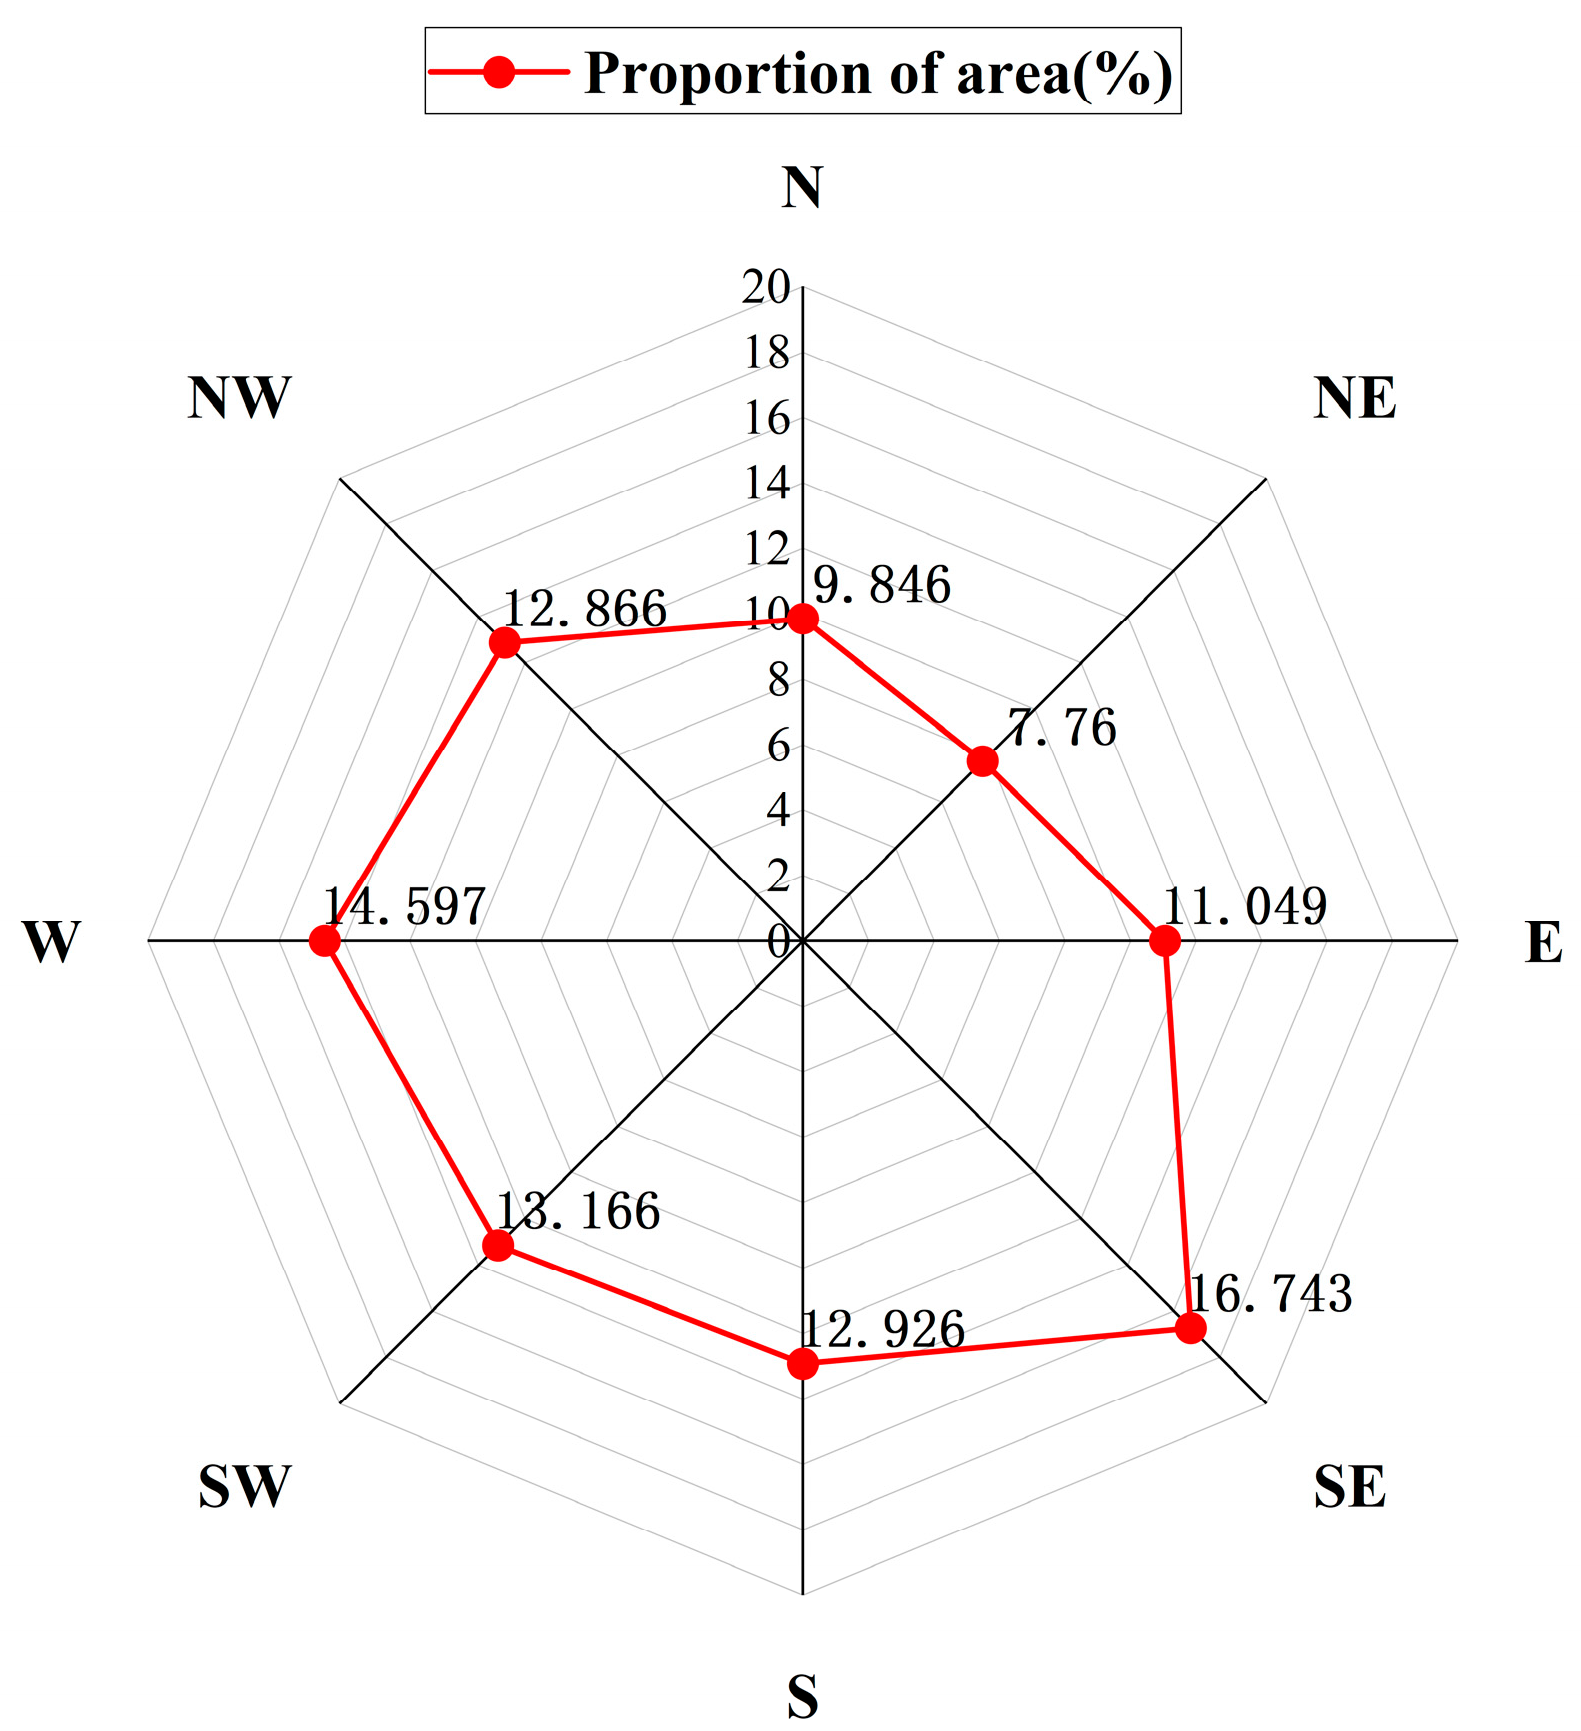
3.3. Slope and Slope Direction Analysis

The maximum slope value in the study area was 56.59°, and the mean value was 15.540°. According to the statistics in Figure 7, it was found that the distribution of slopes at all levels in the study area was not uniform, and the slope structure was mainly dominated by gentle slopes (5° to 15°) and slopes (15° to 25°). Among them, the area of gentle slopes is the largest, with an area of 14.595 km2, accounting for 42.372%. Slopes come next with an area of 12.958 km2, accounting for 37.589%. Steep slopes have an area of 3.402 km2, accounting for 9.876%. The remaining gentle slopes, steep slopes, and sharp slopes are fewer, with a combined area of 10.163%.
The slope classification map (Figure 8a) shows differences in the distribution of slopes between the inner and outer parts of the inner ring. Areas with large slopes (>35°) are represented on the map as a ring with a notch at the base and are mainly distributed in the outer areas of the inner ring. The terrain extends from ridges to valleys with dramatic slope shifts and interspersed ridges and valleys. Several steep and sharply steep slopes are also distributed in the eastern region. The terrain slopes in the inner loop show large slope values (>35°) on the banks on both sides of the main stem of the water system, which may be related to erosion from surface runoff. The remainder consists of slopes, gentle slopes, and a few flat slopes.
According to regulations and related studies [36], it is known that areas with a slope greater than 25° are areas with a high incidence of landslide hazards. That is to say, under specific environmental and meteorological conditions, areas within this slope range are more susceptible to landslides. The landslide hazard-prone area in the study area is 9.876%, mainly distributed in the outer slopes of the inner ring road, the riverbanks on both sides of the main streams of the water system, and the small mountains in the east.
Statistically (Figure 9), the average slope direction of the study area is 184.797° (southward). The slope direction in the study area is mainly dominated by five directions: southeast, south, southwest, west, and northwest, with a combined area share of 70.298%. Among them, the southeast slope direction accounted for the most significant proportion at 16.743%. The planar area accounts for a minor proportion at 1.046%, mainly the Dasha River tailings pond located in the southwestern part of the study area.
From the slope orientation distribution map (Figure 8b), it can be seen that there are several dominant directions of slope orientation in the study area, and the distribution of slope orientation is uneven and asymmetrical. It also implies that the topography of the study area is complex, containing landform types such as flats, hills, and mountains. Among them, the distribution of slope directions reflects the direction of ridges, and ridgelines are often the dividing line of slope directions. In particular, the ridges and valleys on the outer side of the inner ring show a radial and outward-expanding character.

3.4. Analysis of Relief Degree of Land Surface and Surface Roughness

According to Table 5, the study area has four classes: plains, plateaus, hills, and mountains. The landform type is mainly dominated by hills, which occupy 40.991% of the total area. Plateaus accounts for 33.441% of the total area. Plains accounted for 18.140% of the total area. Mountains accounted for 7.428% of the total area, which is the smallest.
Analysis based on the relief degree of the land surface map (Figure 10a) reveals that the landform type on the outer side of the inner ring is mountains, with a substantial relief degree of land surface, steep ridges, and sharp changes in slope. When the terrain extends from the inner ring to the outer ring, the relief degree of the land surface decreases step by step. At the same time, the slope of the terrain also decreases gradually, which is positively correlated with the relief degree of the land surface. Its landform type shows a transition from mountains–hills–plateaus–plains (valleys). In the inner area of the Inner Ring Road, the landform type is mostly a striped plateau and hills with gentle surface undulation. Among them, the riverbanks on both sides of the main streams of the water system are strongly undulating.
Like the relief degree of land surface (RDLS), surface roughness is divided into four classes (Table 5). However, their area share did not show the same trend. The surface roughness gradually increases from grade 1 to grade 4, but their area share shows a decreasing trend. Among them, the area of grade 1 is 20.418 km2 with a percentage of 59.278%. Grade 2 follows it with 29.509%. Grade 3 is 8.84%. Grade 4 has the minor share, at 2.37%.
Analysis of the surface roughness map (Figure 10b) revealed that surface roughness and relief degree of land surface (RDLS) have similar spatial distribution. The highest values of surface roughness were distributed in the outer part of the annular ridgeline, on both sides of the water system’s mainstream channel, and in the eastern part of the freestanding hills. On the outer side of the inner ring line, the surface roughness gradually decreases from the inner ring line outward. In the inner area of the inner loop, the riverbanks on both sides of the water system’s main streams have a high degree of roughness. The remaining areas have low surface roughness.
In general, the study area exhibits a circular pit shape. As shown in Figure 10, within the inner ring there is a distinctly raised crest in the center of the terrain, with a high Relief Degree of Land Surface (RDLS) and roughness on both sides of the water system’s mainstem channels in the southwest. In the ring belt area between the inner and outer rings, raised hills enclose a ring of ridges. Relief Degree of Land Surface (RDLS) values and surface roughness decrease gradually from the inner to the outer ring. The terrain within the inner ring is roughly divided into three major parts by the water system. In the northern and northwestern parts, the terraces and hills are arranged in a radial row with a roughly north-south orientation; in the central part, the terrain consists of terraces and hills with a moderately low degree of roughness; and in the southeastern part, the terrain is mostly hilly with a moderately high degree of roughness.

4. Discussion

4.1. Selection of Data Sources

Advancements in high spatial resolution terrain data enable accurate mapping and analysis of intricate terrain, more efficient terrain investigations, and convenient acquisition of detailed geomorphic feature information [37]. However, terrain data with varying resolutions may impact analysis results [38]. UAV data offer high-resolution images and real-time monitoring with enhanced flexibility. However, UAV have load capacity and flight time limitations, and their efficiency in collecting data for large-scale terrain is relatively low [17,19]. LiDAR point cloud data can offer high-density and high-precision 3D terrain data, making it suitable for accurate terrain modeling and analysis of intricate terrain. However, it comes with high costs and large data volumes, and demands substantial storage and processing resources. Satellite-borne high-precision terrain data cover extensive areas and are better suited for large-scale terrain characterization.
In this study, GF-2 data with sub-meter spatial resolution and high positioning accuracy was utilized. Compared to widely utilized remote sensing images like Sentinel-2 and Landsat8, GF-2 exhibits fast data transmission speed and superior image quality, and preserves finer topographic features. The ALOS DEM utilized in this study features a spatial resolution of 12.5 m, representing the highest precision global DEM data available free of charge. In comparison to widely used SRTM3 (90 m) and ASTER (30 m) data, it can offer more detailed topographic information, aiding in the capture of small-scale topographic features and obtaining reliable research results.

4.2. Selection of Research Methods

Traditional methods for measuring and analyzing terrain features rely on manual field surveys and GIS statistical analysis [39]. While these methods have been widely employed, they pose challenges in measuring complex terrain features and demand significant labor and time investment. In contrast to Hu’s study [40], this research utilizes terrain feature parameters for terrain analysis. This approach enables measurements of landforms in multiple dimensions and scales, incorporating both qualitative and quantitative assessments to characterize the terrain visually.
The choice of terrain feature parameters holds significance as it directly impacts the integrity of terrain feature identification. Considering each terrain feature parameter’s unique geological significance, choosing representative indicators that comprehensively depict terrain features from numerous parameters becomes crucial. This helps minimize information overlap and data redundancy, enhancing computational efficiency and accuracy. In contrast to Li’s study [41], this research conducted a correlation analysis of terrain feature parameters and excluded indicators with a correlation of 0.937 or higher. This approach identifies the optimal combination of parameters describing the topographic features in the study area, reducing redundancy in topographic feature information.

4.3. Limitations of the Study

Topographic characterization studies extend beyond the scope of geomorphometry and terrain analysis, frequently establishing significant connections with other subfields of earth science. Examples encompass tectonics, hydrology, ecology, and geology [42,43]. However, acquiring information related to hydrogeology, tectonics, and fault data in the study area poses significant challenges. Integration of this data would enhance the precision and richness of geomorphological characterization.
The utilization of ALOS DEM and GF-2 data in this study remains to be explored in a more detailed investigation of topographic feature identification. Multi-source, multi-modal data yield a more comprehensive set of terrain feature information than individual datasets, as they support, complement, and correct each other. Subsequent research endeavors can leverage multi-source and multi-mode data, conduct varied comparisons, and choose the most suitable data source based on specific research requirements.
Theoretically, this study offers insights and methods applicable to surface feature identification and the analysis of geomorphic tectonic evolution within a similar complex environment. However, the specific applicability requires thorough practical validation.

5. Conclusions

Geomorphology and terrain analysis represent foundational and leading-edge disciplines capable of investigating the spatial structure and macroscopic performance of topography and geomorphology comprehensively and systematically. Among these, the swift extraction and analysis of terrain feature parameters using DEM offer an efficient means to acquire surface information. Building upon this foundation, this study integrates statistics, information science, and other relevant disciplines to perform multi-dimensional, qualitative, and quantitative identification, measurement, and visual mapping analyses of the annular tectonic landforms in Dinosaur Valley, situated in the mountainous regions of the Yunnan Plateau. This approach enhances and refines the investigation of the annular tectonic landforms in the Dinosaur Valley.
(1)
This study determines that the optimal threshold for extracting the river network using ALOS DEM in this area is 150. The river network displays a characteristic dendritic pattern. The number and length of rivers show an inverse relationship with their order. The observation that first-order streams constitute over half of the river network distribution implies that the study area experiences abundant and well-established surface runoff, with the likelihood of additional tributaries forming over time.
(2)
The procedural steps for extracting terrain characteristic parameters from ALOS DEM offer valuable insights for studying complex terrain. This study determines that the optimal analysis window for extracting terrain feature parameters in this area is 16 × 16, with an optimal statistical area of 0.04 km2. Conducting correlation analysis on terrain characteristic parameters can mitigate information redundancy. The optimal combination of parameters to describe the terrain characteristics in the study area includes slope, slope direction, surface undulation, and surface roughness.
(3)
Statistical methods prove effective in analyzing the outcomes of terrain characteristic parameters. In this study, the slope gradient primarily spans from 0° to 56.59° and is characterized by slopes and steep inclines. Landslide-prone areas constitute 9.876% of the entire area. The slope direction exhibits uneven distribution, with the southeast slope representing the majority and a lower percentage of flat land overall. The predominant landform is hilly, with the majority of terrain exhibiting low roughness.
(4)
GIS visualization methods excel in emphasizing the spatial distribution of topographic features. The study area exhibits a generally intricate topography, characterized by a descent in elevation from northeast to southwest and prominent ring-like features. The ridgelines and valley lines exhibit distinct double-ring features reminiscent of a “heart” shape, radiating outward in the ring area. The topographic parameters are notable on the outer side of the ring ridge, featuring high slope values, surface relief, and surface roughness, diminishing from the inner to the outer ring.
(5)
Extracting topographic feature information in the intricate mountain environment of the plateau utilizing ALOS DEM data, offers advantages in terms of scale, non-contact, and ease of acquisition. This approach provides high-precision foundational data for research in topographic feature identification, measurement, and analysis.

Author Contributions

Y.W. performed the research and methodology, analyzed the data, and wrote the manuscript. S.G. (Shu Gan) designed the framework of the research and mastered the conceptualization. S.G. (Shu Gan) and X.Y. gave many suggestions for improving and modifying this paper. S.G. (Sha Gao) and L.H. contributed to data processing and visualization analysis. All authors have read and agreed to the published version of the manuscript.

Funding

This research received funding from the National Natural Science Foundation of China (No. 62266026), the funder is Shu Gan.

Institutional Review Board Statement

Not applicable.

Informed Consent Statement

Not applicable.

Data Availability Statement

The data presented in this study are available on request from the corresponding author. The data are not publicly available as they involve the subsequent application of other studies.

Acknowledgments

Many thanks to S.G. (Shu Gan), X.Y., L.H. and S.G. (Sha Gao) for many improvements and revisions to this paper.

Conflicts of Interest

The authors declare no conflict of interest.

Abbreviations

GISGeographic Information System
GF-2Gaofen-2 satellite
DEMDigital Elevation Model
ALOSAdvanced Land Observing Satellite
PALSARPhase Array type L-band Synthetic Aperture Radar
RTCRadiometric Terrain Correction
ALOS DEMAdvanced Land Observing Satellite Digital Elevation Model
ASTERAdvanced Spaceborne Thermal Emission and Reflection Radiometer
ASTER GDEMAdvanced Spaceborne Thermal Emission and Reflection Radiometer Global Digital Elevation Model
SRTMShuttle Radar Topography Mission
SRTM DEMShuttle Radar Topography Mission Digital Elevation Model
RSRemote sensing
UAVUnmanned Aerial Vehicle
NNDiffuseNearest Neighbor Diffusion
RITRochester Institute of Technology
JAXAJapan Aerospace Exploration Agency
RDLSRelief Degree of the Land Surface

References

  1. Carrera-Hernandez, J.J. Not all DEMs are equal: An evaluation of six globally available 30 m resolution DEMs with geodetic benchmarks and LiDAR in Mexico. Remote Sens. Environ. 2021, 261, 112474. [Google Scholar] [CrossRef]
  2. Deng, J.; Cheng, W.; Liu, Q.; Jiao, Y.; Liu, J. Morphological differentiation characteristics and classification criteria of lunar surface relief amplitude. J. Geogr. Sci. 2022, 32, 2365–2378. [Google Scholar] [CrossRef]
  3. Sreekesh, S. Generation of Geomorphometric Information Using Satellite Images for Climate Change Impact Studies. Geospat. Technol. Clim. Chang. 2014, 10, 261–277. [Google Scholar]
  4. Yang, L.; Yang, X.; Na, J. An Exploration of Loess Landform Development Based on Population Ecology Method. ISPRS Int. J. Geo-Inf. 2022, 11, 104. [Google Scholar] [CrossRef]
  5. Xiong, L.; Li, S.; Tang, G.; Strobl, J. Geomorphometry and terrain analysis: Data, methods, platforms and applications. Earth-Sci. Rev. 2022, 233, 104191. [Google Scholar] [CrossRef]
  6. Burrough, P.A.; McDonnell, R.A.; Lloyd, C.D. Principles of Geographical Information Systems; Oxford University Press: New York, USA, 2015. [Google Scholar]
  7. Lakshmi, S.E.; Yarrakula, K. Review and critical analysis on digital elevation models. Geofizika 2018, 35, 129–157. [Google Scholar] [CrossRef]
  8. Polidori, L.; El Hage, M. Digital elevation model quality assessment methods: A critical review. Remote Sens. 2020, 12, 3522. [Google Scholar] [CrossRef]
  9. Fang, L.; Liu, W.; Li, H. Terrain Feature Extraction and Analysis of the Yanwachuan Basin in Loess Tableland-gully Region Based on GIS. Res. Soil Water Conserv. 2010, 17, 7–11+289. [Google Scholar]
  10. Zhang, K.; Xiao, Y.; He, Z.; Gao, M. Topography features of Qilian Mountains nature reserve based on SRTM DEM. Arid. Land Geogr. 2020, 43, 1559–1566. [Google Scholar]
  11. Venkatesh, M.; Anshumali. A GIS-based assessment of recent changes in drainage and morphometry of Betwa River basin and sub-basins, Central India. Appl. Water Sci. 2019, 9, 157. [Google Scholar] [CrossRef]
  12. Zhang, J.; Wu, J.; Qin, G.; Yao, Z. Geomorphic features and morphological classification in Qinling-Bashan Mountains based on DEM. J. Yunnan Univ. (Nat. Sci. Ed.) 2021, 43, 1147–1155. [Google Scholar]
  13. SU, L.; GUO, Y.; WU, Y. Analysis of geomorphology of Niyang River Basin based on digital elevation model. Soil Water Conserv. Sci. 2020, 18, 12–21. [Google Scholar]
  14. Agarwal, K.; Prakash, C.; Ali, S.N.; Jahan, N. Morphometric analysis of the Ladhiya and Lohawati river basins, Kumaun Lesser Himalaya, India. Z. Fur Geomorphol. 2012, 56, 201. [Google Scholar] [CrossRef]
  15. Xiong, L.; Tang, G.; Yang, X.; Li, F. Geomorphology-oriented digital terrain analysis: Progress and perspectives. J. Geogr. Sci. 2021, 31, 456–476. [Google Scholar] [CrossRef]
  16. Wu, Z.H.; Zhang, Y.Q.; Hu, D.G. Neotectonics, active tectonics and earthquake geology. Geol. Bull. China 2014, 33, 391–402. [Google Scholar]
  17. Weidong, L.; Shu, G.; Xiping, Y.; Sha, G. Extraction and analysis of feature elements of micro-topography in southern margin of Dinosaur Valley. Bull. Surv. Mapp. 2021, 8, 48. [Google Scholar]
  18. Bi, R.; Gan, S.; Yuan, X.; Li, R.; Gao, S.; Yang, M.; Luo, W.; Hu, L. Multi-View Analysis of High-Resolution Geomorphic Features in Complex Mountains Based on UAV—LiDAR and SfM—MVS: A Case Study of the Northern Pit Rim Structure of the Mountains of Lufeng, China. Appl. Sci. 2023, 13, 738. [Google Scholar] [CrossRef]
  19. Sha, G.; Xiping, Y.; Shu, G.; Milong, Y.; Lin, H.; Rui, B. Local 3D scene fine detection analysis of circular landform on the southern edge of Dinosaur Valley. Arab. J. Geosci. 2021, 14, 1840. [Google Scholar] [CrossRef]
  20. Hu, L.; Gan, S.; Yuan, X.; Yang, M.; Gao, S.; Bi, R. Application of Remote Sensinc of Linear Features of Circular Structure in South of Lufeng Dinosaur valley based on GF-2. J. Geol. Hazards Environ. Preserv. 2022, 33, 77–81. [Google Scholar]
  21. Zhao, H.; Gan, S.; Yuan, X.; Hu, L.; Wang, J.; Liu, S. Application of a Fractional Order Differential to the Hyperspectral Inversion of Soil Iron Oxide. Agriculture 2022, 12, 1163. [Google Scholar] [CrossRef]
  22. Pan, T.; Guan, H.; He, W. GF-2 satellite remote sensing technology. Spacecr. Recovery Remote Sens. 2015, 36, 16–24. [Google Scholar]
  23. Zhang, D.-D.; Xie, F.; Zhang, L. Preprocessing and fusion analysis of GF-2 satellite Remote-sensed spatial data. In Proceedings of the 2018 International Conference on Information Systems and Computer Aided Education (ICISCAE), Changchun, China, 6–8 July 2018; pp. 24–29. [Google Scholar]
  24. Liu, Z.; Zhu, J.; Fu, H.; Zhou, C.; Zuo, T. Evaluation of the Vertical Accuracy of Open Global DEMs over Steep Terrain Regions Using ICESat Data: A Case Study over Hunan Province, China. Sensors 2020, 20, 4865. [Google Scholar] [CrossRef]
  25. Khadri, S.; Pande, C.B. Remote sensing and gis applications of geomorphological mapping of Mahesh river basin, Akola & Buldhana districts, Maharashtra, India using multispectral satellite data. Indian Streams Res. J. 2014, 4, 1–7. [Google Scholar]
  26. Wu, H.; Liu, X.; Li, Q.; Hu, X.; Li, H. The Effect of Multi-Source DEM Accuracy on the Optimal Catchment Area Threshold. Water 2023, 15, 209. [Google Scholar] [CrossRef]
  27. Strahler, A.N. Quantitative analysis of watershed geomorphology. Eos Trans. Am. Geophys. Union 1957, 38, 913–920. [Google Scholar]
  28. LIU, Y.; ZHAO, T.; University, D. Method for extraction of relief amplitude of abandoned quarry based on change point method. Res. Soil Water Conserv. 2016, 23, 269–273. [Google Scholar]
  29. Zhang, X.; Cai, H.; Tu, H. Impact of Landscape Pattern on River Water Quality Based on Different Topographic Relief Areas: A Case Study of Chishui River Basin in Southwest China. Sustainability 2023, 15, 1476. [Google Scholar] [CrossRef]
  30. Liu, X.; Gong, J.; Zhou, Q.; Tang, G. A Study of Accuracy and Algorithms for Calculating Slope and Aspect Based on Grid Digital Elevation Model(DEM). Acta Geod. Cartogr. Sin. 2004, 33, 258–263. [Google Scholar]
  31. Demek, J. Manual of Detailed Geomorphological Mapping; IOS Press: Amsterdam, The Netherlands, 1984; pp. 27–28. [Google Scholar]
  32. Tang, G.; Song, J. Comparison of Slope Classification Methods in Slope Mapping from DEMs. J. Soil Water Conserv. 2006, 2, 157–160+192. [Google Scholar]
  33. Ren, D.; Zheng, D. Design of Terrain Information Extraction Scheme Based on GIS Platform: Take Suide County of Yulin City as an Example. Geomat. Spat. Inf. Technol. 2017, 40, 10–12+16+20. [Google Scholar]
  34. Mo, S. Study on digital landform patterns based on DEM in Qinling Mts. J. East China Norm. Univ. (Nat. Sci.) 2008, 2, 8–14. [Google Scholar]
  35. Su, Q.; Liang, M.; Yuan, D.; Xie, H.; Wu, Z. Geomorphic Features of the Bailongjiang River Drainage Basin and lts Relationship with Geological Disaster. Earth Sci. Inform. 2016, 41, 1758–1770. [Google Scholar]
  36. Rajasekhar, M.; Raju, G.S.; Raju, R.S. Morphometric analysis of the Jilledubanderu river basin, Anantapur District, Andhra Pradesh, India, using geospatial technologies. Groundw. Sustain. Dev. 2020, 11, 100434. [Google Scholar] [CrossRef]
  37. Wu, C.; Li, X.; Chen, W.; Li, X. A review of geological applications of high-spatial-resolution remote sensing data. J. Circuits Syst. Comput. 2020, 29, 2030006. [Google Scholar] [CrossRef]
  38. Huang, J.; Wei, L.; Chen, T.; Luo, M.; Yang, H.; Sang, Y. Evaluation of DEM Accuracy Improvement Methods Based on Multi-Source Data Fusion in Typical Gully Areas of Loess Plateau. Sensors 2023, 23, 3878. [Google Scholar] [CrossRef] [PubMed]
  39. Grecu, F. Geomorphological Map of the Prahova Subcarpathians (Romania). J. Maps 2009, 5, 108–116. [Google Scholar] [CrossRef]
  40. Hu, L.; Gan, S.; Yuan, X.; Yang, M.; Gao, S.; Bi, R.; Li, Y. Analysis of geomorphologic features of the circular structure in the south of Lufeng Dinosaur Valley. Earth Sci. Inform. 2022, 15, 455–464. [Google Scholar]
  41. Li, W.; Wang, P.; Ding, Z.; Li, P.; Liao, Z.; Hua, H.; Li, Y. Geomorphic Features of Wumeng Mountain National Nature Reserve Based onALOS DEM. Trop. Geogr. 2023, 43, 1390–1399. [Google Scholar]
  42. Arfa-Fathollahkhani, A.; Ayyoubzadeh, S.A.; Shafizadeh-Moghadam, H.; Mianabadi, H. Spatiotemporal Characterization and Analysis of River Morphology Using Long-Term Landsat Imagery and Stream Power. Water 2022, 14, 3656. [Google Scholar] [CrossRef]
  43. Bonilla-Sierra, V.; Scholtes, L.; Donzé, F.; Elmouttie, M. Rock slope stability analysis using photogrammetric data and DFN–DEM modelling. Acta Geotech. 2015, 10, 497–511. [Google Scholar] [CrossRef]
Figure 1. Location map of the study area: (a) location map of Chuxiong Yi Autonomous Prefecture, (b) Location map of Lufeng County, (c) GF-2 image.
Applsci 13 13137 g001
Figure 2. Ridge and valley line extraction results. (a) ridge line (b) valley line (c) main ridge lines (d) main valley line.
Applsci 13 13137 g002
Figure 3. Fitting curve of river network density and catchment area threshold.
Applsci 13 13137 g003
Figure 4. Variation curve of S S i .
Applsci 13 13137 g004
Figure 5. Major valley lines and ridgelines in the study area.
Applsci 13 13137 g005
Figure 6. Classification of the water system network within the inner ring of the study area.
Applsci 13 13137 g006
Figure 7. Slope distribution and percentage share of the study area at all levels.
Applsci 13 13137 g007
Figure 8. Distribution of microtopographic feature parameters (a) slope and (b) slope direction.
Applsci 13 13137 g008
Figure 9. Slope direction, distribution, and area share of the study area.
Applsci 13 13137 g009
Figure 10. Distribution of macrotopographic feature parameters: (a) relief degree of land surface, (b) surface roughness.
Applsci 13 13137 g010
Table 1. GF-2 satellite payload parameters.
LoadSpectral Range (μm)Spatial Resolution (m)Width (km)Revisit Period (Day)Coverage Period (Day)
Panchromatic camera0.45~0.90 μm0.8 m45 (Two cameras combination)569
multispectral camera0.45~0.52 μm3.2 m
0.52~0.59 μm
0.63~0.69 μm
0.77~0.89 μm
Table 2. Correlation coefficient matrix table.
Feature ParametersSlopeSlope
Direction
RDLSSurface RoughnessECVSurface
Cut Depth
Slope1
slope aspect0.0061
RDLS0.7060.0071
Surface Roughness0.9250.0370.6721
ECV0.7700.0130.9700.7361
Surface Cut Depth0.6880.0010.9370.6620.9141
Table 3. Statistical table of characteristic parameters of ridgelines and valley lines.
TitleArea
(km2)
Perimeter (km)East-West Width (km)North-South Length (km)
Inner Ring Line (R1)13.99715.0444.1524.846
Outer Ring Line (R2)34.75027.9197.4597.863
R1/R20.4030.5390.5570.616
Table 4. Linear measurement results of the water system network within the inner ring line.
LevelTotal
Number of rivers1446441239281
Length of river (km)21.42012.5747.9823.3071.26046.519
Table 5. Topographic feature parameters and their distribution.
ParameterIndicatorTotal Area (km2)Percentage (%)
Relief DegreePlains (<30 m)6.82918.140
Plateaus (30~50 m)12.58933.441
Hills (50~100 m)15.43140.991
Mountains (100~200 m)2.7967.428
Surface Roughness1 (Low roughness)20.41859.278
2 (Medium-low roughness)10.16429.509
3 (Medium-high roughness)3.0468.844
4 (High roughness)0.8162.370
Disclaimer/Publisher’s Note: The statements, opinions and data contained in all publications are solely those of the individual author(s) and contributor(s) and not of MDPI and/or the editor(s). MDPI and/or the editor(s) disclaim responsibility for any injury to people or property resulting from any ideas, methods, instructions or products referred to in the content.

