Article

Research on Static and Dynamic Loading Performance of Geosynthetic Reinforced and Pile-Supported Embankment

1
School of Architecture and Civil Engineering, Xi’an University of Science and Technology, Xi’an 710054, China
2
Pile-Supported Structures Research & Test Center, Xi’an University of Science and Technology, Xi’an 710054, China
*
Author to whom correspondence should be addressed.
Appl. Sci. 2023, 13(24), 13152; https://doi.org/10.3390/app132413152
Submission received: 27 October 2023 / Revised: 9 December 2023 / Accepted: 9 December 2023 / Published: 11 December 2023
(This article belongs to the Section Civil Engineering)

Abstract

:
Geosynthetic reinforced and pile-supported (GRPS) provide an economic and effective solution for embankments. To investigate the load-bearing mechanism of the GRPS embankment in loess, experimental and numerical studies under static and dynamic loading are carried out. The characteristics of soil arch effect and tensile membrane effect of GPRS embankment under static and dynamic loading are revealed by analyzing pile–soil stress ratio, tension of geogrid, and stress distribution of pile. The test results show that the pile–soil stress ratio under dynamic loading is reduced by 2.3 compared with static loading. In comparison to static load, the soil arching effect is attenuated under dynamic load, and the stronger the static load soil arching effect, the greater the degree of weakening under dynamic load. In addition, under dynamic loading, the tensioned membrane effect is still effective, but its enhancement is not as pronounced as under static loading. Furthermore, by using the finite element software, the numerical model is developed and validated with the experimental results. The parameter analysis of the load-bearing performance of the GRPS embankment is accomplished using the finite element model as well.

1. Introduction

Embankment construction for infrastructure projects has considerably increased during the past few decades in soft soil, loess, and medium-compression soil regions. Among the various ground improvement methods, geosynthetic reinforced and pile-supported (GRPS) embankments are considered to be a reliable and suitable solution for time-bound construction projects and difficult ground conditions [1,2,3,4,5,6]. GRPS embankments are piles, geogrids, and soil synergistic action of the three to bear the load; the main working principle relies on the soil arch effect and tensioned membrane effect [7]. Their advantages include faster construction, higher stability, lower cost, and wider applicability [8,9,10,11].
In this integrated system, the soil arching effect develops when differential settlements between piles and soil occur because of the different pile and soil stiffness, the internal stress in the soil is redistributed, the downward tendency of the subsoil is partially restrained by the shear stress within the embankment fill on the pile caps, and the vertical component of the shear stress participates in the process of load transfer onto the piles. Consequently, soil arching has a significant influence on the ultimate bearing capacity of the foundation as well as the performance of each pile [12,13,14,15,16]. Meanwhile, the existence of the geogrid can transfer the remaining embankment load to the pile top through the tension, and the tensioned membrane effect can give full play to the bearing potential of the pile and thus improve the bearing capacity of the foundation [17,18].
In recent years, scholars have conducted a series of research projects on the action mechanism and load-bearing capacity of GRPS embankments. Alsirawan et al. [3] studied the GRPS embankment technology over loose sandy soil. The results demonstrate that using two layers of geotextile with optimal positions over the pile heads can improve load distribution and reduce the variance in load efficiency between the piles. Ning et al. [19] analyzed the stress distribution of the planar soil arch and spatial soil arch of pile embankment under static load, and the results indicated that the spatial soil arch effect is stronger than the planar soil arch effect. Wei et al. [20] showed that the stress distribution of GPRS embankment is affected by the planar and spatial soil arch effects under dynamic load, and Liang et al. [11] found that the existence of geogrids can reduce the influence of dynamic load on the arch effect. To improve the bearing capacity of loess foundations, Zhou et al. [21] and Deng et al. [22] investigated GRPS embankment for loess foundations reinforced by splitting grouting piles and grouted cement fly ash gravel (CFG) piles. The results show that the structure has good bearing capacity under static load. Chen et al. [23] presented a novel optimization framework for genetic algorithms and improved black hole algorithms to systematically determine the design parameters to achieve the minimum construction cost for GRPS embankments. Zhang et al. [24] and Shi et al. [25] carried out parameter optimization of GRPS embankments and provided an economical and effective measure for the design of GRPS embankments. Pham et al. [15] present an analytical model for GRPS embankments that combines several phenomena, such as the concentric arches model in cohesive fill soils, the hyperbolic model for the isochrones geogrid curve, and the subsoil’s consolidation. Lü et al. [26] studied the long-term performance of the GRPS embankment of a high-speed railway and carried out static load and dynamic load model tests. The analysis results show that the pile is mainly affected by friction from the surrounding soil, while its end-bearing capacity is small. Xue et al. [27] established an X-type pile net composite foundation model and analyzed the mechanical characteristics of the structure under the action of a train load. The results show that the change in train speed does not have a large influence on peak dynamic displacement or peak dynamic soil stress. Numerical methods are also quite often used, Han et al. [28] used finite element software to establish a numerical calculation model of GRPS for different reinforced cushion, reinforced material, and embankment heights. The calculation results show that the increase in fill height and the strength of reinforced material will increase the load-sharing ratio of the pile. Zhang et al. [29] established a three-dimensional numerical calculation model of the pile-supported embankment and analyzed its load transfer mechanism. The results showed that the application of gravel cushion and geogrid could improve the load-sharing ratio of piles. Pham and Dias [30] conducted a three-dimensional numerical analysis on GRPS embankments of cohesive and non-cohesive embankment soil. The influence of embankment heights, geosynthetic tensile stiffness, and fill soil properties is also investigated on the arching efficacy, geosynthetic tension, and settlement reduction performance. The numerical results indicated that the GRPS system shows good performance in reducing the embankment settlement. The available studies provide an important contribution to the progress of research on GRPS embankment. However, the load transfer mechanism of GRPS in loess under static and dynamic loading is still insufficient.
The mechanical behavior of the GRPS embankment in loess under dynamic and static loads was explored through experiments and numerical simulations. In this study, the stress distribution of piles, the pile–soil stress ratio, and the geosynthetic tension distribution were investigated. Furthermore, an analysis and comparison of the stress distribution characteristics of GRPS embankments under static and dynamic loads were also conducted. Finally, the three-dimensional numerical model of the GRPS embankment was established by using the software ABAQUS 2020. With the validated numerical models, the attenuation coefficient of the structure under dynamic load and the influence of different pile spacing and embankment heights on the load transfer law of the GRPS embankment were further investigated.

2. Experimental Tests

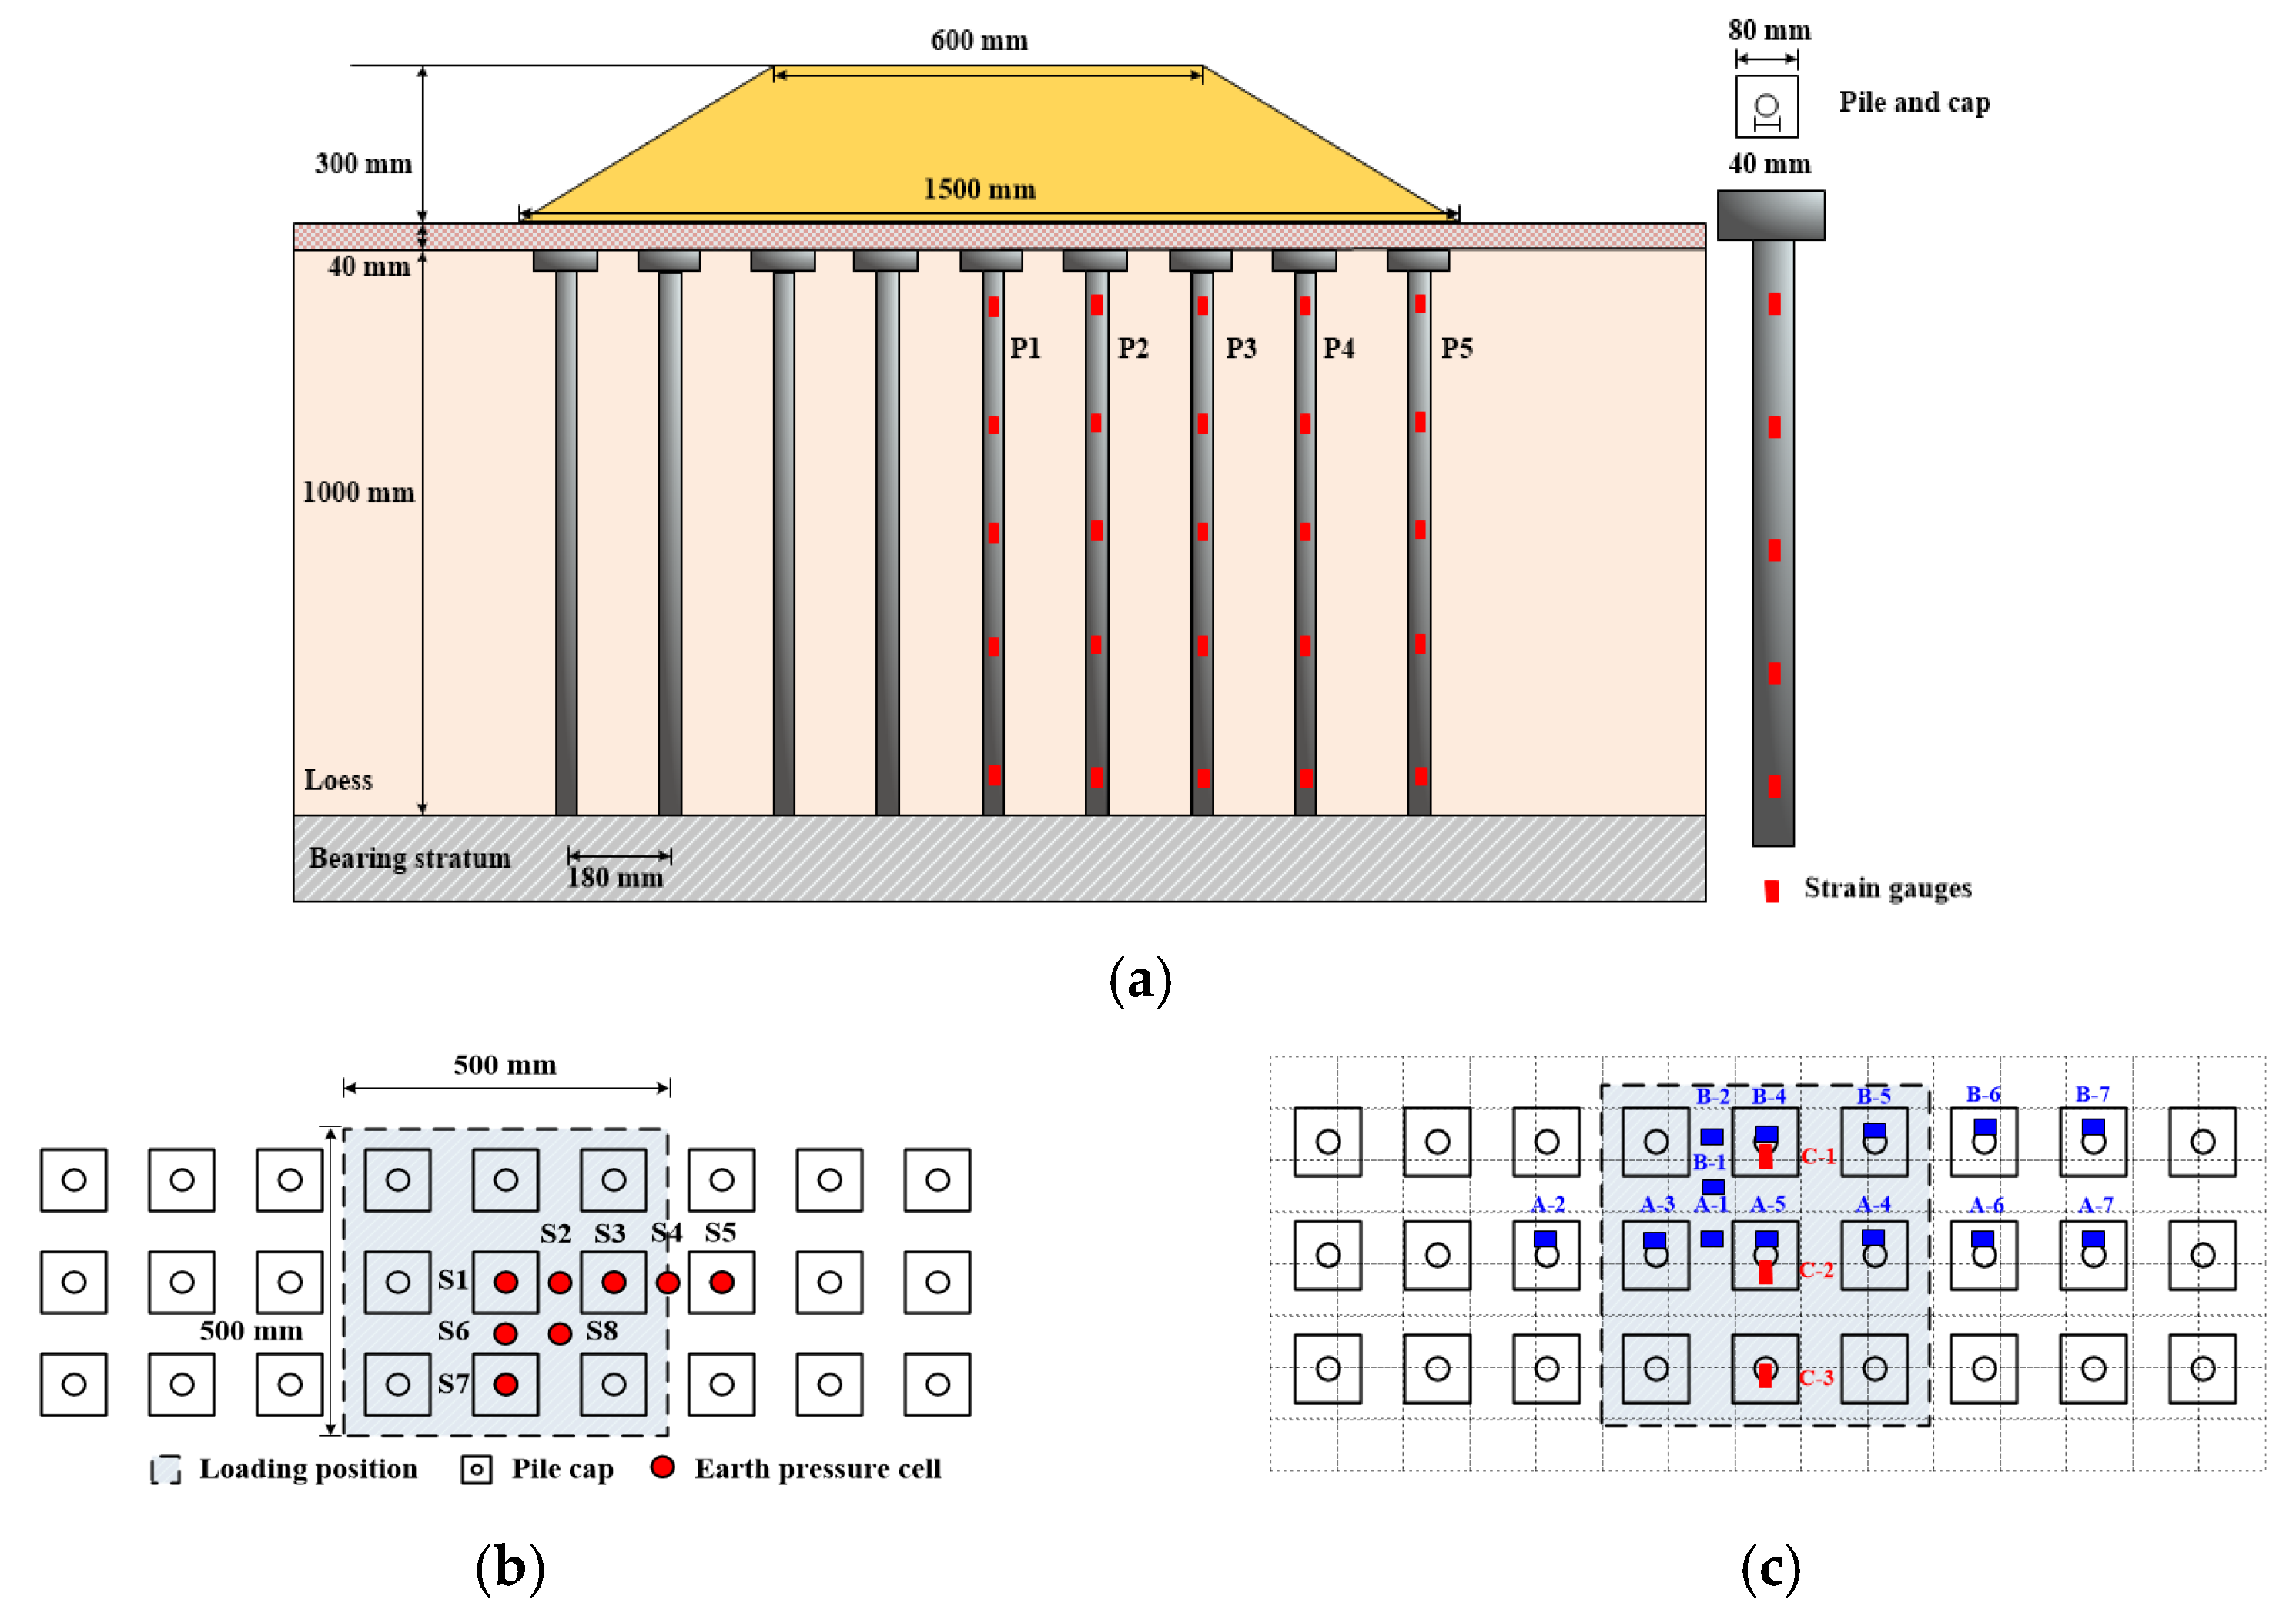
2.1. Specimen Design

In this research, the model test setup, with inside dimensions of 6000 mm long, 2000 mm high, and 2200 mm wide, was made of profile steel, two steel panels, and two transparent stalinite panels. The test model is designed according to the single-line standard roadbed in the Code for the Design of High-Speed Railways [31]. Considering the size and operability of the laboratory test setup, the geometric similarity ratio is determined to be 10. Taking the geometric similarity constant as the first basic quantity and the heavy similarity ratio as the second basic quantity, the similarity coefficients of other variables can be derived based on these two basic quantities [32], as shown in Table 1. The width of the embankment in the straight section of the single-track high-speed railway is selected as 6 m, thus the width of the embankment was 600 mm according to the similarity ratio in the model test. The width of the subgrade was 1500 mm, the height of the embankment was 300 mm, and the slope rate of the embankment was 1:1.5. The length of the pile is 1000 mm, with a diameter of 40 mm. The piles were spaced 180 mm apart, and the pile cap was a square with a side length of 80 mm. The gravel cushion is on top of the pile caps, and the geogrid is sandwiched in the middle of the gravel cushion. The laboratory model of the GRPS embankment is shown in Figure 1 and Figure 2.

2.2. Material Properties

The laboratory test was carried out in the Xi’an Key Laboratory of Geotechnical and Underground Engineering with a geotechnical model test box. The bottom surface of the model box is hard soil, simulating the bearing stratum of the pile. The test prototype selected in this study is the CFG piles. The elastic modulus of the CFG pile is small and can be simulated by using beech wood for the model test [33,34]. In this study, the loess from the Xi’an section of the Xikang high-speed railroad project is fine-grained loess after screening. The test was carried out in accordance with the Highway Geotechnical Test Procedure (JTG 3430-2020) [35], and the results of the performance tests, such as the quadruple straight shear test, are shown in Table 2. When the pile diameter (B) to the grain size of soil (d50) is greater than 30 (B/d50 ≥ 30) [36], the effect of errors due to non-reduced soil particles can be neglected. The pile diameter B = 40 mm was selected for this modeling test, which means that the grain size of the soil used is less than 1.33 mm to meet the design requirements, and the grain size of loess usually does not exceed 1 mm. Therefore, the effect of the grain size of the soil can be neglected in this model test. The soil sample was saturated and consolidated for a 1-week period before conducting the tests. The gravel cushion and geogrid were made of the same material as in the actual project. The embankment was prepared by mixing gravel and sand with a particle size of 10~15 mm (mass ratio 4:1) and compacting in layers to achieve the required compaction coefficient for the test. Information on material parameters is provided in Table 2. The gravel cushion was 40 mm thick, with a bi-directional geogrid layer built into the middle of the cushion, and the specific parameters of the bi-directional tensile plastic geogrid are shown in Table 3.

2.3. Test Setup and Loading Devices

The measurement points of the test model are arranged as shown in Figure 1. Nine piles were set in the subgrade, and since the test was a symmetrical structure, only half of the structure was arranged for the measurement points. As shown in Figure 1a, in order to measure the stress in the pile, the five strain gauges with a distance of 22.5 cm were evenly pasted on the pile. As shown in Figure 1b, nine earth pressure boxes numbered S1 to S9 were arranged to monitor the earth pressure at the top of the pile and the earth pressure between the piles, respectively. Full bridge strain gauges were used to measure the stress on the geogrid numbered A-1 to C-3, and the locations were arranged as shown in Figure 1c. The displacement meters are arranged on the embankment surface loading plate for settlement measurement.
The test loads are divided into two parts: static load and dynamic load, which are loaded on the surface layer of the embankment, and the loading position is shown in the shaded part of Figure 1b. Static load is completed by gravity loading, with reinforced concrete gravity slabs loaded step by step with a total of five levels of loading, and each level of loading is 8.2 kPa after conversion. The form of dynamic loads generated by train operation is affected by more complex factors, and the complete reduction in dynamic train loads in the test is difficult, and there is no unified load form for dynamic train loads by scholars at home and abroad. Therefore, in this study, the simple sinusoidal cyclic load proposed by Han et al. [37] is used to simulate the train load. The dynamic stresses generated on the subgrade bed during train operation range from 10 to 20 kPa, with a response principal frequency around 10 Hz [38]. The dynamic load device of the test was a 380V electric power rammer, the pressure of the impact loading plate was 11 kPa, the loading frequency was 10 Hz, and the simulated train load schematic was Figure 3. The DH5922D dynamic stress–strain analyzer of China Jiangsu Taizhou Jingjiang Donghua Testing Technology Co. Ltd. was used for test acquisition, and the maximum sampling frequency of the acquisition device is 50 Hz.

3. Experimental Results and Discussion

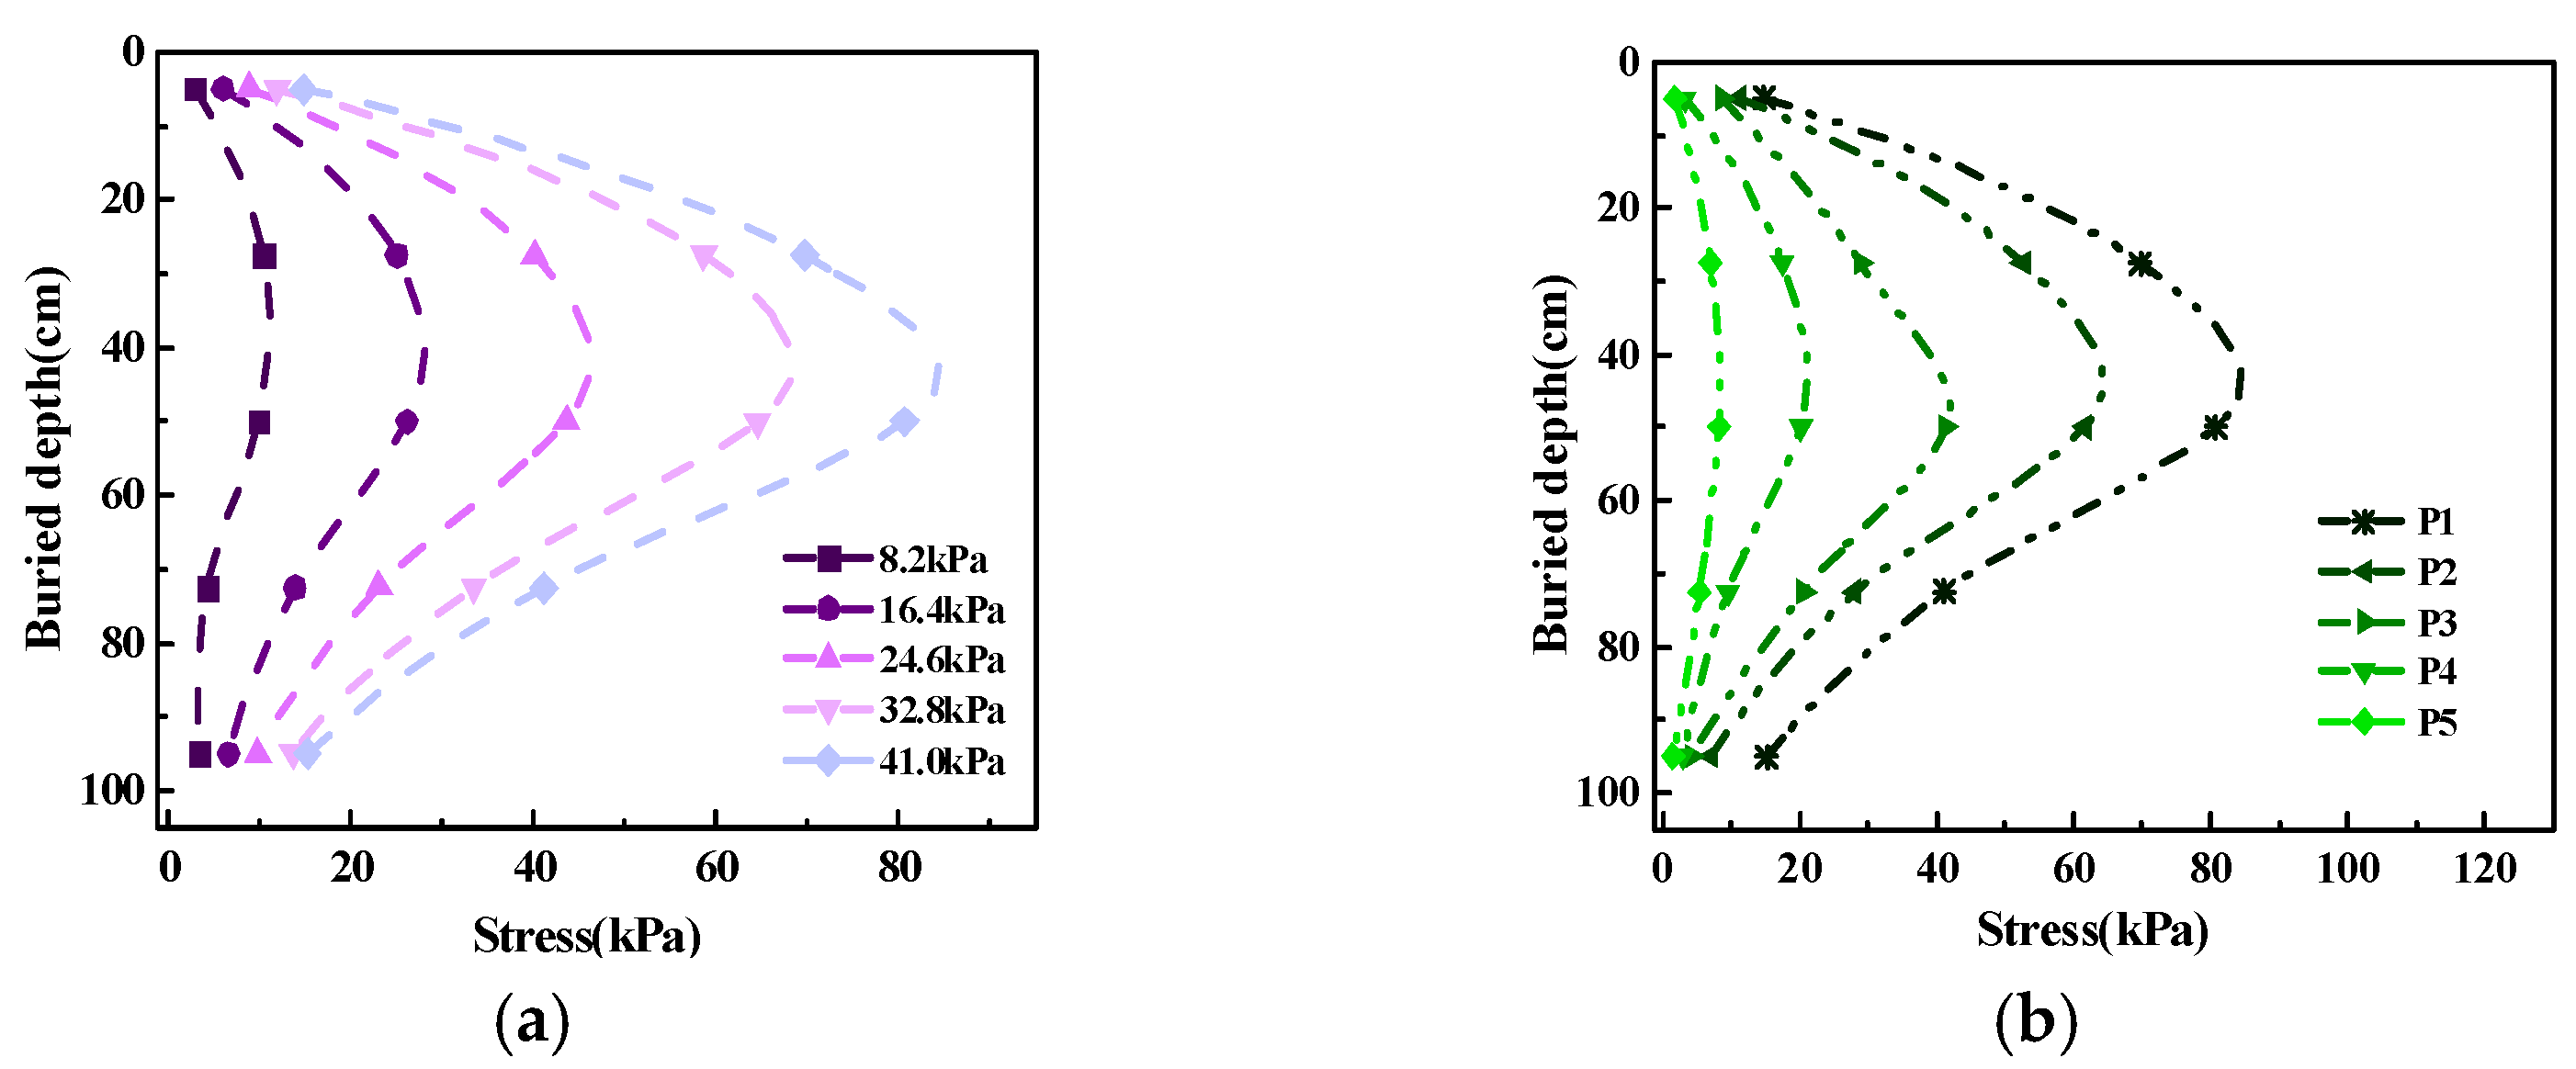
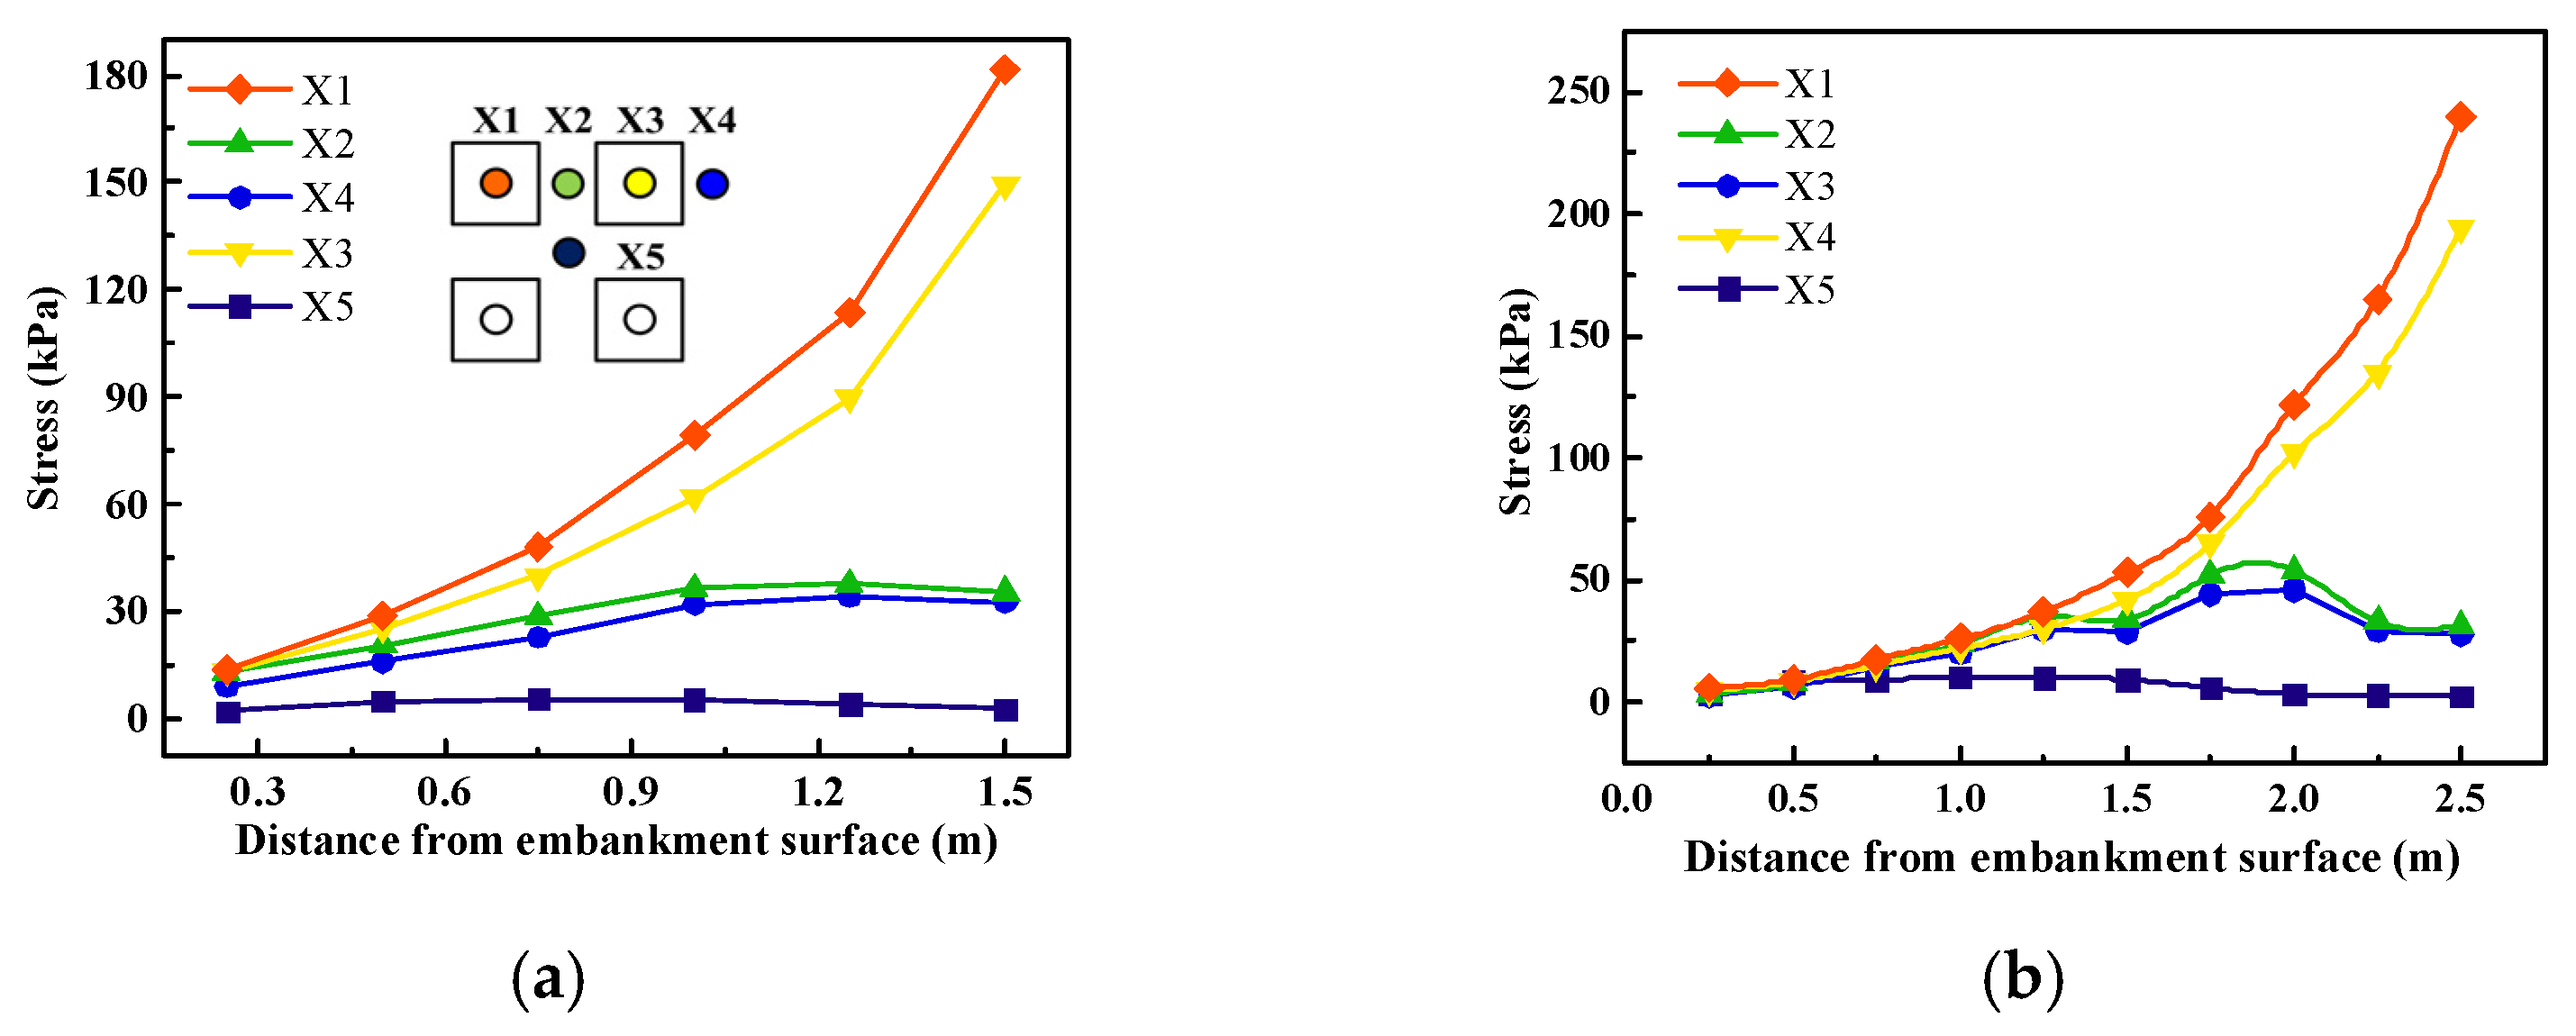
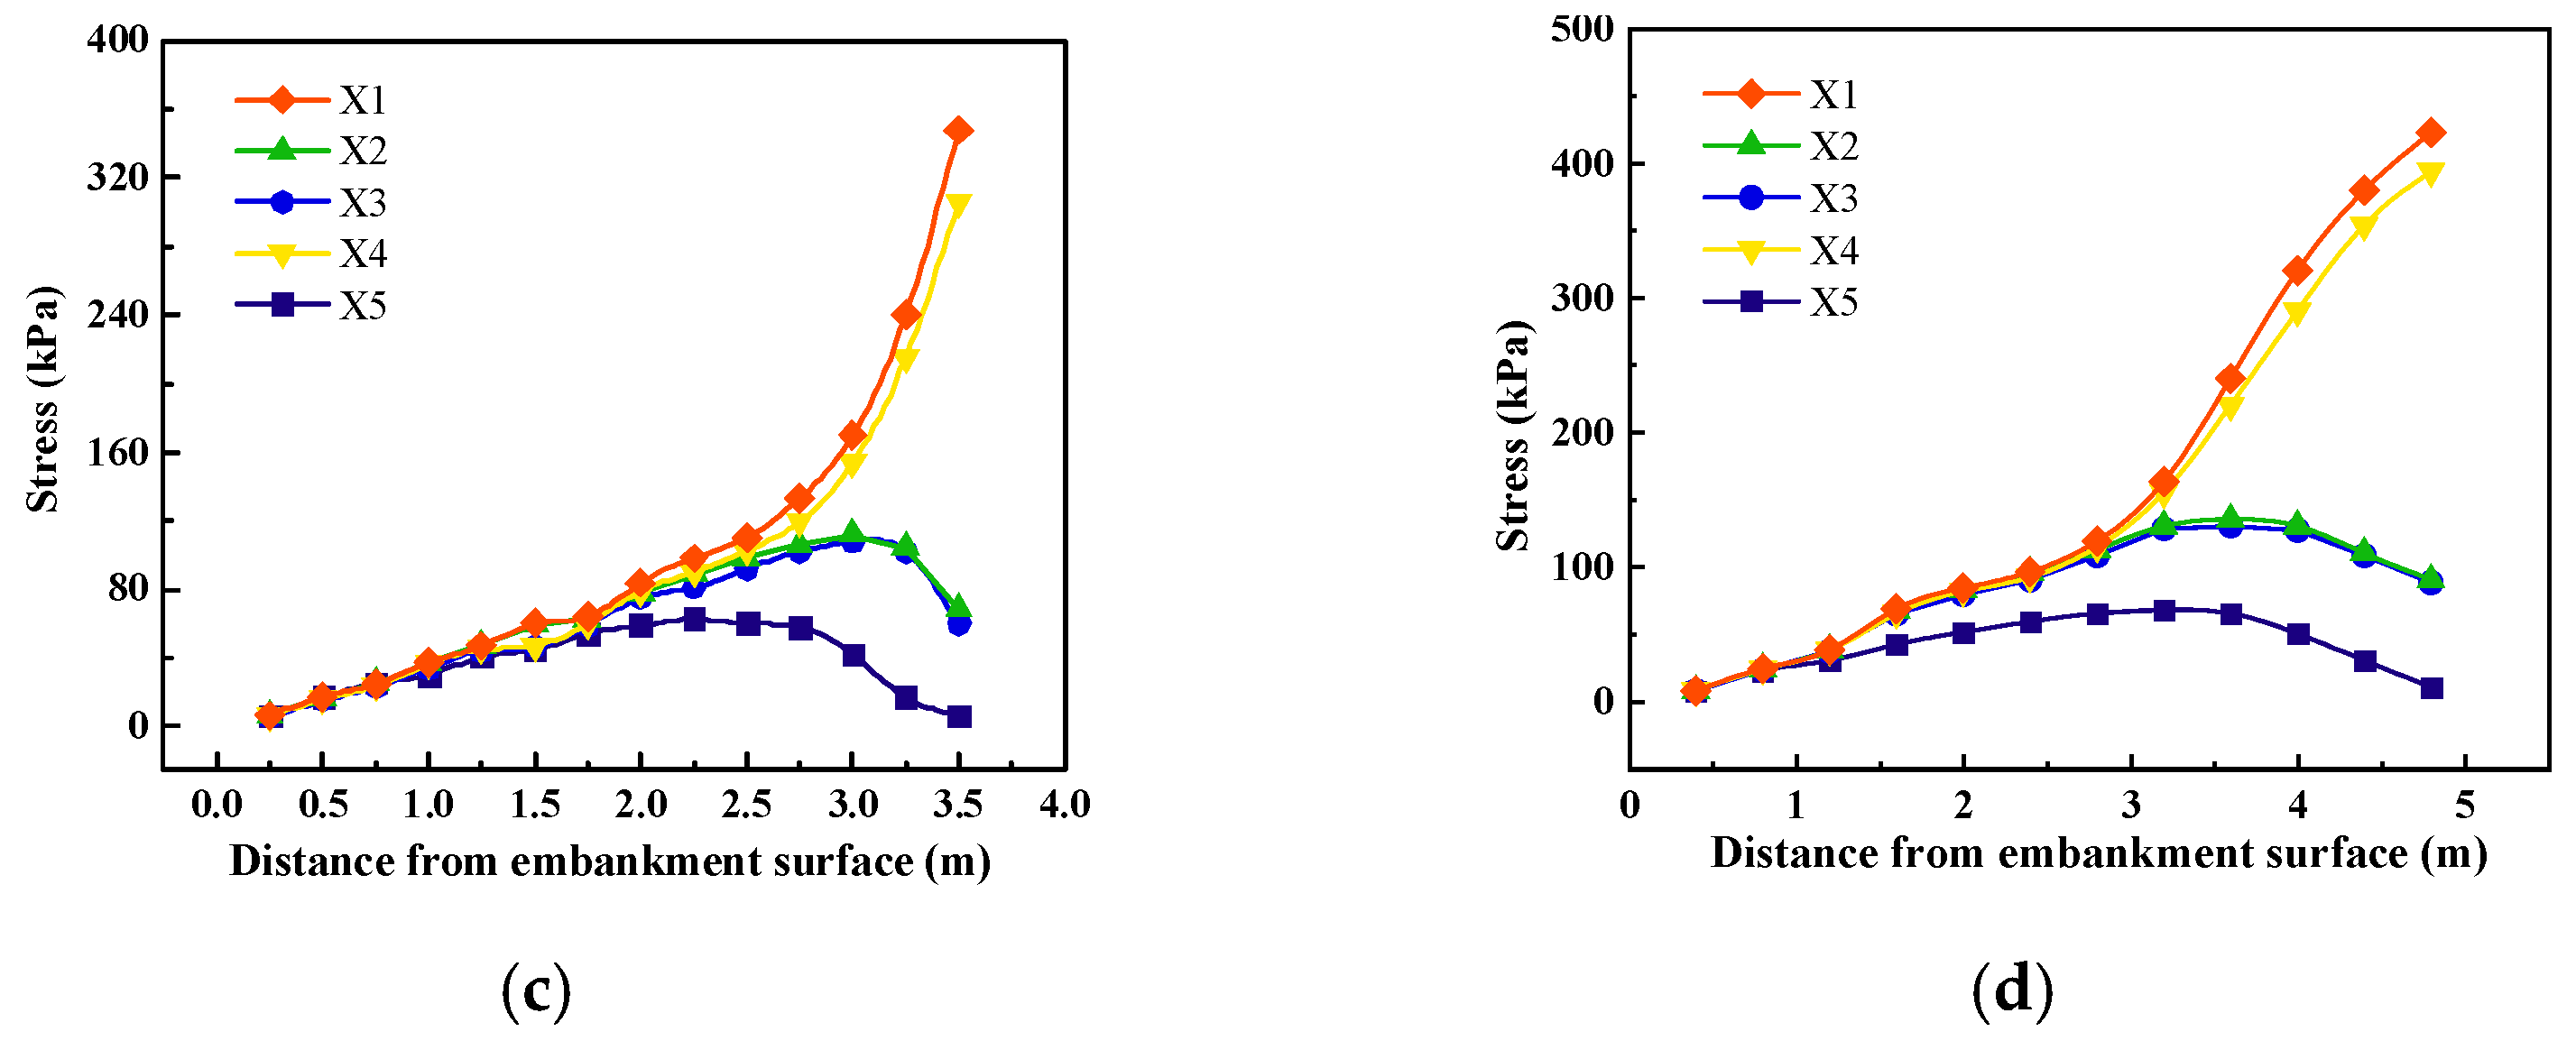
3.1. Stress Distribution of Pile

Figure 4a shows the axial stress distribution of P1 in the GRPS embankment. With the increase in load, the stress distribution of the pile increases and then decreases from the top to the bottom of the pile. A third of the way up the pile is where the pile’s axial tension reaches its highest magnitude. This is a friction pile stress curve, which indicates that the bearing capacity of each pile is mainly provided by the lateral frictional resistance, thus allowing the upper load to be transferred to the bearing layer through the pile along the bearing stratum.
Figure 4b shows the axial stress distribution curves of the piles at different locations under a 41.0 kPa load. With the increase in load, the stress distribution curves of P1~P4 piles have a similar trend, and the stress change of the P5 pile is smaller due to the location of the pile deviating below the embankment. The maximum stress values of P1~P5 piles are 80.6 kPa, 73.9 kPa, 53.7 kPa, 34.3 kPa, and 15.7 kPa. The results show that the stress of the central pile is the largest, and the pile stress decreases slightly from the center to both sides, indicating that the geogrid and gravel cushion can transfer the upper load to the pile more uniformly, which reduces the stress of the central pile concentration phenomenon to a certain extent and makes the embankment’s stress more uniform, improving the bearing capacity of the GRPS embankment.

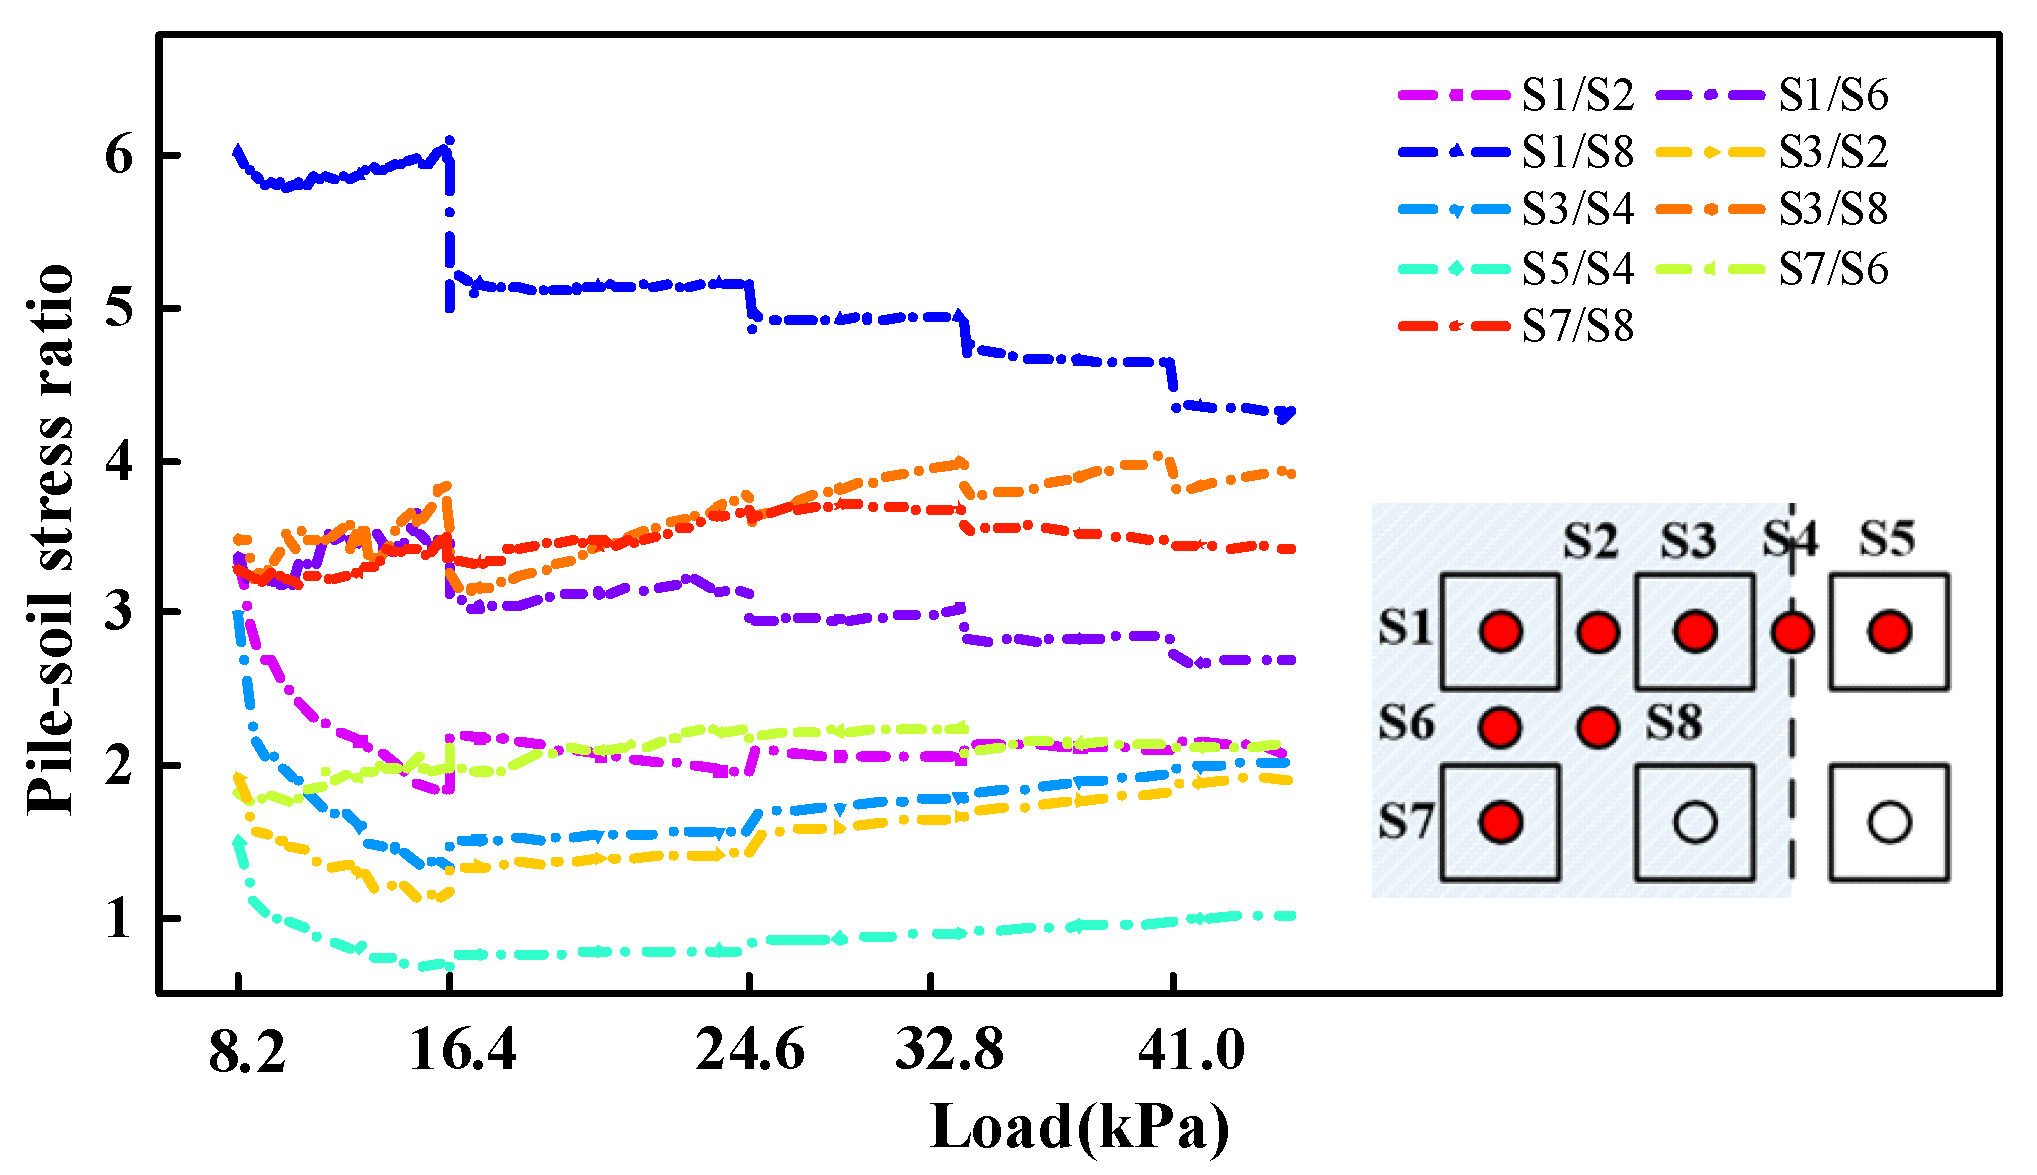
3.2. Pile–Soil Stress Ratio

The variation curve of the pile–soil stress ratio with load is shown in Figure 5. In the first stage load, the pile–soil stress ratios of S1/S2 and S1/S6 are about 3.5, and the pile–soil stress ratio of S1/S8 is 6.1. The difference in pile–soil stress ratio is 2.5, indicating that S8 is subjected to less stress in the soil compared to S2 and S6. This may be due to the fact that S8 is minimally constrained by the piles, and a spatial soil arching effect occurs, causing it to settle more, which in turn contributes less to the upper loads and reduces stress. On the other hand, S2 and S6 are constrained by the piles on both sides, and the plane soil arch effect is weakened. As the load increases to 41.0 kPa, the pile–soil stress ratios of S1/S2 and S1/S6 are approximately 2.2 and 2.8, and the pile–soil stress ratio of S1/S8 is about 4.6. The stress ratio difference between pile and soil is reduced to 1.5. With the increase in load, the effect of the plane soil arch and the space soil arch is weakened. The reason is that the soil on the top of the pile is compressed, the soil particles are wedged tightly with each other, and the soil arch is formed within a certain range. When the soil arch effect reaches its maximum, the load is still increasing, resulting in the range of the arch foot increasing. At the same time, the soil between piles is continuously compacted, and the load borne by it gradually increases; thus, the pile–soil stress ratio decreases.
As shown in Figure 5, the pile–soil stress ratio of S1/S2 in the transverse of the subgrade decreases from 3.5 with the increasing load and finally stabilizes at 2.1. The pile–soil stress ratio of S1/S6 in the longitudinal section of the subgrade slowly and continuously decreases from 3.5 to 2.7. The transverse pile–soil stress ratio is always smaller than the longitudinal pile–soil stress ratio, which indicates that the trapezoidal section distributes the upper loads to both sides of the embankment better. The pile–soil stress ratio for S5/S4 appears to be less than 1 due to the loading location, and S5 is less stressed due to the lack of direct-acting loading. Therefore, in the design of railway and highway foundations, zoning reinforcement of the GRPS embankment can be considered depending on the location and area of the upper loading.

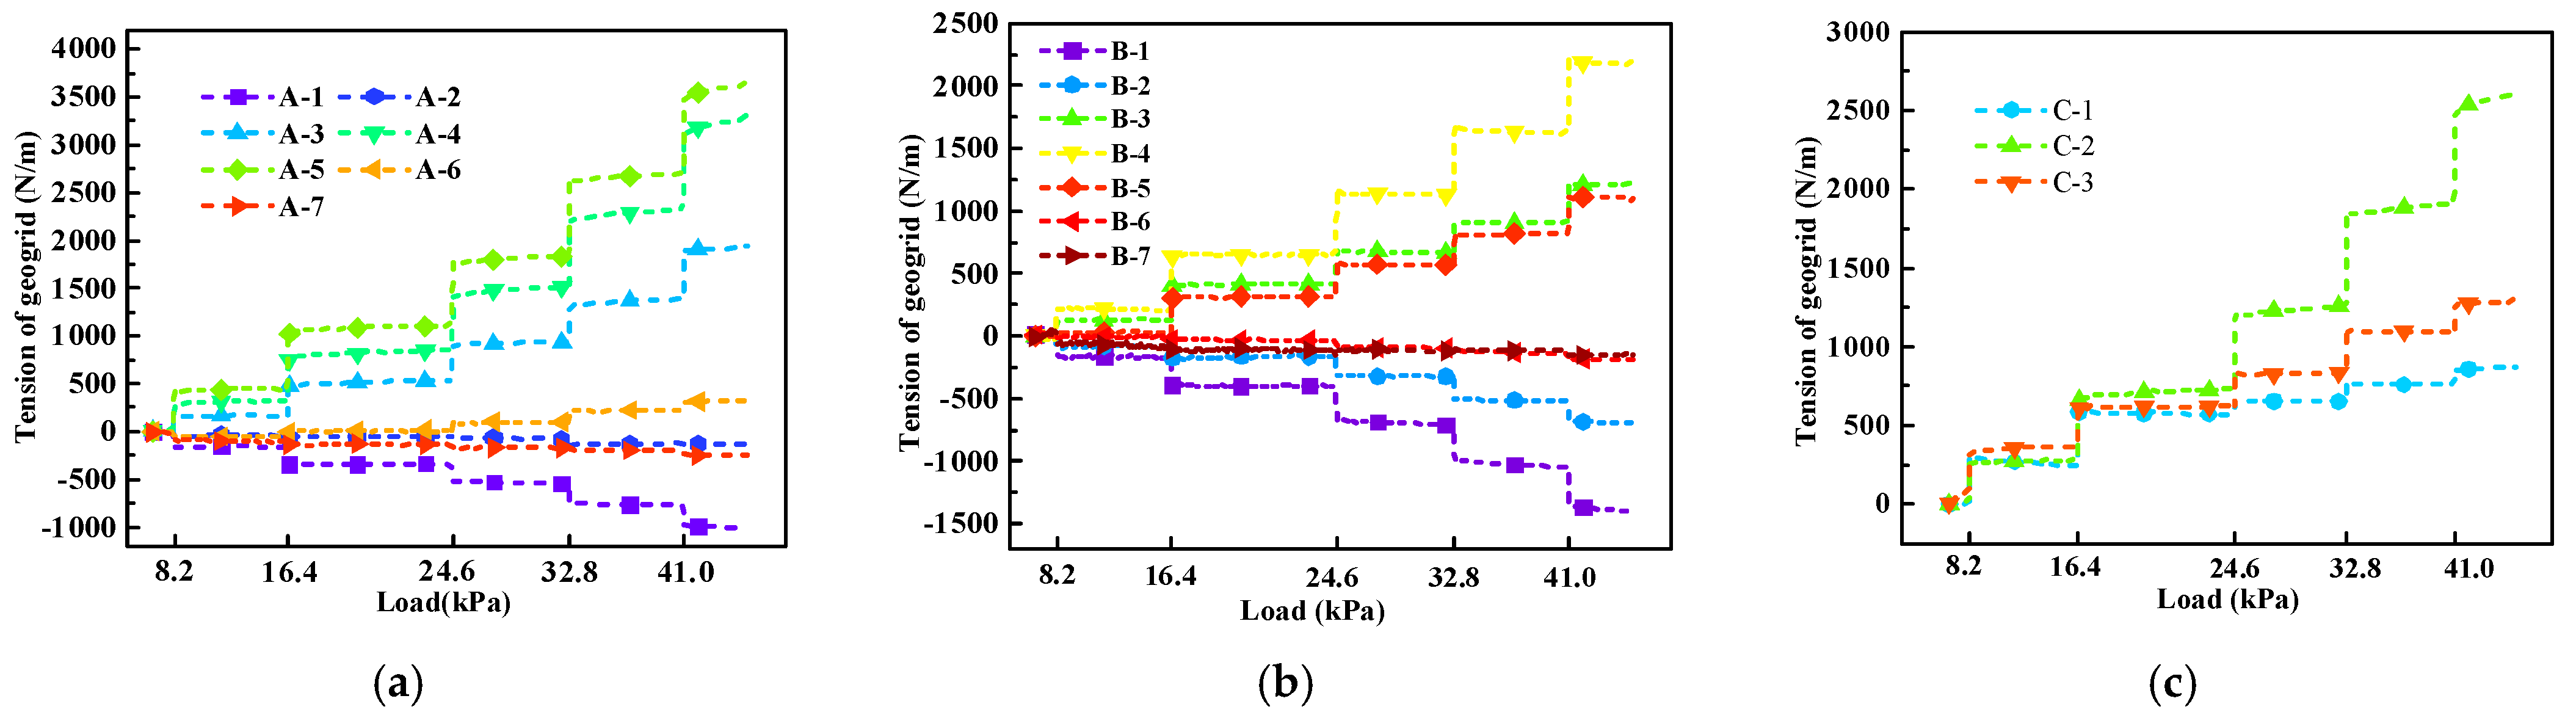
3.3. Tension Distribution of Geogrid

Figure 6 shows the tension distribution of geogrid, and the measurement points are presented in Figure 1c. As can be seen, the geogrid’s maximum tension in both the transverse and longitudinal directions is found in the loading area. The tension increases with distance from the load center and at all loading levels. The tension in the transverse direction is greater than the tension in the longitudinal direction. The tension in the center of the geogrid increases significantly with the increase in load. However, in the A-7 and B-7 curves at the edge of the subgrade, it is not obvious that the deformation of the geogrid spreads from the center to the surrounding area. The tension at the axis in two directions is the largest, and the growth rate of tension at the axis is also greater than other parts as the load increases.
The negative value in Figure 6 is due to the measurement point being located in the position of the soil between the piles. When the upper load is transmitted, the soil between the piles settles downward and the geogrid sinks downward, so the tension measurement point on the upper surface has a negative value. The geogrid above the pile cap has a positive strain value due to the upward protruding arch of the geogrid above the pile cap in response to the pile’s piercing action. It can be seen that the tension of the geogrid above the pile cap is generally greater than the soil between the piles, which indicates that the tension of the geogrid is related to the relative position of itself and the pile, and it also verifies the soil arch effect from the side. As the ground settles, the geogrid is stretched, and a portion of the geosynthetic’s strength is therefore mobilized. Consequently, the geogrid acts as a tensioned membrane, and the resulting hoop tension will reduce the net pressure on the ground. The tensioned membrane effect (Figure 7) of the GRPS embankment is also playing a role.

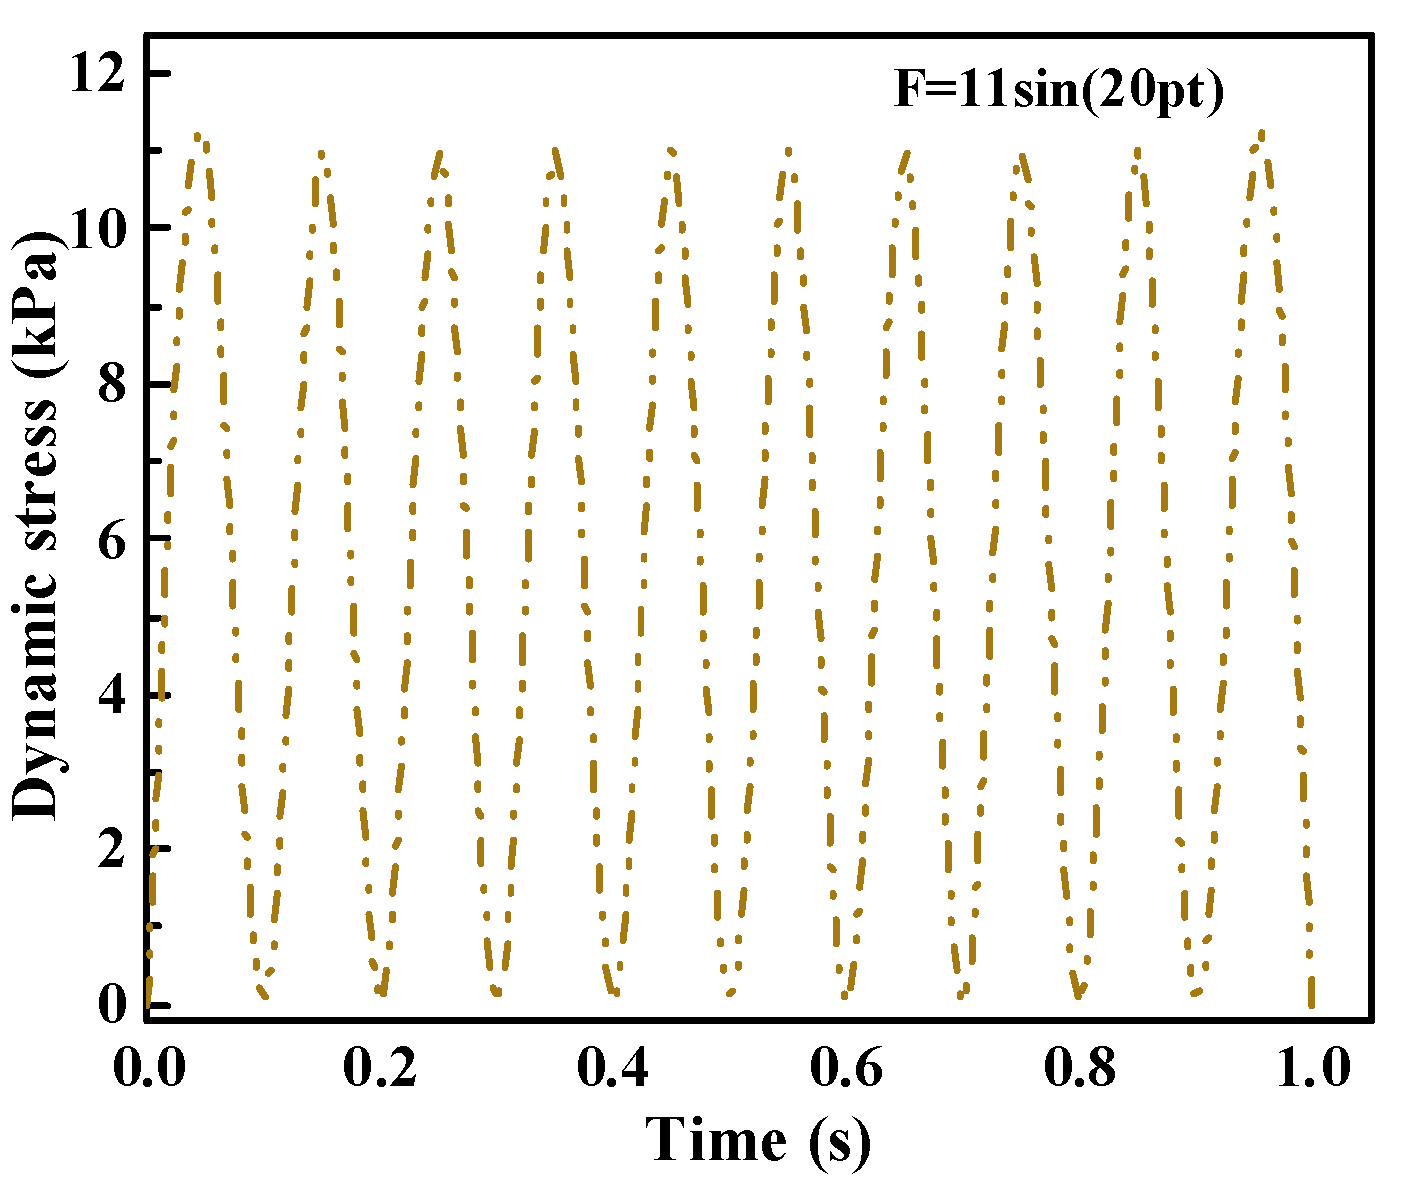
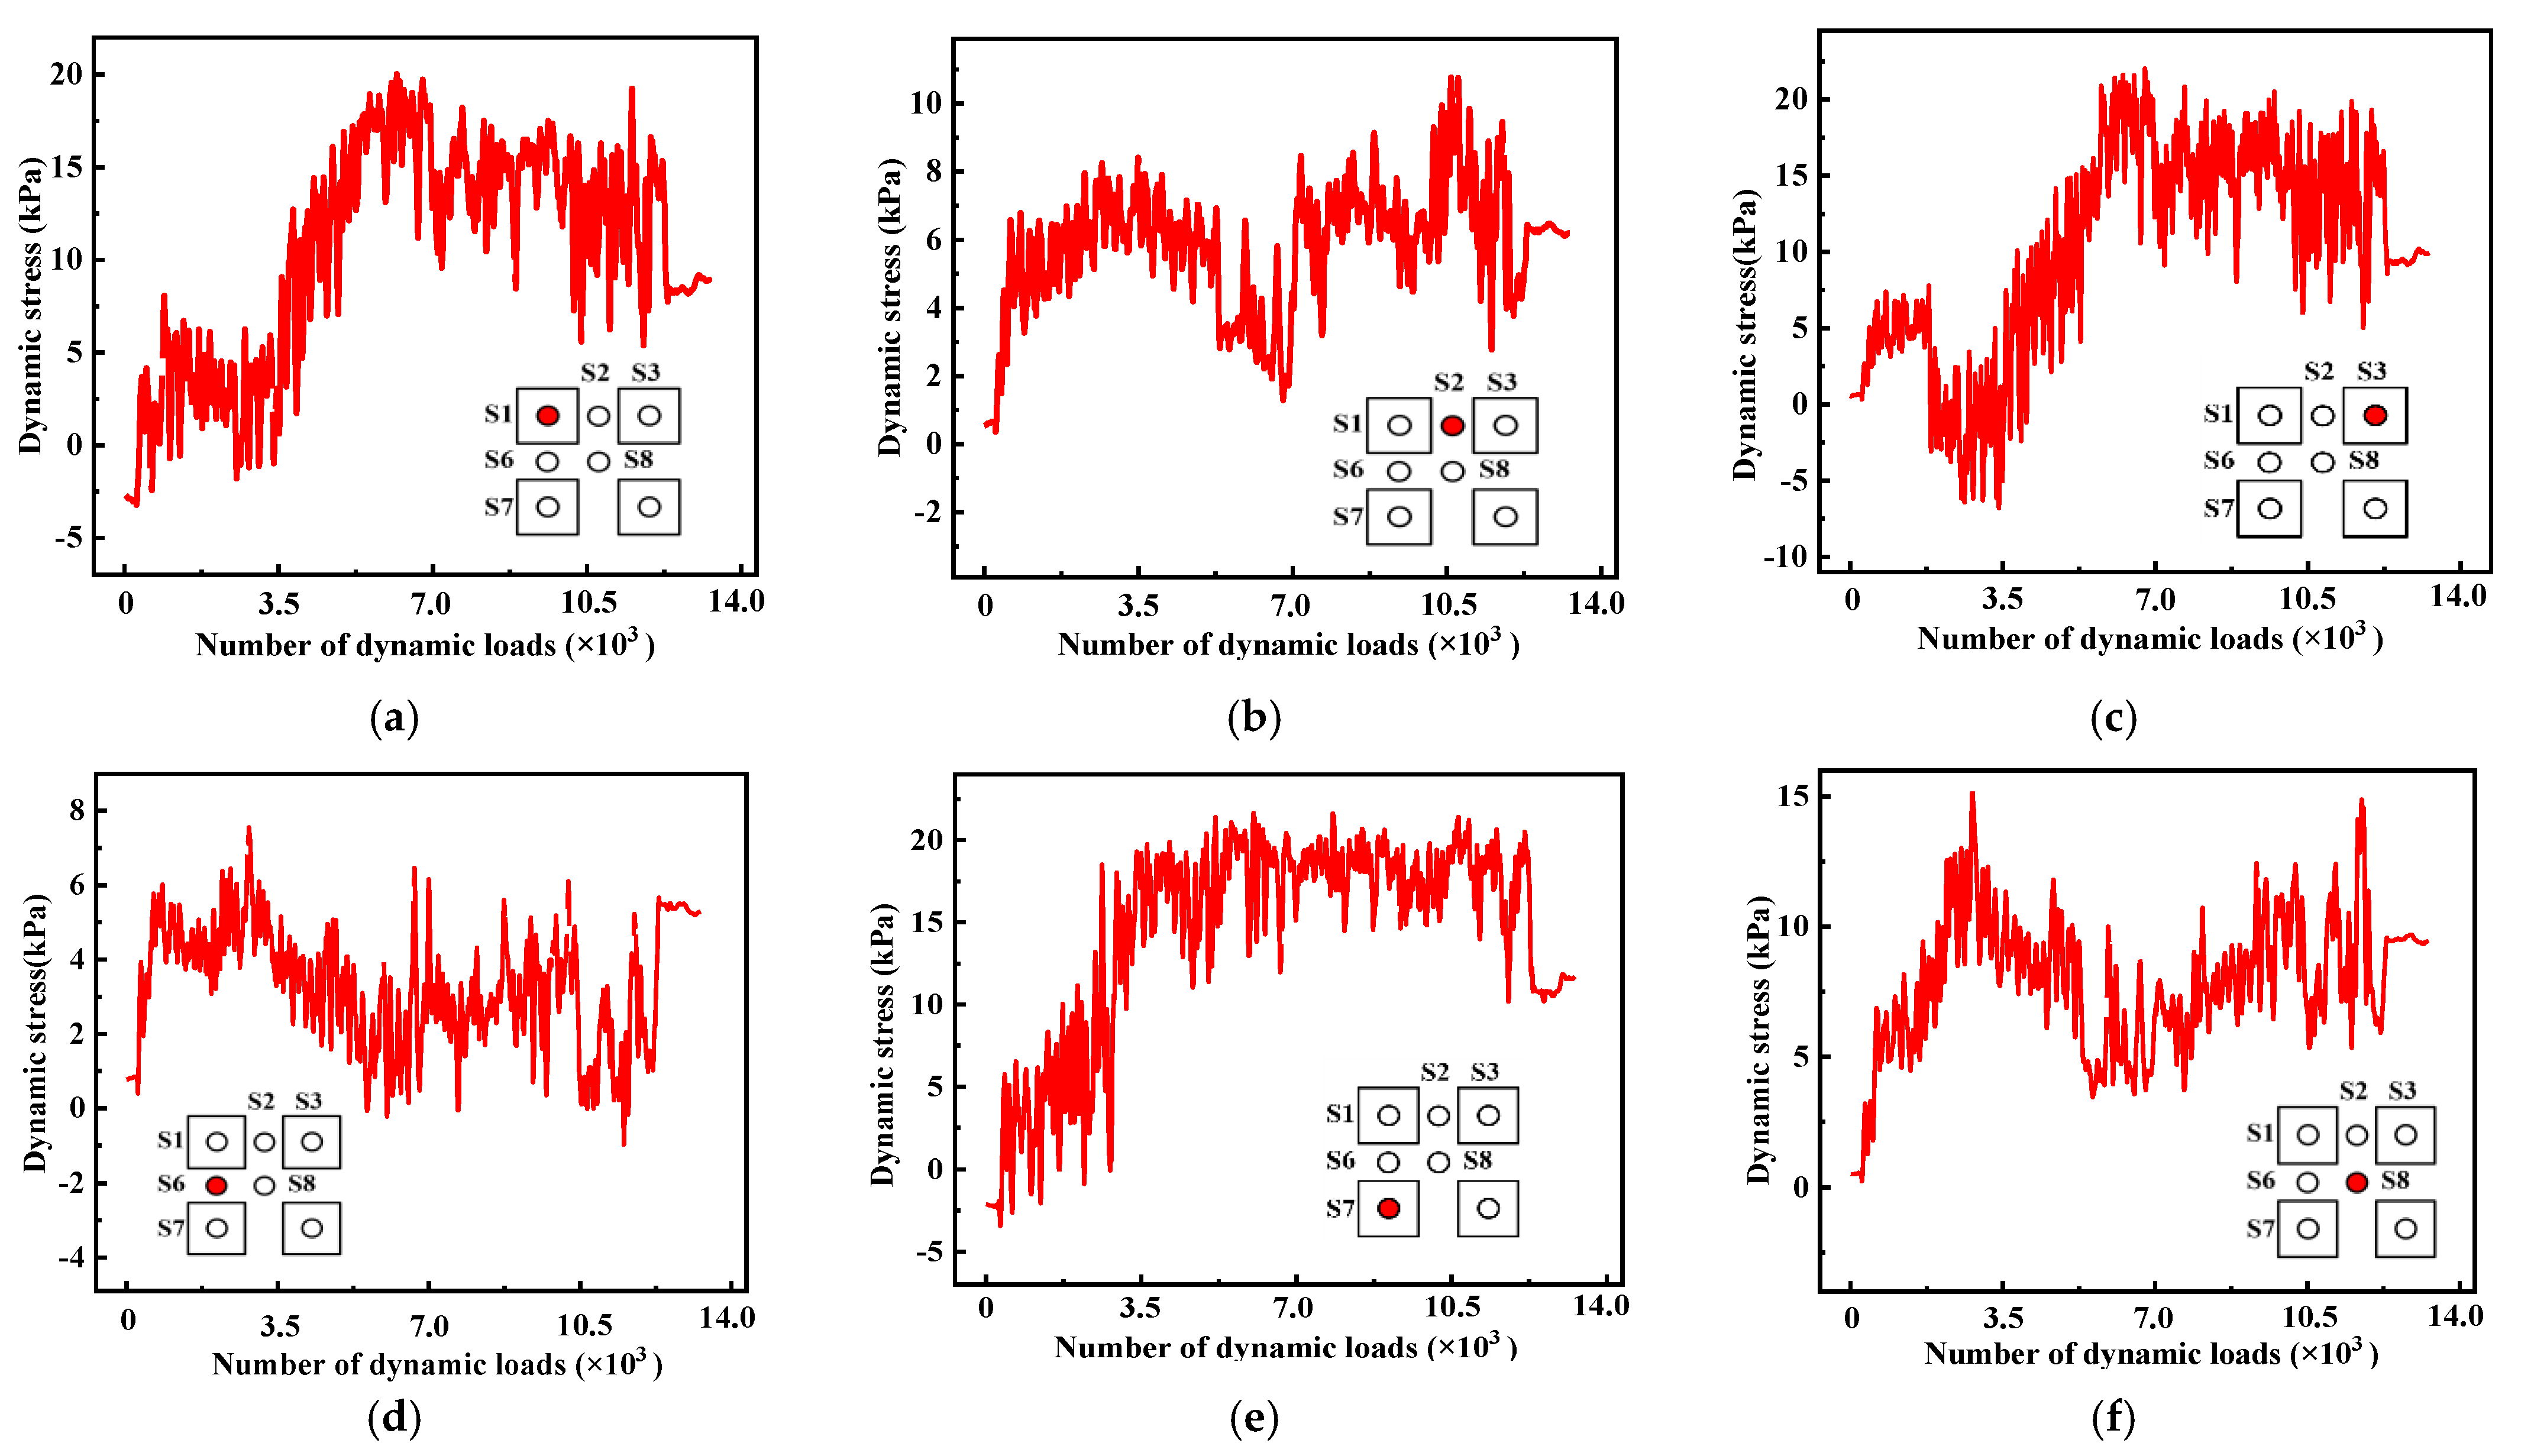
3.4. Dynamic Stress of Soil

The dynamic stress distribution of soil is shown in Figure 8. When the vibration reaches 10,000 times, the pile–soil stress ratios of S1/S2 and S1/S8 are about 2 and 1.8 under dynamic loading. When the static load is 41.0 kPa, the pile–soil stress ratios of S1/S2 and S1/S8 are about 2.5 and 5.8 under static loading. The pile–soil stress ratio under dynamic loading has some attenuation compared to static loading. Compared to the pile–soil stress ratio under static loading, the amplitude of the pile–soil stress ratio under dynamic loading does not change much. Where the pile soil stresses in S1/S8 are substantially reduced, i.e., the stronger the soil arch effect under static loading, the greater the weakening under dynamic loading.
The dynamic stress of soil decreases gradually from the center to both sides, and the attenuation trend of dynamic stress is smaller than that of static stress. In the longitudinal direction of the embankment, the dynamic stress amplitudes of S1 and S7 are similar, and the changing trend of stress with the increase in vibrations is also synchronized. At the initial stage of the dynamic load, the dynamic stress amplitude is about 5 kPa. When the vibration frequency increases to 7000 times, the dynamic stress reaches its peak value and stabilizes at about 20 kPa. The dynamic change trend of soil between piles with vibration times is similar to the “N” type, and the change trend at the top of piles is the opposite. The dynamic of pile-top soil increases slowly at the beginning and fluctuates steadily when it reaches a certain value. It can be seen that the development of the arch effect mainly occurs before the vibration reaches 7000 times. With the increase in vibration times, the soil at the top of the pile is gradually wedged to form the arch foot, and the dynamic stress gradually rises. When the number of vibrations is 3500~7000 times, the soil arch is formed slowly, the load on the top of the pile becomes bigger, and the soil arch effect starts to exert influence, so the dynamic stress of the soil between the piles starts to decrease. When the soil arch reaches a stable state after the vibration times reach 7000, the dynamic stress also fluctuates around a stable value. As shown in the dynamic stress trends of S6 and S8 in Figure 8d,f, the stronger the soil arching effect, the faster the soil dynamic stress decay. The soil arch reaches a stable state, and then as the vibration increases the overall sinking of the upper soil, the dynamic soil stress increases slowly because the soil between the piles is compressed again.

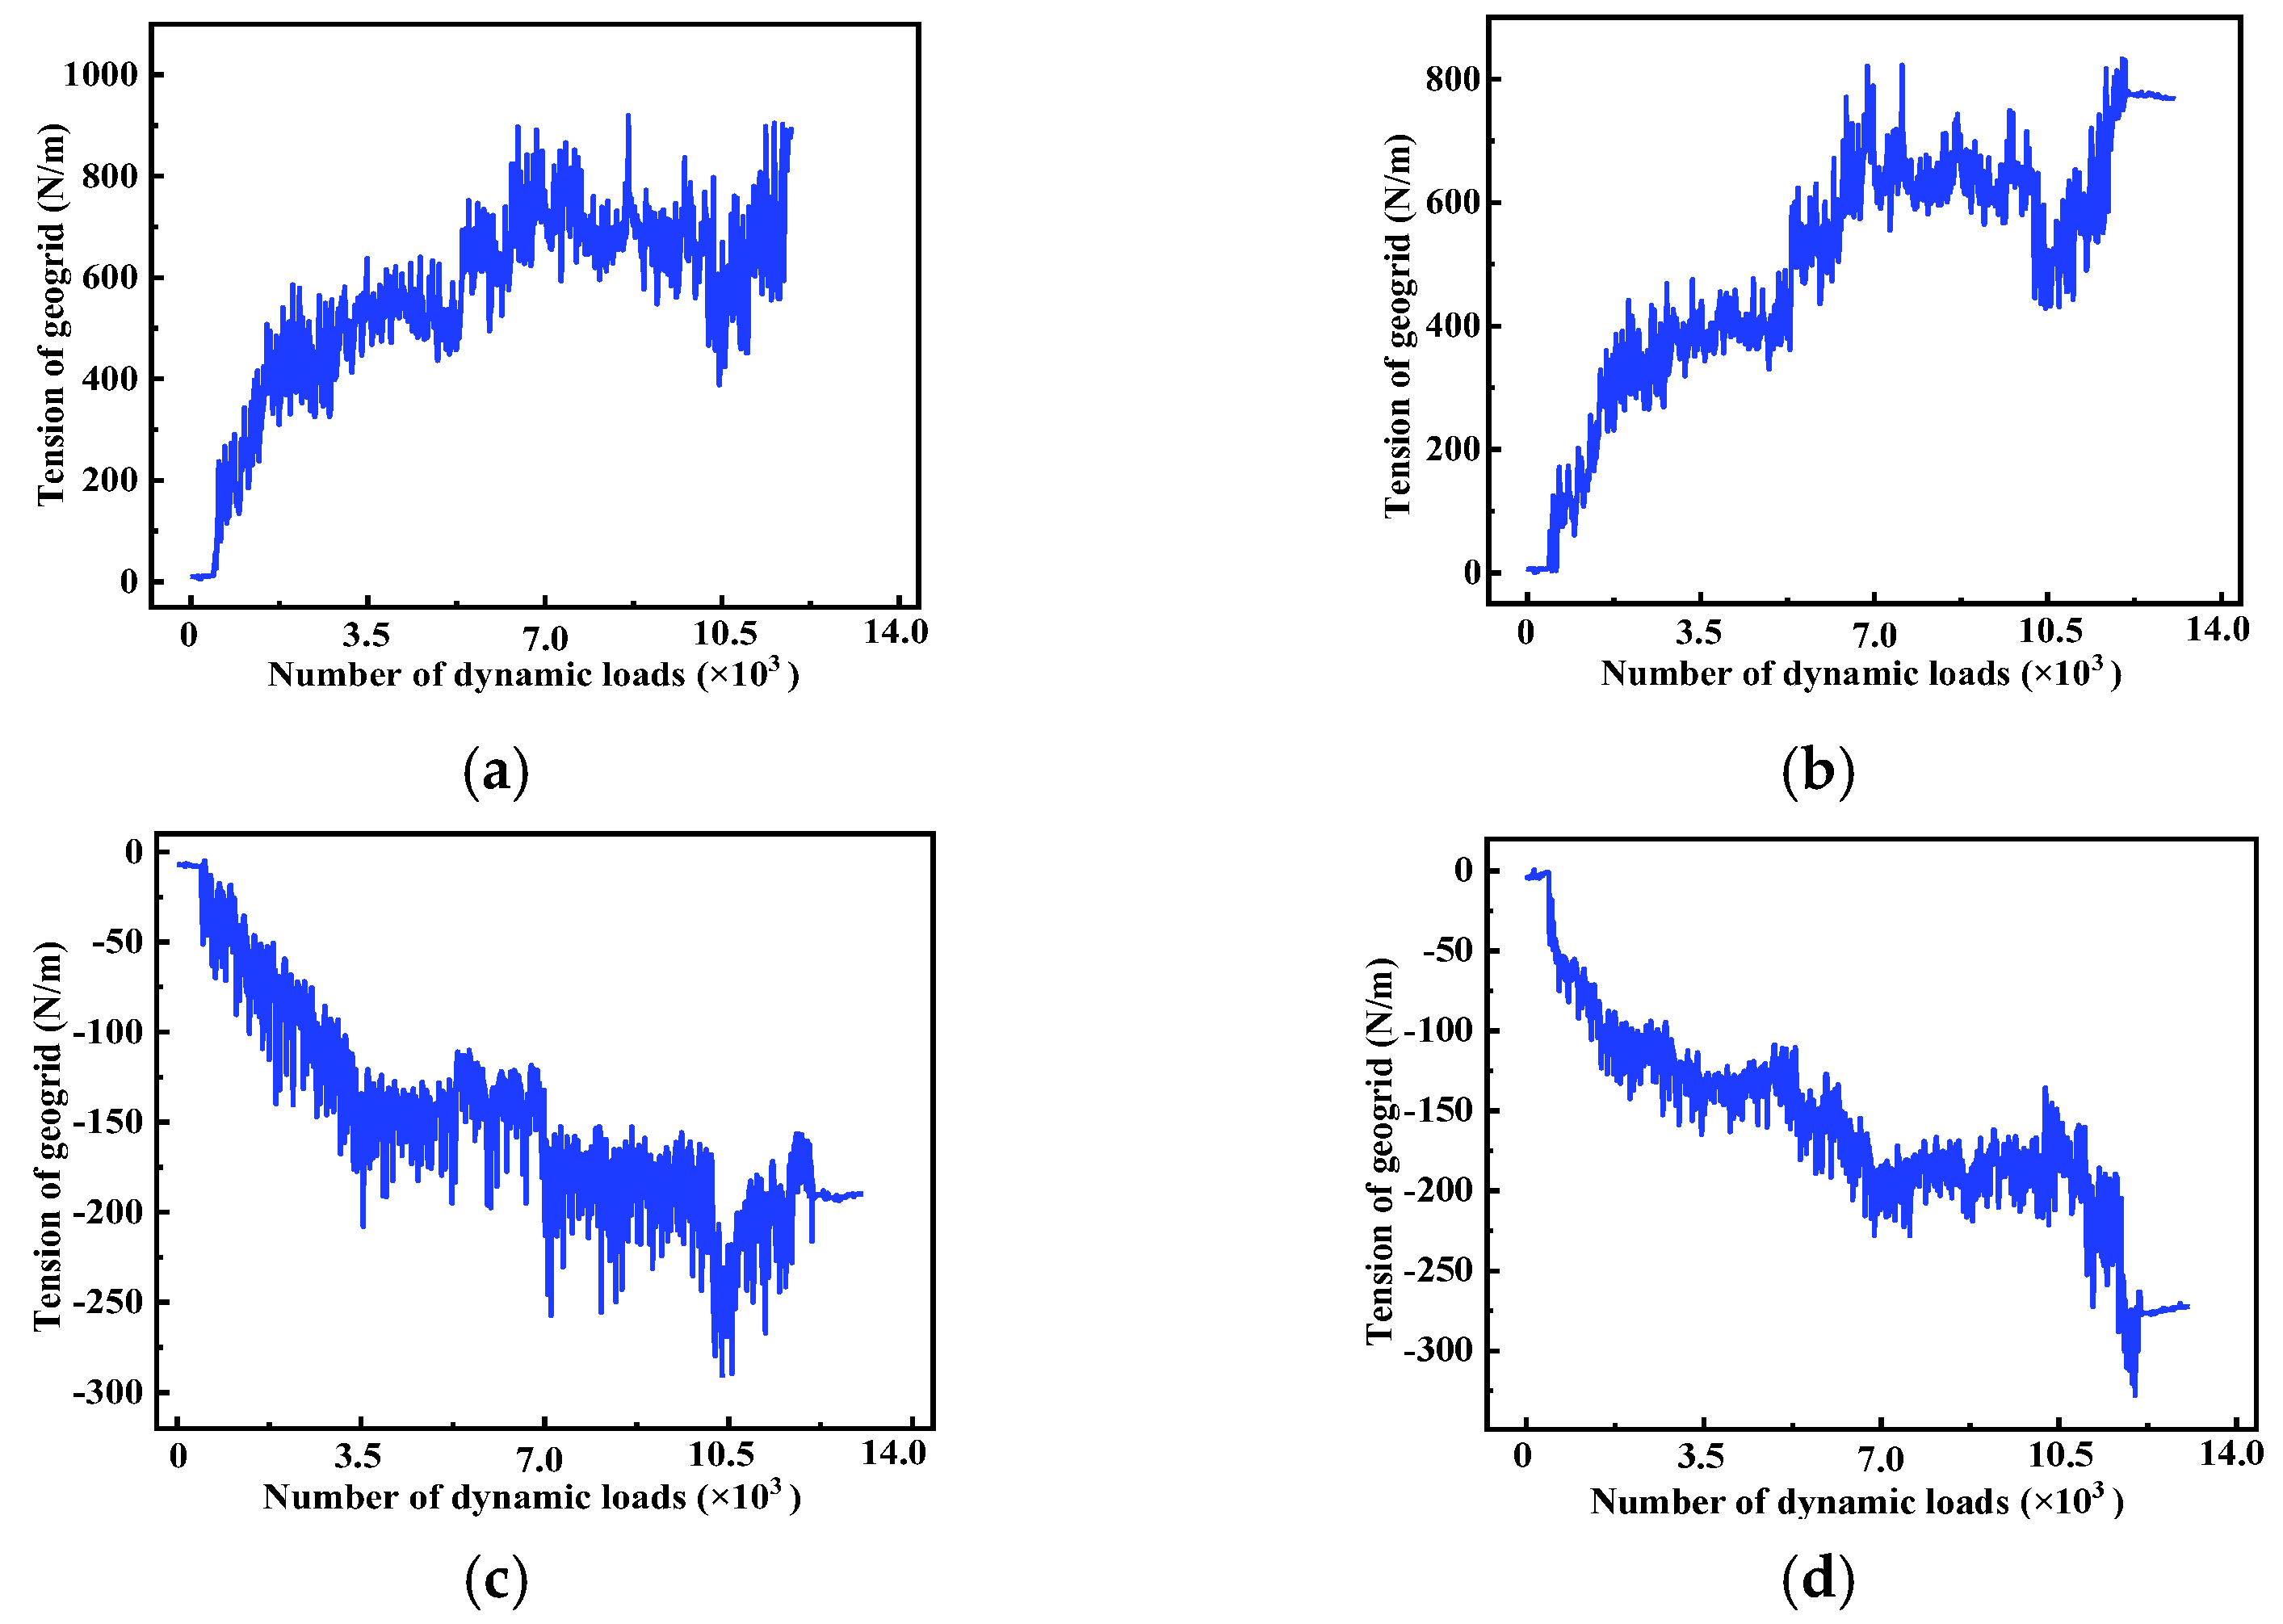
3.5. Tension of Geogrid under Dynamic Load

Figure 9 indicates the distribution characteristics of the geogrid’s tension under dynamic load. The tension of the geogrids A5 and A4 arranged at the top of the pile is positive; the tension of the geogrids A-1 and B-1 arranged in the middle of two piles and four piles is negative. The numerical difference of the geogrid under dynamic load is due to the stiffness difference between the pile and soil. The geogrid protruded upward at the top of the pile; the geogrid was stretched into a wavy deformation, and the tension of the geogrid reduced the pressure of the ground. The GFRP embankment under dynamic load is still affected by the tensioned membrane effect. The trend is similar to that of the geogrid under static load. At vibrations up to 1000 times, the tension of the geogrid ratio is about 2.6 for A5/A1. When the static load is 41.0 kPa, the tension of the geogrid ratio is about 3.6. There is a difference of 1 in the tension of the geogrid ratio under static and dynamic loads. The tensioned membrane effect is still effective for GRPS embankment under dynamic load, but its enhancement effect is not as obvious as that under static load.
As shown in Figure 9, with the increase in vibration times, the tension of the geogrid under dynamic load changes linearly. When the vibration number reaches 7000 times, the amplitude change trend of the geogrid is more obvious; after the vibration reaches 7000 times, the tension change of the geogrid is small and tends to be stable. This corresponds to the development of the soil arch effect. When the foundation forms a stable soil arch, the geogrid force changes quickly, and when the stable soil arch is formed, the geogrid tension tends to be stable.

4. Numerical Simulation

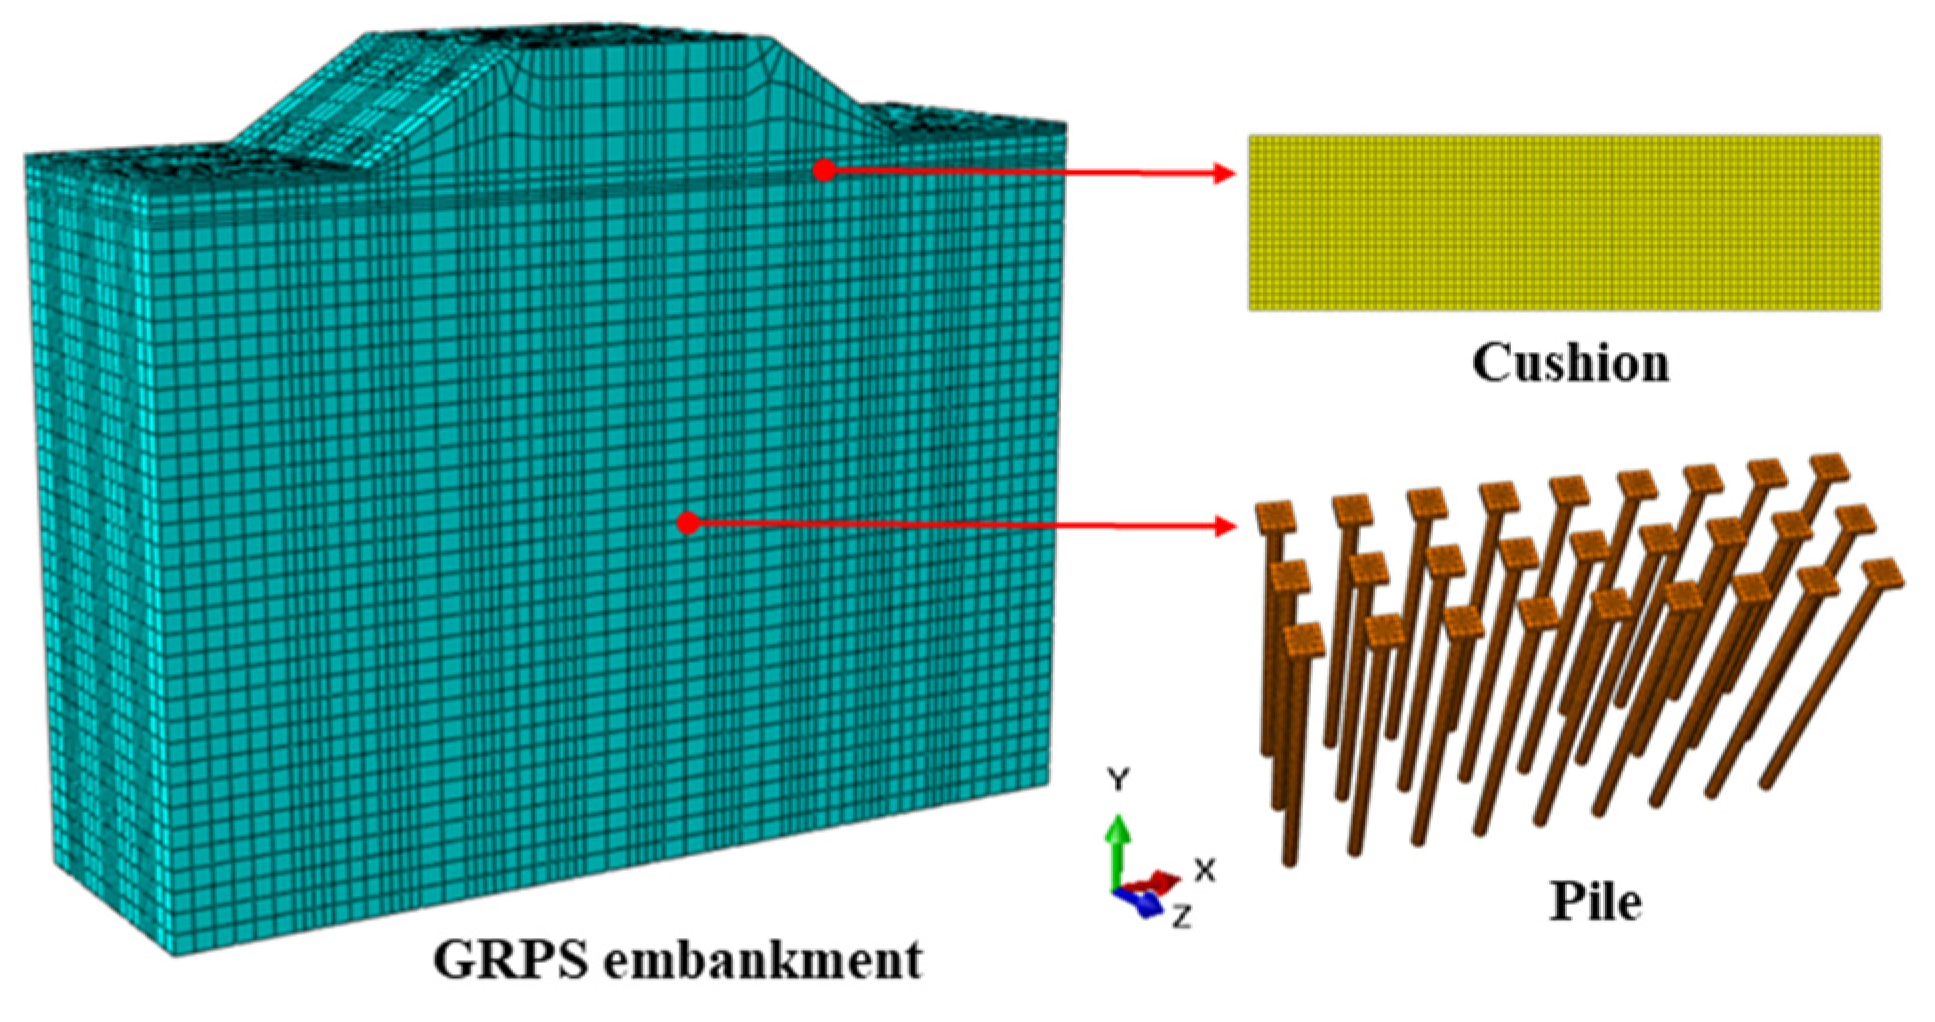
4.1. Numerical Model

To comprehensively assess the bearing characteristics of GRPS embankment under static and dynamic loads, the nonlinear finite element software ABAQUS 2020 is employed to develop a numerical model as depicted in Figure 10. The finite element models for the RACFCTs consist of soil, pile, pile cap, embankment, gravel cushion, and geogrid. In the model, 8-node brick elements (C3D8) are utilized to simulate the soil, pile, pile cap, embankment, and gravel cushion, respectively. Since geogrids are mainly subjected to tensile forces with negligible flexural and compressive properties and their thickness dimensions are much smaller than their flat dimensions, geogrids are modeled by a three-dimensional 4-node membrane element (M3D4). Additionally, to simulate the actual condition of the GRPS embankment, the boundary of the bottom surface was supposed to be restricted in the X, Y, and Z directions. The side boundaries and symmetry boundaries were fixed in the X and Y directions, respectively. When calculating the response of the GRPS embankment under dynamic loading, the infinite element boundary is used to reduce the influence of reflected stress waves from the artificial boundary on the simulation results.
The contact behavior of pile–soil, embankment–cushion, and cushion–soil contacts is simulated via interface elements, and the surface-to-surface contact algorithm for the interface is used. The geogrid is embedded in the gravel cushion using “Embedded region”. General contact is set between the pile and the soil; the tangential behavior of the contact surface is hard contact; and normal behavior is defined as penalty contact. The friction coefficient is taken as the tangent of the friction angle within the soil. The material parameters of the pile, soil, embankment, cushion, and geogrid used in the analysis are given in Table 2 and Table 3, all of which are based on tests. To simulate the loading of static loads, following the first step of in situ geostatic stress generation, a total of five levels of loads are applied step by step to the embankment. The finite element dynamic load is calculated using the same sinusoidal cyclic load as the test.
In the pile–soil cooperative work of the GRPS embankment, the soil is more likely to be destroyed than the pile and the geogrid. Therefore, isotropic linear elastic material is used to calculate the pile and the geogrid, and it is assumed that the pile will not be damaged during the loading process. The interaction between pile and soil is simulated by using the contact surface, and the friction coefficient is assumed to be constant during the simulation. The embankment, cushion, and soil are modeled using a linearly elastic-perfectly plastic model with the Mohr–Coulomb failure criterion, assuming that all soils are homogeneous. The yield function of the model criterion can be expressed as:
F = R m c q p tan φ c = 0
R m c = 1 3 cos φ sin ( θ + π 3 ) + 1 3 cos ( θ + π 3 ) tan φ
where q is the Mises equivalent stress; p is the equivalent pressure stress; φ is the friction angle; c is the cohesion of the material; and θ is the deviatoric polar angle.

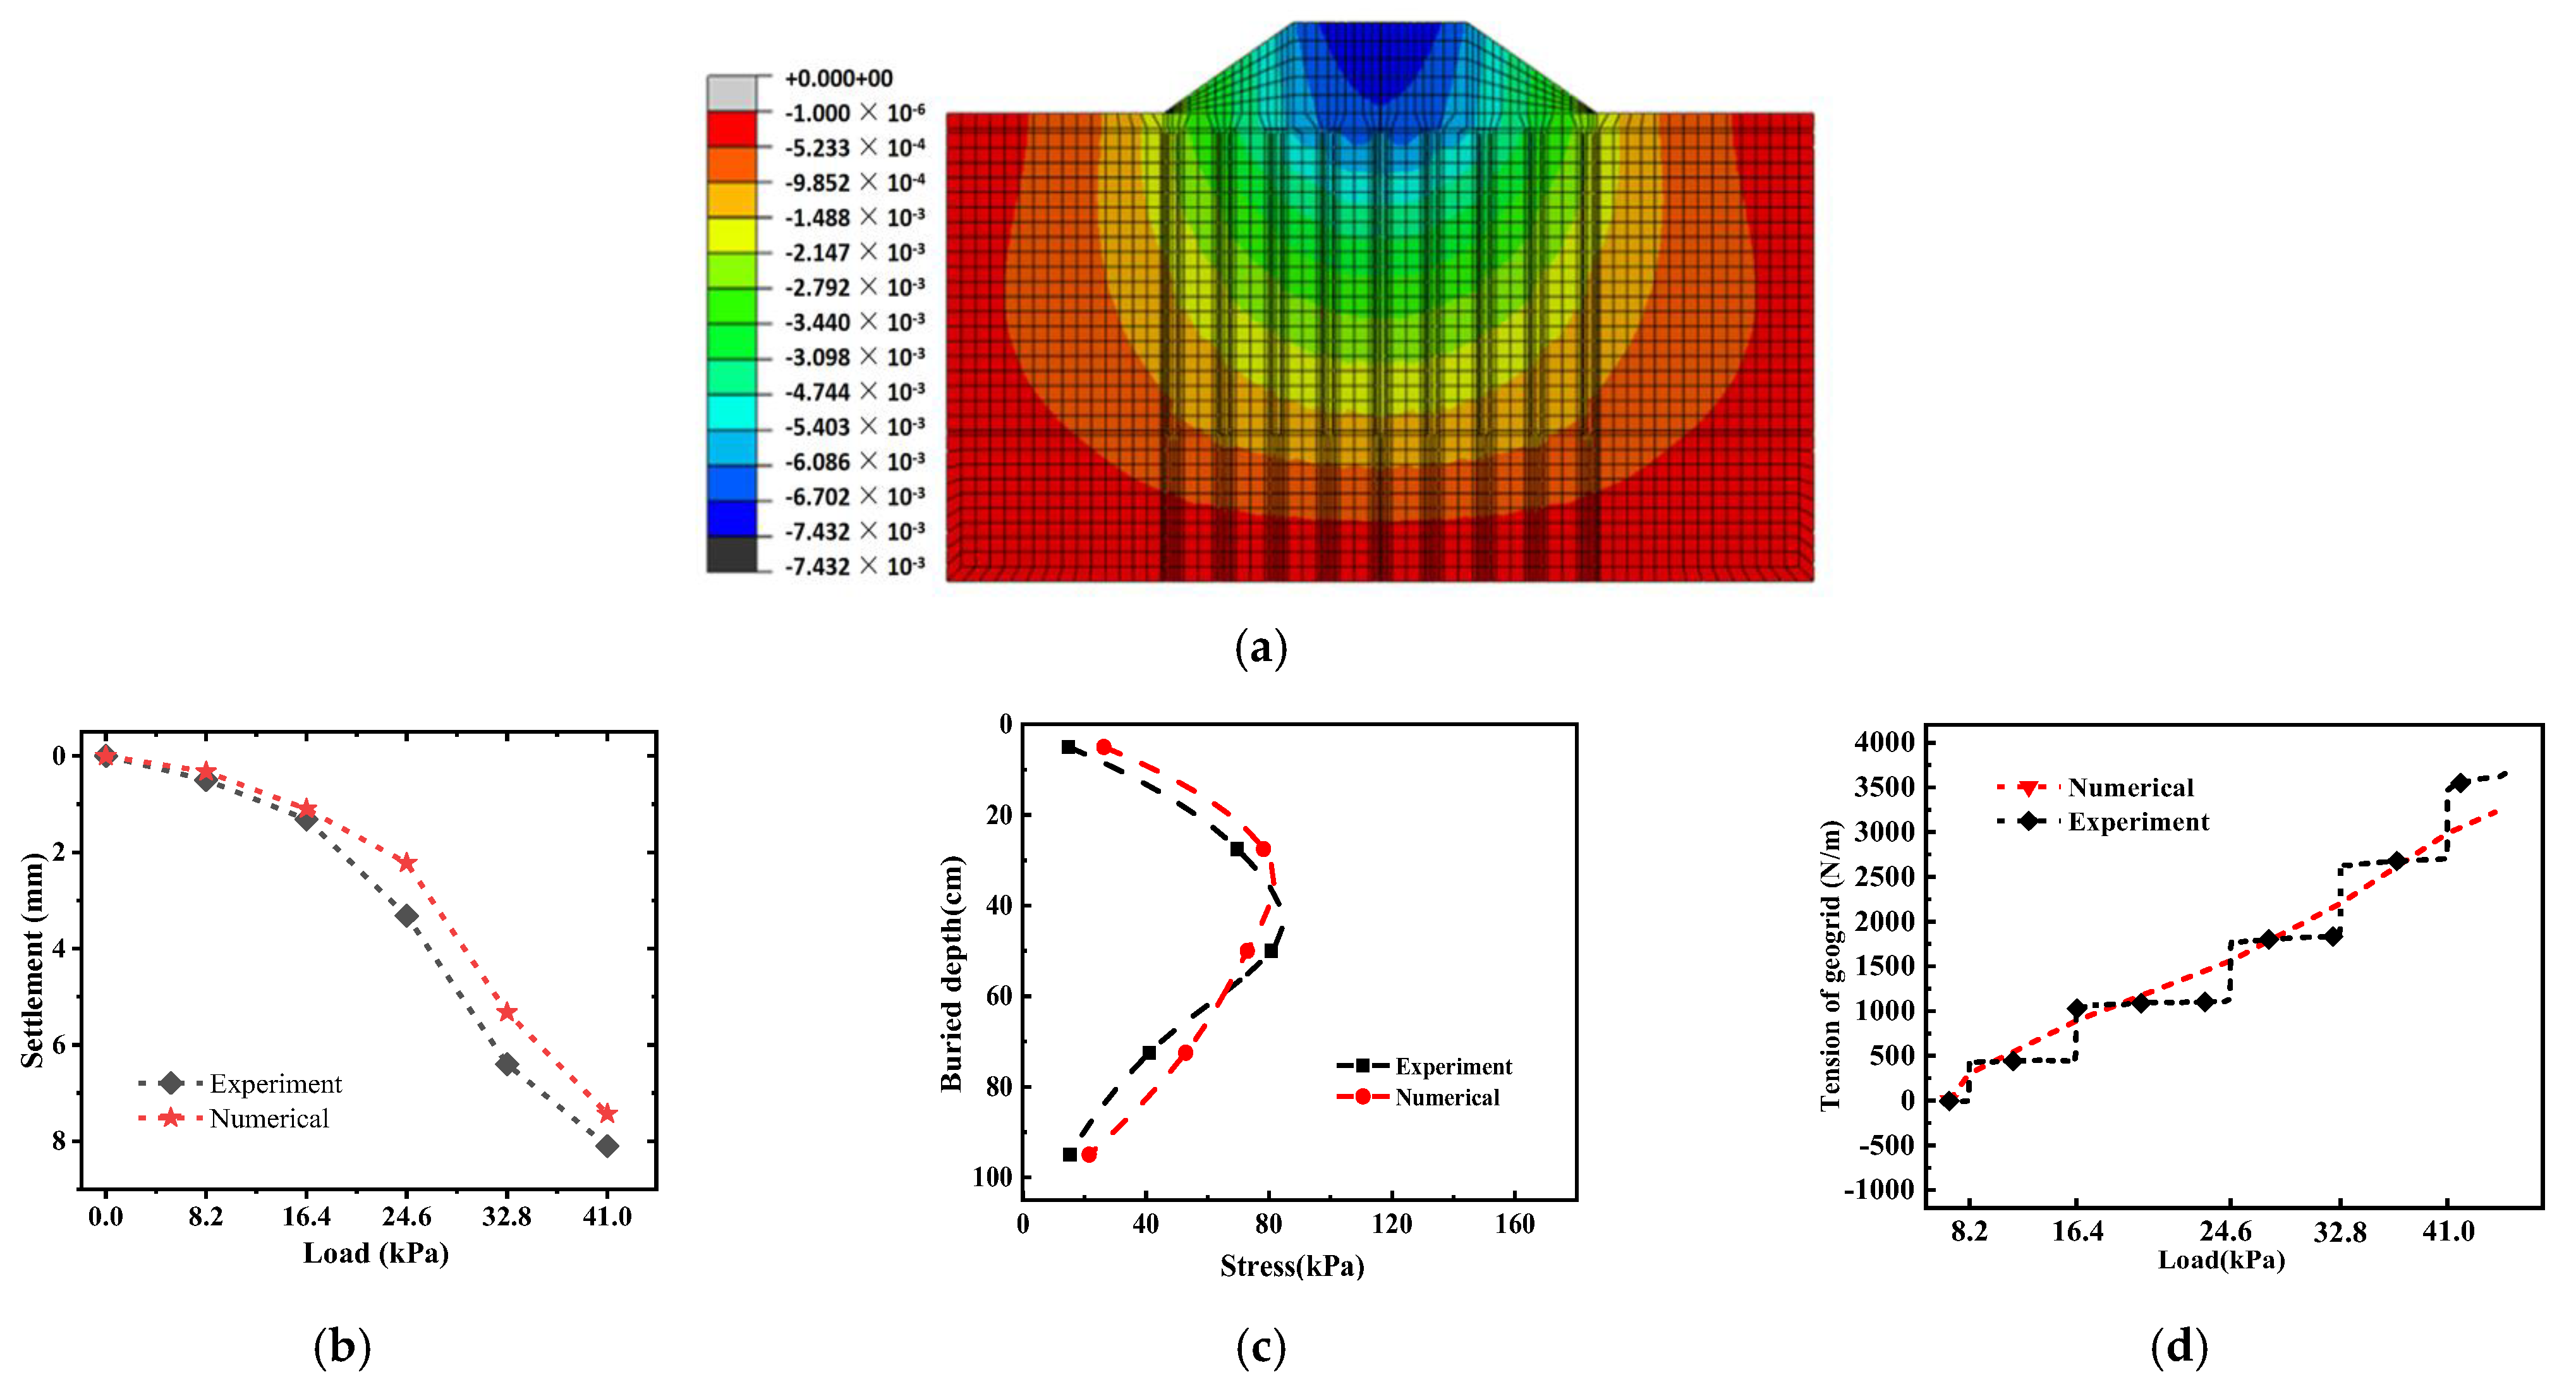
4.2. Settlement Analysis and Comparisons

To verify the correctness of the numerical analysis method, the settlement data from the model tests were multiplied by a similar factor, and the variation law of the load–settlement curve of the GRPS embankment was compared and analyzed as shown in Figure 11. It should be noted that the numerical simulation results of load–settlement under embankment loading are approximately the same as the trend obtained from the test; both show an increase with the increase in embankment load. The settlement of the model test is slightly higher than the numerical simulation results, and the maximum settlement of the model test and numerical simulation is 8.10 mm and 7.43 mm; the error of both is 8.14%, which shows that the numerical analysis model can reflect the actual situation more realistically. Figure 11a demonstrates that the soil deformation from the middle of the roadbed to the bottom in the dispersion gradually decreases, and the settlement at the foot of the embankment is much smaller than the surface settlement, which shows that the pulling film effect of the geogrid suppresses the deformation of the GRPS structure.

4.3. Parametric Study Results and Discussions

4.3.1. Effect of Embankment Height

To investigate the load transfer mechanism of the structure, GRPS embankments with embankment heights of 2 m, 3 m, 4 m, and 5 m were established, and the stress distribution curves obtained are shown in Figure 12. It can be seen that the stress at the top of the pile cap increases significantly with the increase in buried depth. As the load increases, the maximum stress of pile tops X1 and X3 is 181.7 kPa and 149.5 kPa, which is 409.68% and 319.35% larger than the maximum stress of 35.65 kPa of X2. The synergistic action of geogrid and gravel cushion makes the load transfer from the soil between piles to the top of piles, and pile bearing capacity is given full play.
As presented in Figure 12, the stress distribution of X1 gradually increases with the increase in embankment height. The slope of the stress curve of the embankment changes with the increase in height. When the embankment height is higher than 3 m, the slope increases significantly to about 1.5~2 m. At this point, the gap between the soil stress at the top of the pile and the soil stress between the piles increases rapidly, and the soil arch is formed. The reason for this is the differential settlement of the top plane of the pile cap when subjected to pressure from the upper loads. Because the soil at the top of the pile cap is blocked by the pile with greater stiffness, the settlement is much smaller than the soil between piles. As the load continues to pass down, the soil at the top of the pile is constantly squeezed at the pile cap, and the soil will develop into a soil arch when squeezed. The soil arch effect will be influenced by the GRPS embankment under different embankment heights, while the influence of the soil arch effect is limited, and the influence of the soil arch effect on soil stress is small in a certain height range.

4.3.2. Effects of Pile Spacing

To study the influence of pile spacing on the mechanical behavior of GRPS embankments, models with pile spacings of 1.6 m, 2 m, 2.5 m, and 3 m and embankment heights of 3 m were established, respectively. The numerically calculated stress distribution curves are depicted in Figure 13. As can be seen from the figure, the bifurcation point of the stress curve of X1/X2 continues to increase with the increase in pile spacing, the arch height also increases, and the influence range of the soil arch effect also expands. Because the arch foot is formed at the top of a pile, the distance between the arch foot and the pile increases. However, the rise-span ratio of stable soil arch structure shows little variation; that is, the arch height becomes higher when the arch foot spacing increases. A comparison of the magnitude of the vault stresses shows that the vault stresses are higher when the pile spacing is small and become smaller when the pile spacing increases. It can be seen that increasing the pile spacing increases the height of the arch and extends the range of influence of the arch effect, but the strength of the arch is weakened. On the contrary, when the pile spacing is small, the height of the arch will be reduced, but the arch structure will be more stable. The stress at the top of the pile is 240.2 kPa, 250.0 kPa, 219.4 kPa, and 216.5 kPa at pile spacings of 1.6 m, 2 m, 2.5 m, and 3 m, respectively. It is evident that when the pile spacing is small, the transfer of inter-pile stresses to the top of the pile is more noticeable, and the bearing performance of the pile can be effectively used.

4.3.3. Dynamic Stress Attenuation Coefficient

The attenuation coefficient of dynamic stress is the ratio of the maximum dynamic stress inside and on the surface of the embankment, and the detailed data are shown in Figure 14. The dynamic stress inside the embankment decreases continuously with the increase in buried depth, and the attenuation amplitude of X5 is the largest. The dynamic stress at the bottom of the embankment is about 0.2 times that at the top of the embankment. The slope of the attenuation coefficient curves of X2 and X4 in the soil between piles is similar, and the attenuation rate of X4 farther away from the middle line of the subgrade is faster than that of X2. Additionally, the dynamic stress attenuation coefficient curves of the soil at the top of the pile and the soil between the piles start separating at the top of the arch, whereas the dynamic stress attenuation coefficient of the soil at the top of the pile first decreases with an increase in burial depth before slowly rising. However, the influence of the soil arch effect is considerably weakened compared to the static loading.
The formation of the soil arch foot and arch ring requires the wedge between soil particles to keep the soil arch in a stable condition. And soil is a system composed of solid, liquid, and gas in multi-phase. The applied dynamic load makes soil particles loose and soil stability is reduced, which causes great interference to the formation of soil arch, so the soil arch effect will be weakened under dynamic load.

5. Conclusions

In this paper, the bearing mechanisms of the GRPS embankment in loess under static and dynamic loading were investigated through model tests and finite element analyses. On this basis, several conclusions are proposed, as follows:
(1)
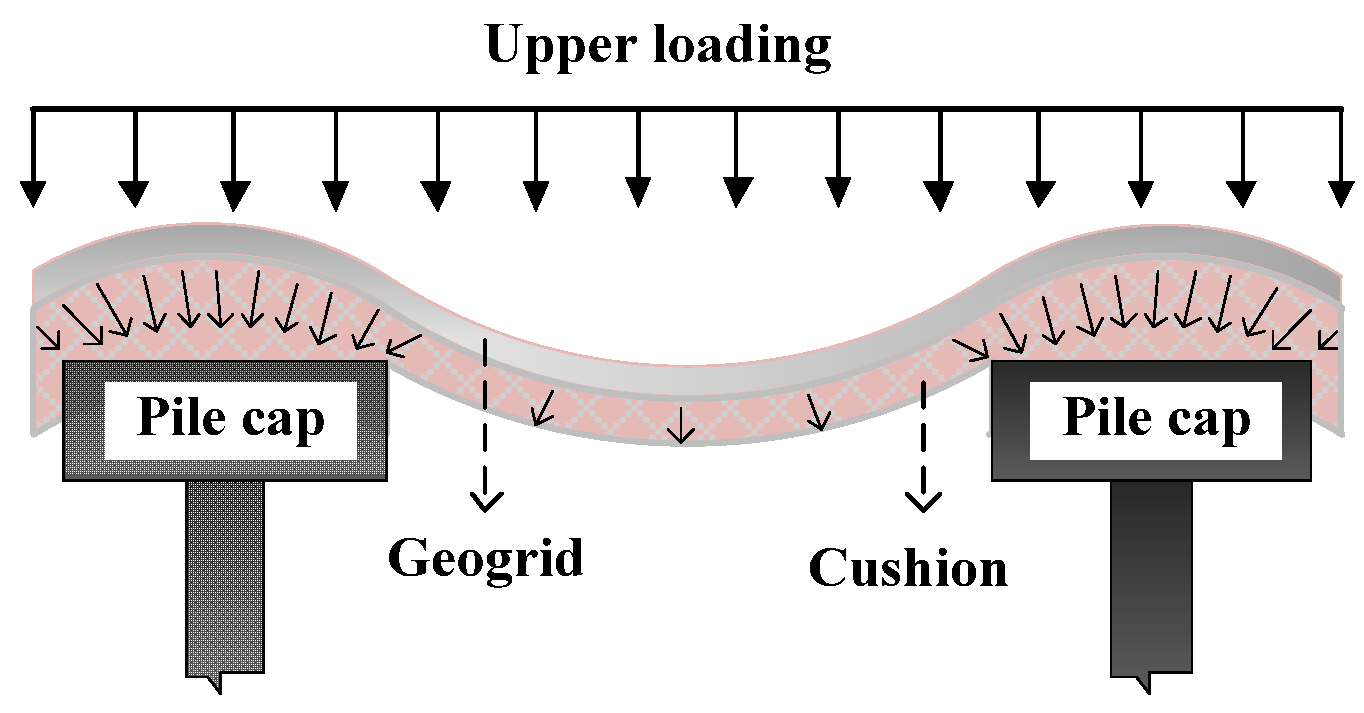
In this paper, the pile–soil stress ratio under dynamic loading is reduced by about 2.3 compared to that under static loading, and the stress in the soil around piles increases and the soil arch effect weakens under dynamic loading. The soil arch effect in the GRPS embankment is obvious under static load, and the space arch effect is stronger than the plane arch effect. Also, the stronger the soil arch effect under static loading, the more weakened it is under dynamic loading. The stronger the action of the static load–soil arch effect, the more weakened it is under dynamic loading. The dynamic change trend of soil between piles with vibration times is similar to that of the “N” type, but the change trend of soil on top of piles is opposite.
(2)
The GRPS embankment under dynamic loading is still affected by the tensile membrane effect. The strengthening effect of geogrid under dynamic load is not as obvious as under static load. Before forming a stable soil arch, the tension of the geogrid changes rapidly, and when the stable soil arch is formed, the change in geogrid tension tends to be stable.
(3)
The embankment height influences the soil arch, but the influence range of the soil arch is limited. The increase in pile spacing increases the height of the soil arch and extends the area influenced by the soil arch effect. However, the strength of the soil arch is weakened. On the contrary, when the pile spacing is small, the height of the soil arch will be reduced, but the soil arch structure formed is more stable. When the pile spacing is small, the bearing capacity of the pile can be more effectively utilized, and the transfer of soil stress between piles to the top of the pile is more obvious, which can better utilize the reinforcing effect of piles to improve the bearing capacity of the GRPS embankment.
Only the cyclic loading method is used to simulate the traffic load in this paper, and it is recommended to strengthen the monitoring of the data during the actual highway operation in the loess section and to use the same waveform as the actual traffic load as the dynamic loading method. Additionally, the commonly used M-C model is utilized to simulate the soil in this study, and further comparisons of the different material models are needed to compare the advantages, disadvantages, and applicability of the different material models. Combined with the research results of GRPS embankment under static and dynamic loading in this study, reasonable values of parameters such as the number of layers of geogrid, pile cap size, pile spacing, etc., are investigated to optimize the design of the GRPS embankment, taking into account the economic, technological, and environmental protection aspects.

Author Contributions

Conceptualization, Y.D.; methodology, H.Z.; software, H.Z.; validation, L.L. (Lingtao Li), L.L. (Long Li) and Z.Y.; formal analysis, H.Z. and L.L. (Lingtao Li); investigation, L.L. (Lingtao Li); resources, Y.D.; data curation, L.L. (Long Li); writing—original draft preparation, H.Z.; writing—review and editing, H.Z.; visualization, Z.Y.; supervision, Y.D.; project administration, Y.D.; funding acquisition, Y.D. and H.Z. All authors have read and agreed to the published version of the manuscript.

Funding

The authors gratefully acknowledge the support of the National Natural Science Foundation of China (Grant Nos. 51878554, 41672308) and the Key Projects of Shaanxi Natural Science Basic Research Program (No. 2018JZ5012).

Data Availability Statement

Data is contained within the article.

Conflicts of Interest

All authors of this article declare no conflict of interest.

References

  1. Esen, A.; Woodward, P.; Laghrouche, O.; Čebašek, T.; Brennan, A.; Robinson, S.; Connolly, D. Full-scale laboratory testing of a geosynthetically reinforced soil railway structure. Transp. Geotech. 2021, 28, 100526. [Google Scholar] [CrossRef]
  2. Alnmr, A.; Ray, R.P.; Alsirawan, R. Comparative analysis of helical piles and granular anchor piles for foundation stabilization in expansive soil: A 3D numerical study. Sustainability 2023, 15, 11975. [Google Scholar] [CrossRef]
  3. Alsirawan, R.; Alnmr, A.; Koch, E. Experimental and numerical investigation of geosynthetic-reinforced pile-supported embankments for loose sandy soils. Buildings 2023, 13, 2179. [Google Scholar] [CrossRef]
  4. Shahin, M.A. Some innovative solutions for dealing with problematic soils in infrastructure developments. In Proceedings of the World Congress on Civil, Structural, and Environmental Engineering 2016, Prague, Czech Republic, 30–31 March 2016. [Google Scholar]
  5. Alnmr, A.; Ray, R.P.; Alsirawan, R. A state-of-the-art review and numerical study of reinforced expansive soil with granular anchor piles and helical piles. Sustainability 2023, 15, 2802. [Google Scholar] [CrossRef]
  6. Mahmoudi-Mehrizi, M.E.; Ghanbari, A. A review of the Advancement of Helical Foundations from 1990–2020 and the barriers to their expansion in developing countries. J. Eng. Geol. 2021, 14, 37–84. [Google Scholar] [CrossRef]
  7. Pan, G.F.; Liu, X.F.; Yuan, S.Y.; Wang, Y.B.; Sun, D.X.; Jiang, G.R. Field test study on bearing characteristics of geogrid-reinforced and pile-supported embankment in over-consolidated expansive soil. J. China Railw. Soc. 2022, 44, 131–141. [Google Scholar]
  8. Pham, T.A.; Dias, D. Comparison and evaluation of analytical models for the design of geosynthetic-reinforced and pile-supported embankments. Geotext. Geomembr. 2021, 49, 528–549. [Google Scholar] [CrossRef]
  9. King, L.; King, D.; Bouazza, A.; Gniel, J.; Rowe, R.K. Design of geosynthetic reinforced column supported embankments using an interaction diagram. Geotext. Geomembr. 2021, 49, 159–165. [Google Scholar] [CrossRef]
  10. Zhang, L.; Zhao, M.H.; Hu, Y.X.; Zhao, H.; Chen, B.C. Semi-analytical solutions for geosynthetic-reinforced and pile-supported embankment. Comput. Geotech. 2012, 44, 167–175. [Google Scholar] [CrossRef]
  11. Liang, Z.L.; Wang, X.; Han, G.X. Analysis of Natural Arch Effect in Subgrade Supported byGeogrid-pile System under Train Dynamic Load Action. Railw. Eng. 2019, 59, 94–98. [Google Scholar]
  12. Zhang, X.; Yoo, C.; Chen, J.F.; Gu, Z.A. Numerical modeling of floating geosynthetic-encased stone column–supported embankments with basal reinforcement. Geotext. Geomembr. 2022, 50, 720–736. [Google Scholar] [CrossRef]
  13. Zhang, X.D.; Zhuang, Y.; Hu, S.L.; Dong, X.Q. A simplified method for assessing the serviceability performance of geosynthetic reinforced and pile-supported embankment. Geotext. Geomembr. 2022, 50, 1214–1229. [Google Scholar] [CrossRef]
  14. Pham, T.A. Analysis of geosynthetic-reinforced pile-supported embankment with soil-structure interaction models. Comput. Geotech. 2020, 121, 103438. [Google Scholar] [CrossRef]
  15. Rui, R.; Wan, Y.; Chen, C.; Zhang, Y.; Zhang, K. Experimental investigation on influences of geosynthetic reinforcement on deformation pattern and soil arching in piled embankments. China J. Highw. Transp. 2020, 33, 41–50. [Google Scholar]
  16. Pham, T.A.; Wijesuriya, K.; Dias, D. Analytical model for the design of piled embankments considering cohesive soils. Geosynth. Int. 2022, 29, 369–388. [Google Scholar] [CrossRef]
  17. Gang, W.; Xian, W.Z.; Xin, Y.L.; Hu, Q.W.; Lei, X.; Hao, L.; Long, F.P. Soil arching effect in reinforced piled embankment for motor-racing circuit: Field tests and numerical analysis. Transp. Geotech. 2022, 37, 100844. [Google Scholar]
  18. Rui, R.; Ye, Y.Q.; Han, J.; Zhai, Y.X.; Wan, Y.; Chen, C.; Zhang, L. Two-dimensional soil arching evolution in geosynthetic-reinforced pile-supported embankments over voids. Geotext. Geomembr. 2022, 50, 82–98. [Google Scholar] [CrossRef]
  19. Bao, N.; Wei, J.; Chen, J.; Wei, P. 2D and 3D discrete numerical modelling of soil arching. J. Zhejiang Univ.-Sci. A 2020, 21, 350–365. [Google Scholar] [CrossRef]
  20. Wei, J.; Wei, P.; Yang, S.L.; Zhang, D. Soil arching effect of low subgrade with pile-net structure under train load. J. Traffic Transp. Eng. 2015, 15, 35–44. [Google Scholar]
  21. Zhou, M.; Xing, L.; Chen, Y.; Qiao, H. Settlement characteristics of Split Grouting Pile Composite Foundation in Loess Areas. Adv. Civ. Eng. 2022, 2022, 8627124. [Google Scholar] [CrossRef]
  22. Deng, Y.S.; Li, L.; Sun, Y.N.; Yao, Z.G.; Meng, L.Q. Bearing capability of collapsible loess subgrade through cement-fly ash treatment. J. Traffic Transp. Eng. 2023, 23, 92–103. [Google Scholar]
  23. Chen, C.; Mao, F.; Zhang, G.; Huang, J.; Zornberg, J.G.; Liang, X.; Chen, J. Settlement-based cost optimization of geogrid-reinforced pile-supported foundation. Geosynth. Int. 2021, 28, 541–557. [Google Scholar] [CrossRef]
  24. Zhang, J.; Liu, S.W.; Pu, H.F. Evaluation of an improved technique for geosynthetic-reinforced and pile-supported embankment. Adv. Mater. Sci. Eng. 2015, 2015, 612760. [Google Scholar] [CrossRef]
  25. Shi, B.; Cheng, X.; Gong, L.; Liu, G. Selection design and parameter optimization of composite foundations in collapsible loess areas. Geotech. Geol. Eng. 2020, 38, 3175–3201. [Google Scholar] [CrossRef]
  26. Lü, X.; Quan, M.; Mu, L.; Hang, F. Model test of the long-term behavior of a pile-net structure subgrade for high-speed railways. J. Test. Eval. 2018, 46, 20170050. [Google Scholar] [CrossRef]
  27. Xue, S.; Chen, Y.; Liu, H. Model test study on the influence of train speed on the dynamic response of an X-section pile-net composite foundation. Shock Vib. 2019, 2019, 1–13. [Google Scholar] [CrossRef]
  28. Han, J.; Gabr, M.A. Numerical analysis of geosynthetic-reinforced and pile-supported earth platforms over soft soil. J. Geotech. Geoenviron. Eng. 2002, 128, 44–53. [Google Scholar] [CrossRef]
  29. Zhang, T.; Sheng, Z.C.; Lu, Z.R. 3D finite element simulation of the influence of reinforcements on load transfer behaviors of a piled embankment. J. Univ. Shanghai Sci. Technol. 2020, 42, 361–367. [Google Scholar]
  30. Pham, T.A.; Dias, D. 3D numerical study of the performance of geosynthetic-reinforced and pile-supported embankments. Soils Found. 2021, 61, 1319–1342. [Google Scholar] [CrossRef]
  31. National Railway Administration of the People’s Republic of China. TB 10621-2014; Code for Design of High Speed Railway. China Railway Publishing House: Beijing, China, 2015. [Google Scholar]
  32. Liu, J.H.; Zhao, M.H.; Yang, M.H. Model tests on bridge pile foundation in high and steep rock slopes. Chin. J. Geotech. Eng. 2009, 31, 372–377. [Google Scholar]
  33. Deng, Y.S.; Zhang, K.Q.; Yao, Z.G.; Zhao, H.L.; Li, L. Parametric analysis and multi-objective optimization of the coupling beam pile structure foundation. Ocean. Eng. 2023, 280, 114724. [Google Scholar] [CrossRef]
  34. Deng, Y.S.; Song, Q.; Zhang, K.Q.; Li, W.J.; Ma, E.L.; Wu, A.L. Model test study on vertical bearing capacity of single conical cap pile. J. Wuhan Univ. Sci. Technol. 2023, 46, 472–477. [Google Scholar]
  35. Highway Science Research Institute, Ministry of Transport. JTG 3430-2020; Highway Geotechnical Test Regulations. People’s Communications Press: Beijing, China, 2020. [Google Scholar]
  36. Floravante, V. On the shaft friction modeling of non-displacement piles in sand. Soils Found. 2002, 42, 23–33. [Google Scholar] [CrossRef] [PubMed]
  37. Han, G.X.; Gong, Q.M.; Zhou, S.H. Experimental study of soil arching effect in geogrid reinforced pile supported embankment under train dynamic load. Rock Soil Mech. 2014, 35, 1600–1606. [Google Scholar]
  38. Ding, X.M.; Qu, L.M.; Yang, J.C.; Wang, C.L. Experimental study on the pile group-soil vibration induced by railway traffic under the inclined bedrock condition. Acta Geotech. 2020, 15, 3613–3620. [Google Scholar] [CrossRef]
Figure 1. Schematic layout of the GRPS embankment; (a) Cross section. (b) Loading position and layout of the earth pressure cell. (c) Measurement points of the geogrid.
Applsci 13 13152 g001
Figure 2. Model test setup.
Applsci 13 13152 g002
Figure 3. Train simulation load diagram.
Applsci 13 13152 g003
Figure 4. Axial stress of pile; (a) P1. (b) The pile of P1~P5 under the 41.0 kPa load.
Applsci 13 13152 g004
Figure 5. Pile–soil stress ratio.
Applsci 13 13152 g005
Figure 6. Tension distribution of geogrid: (a) A-1~A-7; (b) B-1~B-7; (c) C-1~C-3.
Applsci 13 13152 g006
Figure 7. Tensioned membrane effect.
Applsci 13 13152 g007
Figure 8. Dynamic stress distribution of soil; (a) S1. (b) S2. (c) S3. (d) S6. (e) S7. (f) S8.
Applsci 13 13152 g008
Figure 9. Tension of geogrid under dynamic load; (a) A-5. (b) A-4. (c) A-1. (d) B-1.
Applsci 13 13152 g009
Figure 10. Numerical model of the GRPS embankment.
Applsci 13 13152 g010
Figure 11. Comparisons between testing and numerical results; (a) Displacement obtained from numerical simulation. (b) Load-settlement curve. (c) Axial stress of P1 under 41 kPa. (d) Tension distribution of the geogrid.
Applsci 13 13152 g011
Figure 12. Stress distribution of GRPS embankment at different embankment heights; (a) The height of the embankment is 2 m. (b) The height of the embankment is 3 m. (c) The height of the embankment is 4 m. (d) The height of the embankment is 5 m.
Applsci 13 13152 g012aApplsci 13 13152 g012b
Figure 13. Stress distribution of GRPS embankment at different pile spacings; (a) The pile spacing of the embankment is 1.6 m. (b) The pile spacing of the embankment is 2 m. (c) The pile spacing of the embankment is 2.5 m. (d) The pile spacing of the embankment is 3 m.
Applsci 13 13152 g013aApplsci 13 13152 g013b
Figure 14. Attenuation coefficient of dynamic stress in embankment.
Applsci 13 13152 g014
Table 1. Parametric similarity relation.
TypePhysical QuantitySimilarity Coefficient
Similarity ratioLength C l = 10
Elasticity modulus C E = 1
Density C β = 1
Unit weight C γ = 1
Poisson ratio C μ = 1
Strain C ε = 1
Stress C σ = C E C ε = 1
Displacement C δ = C l C ε = 10
Table 2. Information on soil properties.
NameUnit Weight (kN/m3)Internal Friction Angle (°)Cohesive Forces (kPa)Moisture Content (%)Poisson RatioElasticity Modulus (MPa)
Loess19.428.2437.817.60.327.99
Cushion25.04038.516.30.1465
Embankment22.04036.215.50.1738
Pile22---0.331 × 10⁴
Table 3. Geogrid properties.
ParametersUnitValues
Mesh sizemm30
Longitudinal tensile strengthkN/m30
Poisson ratio-0.39
Elasticity modulusGPa2.32
Transverse tensile strengthkN/m30
Longitudinal tensile strength at 2% strainkN/m10.5
Transverse tensile strength at 2% strainkN/m10.5
Longitudinal yield elongation% 13
Transverse yield elongation% 16
Disclaimer/Publisher’s Note: The statements, opinions and data contained in all publications are solely those of the individual author(s) and contributor(s) and not of MDPI and/or the editor(s). MDPI and/or the editor(s) disclaim responsibility for any injury to people or property resulting from any ideas, methods, instructions or products referred to in the content.

