
Quantitative Investigation of Containment Liner Plate Thinning with Combined Thermal Wave Signal and Image Processing in Thermography Testing


Abstract
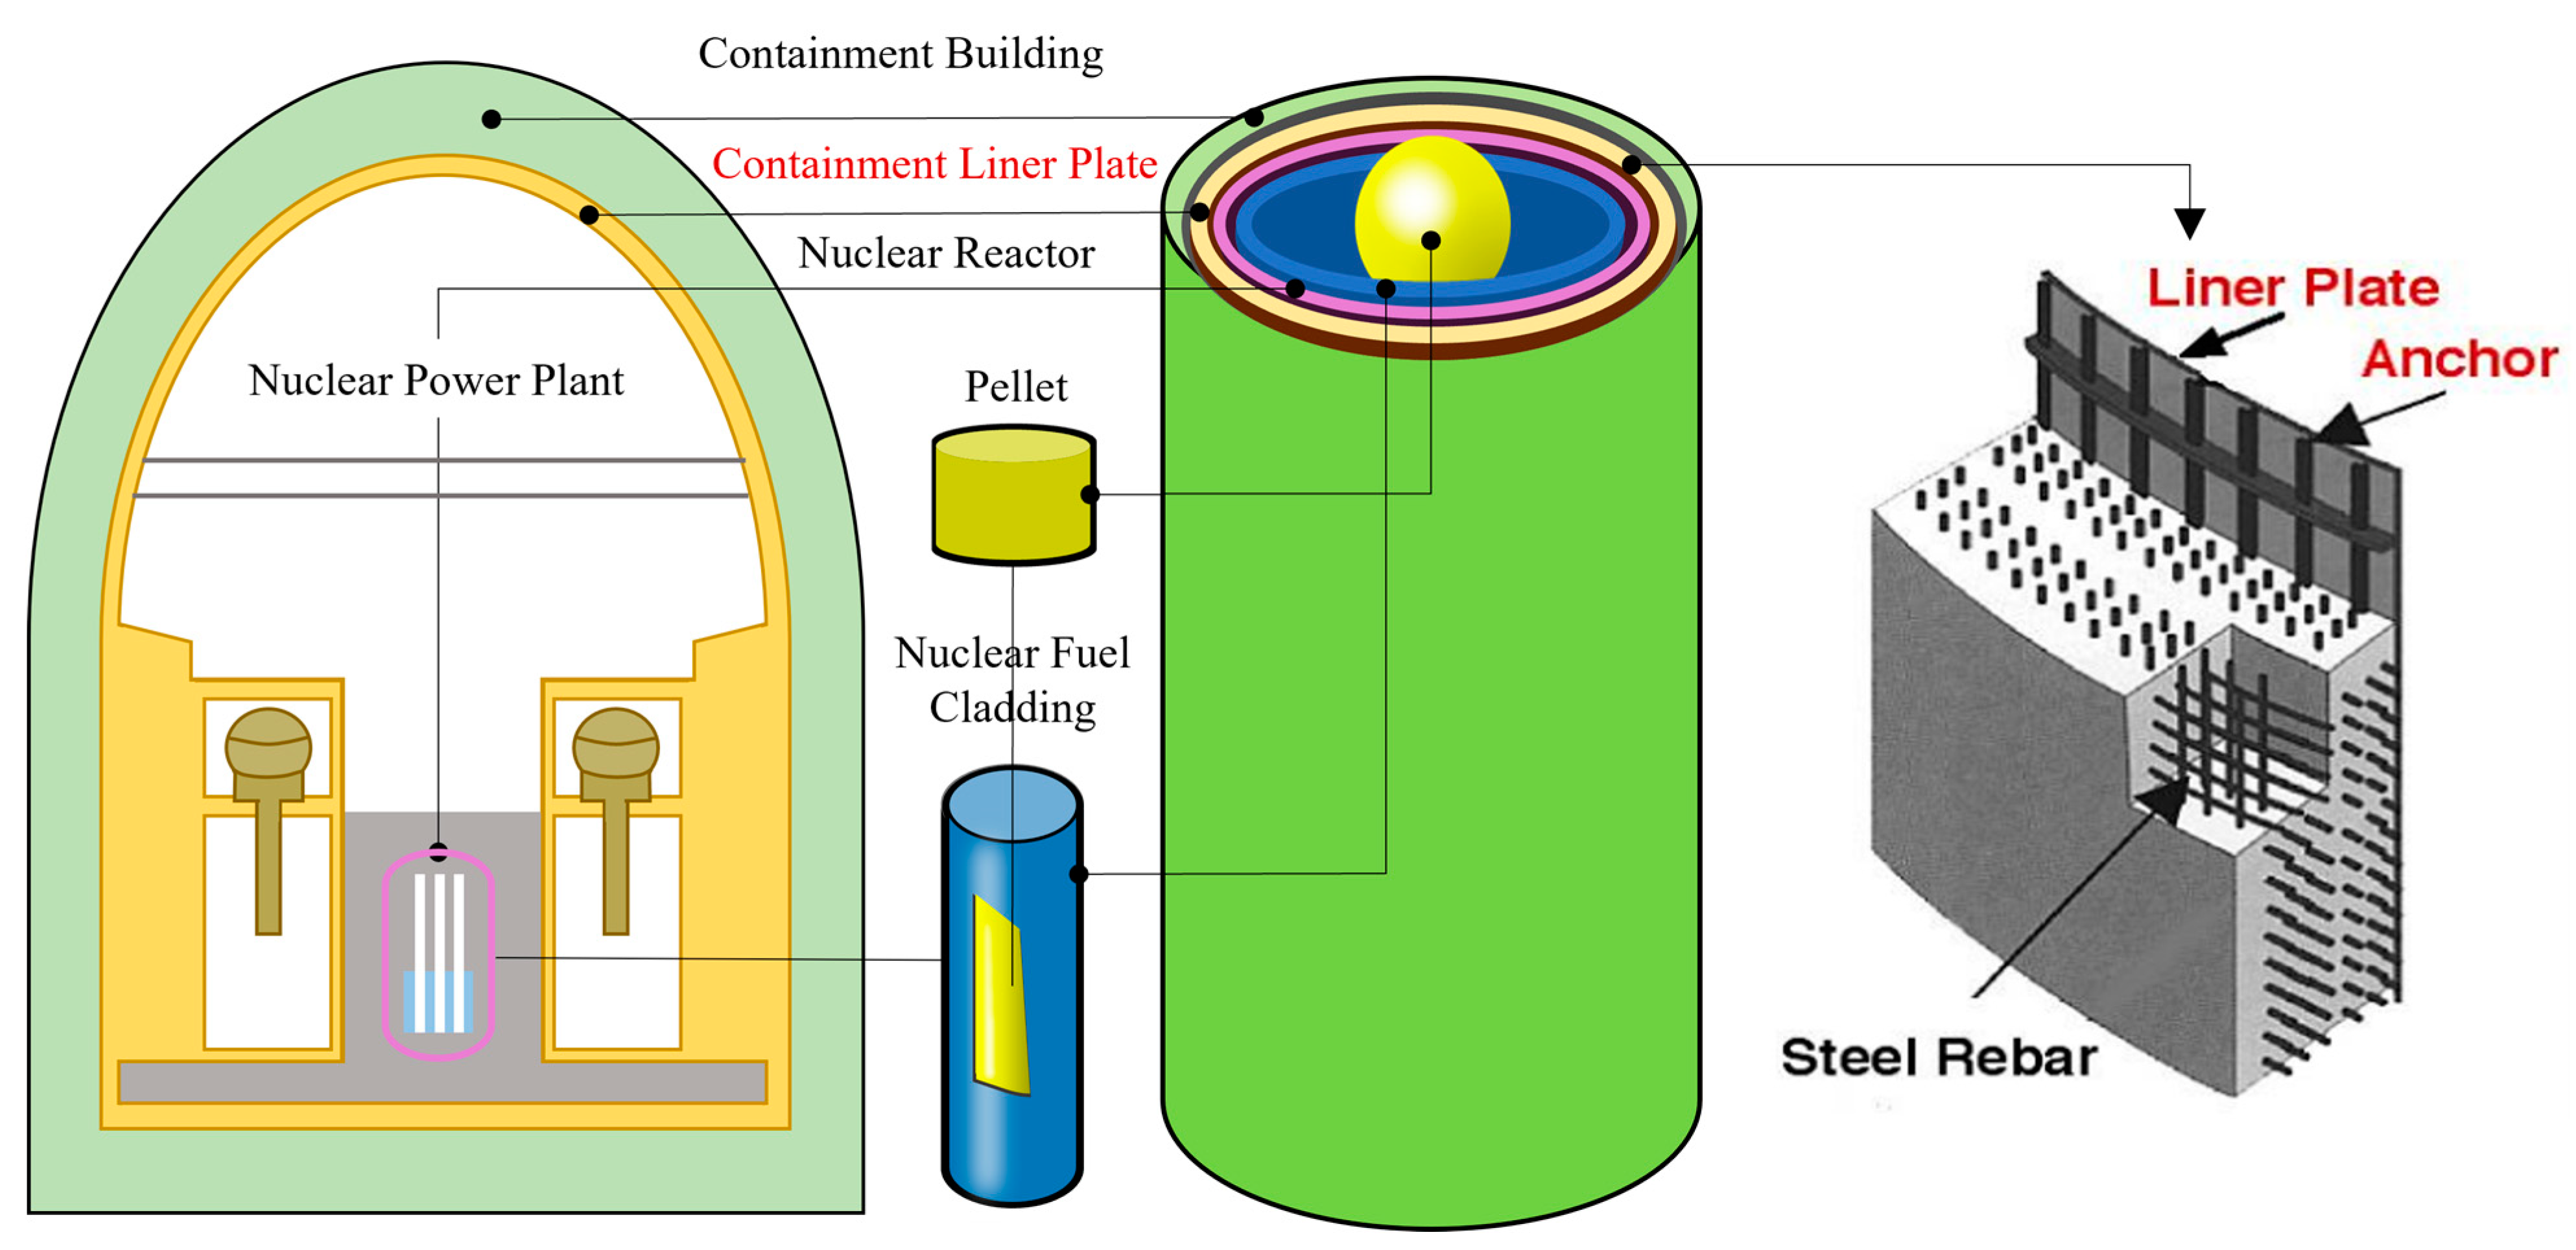
:1. Introduction
2. Theory
2.1. Four-Point Method for Phase Determination in LIT
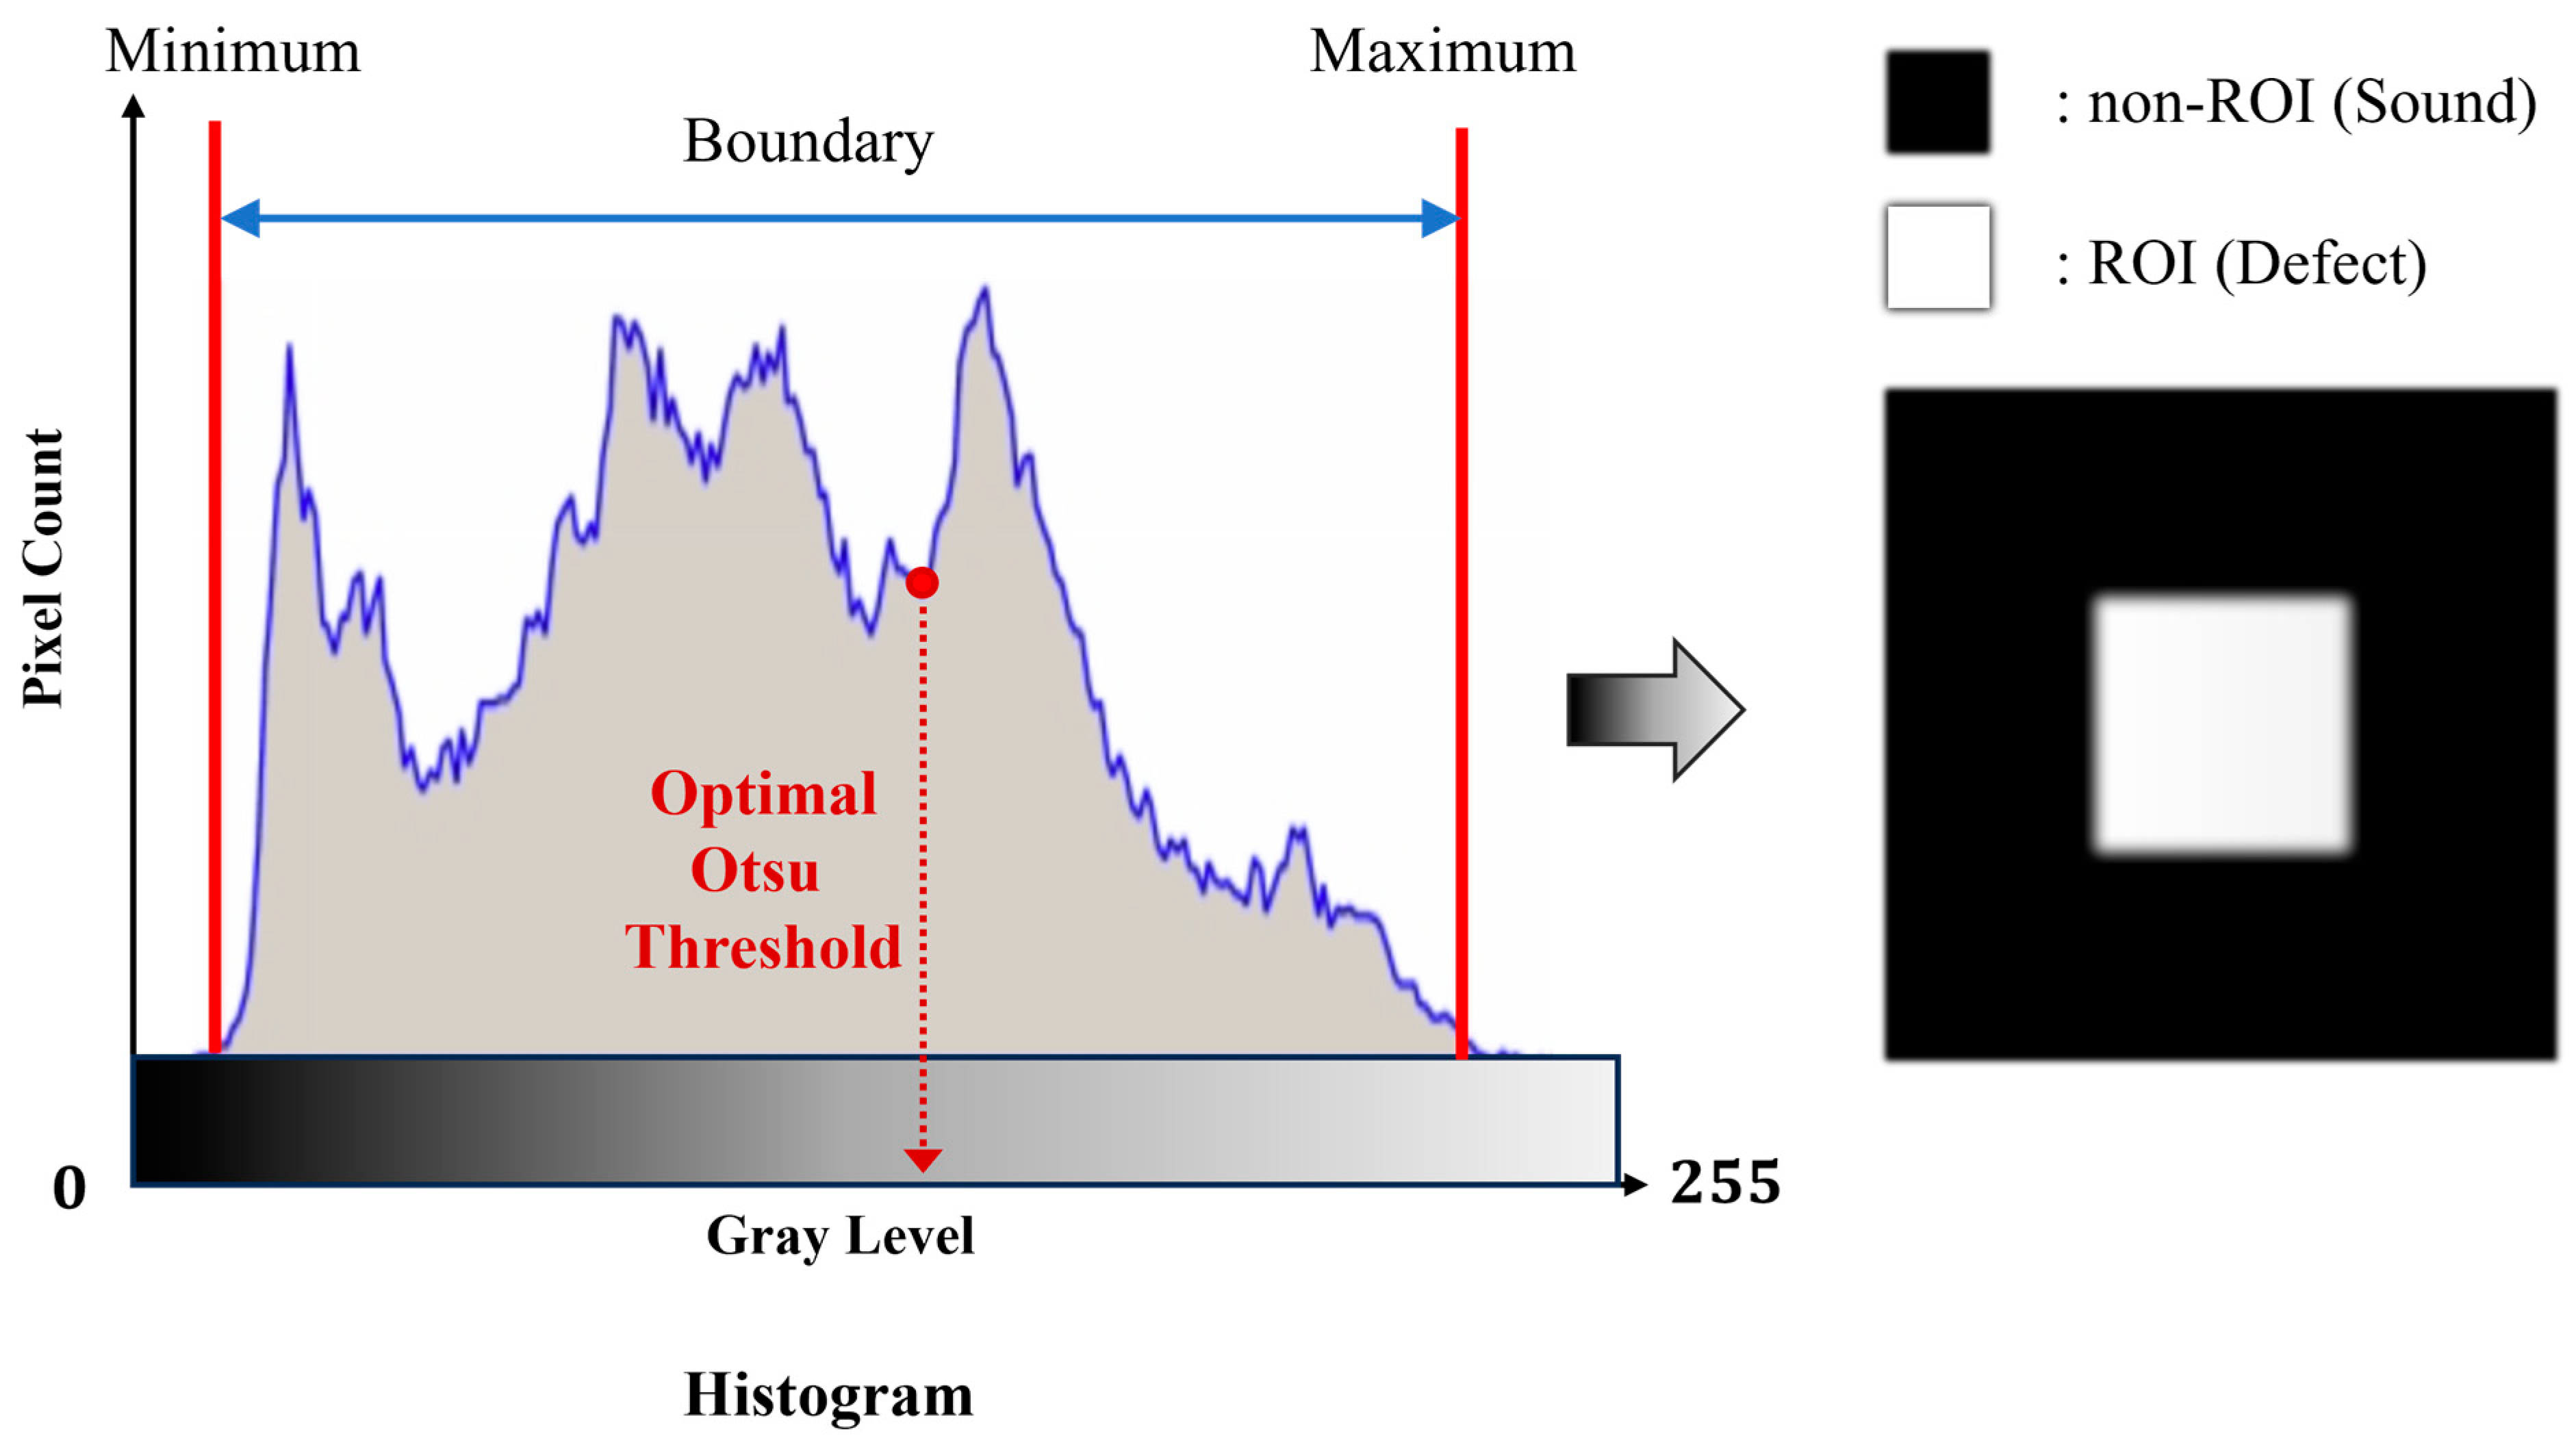
2.2. Otsu Algorithm Process for Binarization
3. Methods and Samples
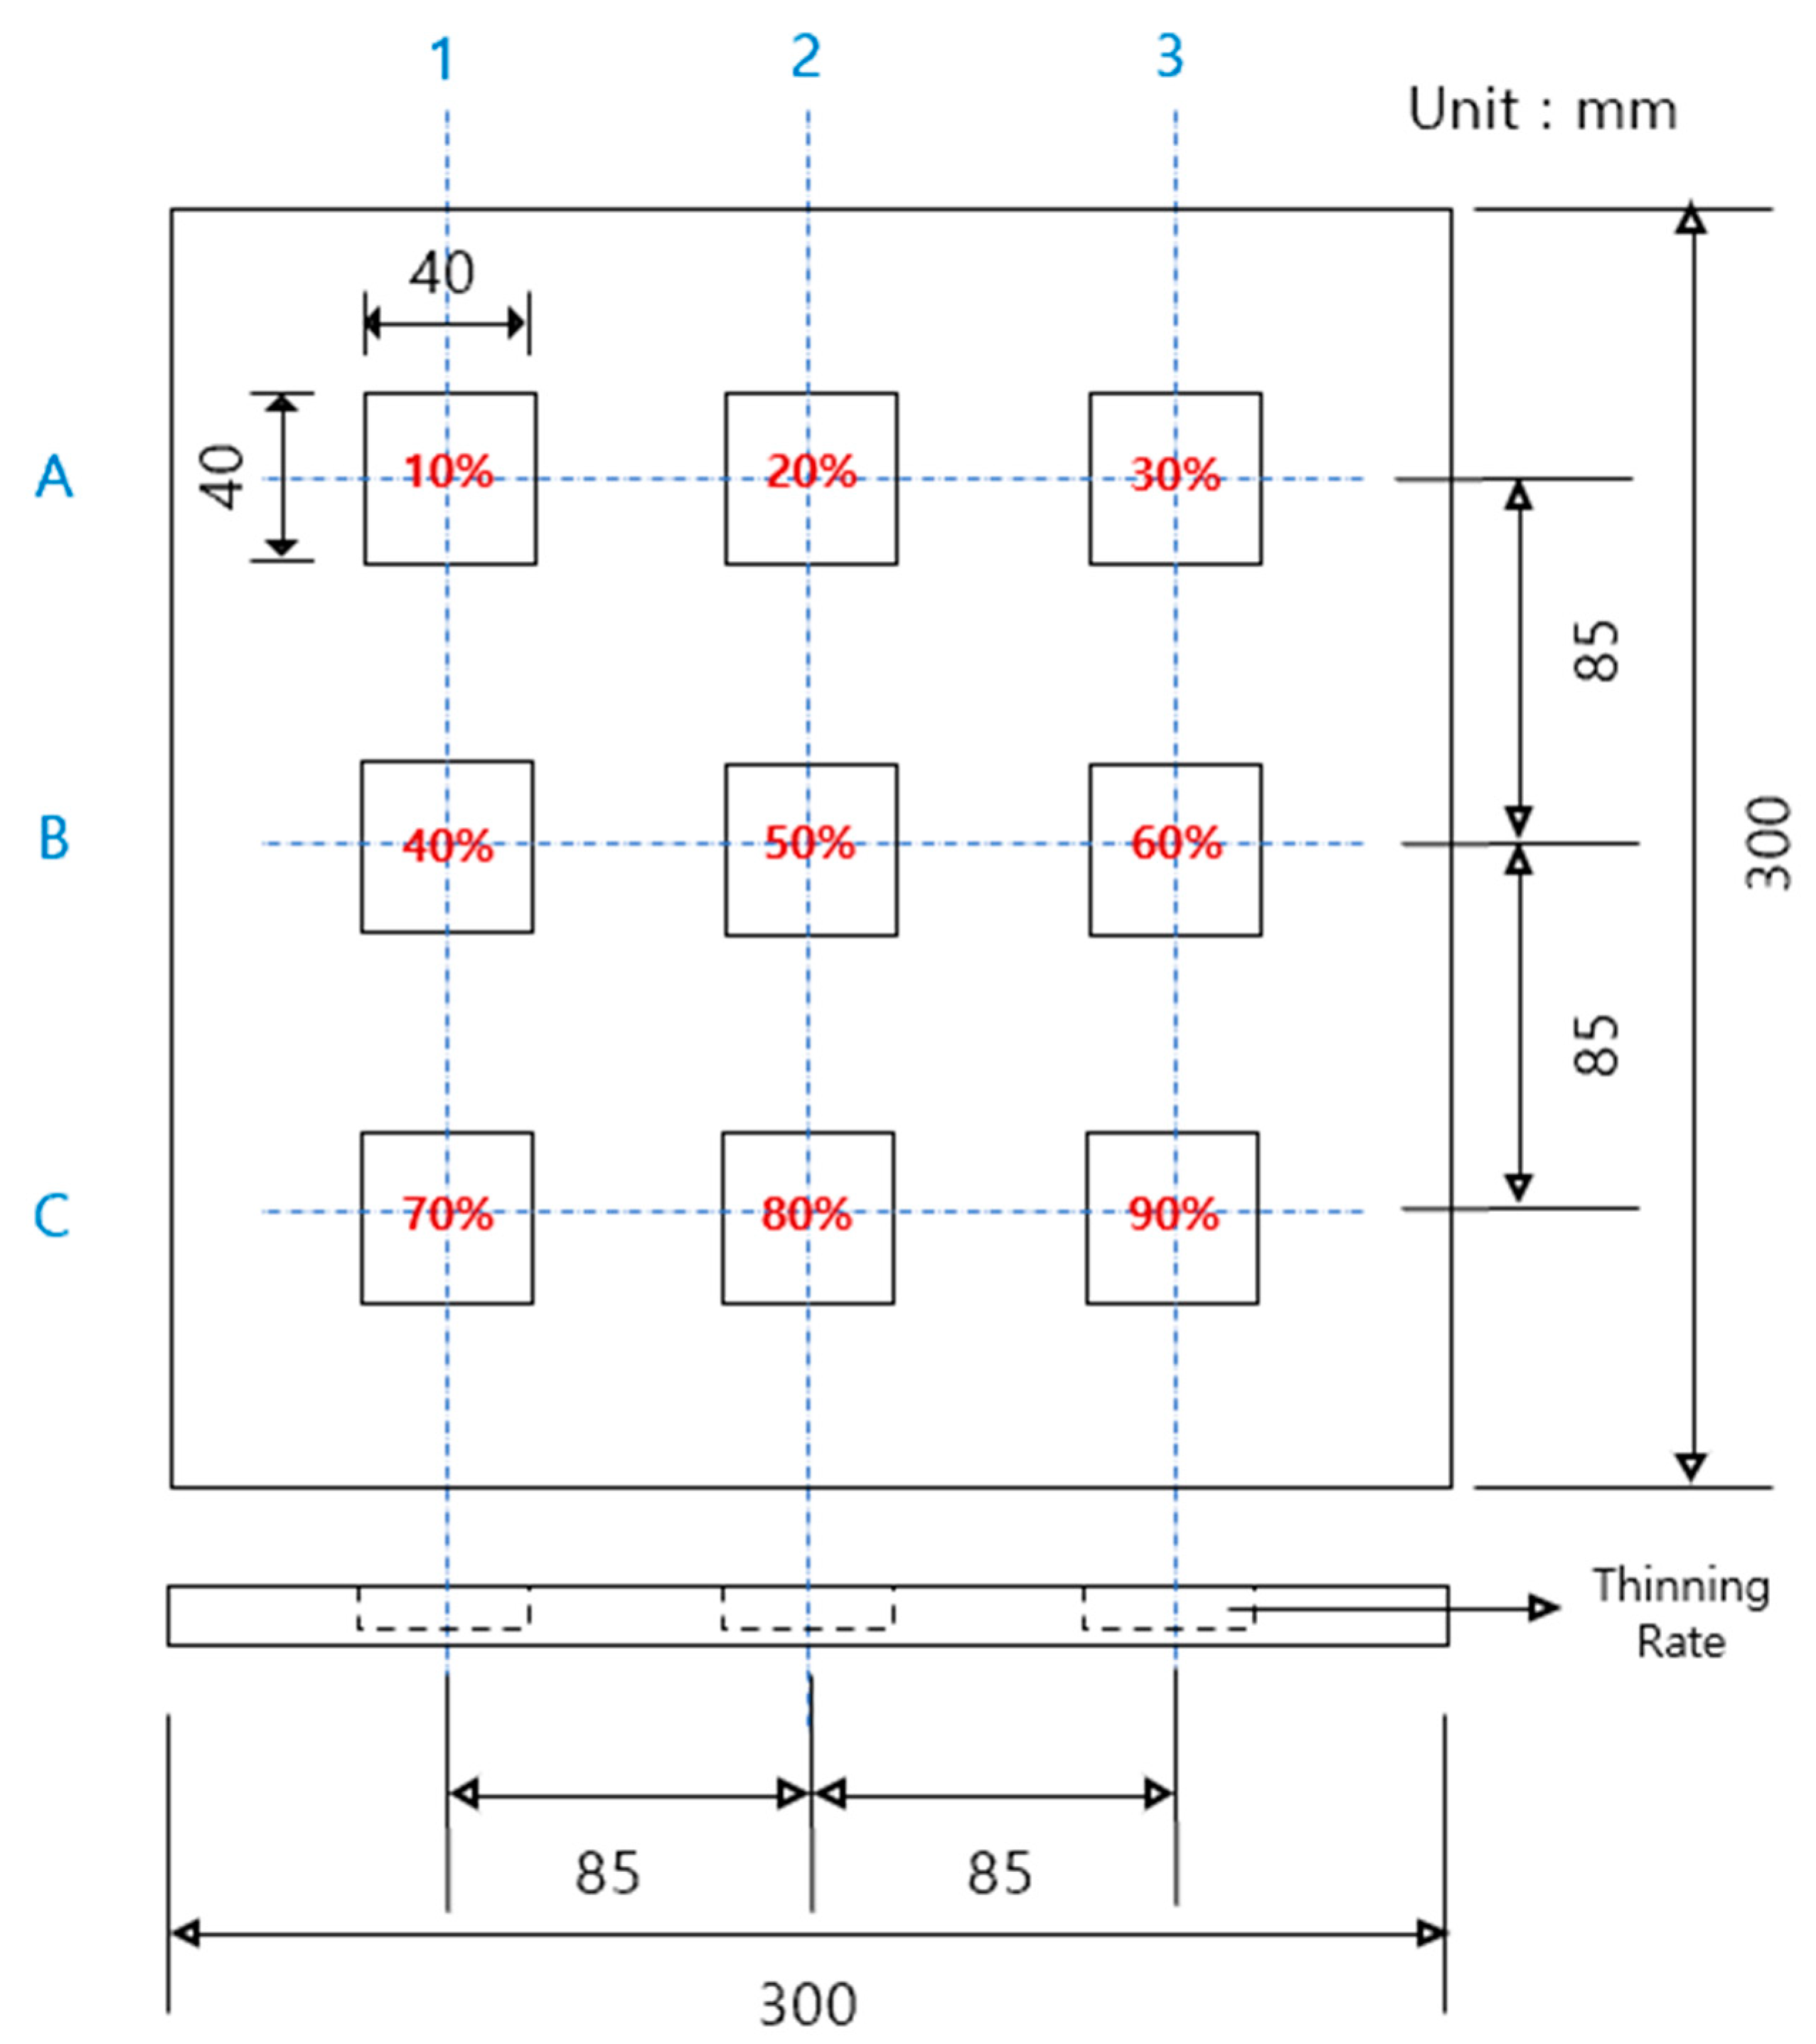
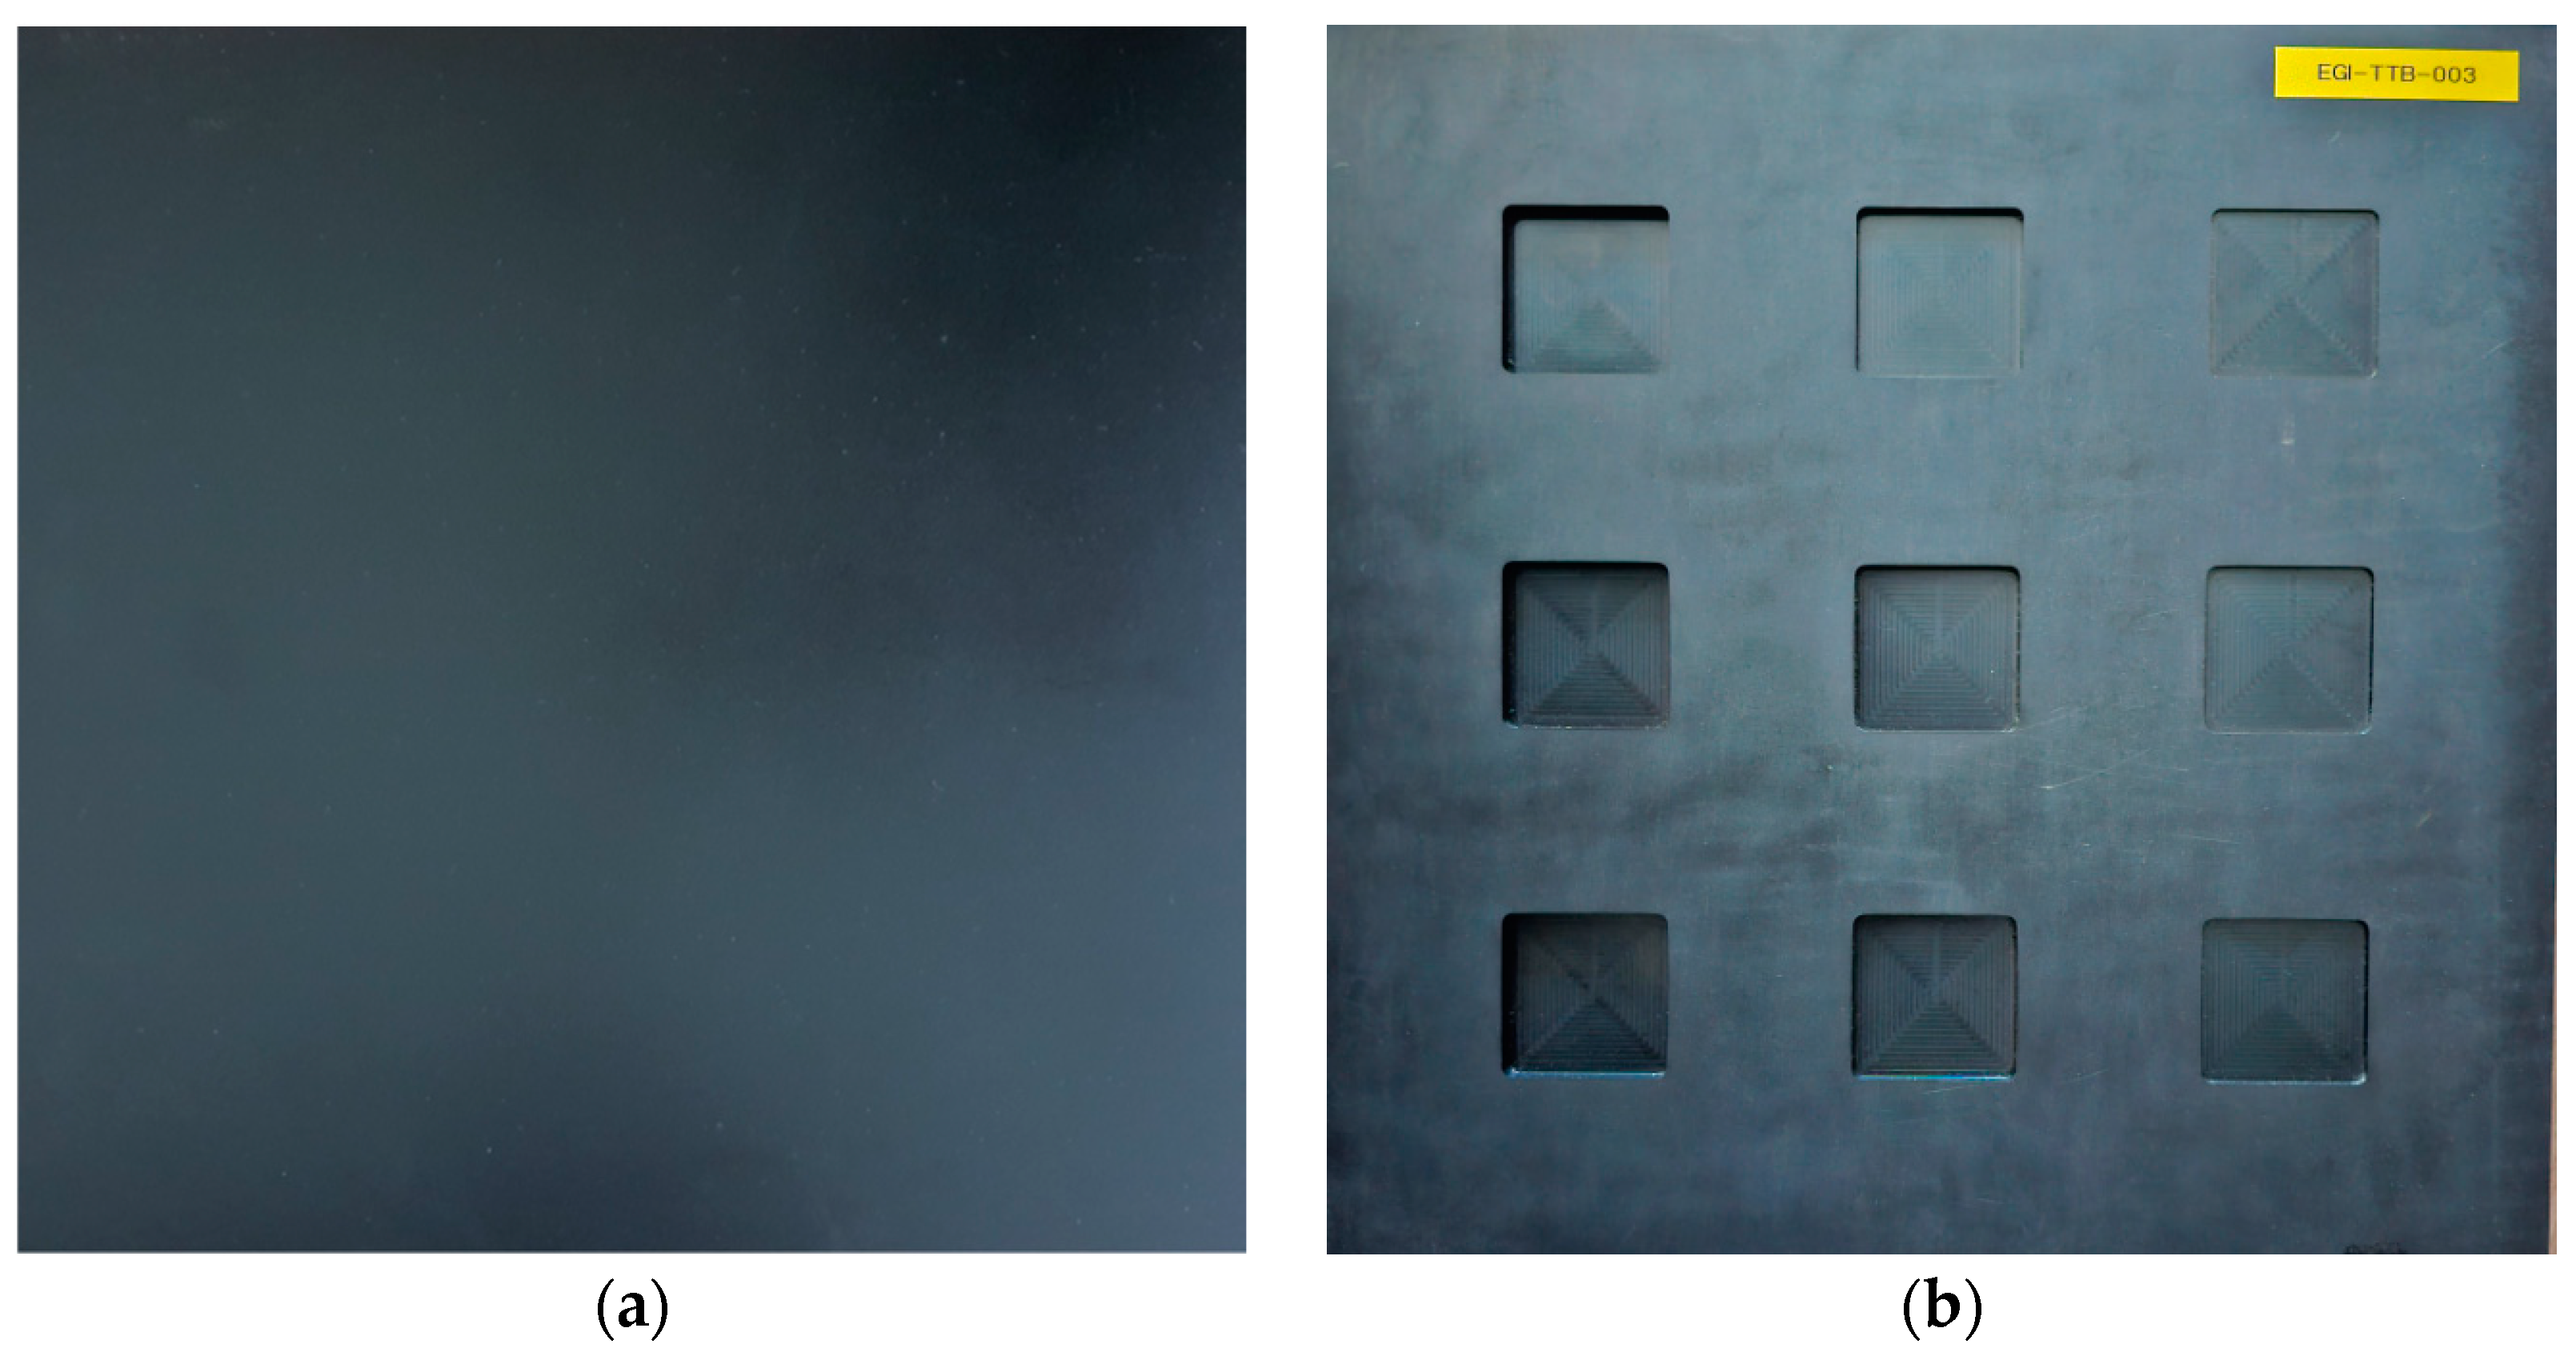
3.1. Thinning Defect Sample
3.2. Experimental Setup for LIT
4. Results and Discussion
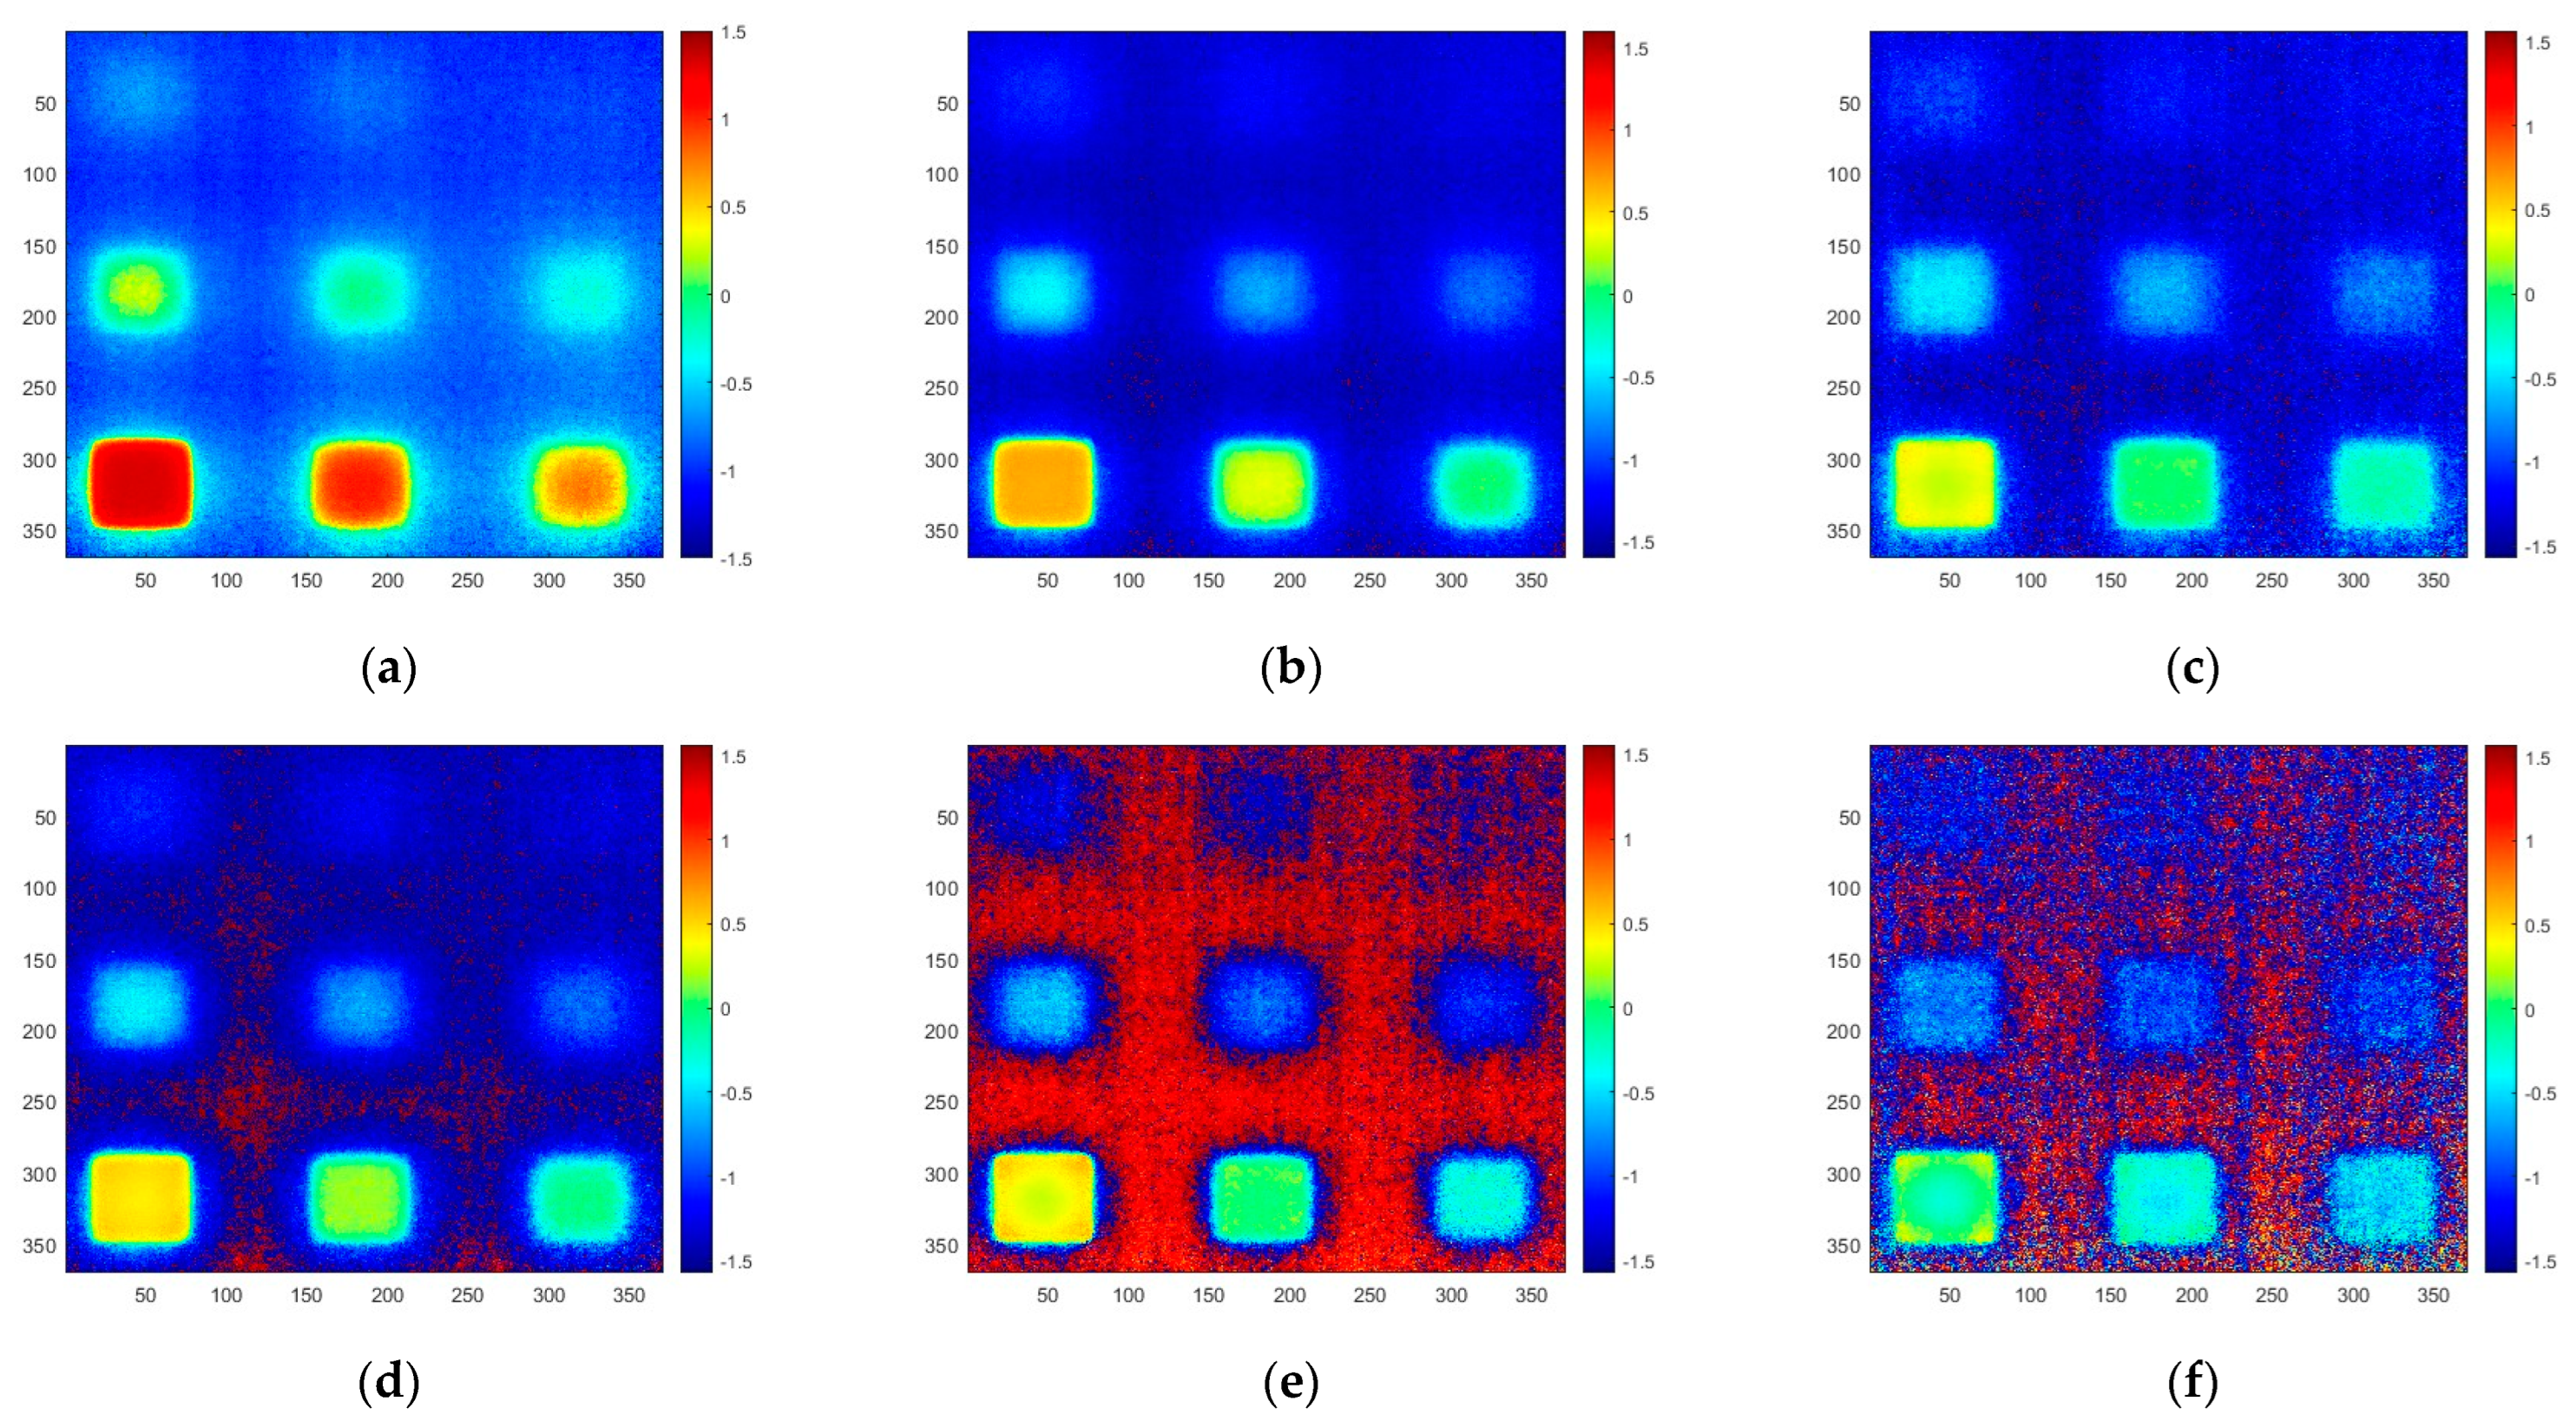
4.1. Thinning Defect Detection
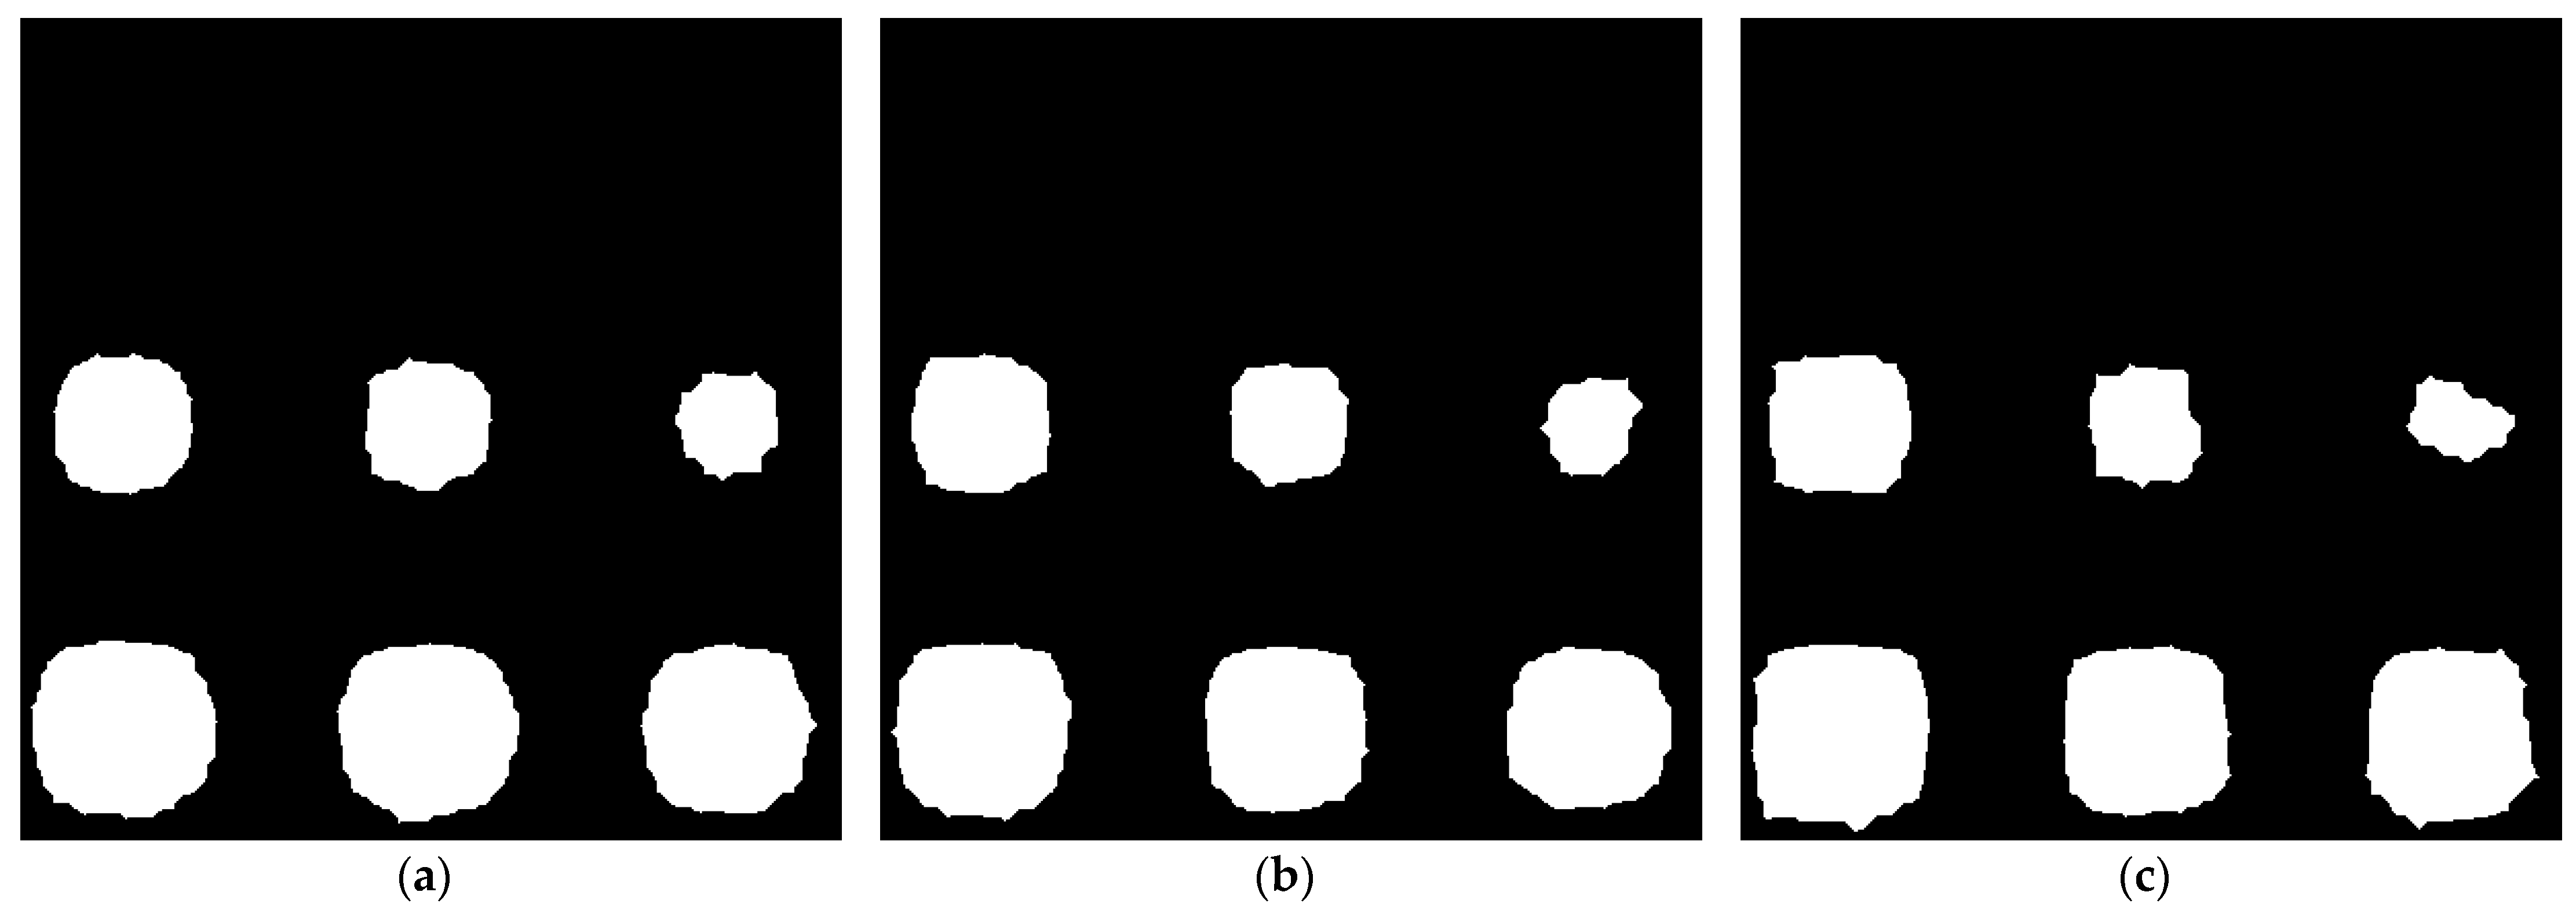
4.2. Phase Image Banarization by Otsu Algorithm
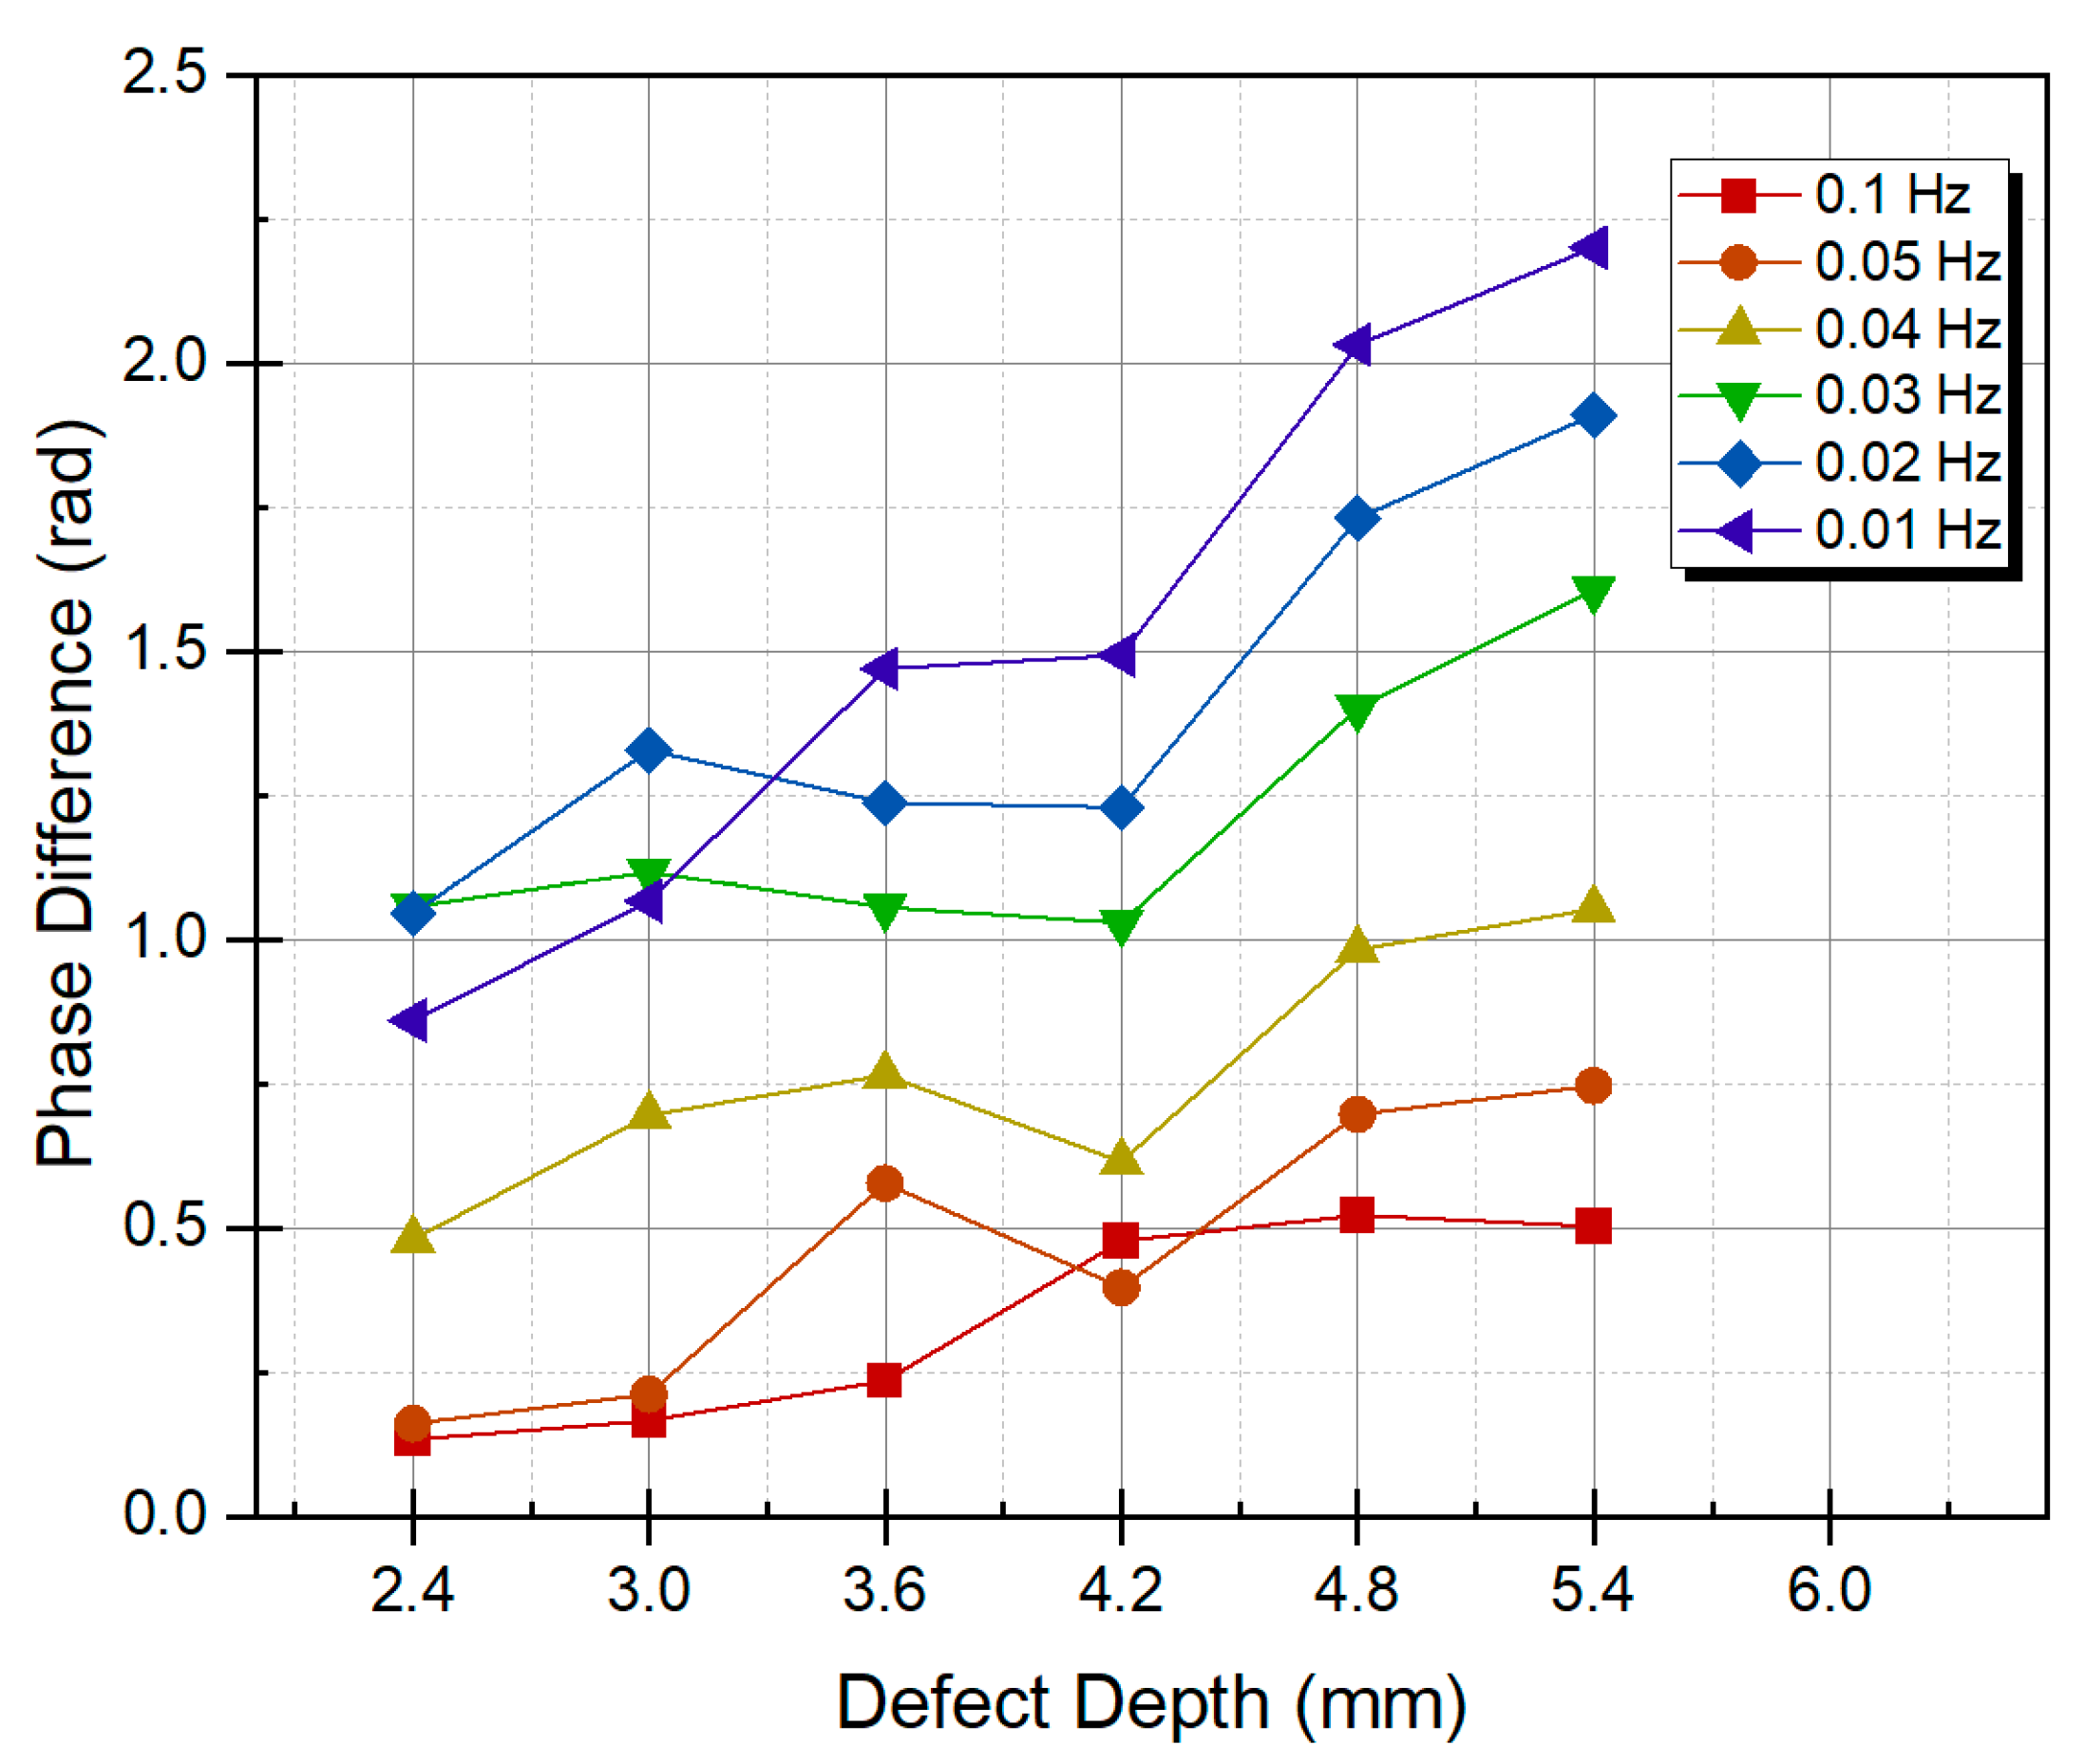
4.3. Estimation of Thinning Depth
4.4. Evaluation of Defect Detecability
5. Conclusions
Author Contributions
Funding
Institutional Review Board Statement
Informed Consent Statement
Data Availability Statement
Conflicts of Interest
References
- Dwivedi, S.K.; Vishwakarma, M.; Soni, A. Advances and Researches on Non Destructive Testing: A Review. Mater. Today Proc. 2018, 5, 3690–3698. [Google Scholar] [CrossRef]
- Omar, M. Nondestructive Testing Methods and New Applications; BoD–Books on Demand: Norderstedt, Germany, 2012. [Google Scholar]
- Osornio-Rios, R.A.; Antonino-Daviu, J.A.; de Jesus Romero-Troncoso, R. Recent Industrial Applications of Infrared Thermography: A Review. IEEE Trans. Ind. Inform. 2018, 15, 615–625. [Google Scholar] [CrossRef]
- Huang, H.; Yuan, E.; Zhang, D.; Sun, D.; Yang, M.; Zheng, Z.; Zhang, Z.; Gao, L.; Panezai, S.; Qiu, K. Free Field of View Infrared Digital Holography for Mineral Crystallization. Cryst. Growth Des. 2023, 23, 7992–8008. [Google Scholar] [CrossRef]
- Gupta, M.; Khan, M.A.; Butola, R.; Singari, R.M. Advances in Applications of Non-Destructive Testing (NDT): A Review. Adv. Mater. Process. Technol. 2022, 8, 2286–2307. [Google Scholar] [CrossRef]
- Yeom, Y.; Choi, Y.; Kim, H.; Kim, H.; Park, J.; Ryu, S.; Song, S. Containment Liner Plate Void Defect Detection Technique using Phased Array Ultrasonic Testing and Acoustic Resonance Method. Materials 2022, 15, 1330. [Google Scholar] [CrossRef]
- Choi, Y.W.; Yeom, Y.T.; Kim, H.J.; Song, S.J.; Ryu, S.W.; Kim, H.H.; Park, J.S.; Kwon, S.D. A Study on the Nondestructive Evaluation Method for Detecting Void in Containment Liner Plate. J. Korean Soc. Nondestruct. Test. 2020, 40, 389–396. [Google Scholar] [CrossRef]
- Park, J.; Hong, J. Present Status of Nuclear Containments and ISI in Korea. Prog. Nuclear Energy 2009, 51, 761–768. [Google Scholar] [CrossRef]
- Lee, J.S.; Kim, W.B.; Kwak, D.R. Development of Inspection Technique for Filling Or Unfilling of Containment Liner Plate Backside Concrete in Nuclear Power Plant. Trans. Korean Soc. Press. Vessel. Pip. 2020, 16, 37–41. [Google Scholar]
- Nuclear Safety and Security Committee. Result of Inspection of the Root Cause of Voids in the Containment Building of Hanbit Units 3 and 4; 162ed Report No. 1; NSSC: Seoul, Republic of Korea, 2022; pp. 1–10. Available online: https://www.nssc.go.kr/ajaxfile/FR_SVC/FileDown.do?GBN=X01&BOARD_SEQ=5&SITE_NO=2&BBS_SEQ=46152&FILE_SEQ=1 (accessed on 7 May 2023).
- Nuclear Safety and Security Committee Status of Special Inspection of Nuclear Power Plant Structures and Future Plans; 105th Other Report; NSSC: Seoul, Republic of Korea, 2019; pp. 1–12. Available online: https://www.nssc.go.kr/ajaxfile/FR_SVC/FileDown.do?GBN=X01&BOARD_SEQ=5&SITE_NO=2&BBS_SEQ=45575&FILE_SEQ=22884 (accessed on 7 May 2023).
- Dunn, D.; Pulvirenti, A.; Klein, P. Containment Liner Corrosion. In Proceedings of the 15th International Conference on Environmental Degradation of Materials in Nuclear Power Systems—Water Reactors, Colorado Springs, CO, USA, 7–11 August 2011; Springer International Publishing: Cham, Switzerland, 2011; pp. 1037–1049. [Google Scholar]
- Junyan, L.; Qingju, T.; Xun, L.; Yang, W. Research on the Quantitative Analysis of Subsurface Defects for Non-Destructive Testing by Lock-in Thermography. NDT E Int. 2012, 45, 104–110. [Google Scholar] [CrossRef]
- Ahmad, J.; Akula, A.; Mulaveesala, R.; Sardana, H.K. An Independent Component Analysis Based Approach for Frequency Modulated Thermal Wave Imaging for Subsurface Defect Detection in Steel Sample. Infrared Phys. Technol. 2019, 98, 45–54. [Google Scholar] [CrossRef]
- Lee, S.; Chung, Y.; Kim, C.; Kim, W. Automatic Thinning Detection through Image Segmentation using Equivalent Array-Type Lamp-Based Lock-in Thermography. Sensors 2023, 23, 1281. [Google Scholar] [CrossRef]
- Yu, S.; Chung, W.W.; Lau, T.C.; Lai, W.W.; Sham, J.F.C.; Ho, C.Y. Laboratory Validation of in-Pipe Pulsed Thermography in the Rapid Assessment of External Pipe Wall Thinning in Buried Metallic Utilities. NDT E Int. 2023, 135, 102791. [Google Scholar] [CrossRef]
- Kim, J.W.; Yun, K.W.; Jung, H.C. Investigation of Optimal Thermal Injection Conditions and the Capability of IR Thermography for Detecting Wall-Thinning Defects in Small-Diameter Piping Components. Nucl. Eng. Des. 2013, 262, 39–51. [Google Scholar] [CrossRef]
- Xie, J.; Xu, C.; Wu, C.; Gao, L.; Chen, G.; Li, G.; Song, G. Visualization of Defects in CFRP-Reinforced Steel Structures using Improved Eddy Current Pulsed Thermography. Autom. Constr. 2023, 145, 104643. [Google Scholar] [CrossRef]
- Olafsson, G.; Tighe, R.C.; Boyd, S.W.; Dulieu-Barton, J.M. Lock-in Thermography using Miniature Infra-Red Cameras and Integrated Actuators for Defect Identification in Composite Materials. Opt. Laser Technol. 2022, 147, 107629. [Google Scholar] [CrossRef]
- Wysocka-Fotek, O.; Oliferuk, W.; Maj, M. Reconstruction of Size and Depth of Simulated Defects in Austenitic Steel Plate using Pulsed Infrared Thermography. Infrared Phys. Technol. 2012, 55, 363–367. [Google Scholar] [CrossRef]
- Ciampa, F.; Mahmoodi, P.; Pinto, F.; Meo, M. Recent Advances in Active Infrared Thermography for Non-Destructive Testing of Aerospace Components. Sensors 2018, 18, 609. [Google Scholar] [CrossRef]
- Doshvarpassand, S.; Wu, C.; Wang, X. An Overview of Corrosion Defect Characterization using Active Infrared Thermography. Infrared Phys. Technol. 2019, 96, 366–389. [Google Scholar] [CrossRef]
- Kim, C.; Kang, S.; Chung, Y.; Kim, O.; Kim, W. Quantification of the Effective Detectable Period for Concrete Voids of CLP by Lock-in Thermography. Appl. Sci. 2023, 13, 8247. [Google Scholar] [CrossRef]
- Breitenstein, O.; Langenkamp, M. Lock-in Thermography. In Basics and Use for Functional Diagnostics of Electronics Components; Springer: Berlin/Heidelberg, Germany, 2003. [Google Scholar]
- Meola, C.; Carlomagno, G.M.; Squillace, A.; Giorleo, G. Non-Destructive Control of Industrial Materials by Means of Lock-in Thermography. Meas. Sci. Technol. 2002, 13, 1583. [Google Scholar] [CrossRef]
- Manda, M.P.; Kim, H.S. A Fast Image Thresholding Algorithm for Infrared Images Based on Histogram Approximation and Circuit Theory. Algorithms 2020, 13, 207. [Google Scholar] [CrossRef]
- Dong, Y.X. Review of Otsu Segmentation Algorithm. Adv. Mater. Res. 2014, 989, 1959–1961. [Google Scholar] [CrossRef]
- Talab, A.M.A.; Huang, Z.; Xi, F.; HaiMing, L. Detection Crack in Image using Otsu Method and Multiple Filtering in Image Processing Techniques. Optik 2016, 127, 1030–1033. [Google Scholar] [CrossRef]


| Defect ID | Geometric Value | ||
|---|---|---|---|
| Size (mm) | Depth (mm) | Thinning Rate (%) | |
| A1 | 40 × 40 | 0.6 | 10 |
| A2 | 1.2 | 20 | |
| A3 | 1.8 | 30 | |
| B1 | 2.4 | 40 | |
| B2 | 3.0 | 50 | |
| B3 | 3.6 | 60 | |
| C1 | 4.2 | 70 | |
| C2 | 4.8 | 80 | |
| C3 | 5.4 | 90 | |
| Frequency (Hz) | Frame/ Cycle | Frame Interval | Frame Considered | |||
|---|---|---|---|---|---|---|
| 1st | 2nd | 3rd | 4th | |||
| 0.1 | 500 | 125 | 125 | 250 | 375 | 500 |
| 0.05 | 1000 | 250 | 250 | 500 | 750 | 1000 |
| 0.04 | 1250 | 312.5 | 312 | 625 | 937 | 1250 |
| 0.03 | 1666 | 416.5 | 416 | 833 | 1249 | 1666 |
| 0.02 | 2500 | 625 | 625 | 1250 | 1875 | 2500 |
| 0.01 | 5000 | 1250 | 1250 | 2500 | 3750 | 5000 |
| Defect ID | Modulation Frequency (Hz) | ||||||
|---|---|---|---|---|---|---|---|
| 0.1 | 0.05 | 0.04 | 0.03 | 0.02 | 0.01 | ||
| Phase SNR (dB) | B1 | 1.57 | 6.07 | 6.32 | 16.25 | 13.08 | 18.47 |
| B2 | 1.34 | 6.12 | 7.98 | 24.23 | 22.57 | 29.22 | |
| B3 | 3.68 | 6.74 | 11.78 | 30.35 | 28.01 | 38.34 | |
| C1 | 3.67 | 30.02 | 35.48 | 38.98 | 41.67 | 50.12 | |
| C2 | 7.57 | 36.44 | 36.24 | 40.36 | 41.75 | 50.57 | |
| C3 | 8.07 | 37.15 | 32.86 | 45.02 | 47.86 | 53.18 | |
| Defect Depth (mm) | Thinning Rate (%) | Phase Angle (Radian) | Estimated Depth (mm) | Error (%) |
|---|---|---|---|---|
| 2.4 | 40 | 0.5039 | 2.35 | 0.85 |
| 3.0 | 50 | 0.7472 | 2.90 | 1.76 |
| 3.6 | 60 | 1.0534 | 3.51 | 1.65 |
| 4.2 | 70 | 1.6067 | 4.42 | −4.14 |
| 4.8 | 80 | 1.9097 | 4.86 | −1.10 |
| 5.4 | 90 | 2.2006 | 5.26 | 2.60 |
| Defect ID | Pixels | Error (%) | |
|---|---|---|---|
| Real Pixel | Estimated Pixel | ||
| B1 | 1995 | 5504 | −63.75 |
| B2 | 3179 | −42.24 | |
| B3 | 3795 | −31.05 | |
| C1 | 5589 | 1.54 | |
| C2 | 6153 | 11.79 | |
| C3 | 6427 | 16.77 | |
Disclaimer/Publisher’s Note: The statements, opinions and data contained in all publications are solely those of the individual author(s) and contributor(s) and not of MDPI and/or the editor(s). MDPI and/or the editor(s) disclaim responsibility for any injury to people or property resulting from any ideas, methods, instructions or products referred to in the content. |
© 2023 by the authors. Licensee MDPI, Basel, Switzerland. This article is an open access article distributed under the terms and conditions of the Creative Commons Attribution (CC BY) license (https://creativecommons.org/licenses/by/4.0/).
Share and Cite
Chung, Y.; Lee, S.; Kim, C.; Kim, W. Quantitative Investigation of Containment Liner Plate Thinning with Combined Thermal Wave Signal and Image Processing in Thermography Testing. Appl. Sci. 2023, 13, 13180. https://doi.org/10.3390/app132413180
Chung Y, Lee S, Kim C, Kim W. Quantitative Investigation of Containment Liner Plate Thinning with Combined Thermal Wave Signal and Image Processing in Thermography Testing. Applied Sciences. 2023; 13(24):13180. https://doi.org/10.3390/app132413180
Chicago/Turabian StyleChung, Yoonjae, Seungju Lee, Chunyoung Kim, and Wontae Kim. 2023. "Quantitative Investigation of Containment Liner Plate Thinning with Combined Thermal Wave Signal and Image Processing in Thermography Testing" Applied Sciences 13, no. 24: 13180. https://doi.org/10.3390/app132413180
APA StyleChung, Y., Lee, S., Kim, C., & Kim, W. (2023). Quantitative Investigation of Containment Liner Plate Thinning with Combined Thermal Wave Signal and Image Processing in Thermography Testing. Applied Sciences, 13(24), 13180. https://doi.org/10.3390/app132413180