Article

Influence of Open Differential Design on the Mass Reduction Function

1
Mechanical Engineering Faculty, University of Slavonski Brod, Trg Ivane Brlić-Mažuranić 2, 35000 Slavonski Brod, Croatia
2
Faculty of Electrical Engineering, Computer Science and Information Technology, Josip Juraj Strossmayer University of Osijek, Kneza Trpimira 2b, 31000 Osijek, Croatia
*
Author to whom correspondence should be addressed.
Appl. Sci. 2023, 13(24), 13300; https://doi.org/10.3390/app132413300
Submission received: 24 November 2023 / Revised: 9 December 2023 / Accepted: 14 December 2023 / Published: 16 December 2023
(This article belongs to the Special Issue Advances in Structural Optimization)

Abstract

:
The transmission of power and motion in road vehicles with internal combustion engines is achieved by different design variants of differential transmissions. The open differential transmission (ODT) is installed to a greater extent in passenger cars with rear-wheel drive due to its simpler design. Due to its robustness, it is possible to reduce its mass. Reducing the mass of the ODT, as well as reducing the mass of the other design elements of the vehicle, contributes to reducing the overall mass of the vehicle and improves the energy efficiency of the vehicle. The paper develops and proposes an algorithm that combines the design of the ODT according to ISO 23509:2006, the numerical calculation of the design elements (ring gear and drive shaft with pinion) using the finite element method (FEM) and the numerical global–local model, the topological optimization method (TOM) and the results of the FEM analysis in determining the design parameters. In addition, the proposed algorithm uses the application of the response surface method (RSM) in the construction of a mathematical model. With the proposed mathematical model, the mathematical objective function of the ODT overall mass reduction describes the influence of the previously selected design parameters on the overall mass reduction of the ODT. The mathematical model is also used to analyze the partial influence of the design parameters on the objective functions of the partial mass reduction of the ring gear and pinion drive shaft. Using the R2 and root mean square error (RMSE), an accuracy check of the proposed mathematical model was performed. According to the proposed algorithm and mathematical model, the two mentioned design elements of the ODT were optimized. After optimization, the overall mass of the ODM was reduced by 16.5%.

1. Introduction

1.1. Differential Transmissions Overview

Differential transmission of power and motion is a technical system that uses gears to transmit torque and rotation. With its application in cars, torque and rotation are supplied to the input shaft, which is then taken to the left and right drive wheels [1,2]. The need for different amounts of angular velocities (so that the vehicle does not overturn during non-rectilinear movement) and torques of the drive wheels arises during the movement of the vehicle in a turn, on uneven ground and with different wheel diameters. The latter is a consequence of the appearance of a pressure difference in the tires. With regard to the previously mentioned functional requirements, different design versions of differential transmissions are installed in road vehicles.
ODT is the basic design of the differential transmissions. Due to its relatively simpler design, it is mostly installed in rear-wheel drive passenger cars. When the vehicle moves in a straight line, the rotation speeds of the output shafts are equal (nLEFT = nRIGHT). Satellite gears rotate around the axis of the output shafts. During the movement of the vehicle in a turn, the satellite gears rotate around the axis of the output shafts, but also around their own axis. Therefore, the rotation speeds of the satellite gears are equal, but in the opposite direction. Depending on the direction of deflection, the rotation speeds of the sun gears are different (nLEFT < nRIGHT or nLEFT > nRIGHT). By slipping one of the drive wheels, the open differential distributes most of the torque to the wheel that has less resistance to movement (the slipping wheel). Therefore, a wheel that does not slip has an angular velocity of zero, and the torque is also zero. This is one of the main disadvantages of the ODT.
In relation to the ODT, the differential transmission with blocking has a built-in mechanism that allows the differential to be locked, and in this case, the output shafts have the same angular speed [3,4]. The limited slip differential uses springs and plates that are placed on the outside of the sun cones and allow even and uneven power distribution on the output shafts. Hydraulic transmissions with limited slips that work on the principle of a gear pump are also being developed [5]. Because of the ability to control the amount and direction of torque transfer, these differentials are called actively controlled differentials [6]. In this way, the wheel that does not slip obtains more power. Active systems are expensive and require deep system knowledge, so their implementation is very significant in sports cars [7]. Torsen Differential [8] uses worm screws instead of planetary cones. At the ends of the worm screws, there are gears through which the motion is transmitted on both output shafts. Self-braking property of the worm pair is the main feature of the torsion transmission.

1.2. Mass Reduction Impact on Improving Energy Efficiency

Vehicles with internal combustion engines significantly pollute the environment. EU energy policy resulted in directive 2012/27/EU [9], which encourages the implementation of energy efficiency measures in member countries. In order to improve energy efficiency, special attention is dedicated to traffic, which is reflected in the guidelines EN 16247-4:2022 [10]. By reducing the mass of the vehicle, it contributes to the reduction of fuel consumption and in this way to the improvement of the energy efficiency of the vehicle.
Differential transmissions, due to their design performance and the choice of material from which they are made (gray cast iron), have an increased mass, which contributes to the overall increase in the mass of the vehicle. Therefore, certain research papers deal with the selection of materials for making gears, analyzing the behavior of the differential at different rotation speeds, different gear mesh frequencies and different natural frequencies [11]. Selection of materials, such as composite materials [12,13], or gearboxes with gears made from polymer materials [14], has an impact on the mass reduction of the transmission, corrosion resistance, less abrasive wear and improved energy efficiency. By varying different print densities when producing gears from Acrylonitrile Butadiene Styrene (ABS), it is possible to obtain gears of lower mass with lower print densities (60% ABS density), while the stresses in the gears meet the permitted stresses [15]. In this way, the mass reduction of the design elements of the differential transmissions contributes to the overall mass reduction of the vehicles.
According to [16], it is necessary to develop transmissions with an increase in their efficiency, in order to reduce fuel consumption. By mass increasing the design elements of the differential transmission, the consumption of materials required for their production increases, and at the same time it reduces fuel efficiency [16]. Through the analysis of oil distribution at the different conditions with hypoid gears [17], an increase in the degree of useful action of the transmission is achieved, i.e., a reduction in power losses in the transmission. Papers [18,19], using the volume of fluid (VOF) method and computational fluid dynamics (CFD), analyze the influence of the speed factor, oil viscosity and immersion depth on the churning losses of spur gears.
The application of multi-objective optimization methods in the development and improvement of new design solutions is significant [20]. Thus, the improvement of transmission efficiency is achieved by optimizing the geometry of the transmission, which affects the strength of the gear’s teeth, noise reduction, vibration reduction and better power transmission [21,22]. Changing the micro and macro geometry of the gear teeth affects the transmission error and its reduction [22]. Macro geometry affects the change of the gear tooth profile in the axial direction and the tooth surface direction by the intentional removal of material from the gear teeth flanks [21]. Optimizing the parameters of the macro geometry affects the volume of the gear teeth, i.e., the reduction and increase in its mass [23]. Research in papers [24,25] analyzes the influence of micro geometry change on tooth strength. Yam and Chong [26], using the Artificial Immune System (AIS) algorithm, analyzed design parameters that have the greatest impact on the mass and volume reduction of the planetary gear train. By applying the AIS algorithm, they optimized the volume of the planetary gear train. Research [27] proposed a machine learning method in the design of non-involuted gears. With this method, predicted parameter YZ and nominal gear root stress were proposed. This is important from the aspect of increasing the accuracy of the gear calculation and gear optimization. Authors in [28] analyze the influence effects of center distance deviation on polymer gearbox life. Papers [29,30], using genetic algorithms, designed the minimum mass of the optimal combination of spur gears. By applying multi-objective optimization methods [31], two parameters, volume and center distance, are optimized and the Pareto frontier is obtained. Authors in this research used the teaching–learning-based optimization (TLBO) method. By applying RSM, authors in [32] analyze, through the response surface diagrams, the influence of individual design parameters on the set objective functions. TOM deals with the problem of optimal material distribution [33]. Their application is particularly significant in aerospace structure design, dynamic responses design, shape preserving design and smart structure design [34]. By applying these methods, the objective function refers to the saving of materials by reducing the mass of the design, taking care to preserve the functionality of the design.
In this paper, an ODT with hypoid and planetary bevel gears was designed using the ISO 23509:2006 standard [35]. Dimensioning and geometry shaping of hypoid and planetary bevel gears was carried out using the CAD system for parametric design. An analytical calculation of the stress on the tooth root and tooth flank face was made. The calculation was then analyzed numerically, with the FEM, for validation purposes. The numerical calculation via FEM static analysis was performed according to a global–local FEM approach [36].
In order to reduce fuel consumption and contribute to the improvement of the vehicle’s energy efficiency, the mass reduction of the designed ODT was performed. By applying the TOM and the RSM, the pinion hypoid bevel gear, ring hypoid bevel gear and drive shaft were optimized. Using the TOM, three general design parameters were determined on the ring hypoid bevel gear submodel. One additional design parameter is determined on the drive shaft (one parameter on the pinion hypoid bevel gear which is designed from one piece together with the drive shaft). Finally, these four parameters were optimized using the TOM.
Through regression analysis of the previously obtained four design parameters, a mathematical model was obtained that describes the influence of each design parameter on partial masses and overall mass of differential transmission. In this paper, the mathematical objective function of the overall mass reduction of the ODT-optimized design elements was obtained. Two partial mathematical mass reduction functions were also obtained and presented: the ring gear mass reduction function and the drive shaft mass reduction function. The results were compared between the predictions of the mass reduction functions of the mathematical model and the numerical model. A control numerical calculation of the optimized design elements was also made, using the global–local FEM static analysis approach, in order to additionally control the accuracy of the obtained mathematical model and also the reliability of the optimized design elements.

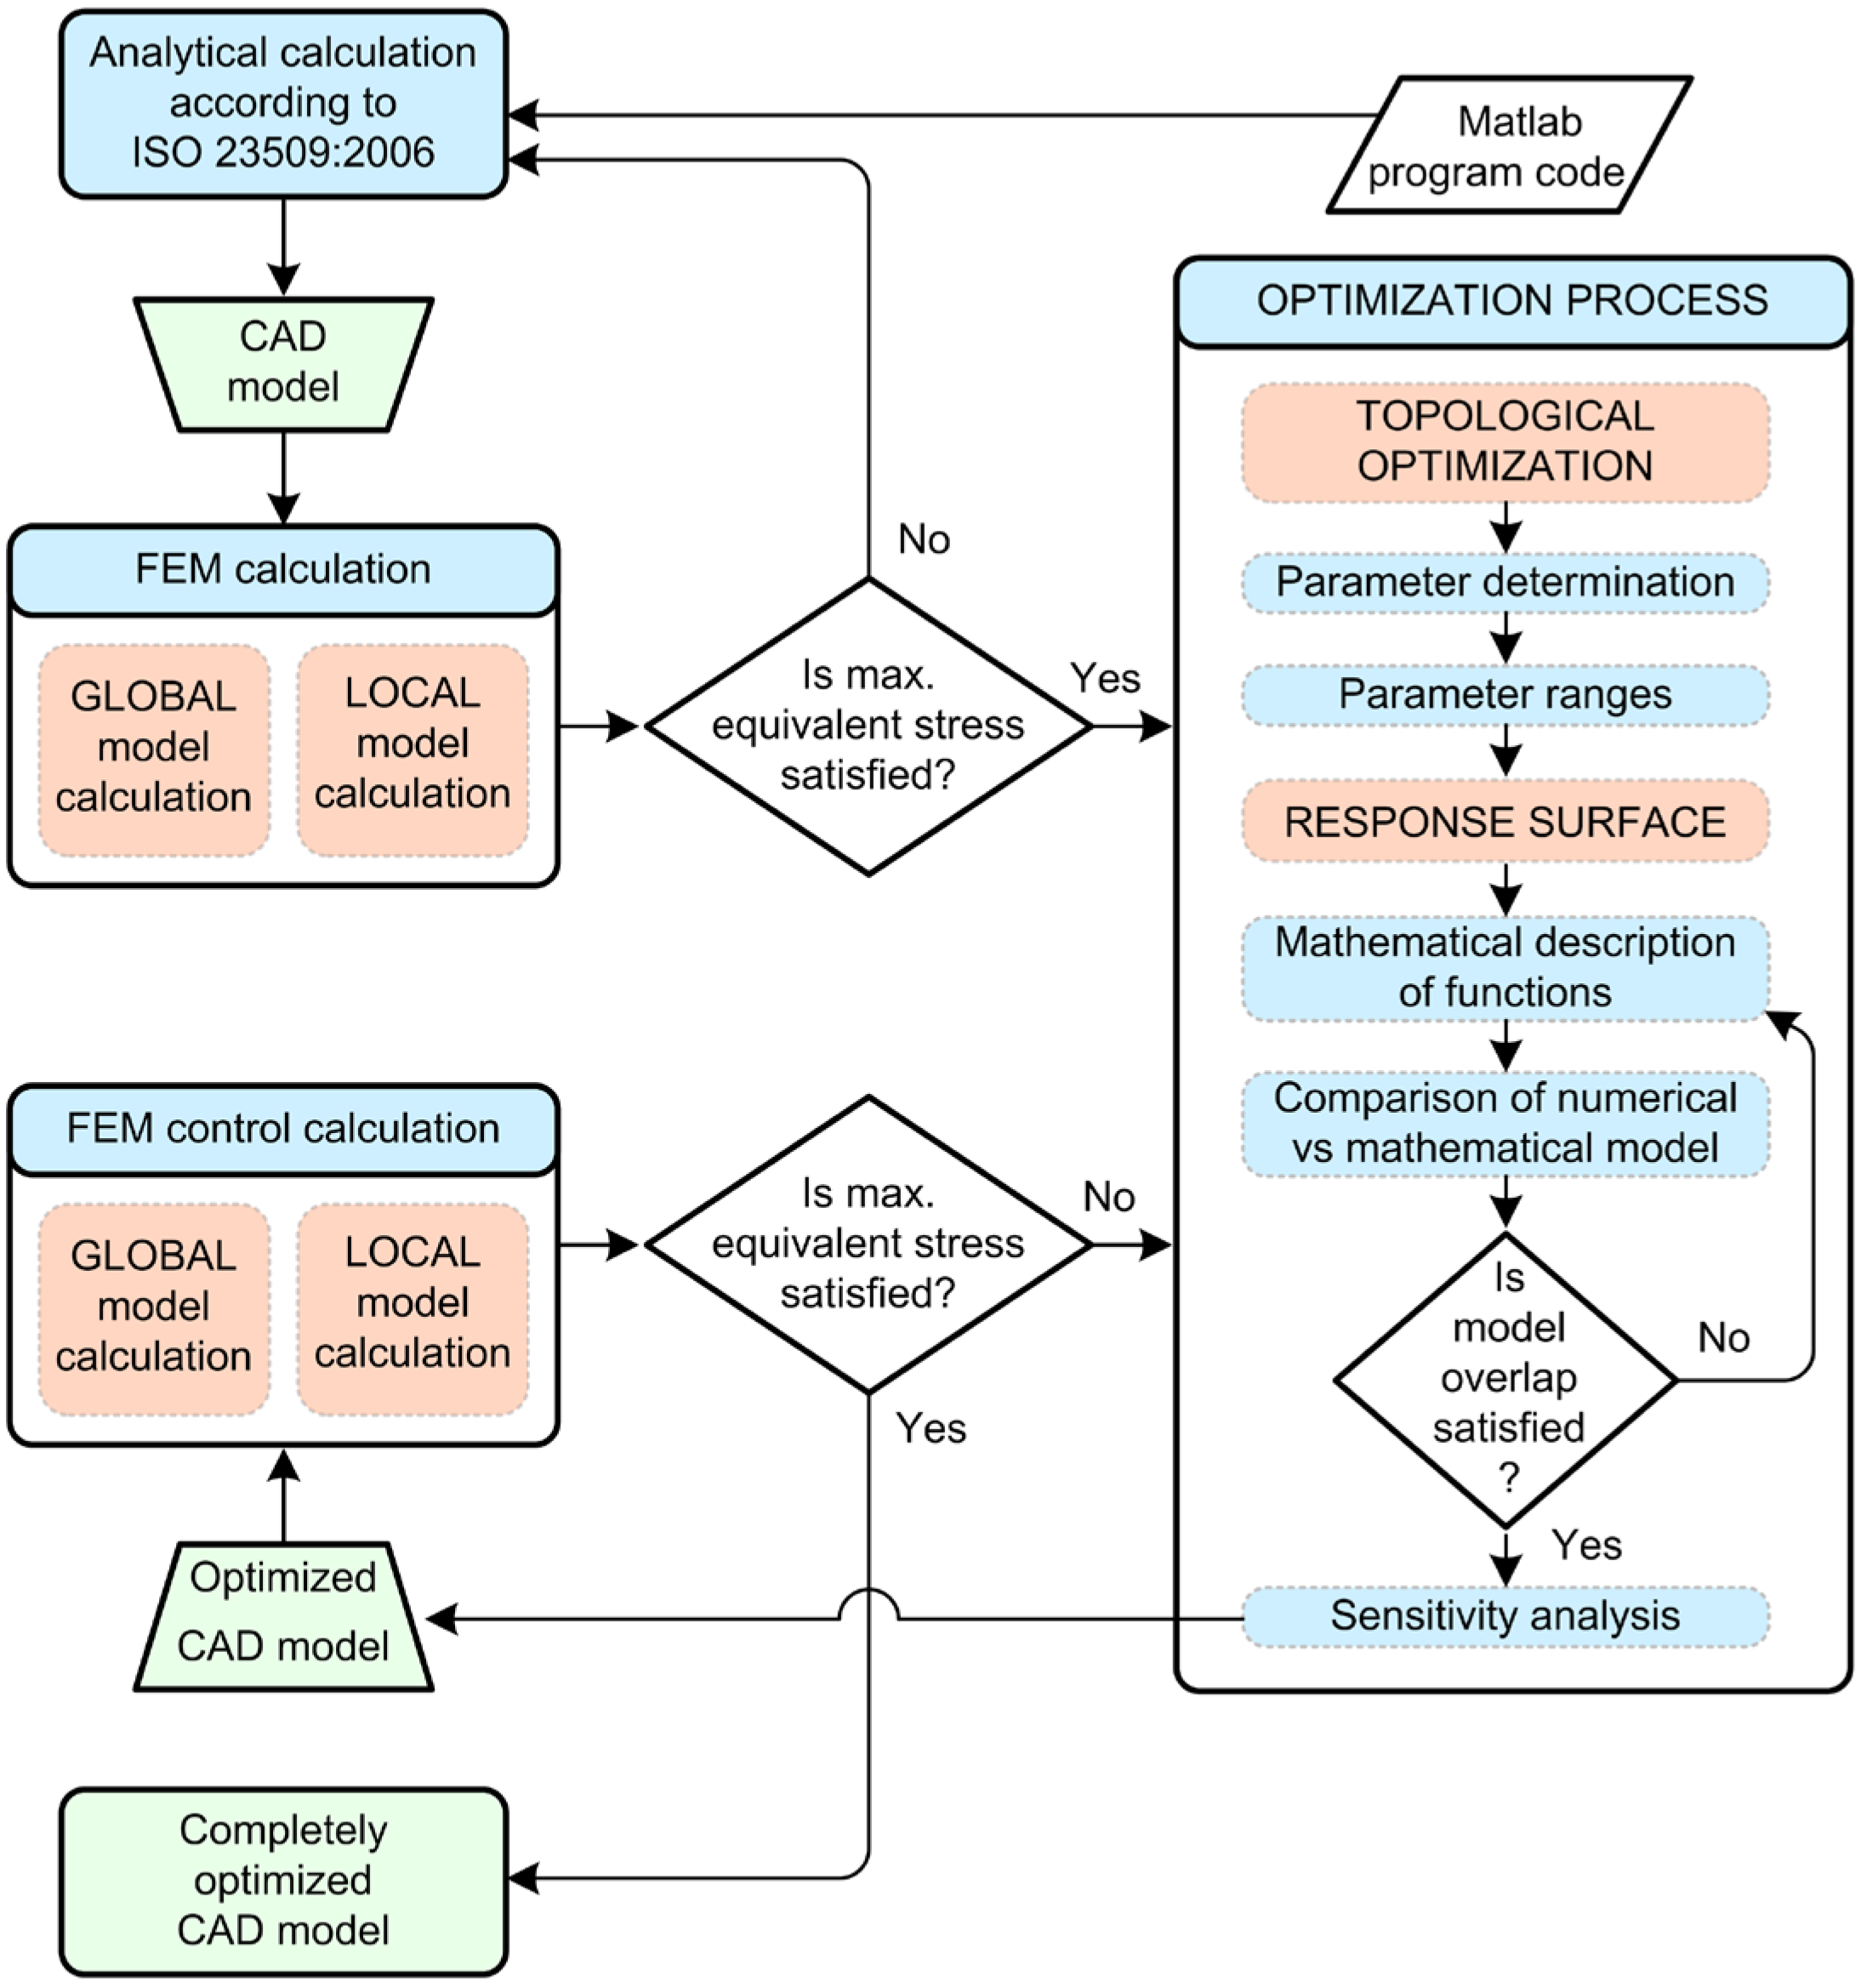
2. Proposed Methodology and Research Structure

The design of the ODT is presented in Section 3. The calculation of hypoid bevel gears (pinion and ring gear), according to ISO 23509:2006, is presented in Section 3.3. The differential mechanism, which enables a different number of revolutions of the output shafts, is made using two suns and four planetary bevel gears. Calculation of the sun and planetary bevel gears is presented in Section 3.4. According to the mentioned norm, a program code was created in Matlab 2022a, which was used for the calculation of the mentioned gears.
The previously made calculation, for validation purposes using global–local FEM static structural approach, was numerically analyzed. This calculation is described in Section 4. Optimization of the ODT design elements is presented in Section 5. Ring gear design parameters determination was performed using the TOM (Section 5.1). By applying the RSM, a mathematical model for overall mass reduction of the ODT-optimized design elements and partial mass reductions of the individual optimized structural elements was developed in Section 5.2. Through the central composite design of the experiment were analyzed values of the determined general design parameters of the ODT design elements. Local sensitivity analysis and the impact of the general design parameters on the overall mass and partial mass response variables were analyzed in Section 5.3. According to the obtained optimal values of the general design parameters, which satisfy mathematical equations of the objective functions, a numerical control calculation of the optimized design elements of the ODT was made in Section 6. By applying the global–local FEM static structural numerical model, a stress analysis was performed, according to the von Mises maximum equivalent stresses, of the optimized structural elements.
The proposed methodology for the optimization of the ODT design elements is presented through the algorithm in Figure 1.
The algorithm connects the design of the ODT according to ISO 23509:2006, numerical calculation of design elements (ring gear and drive shaft with pinion) using the FEM numerical static analysis and numerical FEM static structural global–local model analysis of pinion and ring gear, TOM and obtained results of the FEM analysis in the finding of the global design parameters. Also, the proposed algorithm uses the application of RSM in the creation of a mathematical model (objective function of overall mass reduction and two partial mass reduction functions). A comparison between the predictions of the mass reduction functions of the mathematical model and the numerical model was generated. Using the global–local static structural numerical FEM approach, a control numerical calculation of the optimized design elements was performed, in order to control the accuracy and the reliability of the obtained mathematical model.

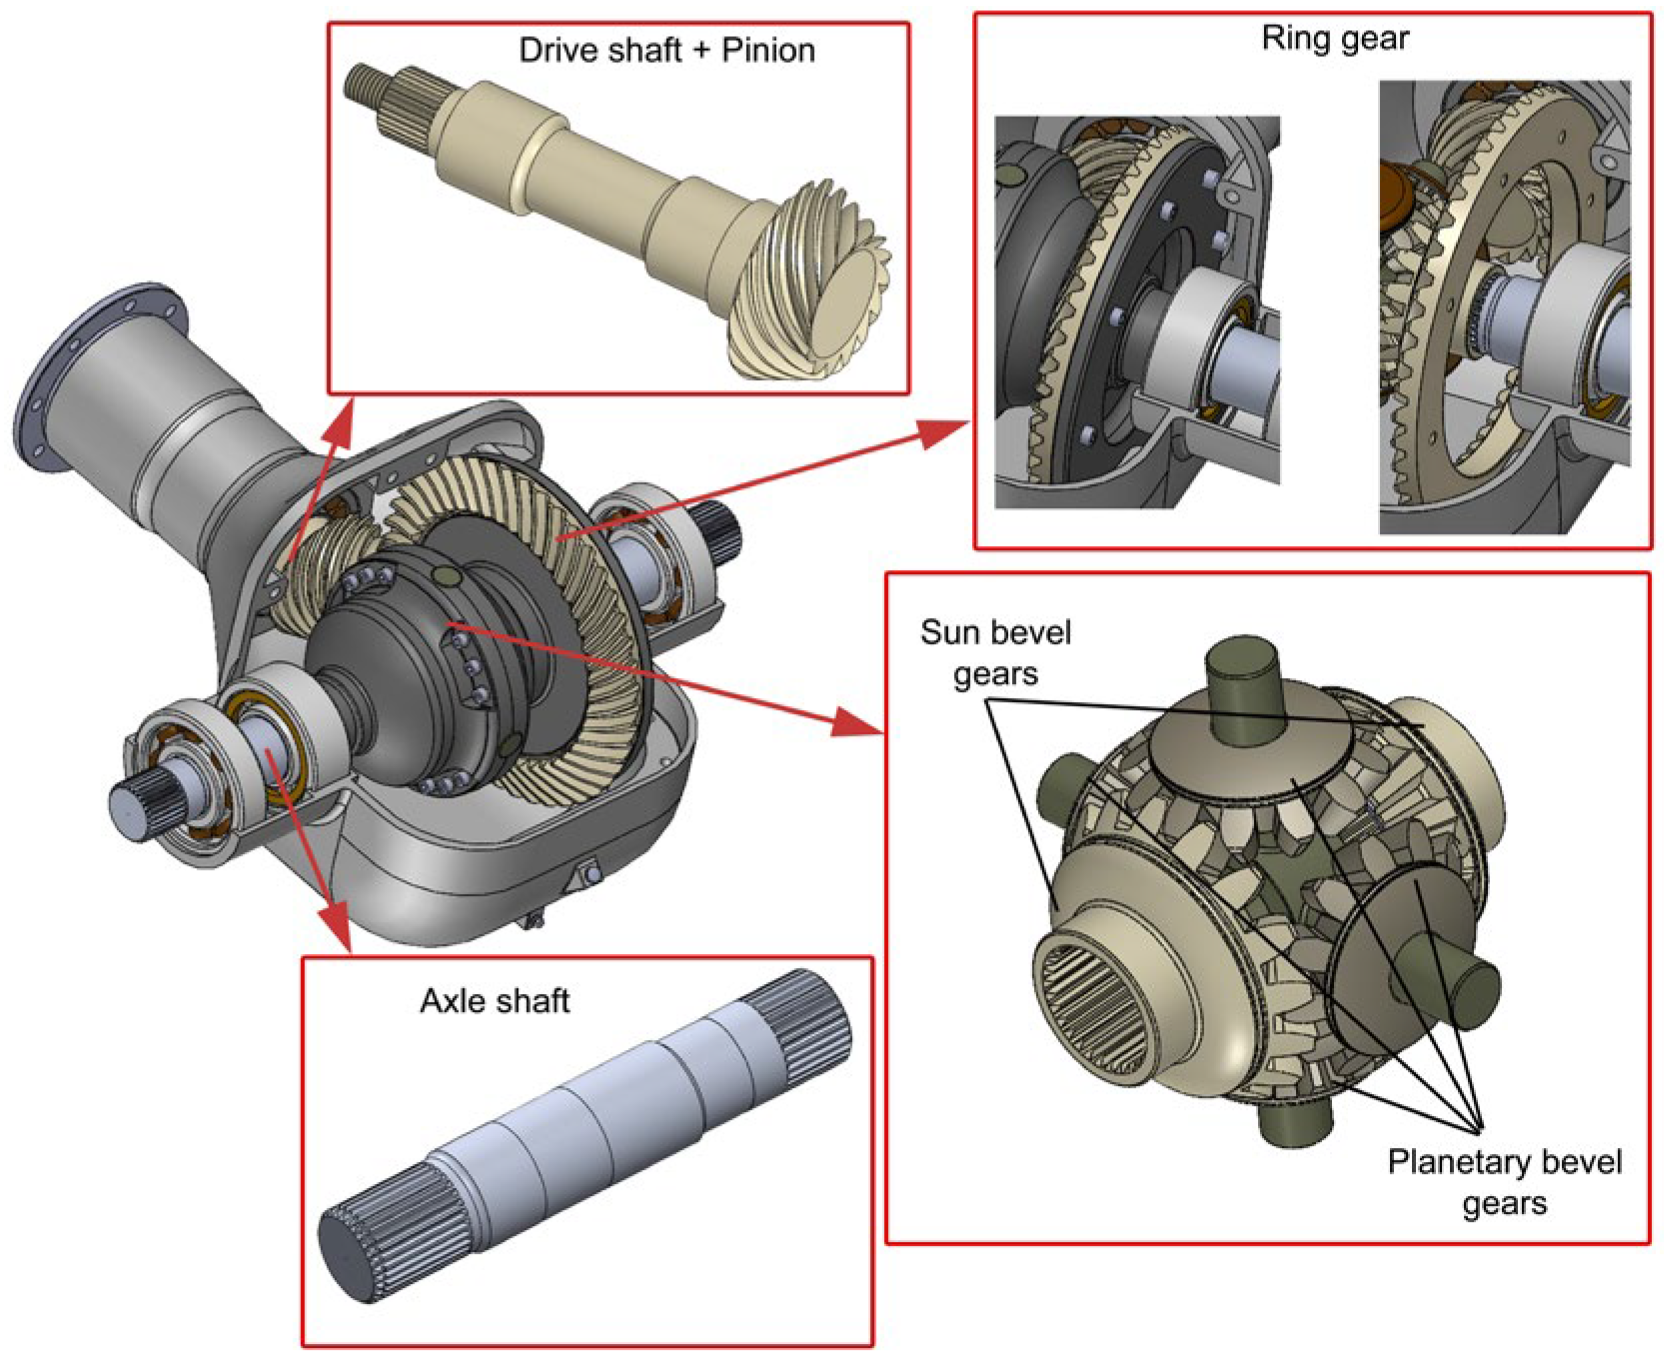
3. Design of the ODT

3.1. Design Requirements of the ODT

Design requirements related to the differential transmission can be divided into two categories of requirements: requirements related to the macro geometry and requirements related to the vehicle. These requirements have an equally important influence on the structural properties of the differential transmission. The initial requirements related to macro geometry are the material of the pinion hypoid bevel gear—steel 17CrNi6; material of the driven hypoid ring bevel gear—steel 15CrNi6; material of the sun and planetary bevel gears—steel 15CrNi6; teeth number of planetary bevel gears z3 = 12; teeth number of sun bevel gears z4 = 16 and gearbox transmission ratios (i1 = 3.5, i2 = 2.1, i3 = 1.32, i4 = 0.97, i5 = 0.76, iR = 3.55). Also, the degrees of efficiency of the elements of the kinematic chain (Figure 2) are the efficiency of the gearbox ηg = 0.96, efficiency of the cardan shaft ηc = 0.98 and efficiency of the open differential ηd = 0.97. Tire dimensions 205/55 R16. Since the drive shaft and pinion are made of one piece and form one design element, the drive shaft is made of the same steel as the pinion. The driven shaft is made of St 70-2 steel. The design requirements of the vehicle for which it is necessary to design a differential transmission are shown in Table 1.

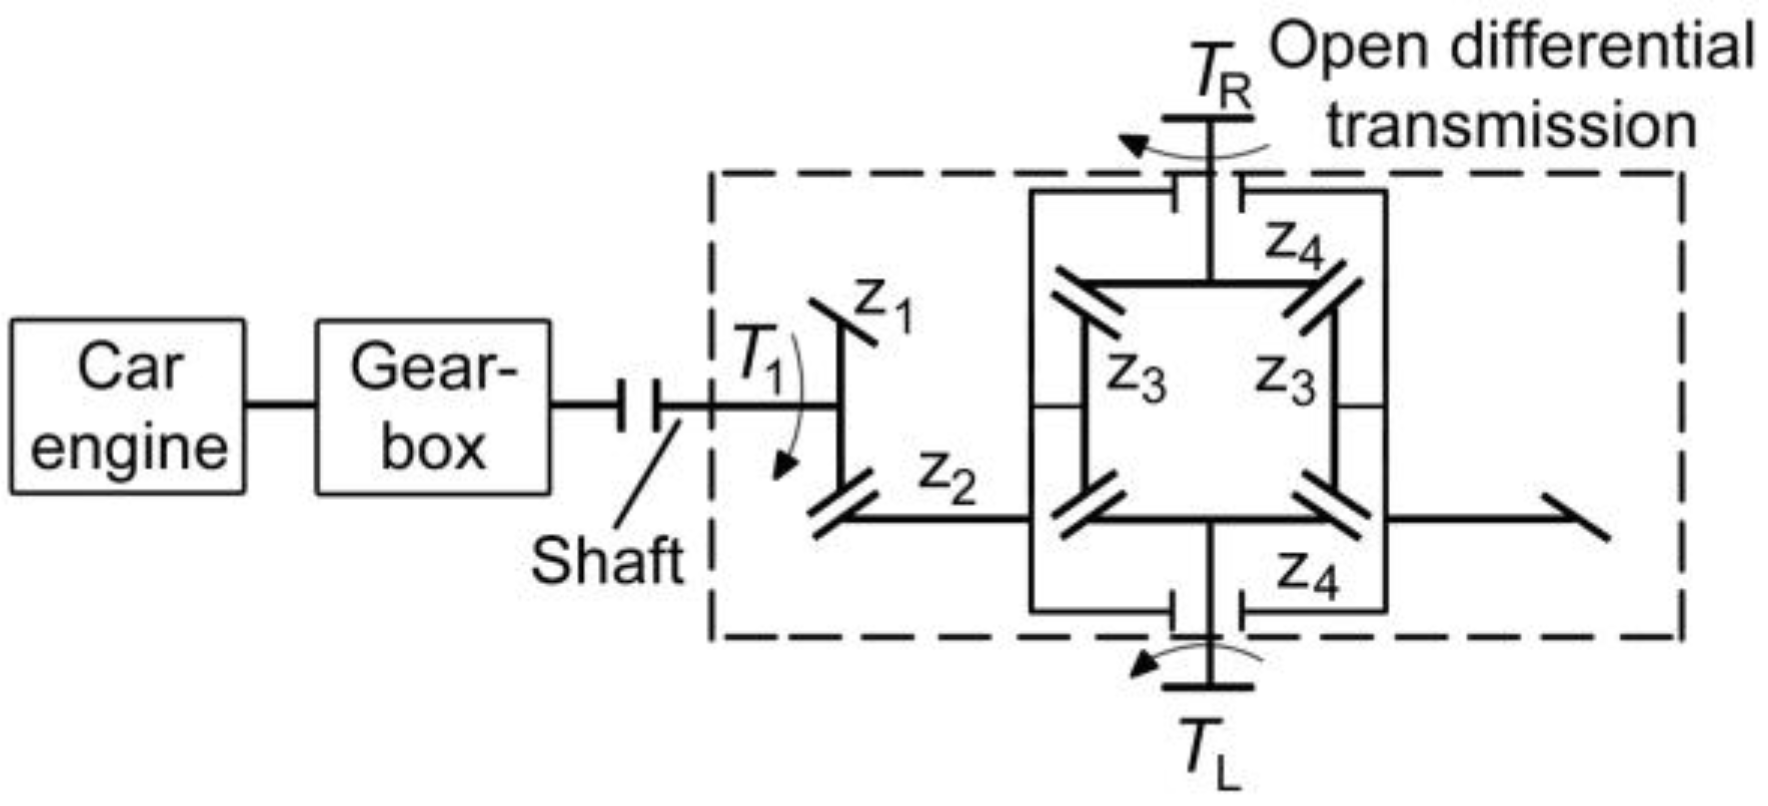
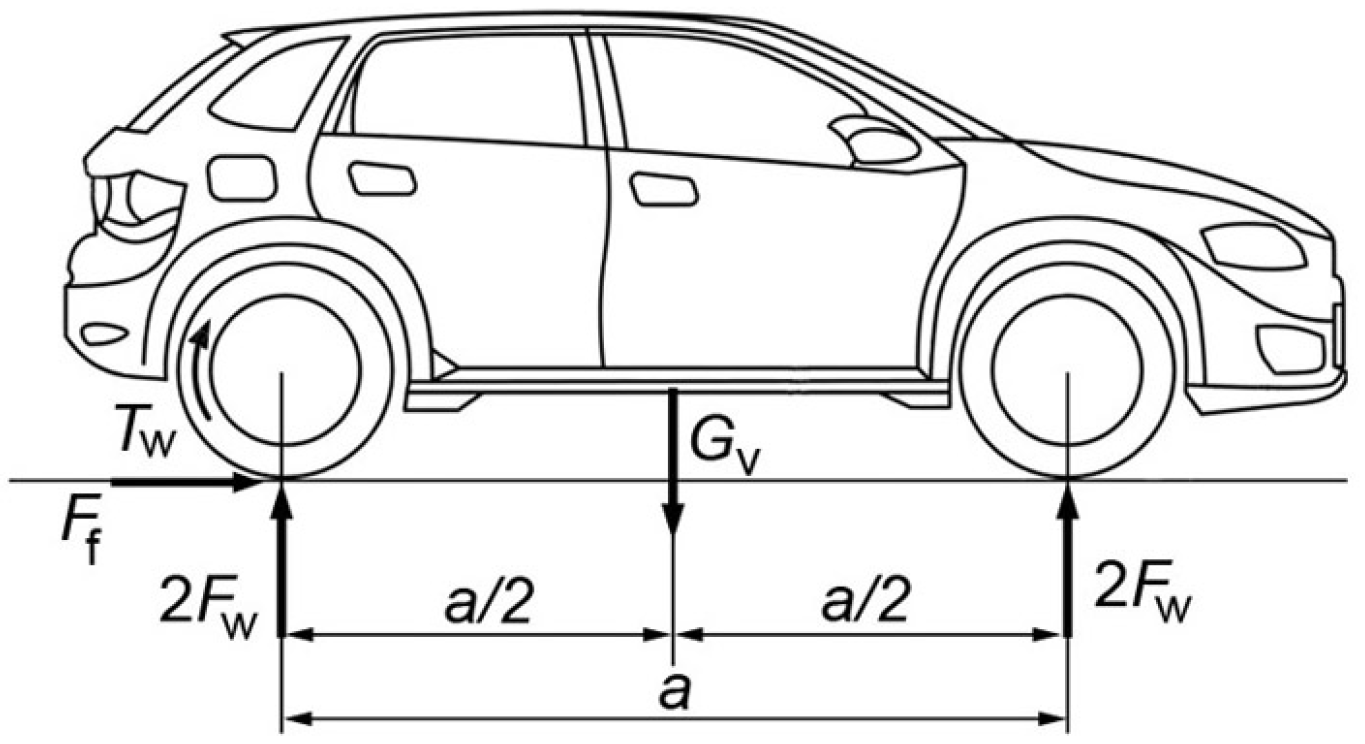
3.2. Loads on the Input and Output Side of the Differential Transmission

ODT (Figure 2) is intended for road vehicles with rear drive. In the calculated load on the output side of the transmission, according to the specified standard ISO 23509:2006 [35], this standard does not cover and analyze the detailed influence of tire characteristics on transmission properties. This influence manifests in the effect of longitudinal, lateral and combined slippage on the form of traction/braking force [37]. Loads on the input side required for designing a differential transmission are determined by the technical characteristics of the drive machine, and their values are listed in Table 1.
The engine torque is transmitted to the hypoid gears of the differential transmission from the engine shaft to the gearbox, cardan shaft and drive shaft (Figure 2). For the number of revolutions nTmax (Table 1) at which Tmax (Table 1) is achieved, the power on the motor output shaft is determined by the expression:
P O   max = T max · ω max = T max · π · n Tmax 30 = 56939.8   W = 56.94   kW .
Due to losses in the kinematic chain (Figure 2), the power delivered to the drive bevel gear is determined by the expression:
P 1 = P o   max · η g · η c .
The calculated amount of power P1 is presented in Table 1. Input torque to the differential transmission is determined by the expression:
T 1 = P 1 ω 1 ,
where
ω 1 = ω max i 1 .
The calculated amount of power T1 is presented in Table 1.
Reaction force in the wheel (Fw) and friction force (Ff) act, through the drive wheel, from the outside on the differential transmission (Figure 3). Reaction force in the wheel is determined by the expression:
F w = G v 4 ,
where Gv is the vehicle weight force calculated as a product of the maximum vehicle mass (Table 1) and the acceleration of the earth’s gravity (g = 9.81 m/s2). The calculated amount of the reaction force is presented in Table 2.
The friction force is determined for the case of wheel contact with asphalt according to the expression:
F f = F w · μ ,
where µ represents friction factor for asphalt surface (µ = 0.9). The calculated amount of the friction force is presented in Table 2.
Traction force is determined by the expression:
F TR = 2 · F f .
The calculated amount of the traction force is presented in Table 2.
During straight line movement of the vehicle on a dry surface, with an ODT, the torque on the drive wheels is equally divided between the left and right wheel (Tw = TL = TR). The torque of the drive wheels is determined by the expression:
T w = T L = T R = F TR 2 · r d = 1827.206     Nm .
where TL and TR are the torques on the left and right drive wheels, rd is the dynamic wheel radius. Since the dimension of the tire is determined by the request (205/55 R16), the dynamic wheel radius is 97% of the length of the actual wheel radius. Its calculation amount is shown in Table 1.
Therefore, the torque of the hypoid ring bevel gear (T2), which was obtained without including the losses of the kinematic chain, is equal to the sum of the torques of the left (TL) and of the right (TR) drive wheels. This torque is determined by the expression:
T 2 = T L + T R = 3654.412     Nm .
In order to obtain the real value of the torque of the hypoid ring bevel gear (T2), it is necessary to include in the calculation the losses of the open differential transmission, i.e., efficiency of the open differential (ηd). For the determination of T2, it is necessary to determine the output power of the differential transmission. This calculation includes the efficiency of the open differential (ηd). The output power of the differential transmission is determined by the expression:
P 2 = P 1 · η d .
The calculated amount of P2 is presented in Table 2. Hence, the torque of the hypoid ring bevel gear is determined by the expression:
T 2 = P 2 ω 2 ,
where ω2 is the angular velocity of the hypoid ring bevel gear. The angular velocity of the hypoid ring bevel gear is determined by the expression:
ω 2 = ω 1 i d = 14.568     rad / s ,
where id is the transmission ratio of the differential transmission (Table 2). The transmission ratio of the differential transmission is determined by the expression:
i d = T 2 T 1 .
The final amount of torque T2 is shown in Table 2. Also, the final amounts of the torque on the drive wheels are equally divided between the left and right wheels (Tw = TL = TR = T2/2). Their calculated amounts are presented in Table 2.
Rolling resistance force, rising resistance force and vehicle’s inertial force, together determine the total resistance force of the driven machine. These forces represent loads on the output side of the differential transmission. The sum of these forces represents the total resistance force of the driven machine (FTRD), whose calculation value is presented in Table 2. In the calculation of the total resistance force, the geometry of the vehicle body is not defined, and therefore air resistance is not included in this calculation [38]. In order to achieve the movement of the vehicle, the amount of the traction force (FTR) should be greater than the amount of the total resistance force (FTRD). The values of these forces are presented in Table 2.
The rolling resistance force is the result of tire deformation at the point of contact with the ground. This force is calculated by the expression:
F RO = f RO · G v ,
where fRO is the rolling resistance factor. The amount of this factor for rolling on the asphalt is fRO = 0.02. The calculated amount of this force is presented in Table 2.
The rising resistance force is a component of the weight force vector that acts in the opposite direction to the motion of the vehicle, at the moment when the vehicle climbs the slope. This force is calculated by the expression:
F RI = G V · sin γ ,
where γ is the rising angle (slope angle) for road vehicles (γ = 6°). The calculated amount of this force is presented in Table 2.
The vehicle’s inertial force is calculated by the expression:
F IN = m v , max · a v · ψ ,
where av is vehicle acceleration (Table 1) and ψ is a contribution factor of rotating masses for the first degree of transmission. The amount of this factor for this calculation is ψ = 1.165. The calculated amount of this force is presented in Table 2.

3.3. Hypoid Bevel Gears Calculation

3.3.1. Dimensioning of the Driving and Driven Hypoid Bevel Gears

The hypoid gear pair consists of two bevel gears (z1, z2) that are in mutual grip (Figure 2). The pinion (z1) is a part of the drive shaft of the differential transmission. By iterative calculation, variables needed to design the pinion and driven hypoid bevel gear (ring gear) were obtained. Iteration is carried out until the following condition is satisfied reached:
R mint R m 1 < 0.0001 · R m 1 ,
where Rm1 is the mean cone distance of the pinion.
Rm1 is calculated according to the expression:
R m 1 = d m 1 2 · sin δ 1 ,
where dm1 is pinion mean pitch diameter. Diameter dm1 is determined by the expression:
d m 1 = d m 2 i d · F .
Ring gear mean pitch diameter is determined by the expression:
d m 2 = d e 2 b 2 · sin δ 2 .
Rmint is determined using the following expression:
R mint = A 3 · A 4 A 5 · A 6 + A 3 · A 7 ,
where A3, A4, A5, A6 and A7 are intermediate variables.
Before the first iteration, the value of the hypoid dimensional factor is F = 1. Also, before the first iteration, the amount of ring gear pitch angle is
δ 2 = tan 1 sin Σ F i d + cos Σ = 73.07 ° ,
where Σ is the shaft angle. The amount of this angle is 90°.
The pinion gear pitch angle is
δ 1 = Σ δ 2 = 16.93 ° .
Values of δ1 and δ2 obtained by Equations (21) and (22) are added in the first iteration, and their new values will be determined in the calculation of the first iteration (Table 3). Other variables and their values, which were determined by the iteration calculation, are presented in Table 3. Values determined in the last iteration represent the final solutions of the iterative calculation.
The control calculation is determined by the final values of the following three geometric quantities, which are shown in Table 4. Pinion offset angle in the axial plane:
ς m = sin 1 2 · a d m 2 + d m 1 · cos δ 2 cos δ 1 .
Pinion offset angle in the pitch plane:
ς mp = sin 1 sin ς m · sin Σ cos δ 1 .
Mean normal module:
m n = 2 · R m 2 · sin δ 2 · cos β m 2 z 2 .
The geometric design of the pinion and ring gear, using a CAD modeler, requires the calculation of the axial distances of the pinion, crossing point to calculation point along the pinion/ring gear axis and mean normal pressure angle. Calculation of these quantities was made using the following expressions, and calculation values are shown in Table 4.
Limit pressure angle:
α lim = tan 1 tan δ 1 · tan δ 2 cos ς mp · R m 1 · sin β m 1 R m 2 · sin β m 2 R m 1 · tan δ 1 + R m 2 · tan δ 2 .
Crossing point to calculation point along ring gear axis:
t zm 2 = d m 1 · sin δ 2 2 · cos δ 1 a · tan Δ Σ tan ς m .
Crossing point to calculation point along pinion axis:
t zm 1 = d m 2 2 · cos ς m · cos Δ Σ t zm 2 · sin Δ Σ .
According to the calculated values of the geometric quantities from Table 3 and Table 4, pinion and ring gear were constructed (Figure 4).

3.3.2. Stress Calculation of Hypoid Bevel Gears in the Tooth Root and Tooth Face Flank

Stress calculation in the tooth root was carried out for the most unfavorable case of tooth loading, i.e., when the force acts on the tooth crown. Loadability of the flanks represents the limit up to which the flanks of the teeth can be loaded without causing damage to the flanks of the teeth known as pitting [39,40]. The material of the pinion gear is 17CrNi6 and the selected material for ring gear is 15CrNi6. For these materials, the amount of permanent dynamic strength for tooth root is σFlim1 = σFlim2 = 500 MPa and amount of permanent dynamic strength for tooth face flank is σHlim1 = σHlim2 = 1630 MPa.
Allowed stress on pinion tooth root is determined by the expression:
σ FP 1 = σ Flim 1 S Fmin · K FX · Y S ,
where SFmin is the minimum safety factor against root breakage, KFX is size influence factor and YS is notch action factor.
Bending stress on pinion tooth root is
σ F 1 = F mt 1 b 1 · m mn · Y F · Y ε v · Y β · K F α · K F β < σ FP 1 ,
where Fmt1 is a tangential force on the dividing circle, YF is tooth shape factor, YεV is load share factor of auxiliary gears, Yβ is impact factor of tooth locking on the stress distribution in the root, K is load distribution factor and K is load distribution factor along the length of the tooth flank. Solutions obtained by expressions (29) and (30) are shown in Table 5.
Allowed Hertzian stress on pinion tooth face flank, is determined by the expression:
σ HP 1 = σ Hlim 1 S Hmin · K L · K HX · Z V · Z N ,
where SHmin is minimum safety factor against tooth flank fracture, KL is influence factor of lubricating oil, KHX is factor of dimensions that influence the load capacity of the tooth flank, ZV is speed influence factor and ZN is service life factor.
Hertzian stress in the kinematic pole of pinion is determined by the expression:
σ H 1 = Z HV · Z M · Z ε V · F mt 1 b 1 · d m 1 · i d 2 + 1 i d · K H α · K H β < σ HP 1 ,
where ZHV is tooth shape factor, ZM is material factor, ZεV is coverage factor, K is load distribution factor and K is load distribution factor along the length of the tooth flank. Solutions obtained by expressions (31) and (32) are shown in Table 5.
Allowed stress on ring gear tooth root and bending stress on ring gear tooth root are determined according to expressions (29) and (30). Solutions for the ring gear, obtained using these expressions, are shown in Table 5.
The allowed Hertzian stress on ring gear tooth face flank and Hertzian stress in the kinematic pole are determined according to expressions (31) and (32). Solutions for the ring gear, obtained using these expressions, are shown in Table 5. Table 5 shows how the pinion and ring hypoid bevel gear meet conditions from Equations (30) and (32). It can be concluded that both hypoid bevel gears can withstand maximum stresses in the tooth root and on the tooth face flank.

3.4. Sun and Planetary Bevel Gears Calculation

The differential mechanism, which enables a different number of revolutions of the output shafts (axle shafts), is made using two sun and four planetary bevel gears (Figure 4). These six gears are made with straight teeth from steel 15CrNi6.
The calculation of the bevel gears is similar to the calculation of the spur gears. With this calculation, the intermediate auxiliary gear has the same width as the bevel gear [41]. For this reason, the load on the bevel gears is realized according to the mean values of the auxiliary gears. The auxiliary gears are the virtual spur gears.
Module calculations were carried out with regard to the loadability of the tooth root and with regard to the loadability of the tooth flank.
Module considering load of tooth root is
m r 2 · T max · cos δ 3 z 3 · λ · σ FP 3 · Y F 3 .
Module considering load of tooth face flank is
m f 2 · u V + 1 u V · T max · cos 2 δ 3 z 3 2 · λ · σ HP 3 2 · Z M 2 · Z HV 2 · Z ε V 2 3 .
According to expressions (33) and (34), the following modulus values were obtained: mr = 6.637 mm and mf = 8.49 mm. Between these two modules, for the further calculation of the bevel gears, was adopted a module m = mf = 8.5 mm.

3.4.1. Dimensioning of the Planetary and Sun Bevel Gears

Dimensioning includes the calculation of diameters, teeth width, teeth height and clearance. Values obtained by calculation are shown in Table 6. Expressions according to which the geometric quantities of the sun and planetary bevel gears are designed and presented in [35].

3.4.2. Stress Calculation of Planetary and Sun Bevel Gears in the Tooth Root and the Tooth Face Flank

Allowed stress on planetary tooth root is determined by the expression:
σ FP 3 = σ Flim 3 S Fmin · Y S · K FX · Y N · Y R ,
where YN is service life factor, YR is roughness factor, YS and KFX are factors according to [35].
Stress on planetary tooth root is
σ F 3 = F mt 3 b · m m · Y F · Y ε V · K F α · K F β < σ FP 3 ,
where Fmt3 is tangential force on the middle pitch circle, YF, K, K and YεV are factors according to [35].
Allowed Hertzian stress on planetary tooth face flank, is determined by the expression:
σ HP 3 = σ Hlim 3 S Hlim · K L · K HX · Z R · Z V · Z N · Z W ,
where SHlim is minimum anti-pitting factor, ZR is roughness influence factor, ZW is influence factor of flank hardening, KL, KHX, ZV and ZN are factors according to [35].
Hertzian stress is determined by the expression:
σ H 3 = Z M · Z HV · Z ε V · u v + 1 u v · F mt 3 b · d vm 3 · K H α · K H β < σ HP 3 ,
where ZHV, ZM, ZεV, K and K are factors according to [35].
Solutions for the planetary bevel gear, obtained by expressions (35)–(38), are shown in Table 7.
Allowed stress on sun tooth root and stress on sun tooth root are determined according to expressions (35) and (36). Solutions for the sun bevel gear, obtained by these expressions, are shown in Table 7.
Allowed Hertzian stress on sun tooth face flank and Hertzian stress are determined according to expressions (37) and (38). Solutions for the sun bevel gear, obtained using these expressions, are shown in Table 7. Table 7 shows how the planetary and sun bevel gear satisfies conditions from Equations (36) and (38). In accordance with this calculation, planetary and sun bevel gears were designed (Figure 4).

4. Numerical Analysis of Differential Transmission

In this phase of investigation, a static structural numerical analysis of the ODT, using the finite element method, is performed. ANSYS Workbench 2022 software [42] was used for the global–local FEM approach [36], which analyzes both global models as well as submodels where necessary. Using FEM, the total displacements and equivalent von Mises stresses of the two structural elements of the transmission are determined. Since, for design reasons, the pinion gear and the drive shaft are designed as one structural element, the numerical calculation includes analysis of the ring gear and the drive shaft together with the pinion (Figure 4). The results of the equivalent stresses according to von Mises obtained by the numerical calculation were compared with the analytical results according to ISO 23509:2006 [35] to verify the validity of the analytical calculation.

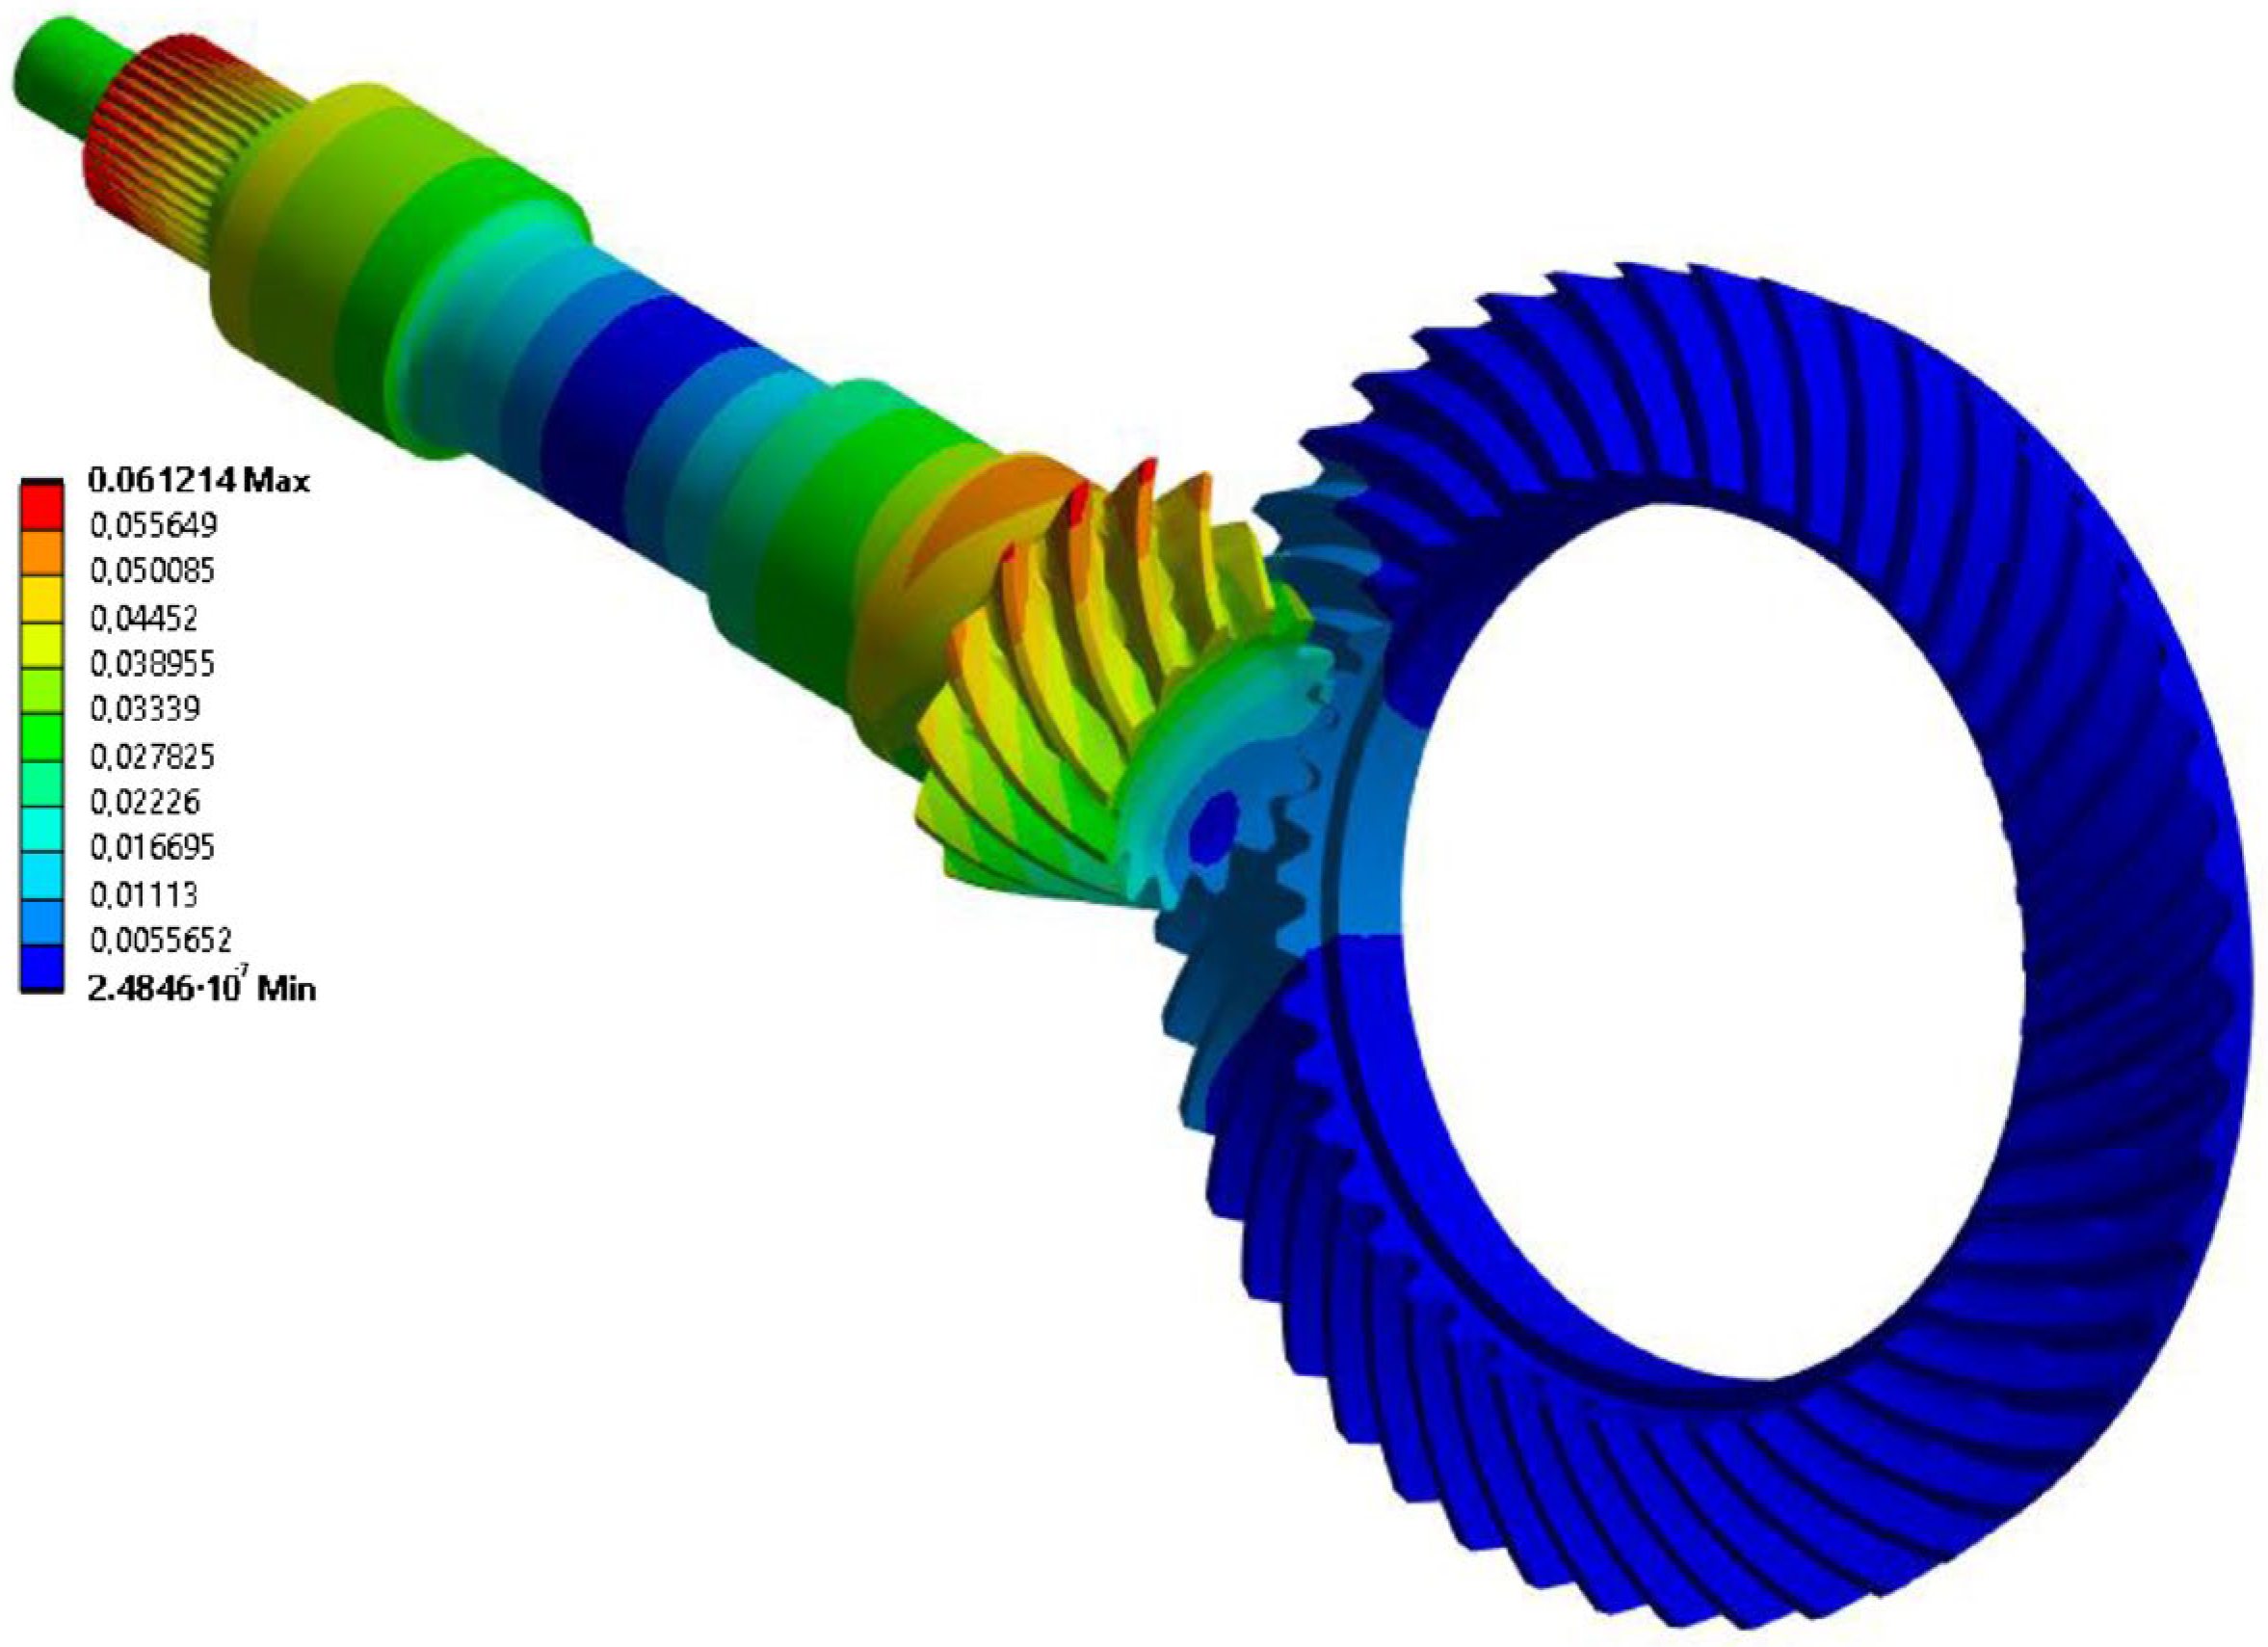
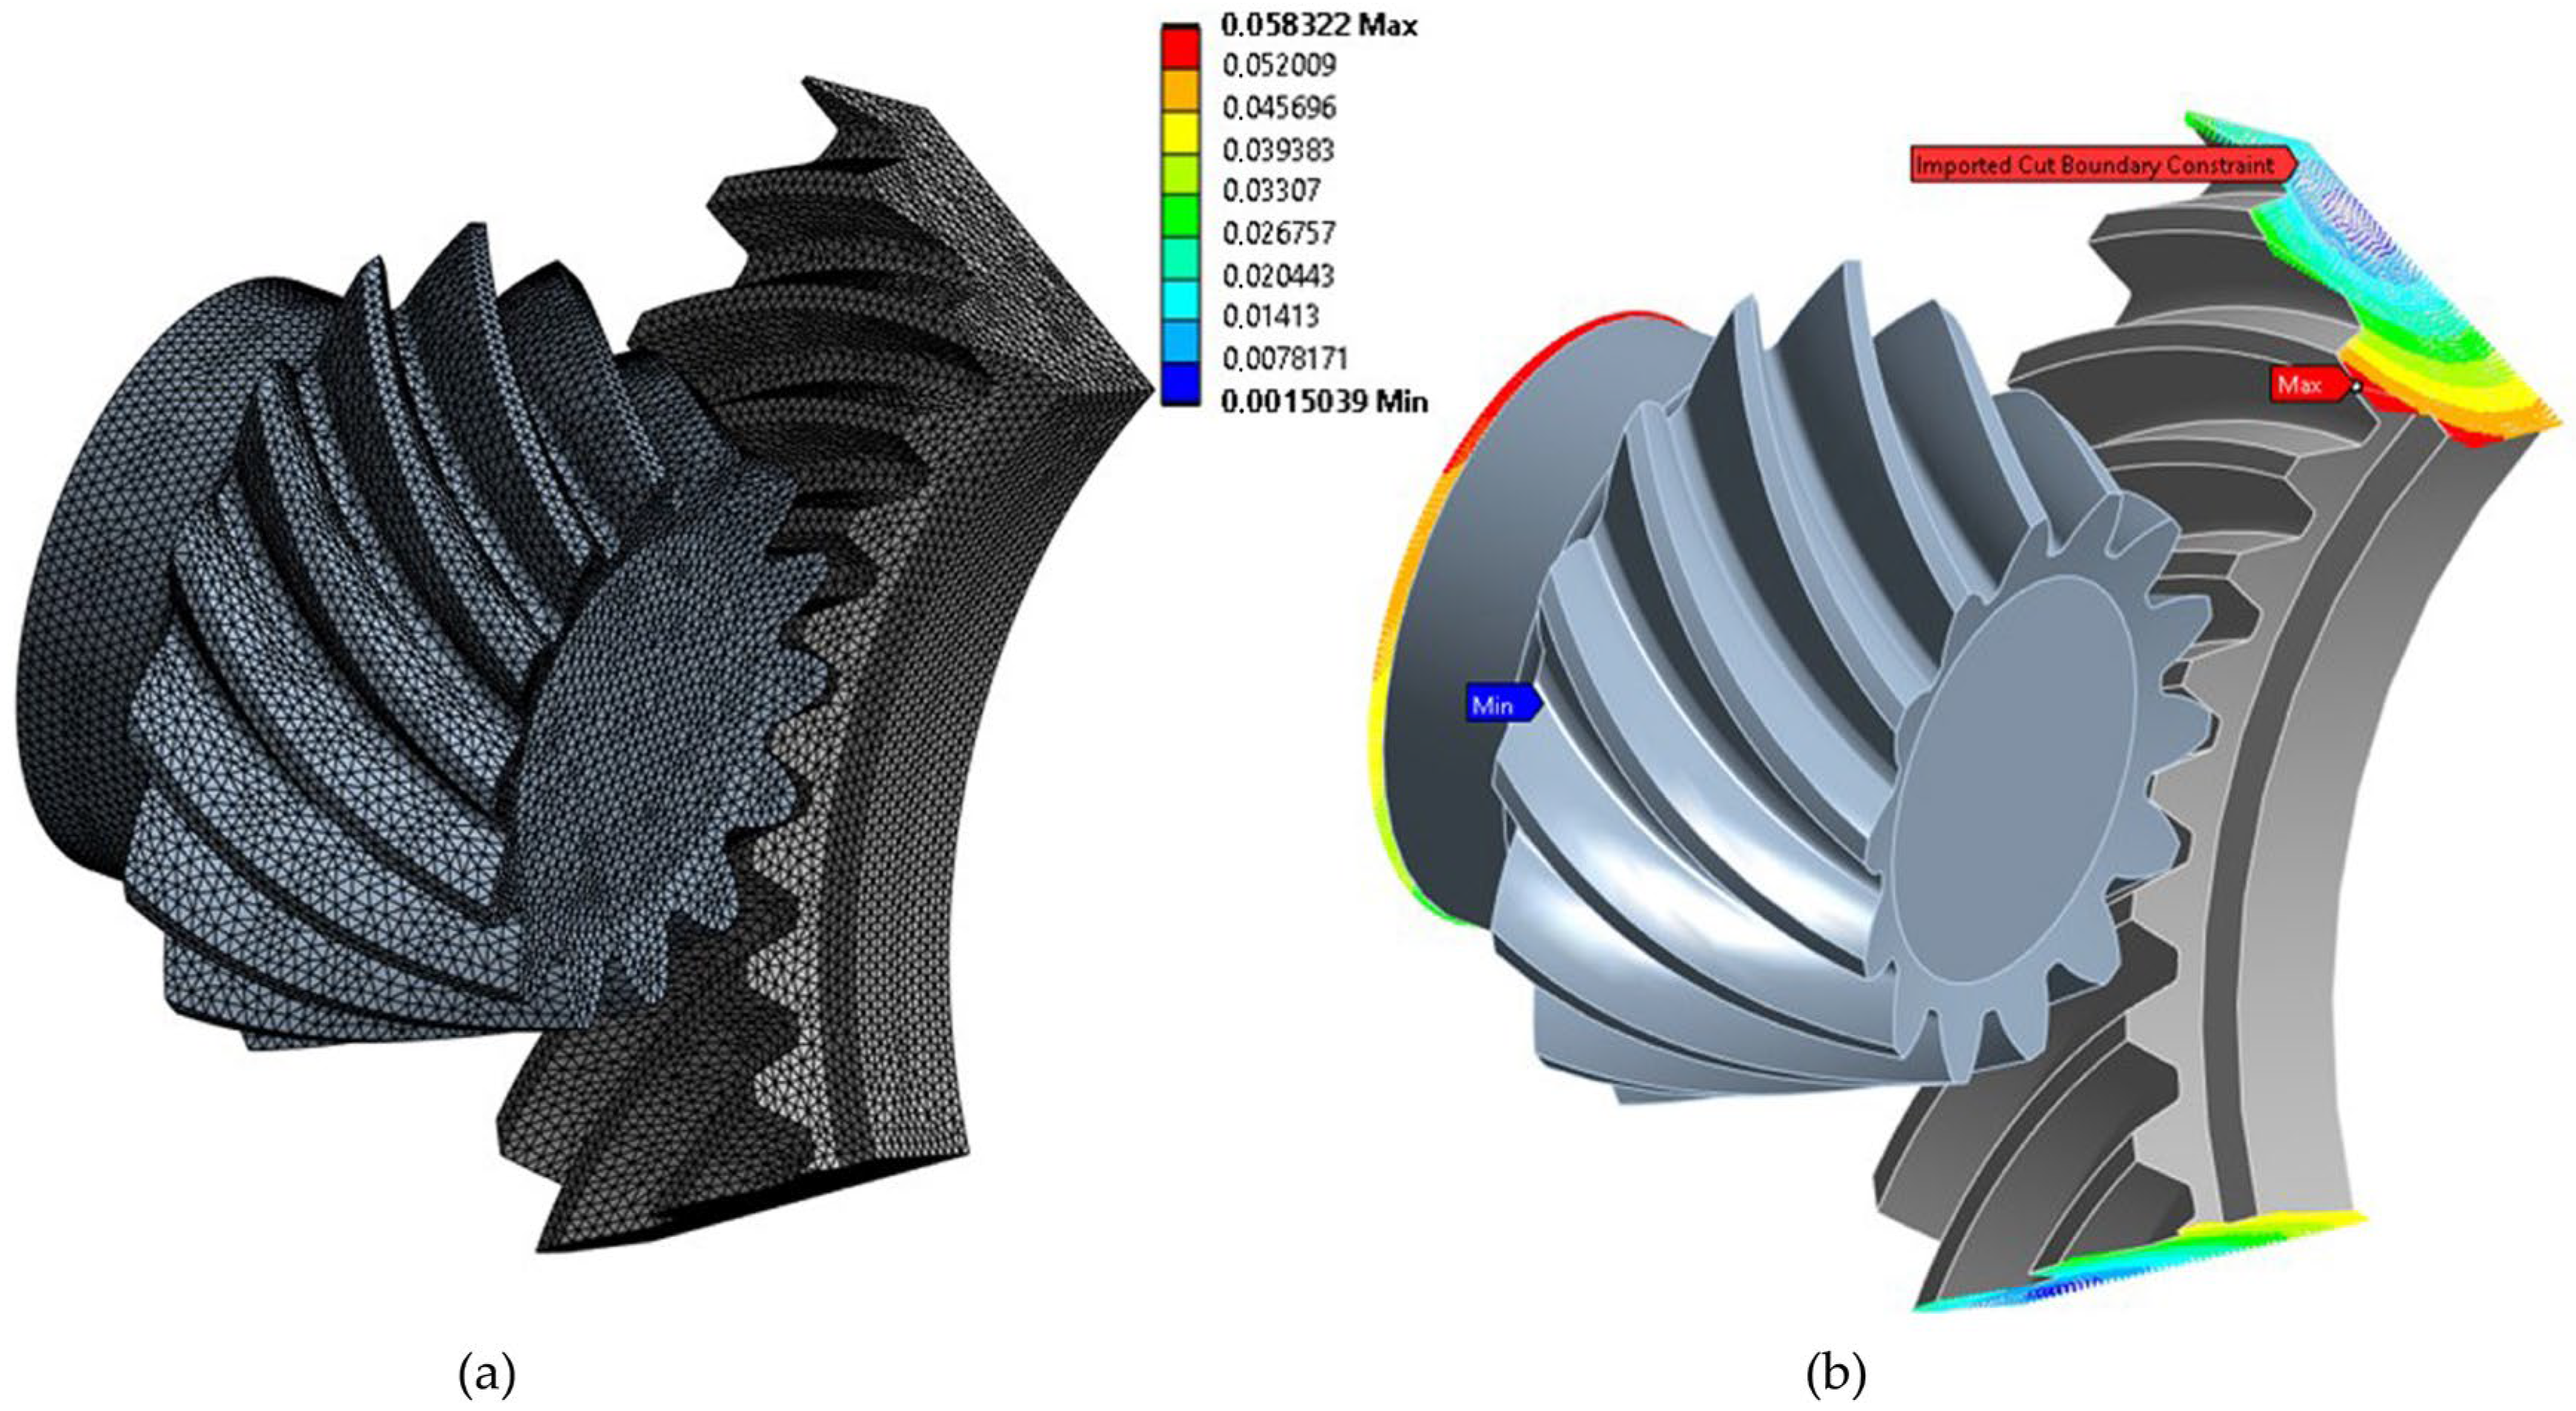
4.1. Analysis of Stress and Displacement of Bevel Gear and Pinion Gear

Since the pinion and bevel gear are in contact, it was necessary to include a contact problem with the presence of friction as a nonlinear problem in the finite element analysis. Considering the complexity of the geometry, the meshing process requires a larger number of finite elements. A large number of elements has a direct impact on increasing the duration of the numerical analysis and later on the computational time for the optimization process itself. In order to avoid the mentioned problem, a coarser mesh of the finite elements of the gears in engagement was created as a global model, which is used to determine the displacement fields. Later, the submodeling technique was applied, where a finer mesh could be used in the area of the submodel, mainly at the point of contact, i.e., where stress concentrations occur. The displacement field of the global model is used as a boundary condition for the submodel. The contacts are defined at the contact surfaces between the gear teeth of the bevel gear and the pinion gear (Figure 5).
The global model was meshed with second-order SOLID187 tetrahedral finite elements. The size of the finite elements was set to 2 mm and scaled to 0.25 mm at the contact points. The size was determined from the convergence test for the equivalent von Mises stress. The mesh of finite elements of the global model consists of 157,398 finite elements and 230,134 nodes (Figure 6a). There are 7332 finite elements in contact on the contact surfaces of the gear teeth in engagement. After the gear teeth are meshed, the boundary conditions for the global model are defined. The locations where the bearings are installed is restricted in the radial and axial direction. The rotation is allowed so the tangential component of the displacement is free (Figure 6b). The given moment load is T1 (Figure 6b), the value of which is given in Table 1.
The fields for the distribution of total displacements (Figure 7) and the fields for the equivalent stresses according to von Mises (Figure 8) were obtained by numerical calculations in the ANSYS Workbench program package. The obtained maximum value of equivalent stresses (Figure 8) was high due to the very coarse mesh of finite elements, while accurate displacements can be obtained even with this coarse mesh. In order to obtain a more accurate value of equivalent stress and compare it with the stress obtained by the analytical calculation for the pinion and bevel gear (Table 5), submodeling with a finer finite element mesh was performed.

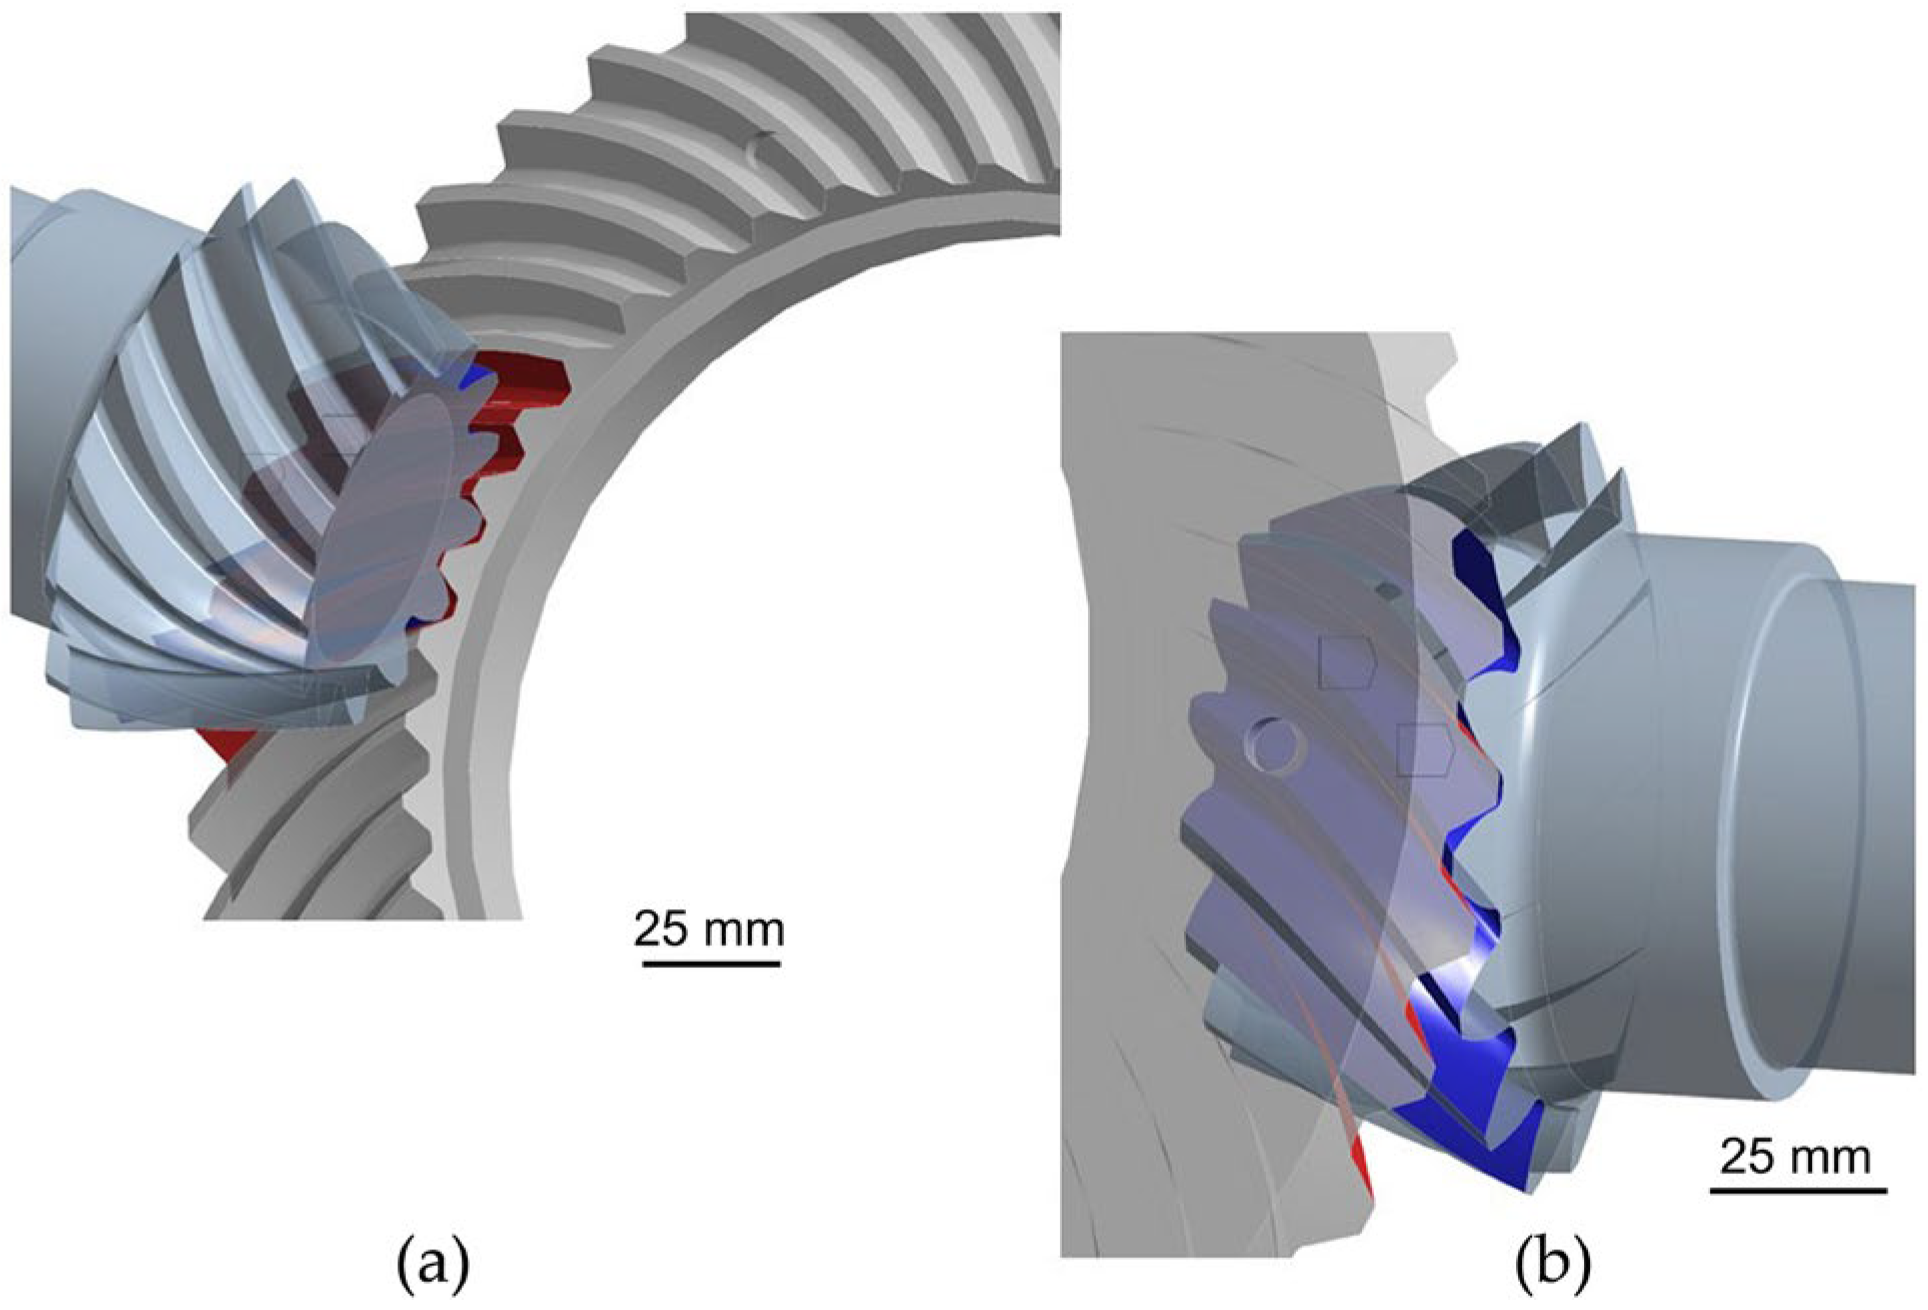
4.2. Submodeling of the Pinion and Bevel Gear

The submodel includes the geometry of the entire pinion (excluding the rest of the drive shaft) and the 1/6 of the ring gear (Figure 9). The influence of stresses and displacements on the 1/6 pinion due to the degree of overlap of the gearing in the mesh between the driving and driven gear was observed and analyzed. By submodeling the pinion and bevel gear, the finite element mesh was further refined at the points of contact and small radii at the tooth root of both gears. In this way, the stress values converge and the numerical calculation results obtained are more accurate. The submodel represents a separate analysis in relation to the analysis of the global model. The connection between the submodel and the model is reflected in the transfer of time-dependent values stored in the analysis of the global model for relevant nodes or essential boundary conditions of the submodel. The data transfer was achieved by connecting the results of the analysis of the global model with the settings of the new analysis. Since it is a separate analysis, the submodel can serve as the global model of the next submodel.
In the creation of the submodel, care was taken to apply St. Venant’s principle [43], which states that there is no influence on the mechanical behavior of the structure if one is far enough from the locations where the boundary conditions and loads are given. With this method, the global model can be evaluated with a coarser mesh, resulting in a faster solution, and then the areas of the considered domain can be analyzed with a finer finite element mesh. Thus, the analysis in the global model can omit certain details, such as welds, radii and holes, which can be considered later in the submodel. Displacement fields are applied to the submodel, as shown in Figure 9b. In addition to the displacement field, contacts and boundary conditions are also defined. The submodel is meshed with the same finite elements as the global model. The finite element mesh of the submodel consists of 590,776 finite elements and 829,486 nodes (Figure 9a).
The obtained value of the maximum von Mises equivalent stresses in the submodel is closer to the values of the analytical calculation (Table 5), indicating that the submodeling procedure gives good results (Figure 10).

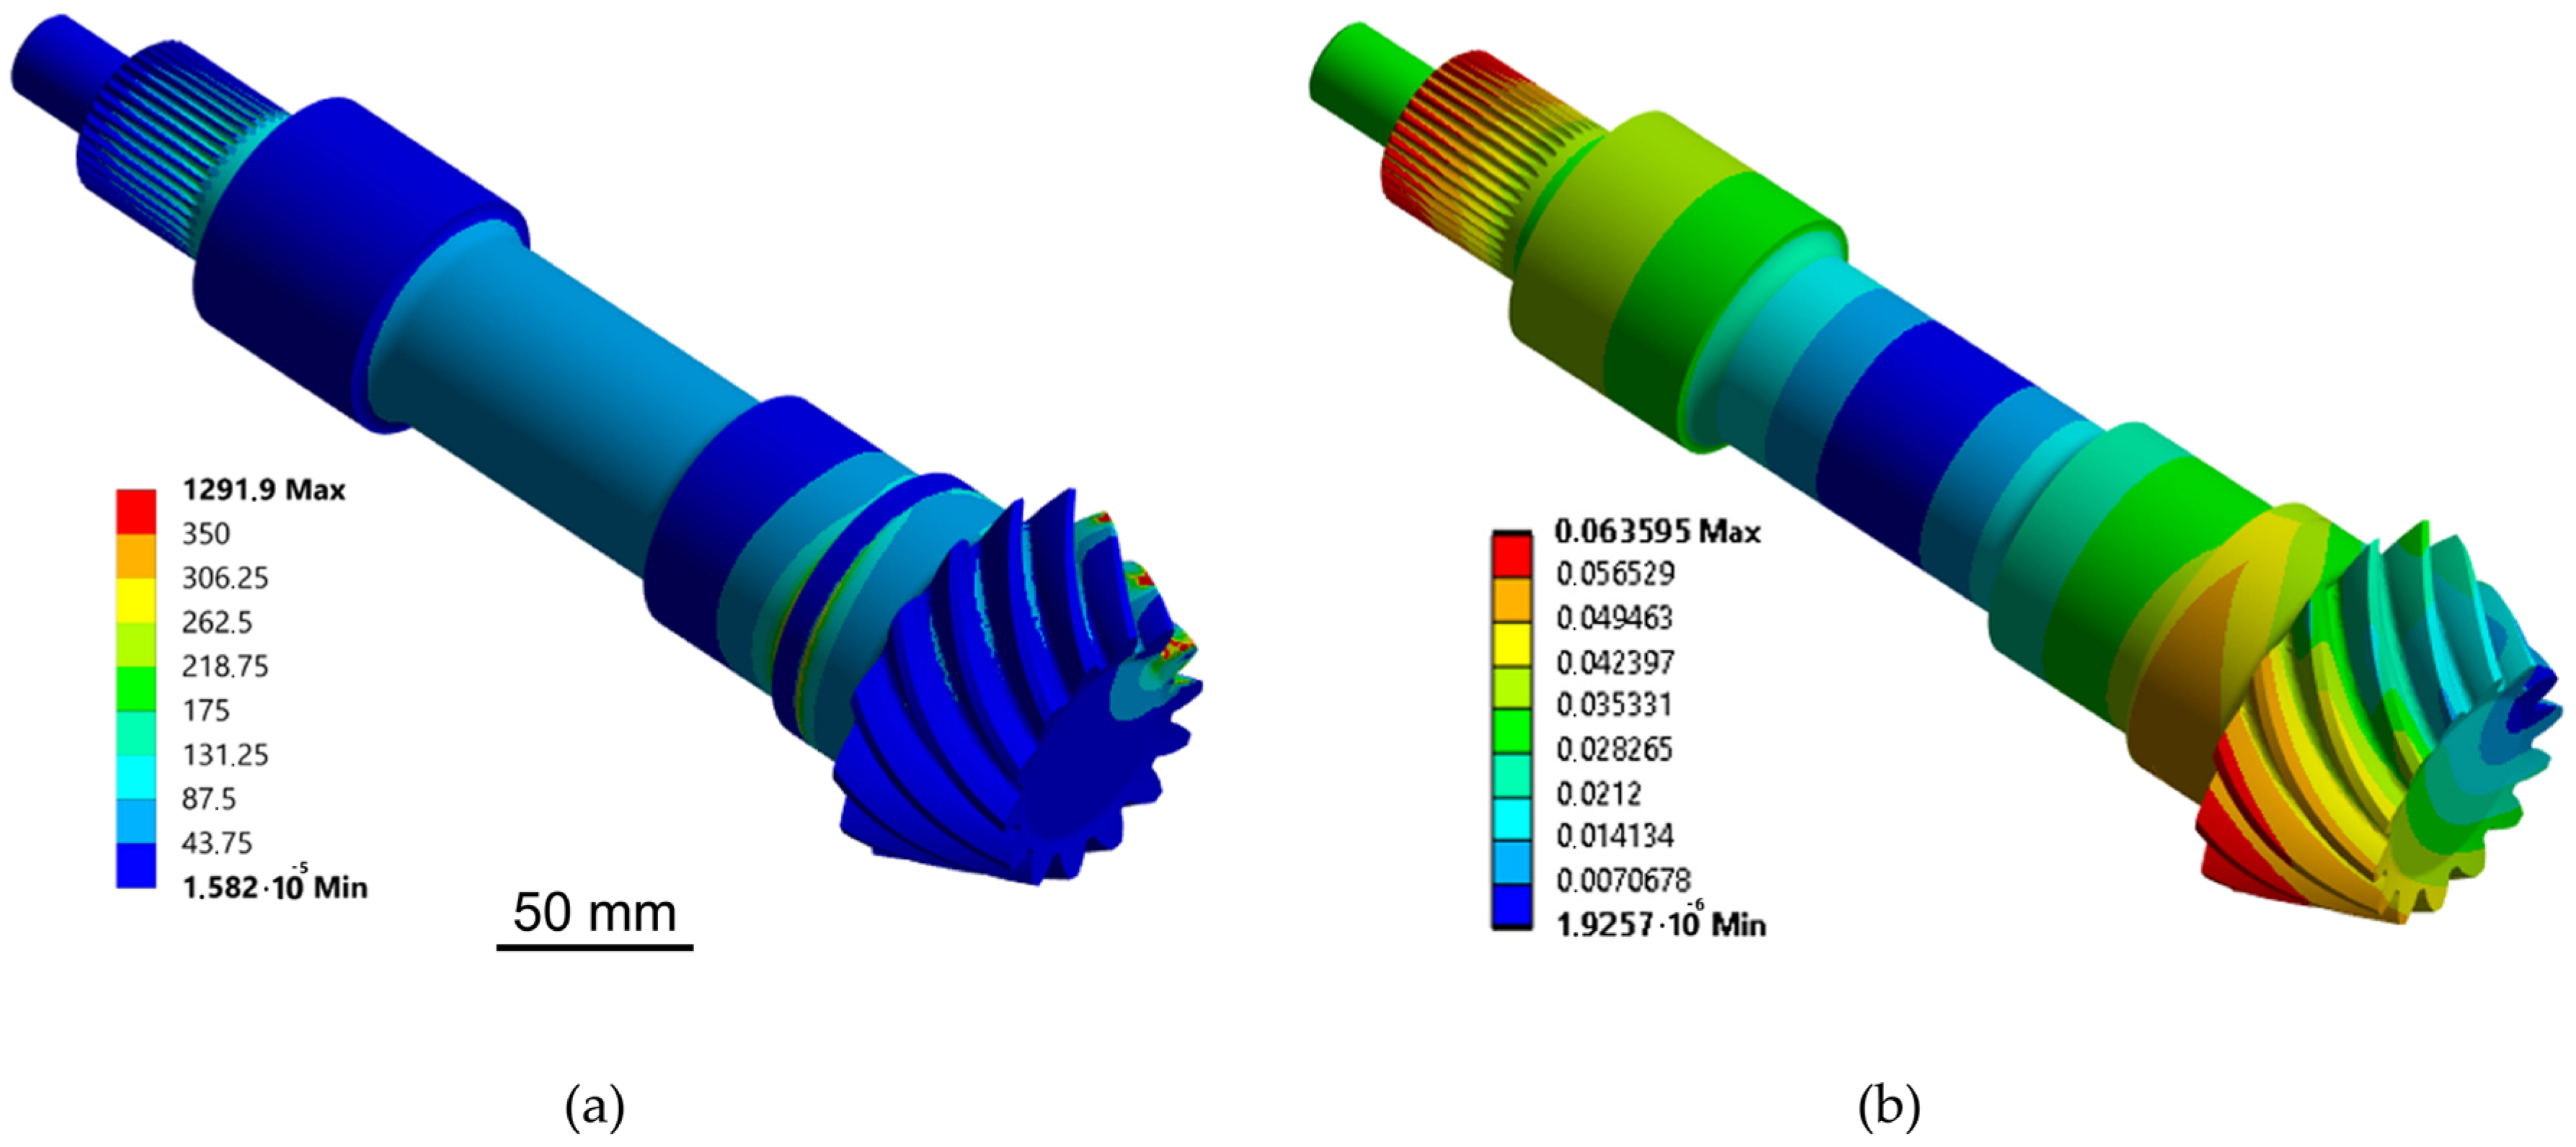
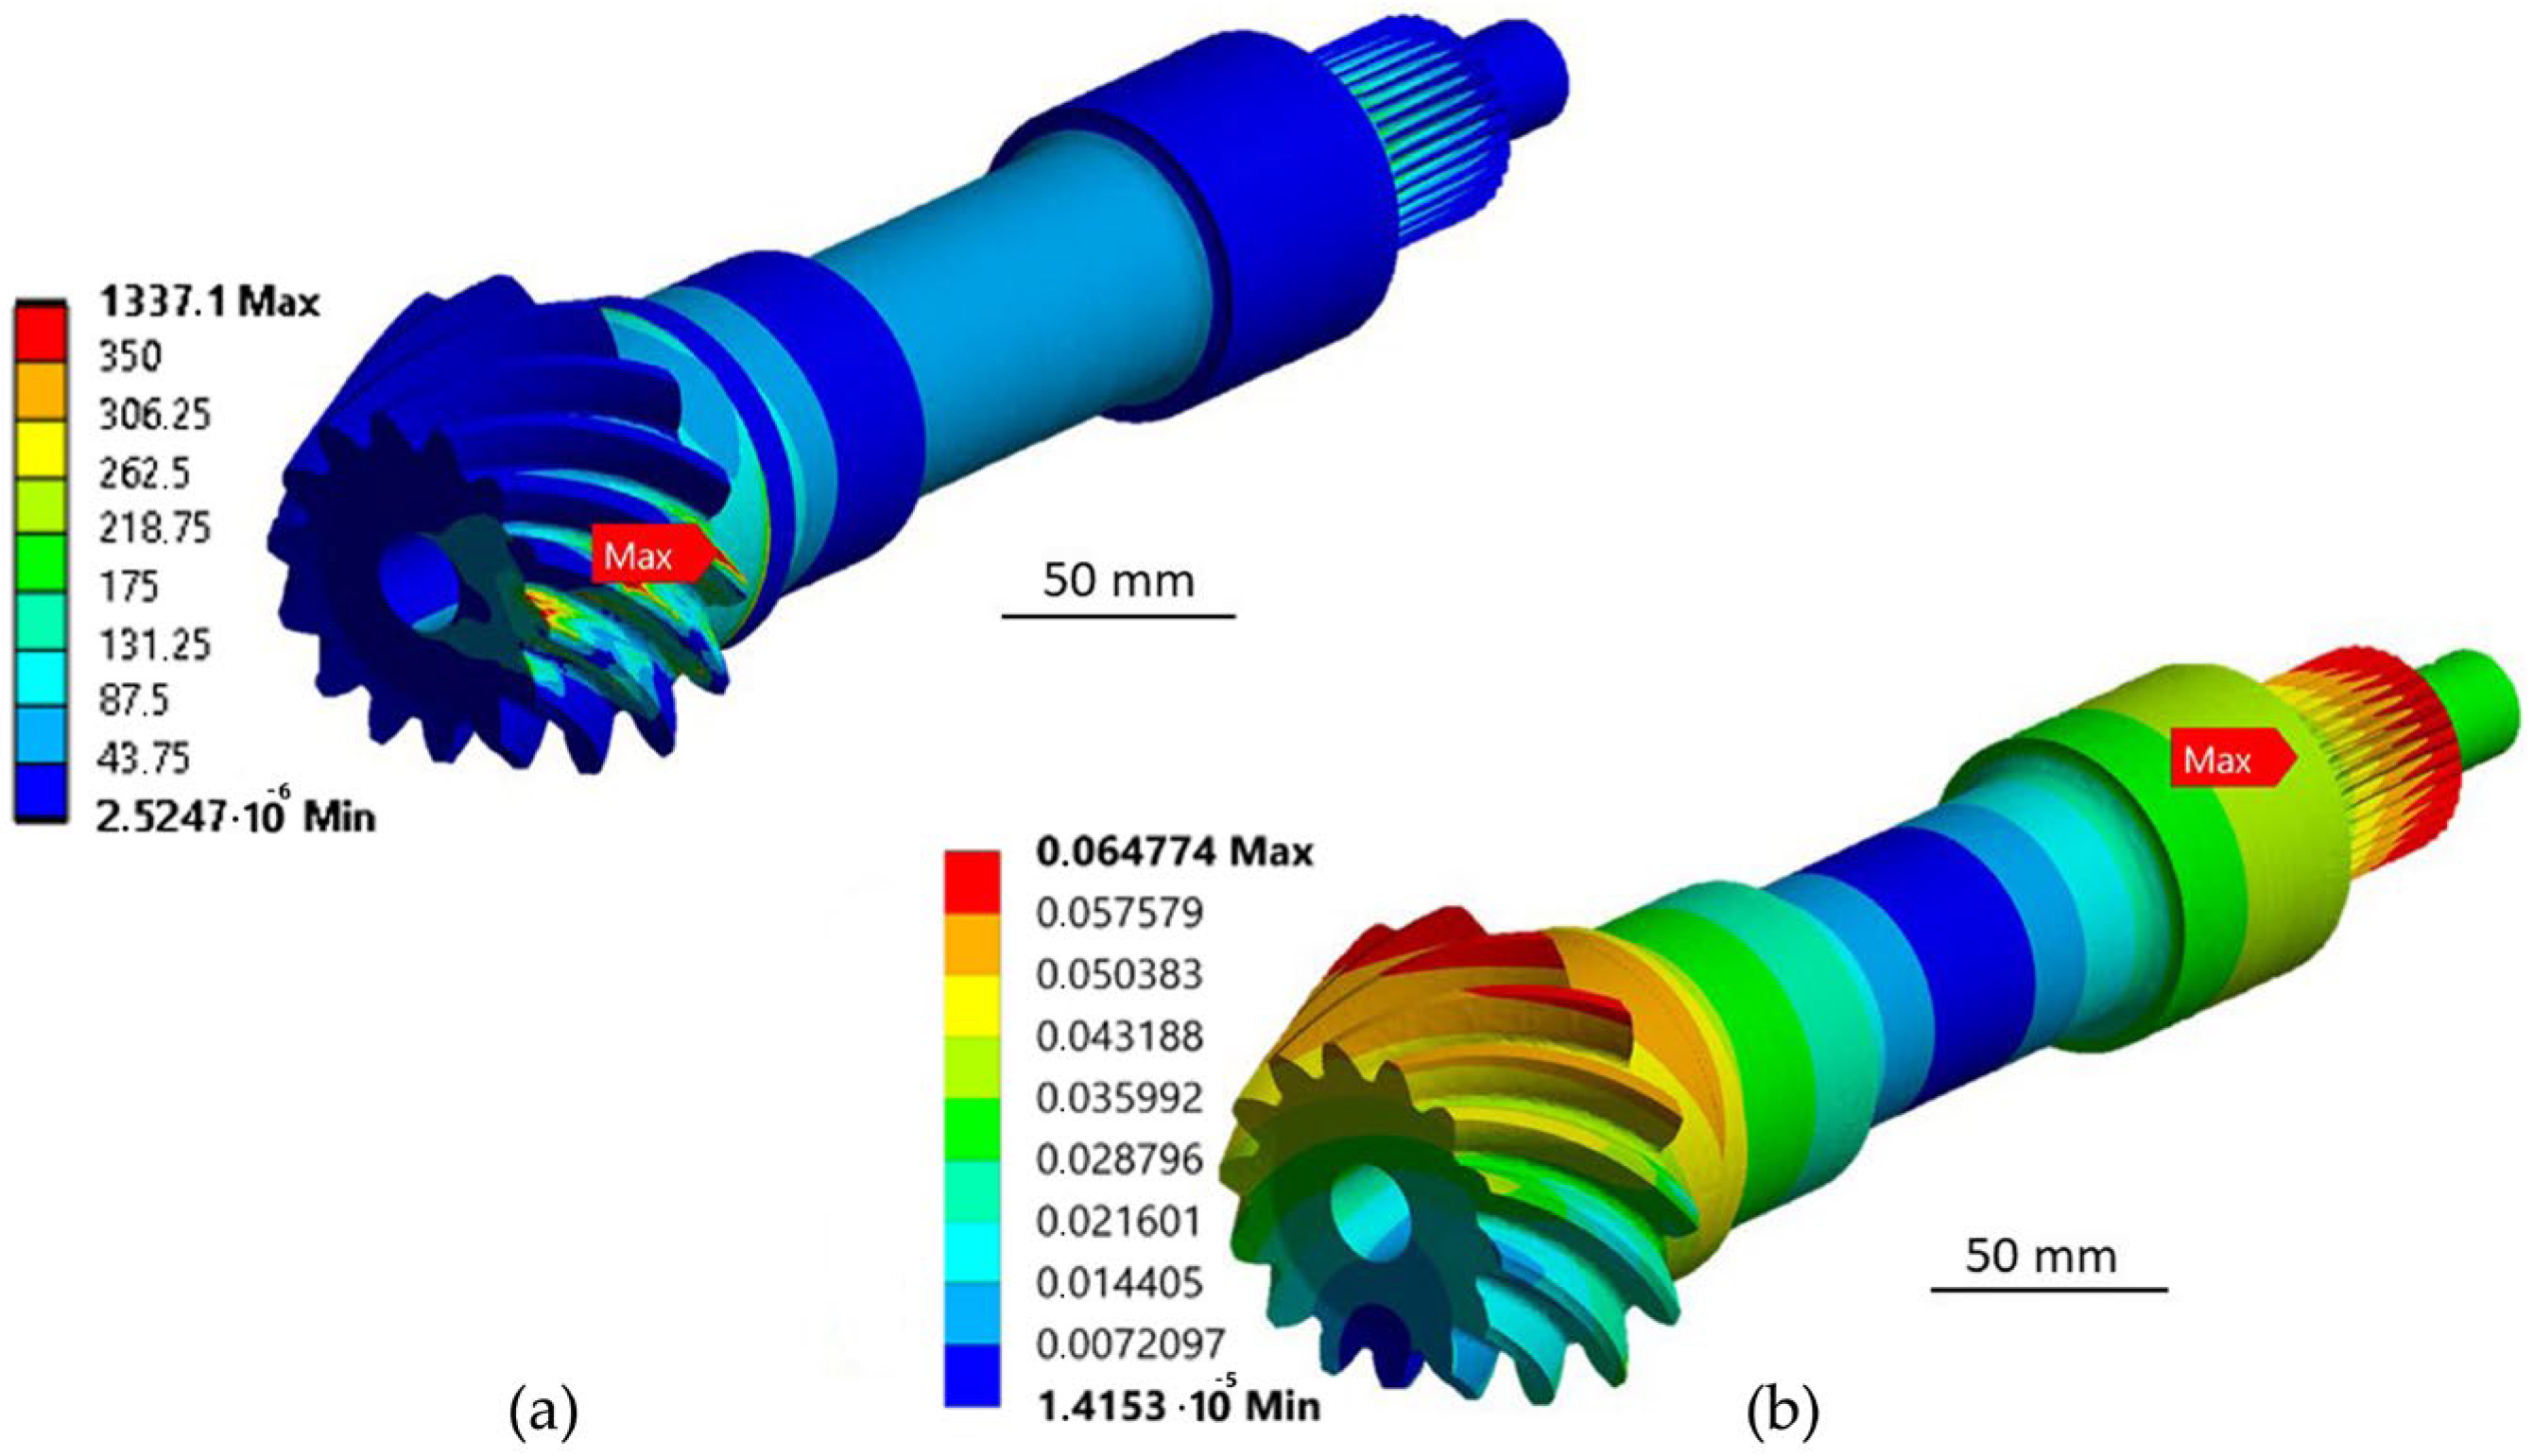
4.3. Analysis of Stress and Displacement of Drive Shaft

In order to assess the possibility of mass reduction of the drive shaft an initial numerical analysis is performed. The drive shaft was meshed with second-order SOLID187 tetrahedral finite elements with 501,870 elements and 712,238 nodes. Mesh sizing is preformed to satisfy accurate stress convergence. Meshed model and boundary conditions are shown in Figure 11 and results in the form of equivalent von Mises stress and displacements are obtained and shown in Figure 12.
From the results of the initial analysis, it appears that large parts of the drive shaft can be reduced in the middle part where the stress values are low. It is proposed to design the drive shaft as a hollow shaft. The inner radius of the hollow shaft is proposed as a structural parameter and in the further course it is investigated how this parameter, among other defined ones, influences the mass reduction of the whole assembly.

5. Optimization of Differential Transmission

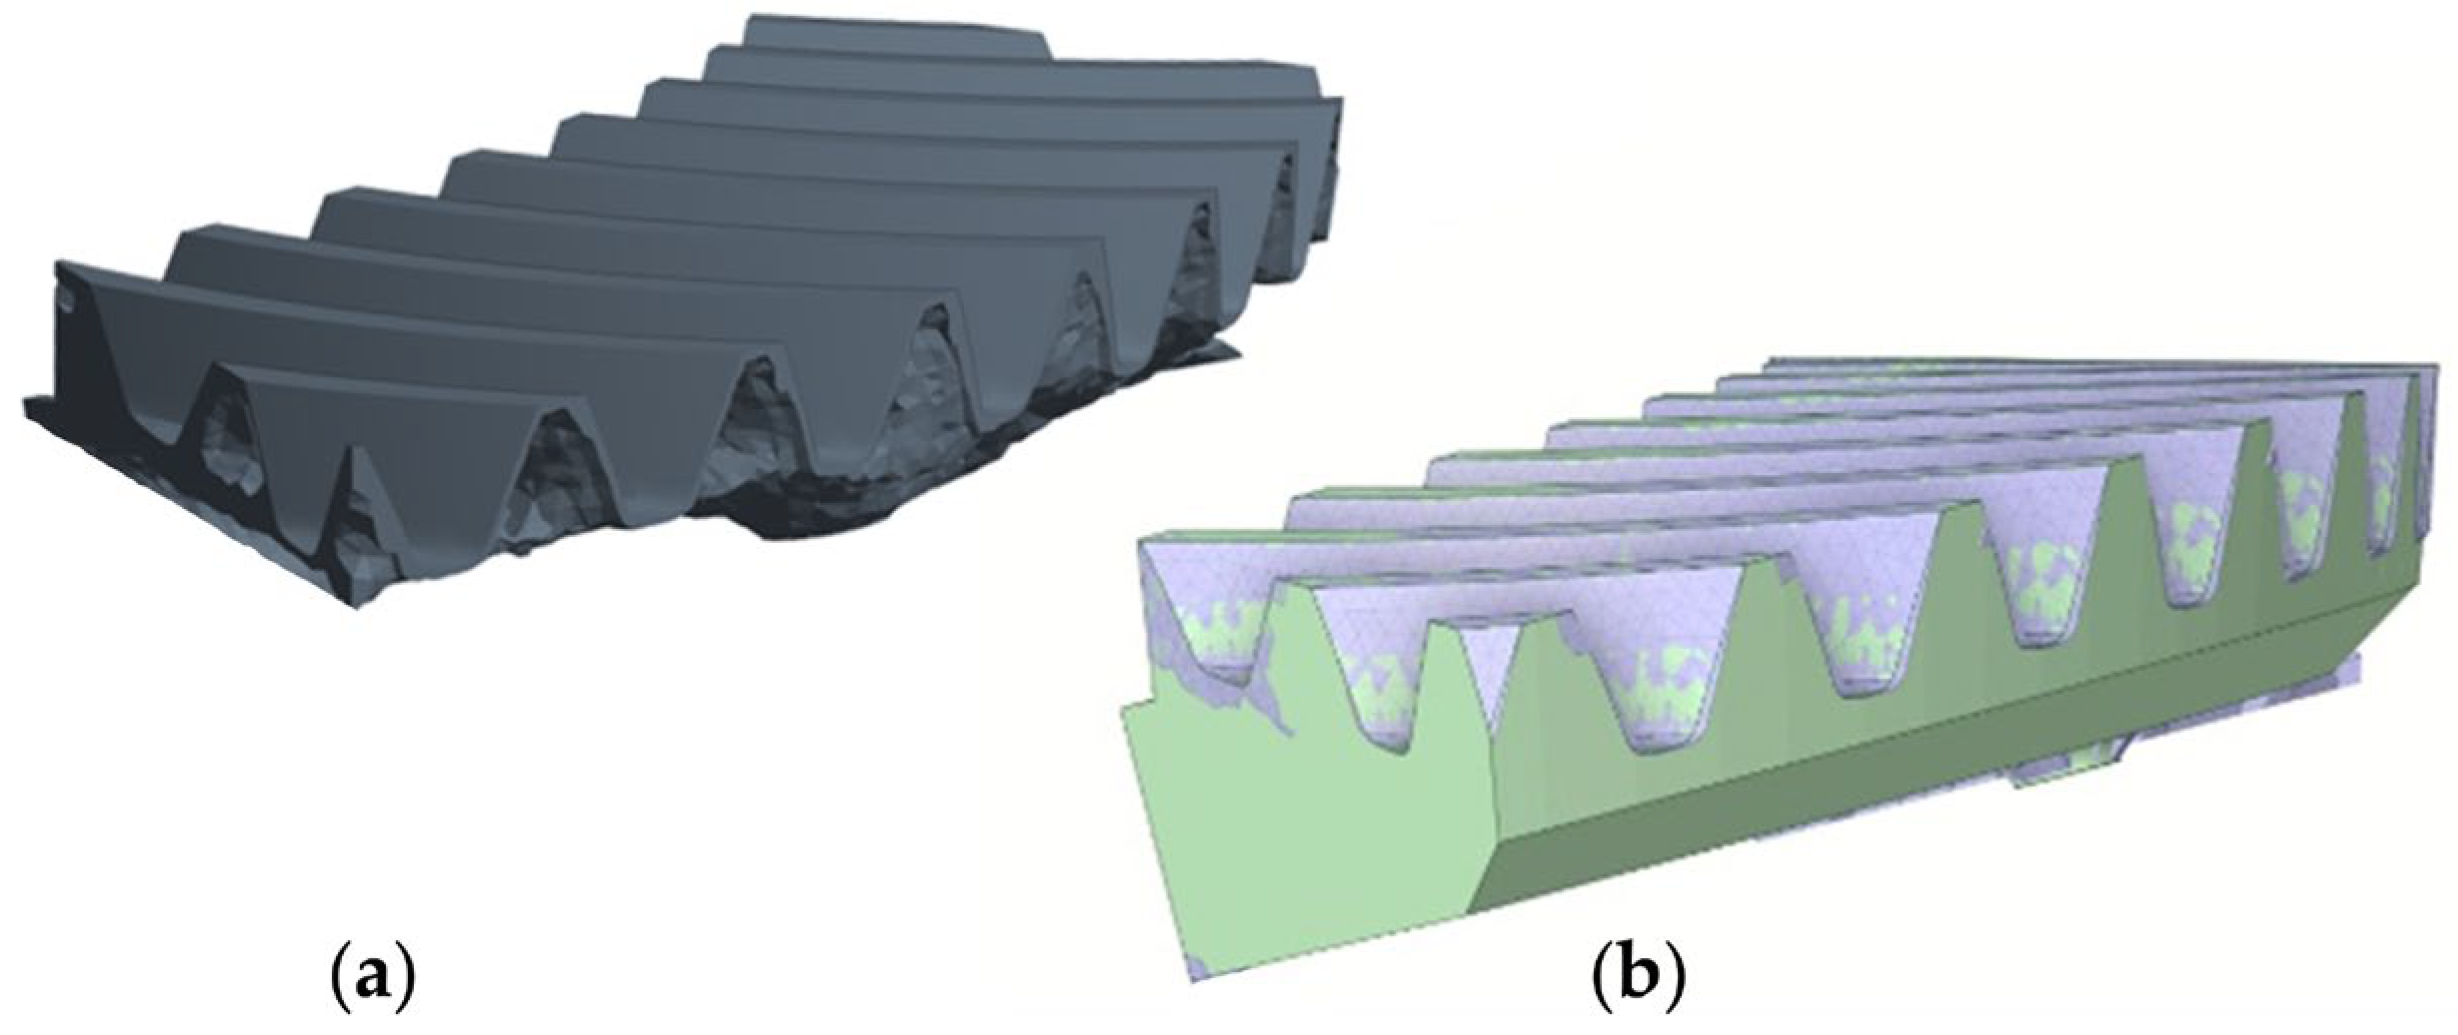
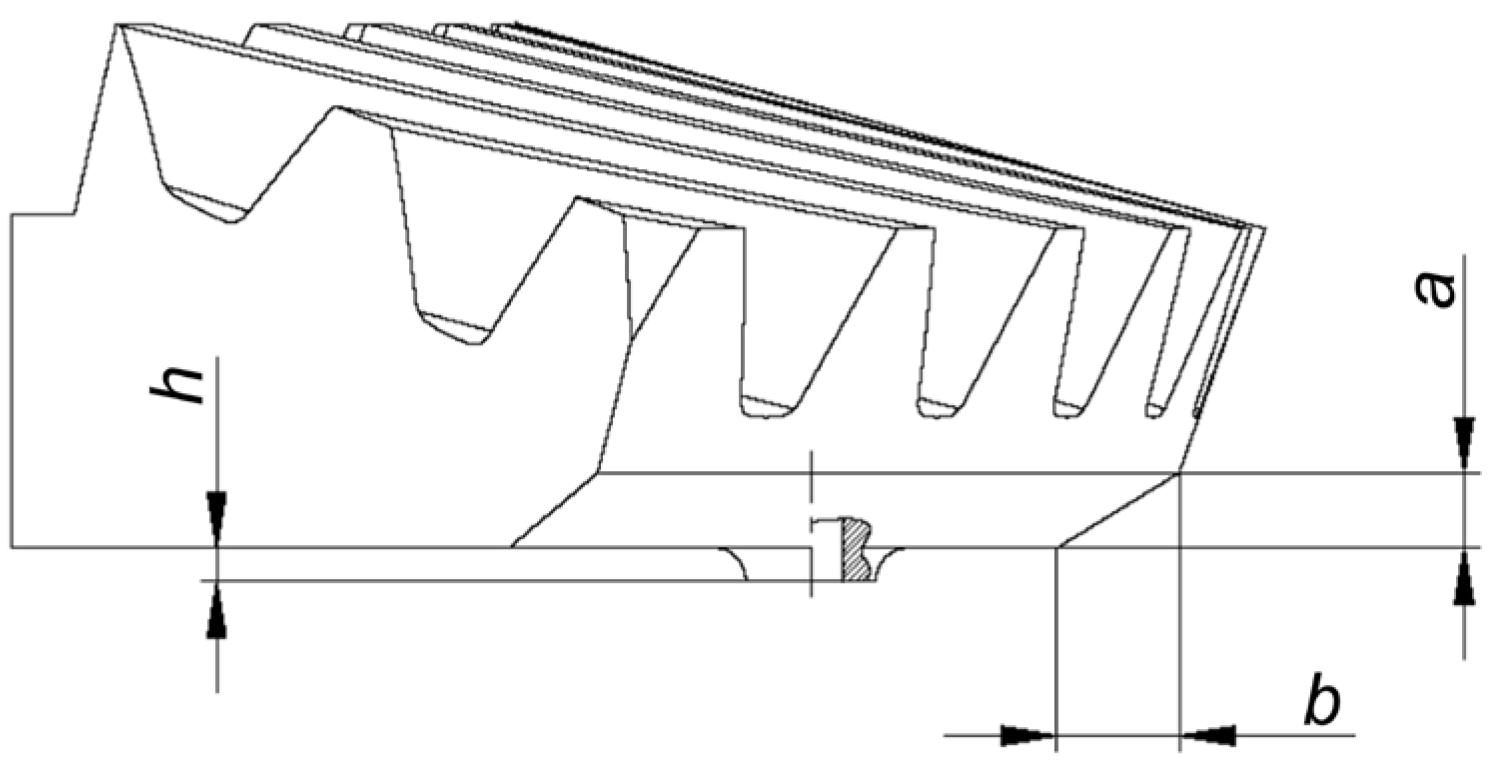
5.1. Topological Optimization and Determination of Design Parameters

The amount of the obtained maximum equivalent stress in the ring gear submodel (Figure 10) is lower than the allowable stress and a significant part of the submodel has much lower values of stress leaving the possible to apply the method of topological optimization for the determination and selection of the general design parameters of the ring gear and eventually lower the mass of submodel. The selected parameters represent the input parameters for the RS analysis. The topological optimization is performed in ANSYS Workbench and results in the form of a presentation of submodel volume that has to be retained, as shown in Figure 13a, but the obtained irregular geometry is not suitable for production using standard gear manufacturing processes. With the geometry thus obtained by taking care that the entire part that must be retained is included in the geometry, a new ring gear geometry suitable for production was created and later used to assess the individual influence of design parameters on overall mass using RSM (Figure 13b).
The resulting ring gear geometry is defined by giving three additional dimensions (a, b and h) as parameters (Figure 14). The parameterization of the presented model was performed in Ansys SpaceClaim 2022 software [44], allowing for the change of desired parameters in parametric analysis.
The determination of the design parameters of the drive shaft results from a numerical analysis for the previous Section 3.3, which showed that the amounts of the equivalent stresses in the central part of the drive shaft are very small (Figure 12a). Therefore, it is possible to apply the structural solution of the hollow shaft and determine the design parameter in relation to the inner radius of the driving shaft (Figure 15).
The final selection of the general design parameters to be analyzed using the RSM is shown in Table 8. The selected initial and final values of the solution interval of the design parameters were determined from the analysis of the stress results obtained by the numerical calculation, the topological optimization and the geometry of the CAD model obtained by the calculation of the design elements of the differential transmission according to the standard [35].

5.2. RSM Model

The continuation of the article shows an analysis of the influence of four general design parameters (Table 8) on the response variables presented in Table 9. The objective of the RSM is to reduce the mass of the design elements of the ODT. Therefore, the objective function was set to reduce the mass of the design elements of the transmission (Table 9). The constraint functions in the form of maximum stresses were already included in the optimization as constraints of the topological optimization. The parameters were analyzed using the centrally composed experimental design, the values of which are listed in Table 10.
In order to obtain a mathematical model (description) of the influence of design parameters on response variables, functional dependencies were created that can contribute to faster and more efficient computer analysis in the process of designing a differential transmission. With the help of the regression analysis of the general design parameters and output mass parameters obtained by the centrally composed experimental design, which were carried out by numerical calculations, the mathematical functions of the response variables were obtained using TuringBot 2.16.1 [45] software by symbolic regression algorithm to derive mathematical formulas with high efficiency:
m all = 16 r 2 r + b + h 26 + a 96 99 ,
m 1 = 6 1 16 h 78 a b + 276 ,
m 2 = 9 r 1 2 42 111 .
The prediction plots (Figure 16) show for the response variables the dependence between the data obtained by numerical calculation and the data obtained by the mathematical model. The line drawn at an angle of 45° represents an ideal overlap of the mathematical model and the numerical results. The accuracy of the spread of the numerical model’s response values relative to the predicted values should be evenly distributed on both sides of the diagonal. The diagram shows how the numerically determined values follow the line of ideal prediction (Figure 16).
The accuracy of the proposed mathematical model of the response variables for the R2 and root mean square error (RMSE) values is shown in Table 11. From the graph in Figure 16 and the data in Table 11, some scatter in the results can be seen. This is due to the complexity of the geometry of the teeth in the contact between the pinion and ring gear (radii) and the density of the finite element mesh. These data should be taken into account when interpreting the above results. It can be concluded that the accuracy of the numerical and mathematical model is acceptable considering the above data. The accuracy was additionally confirmed by the numerical control calculation of the optimized design elements, which is presented in Section 6.

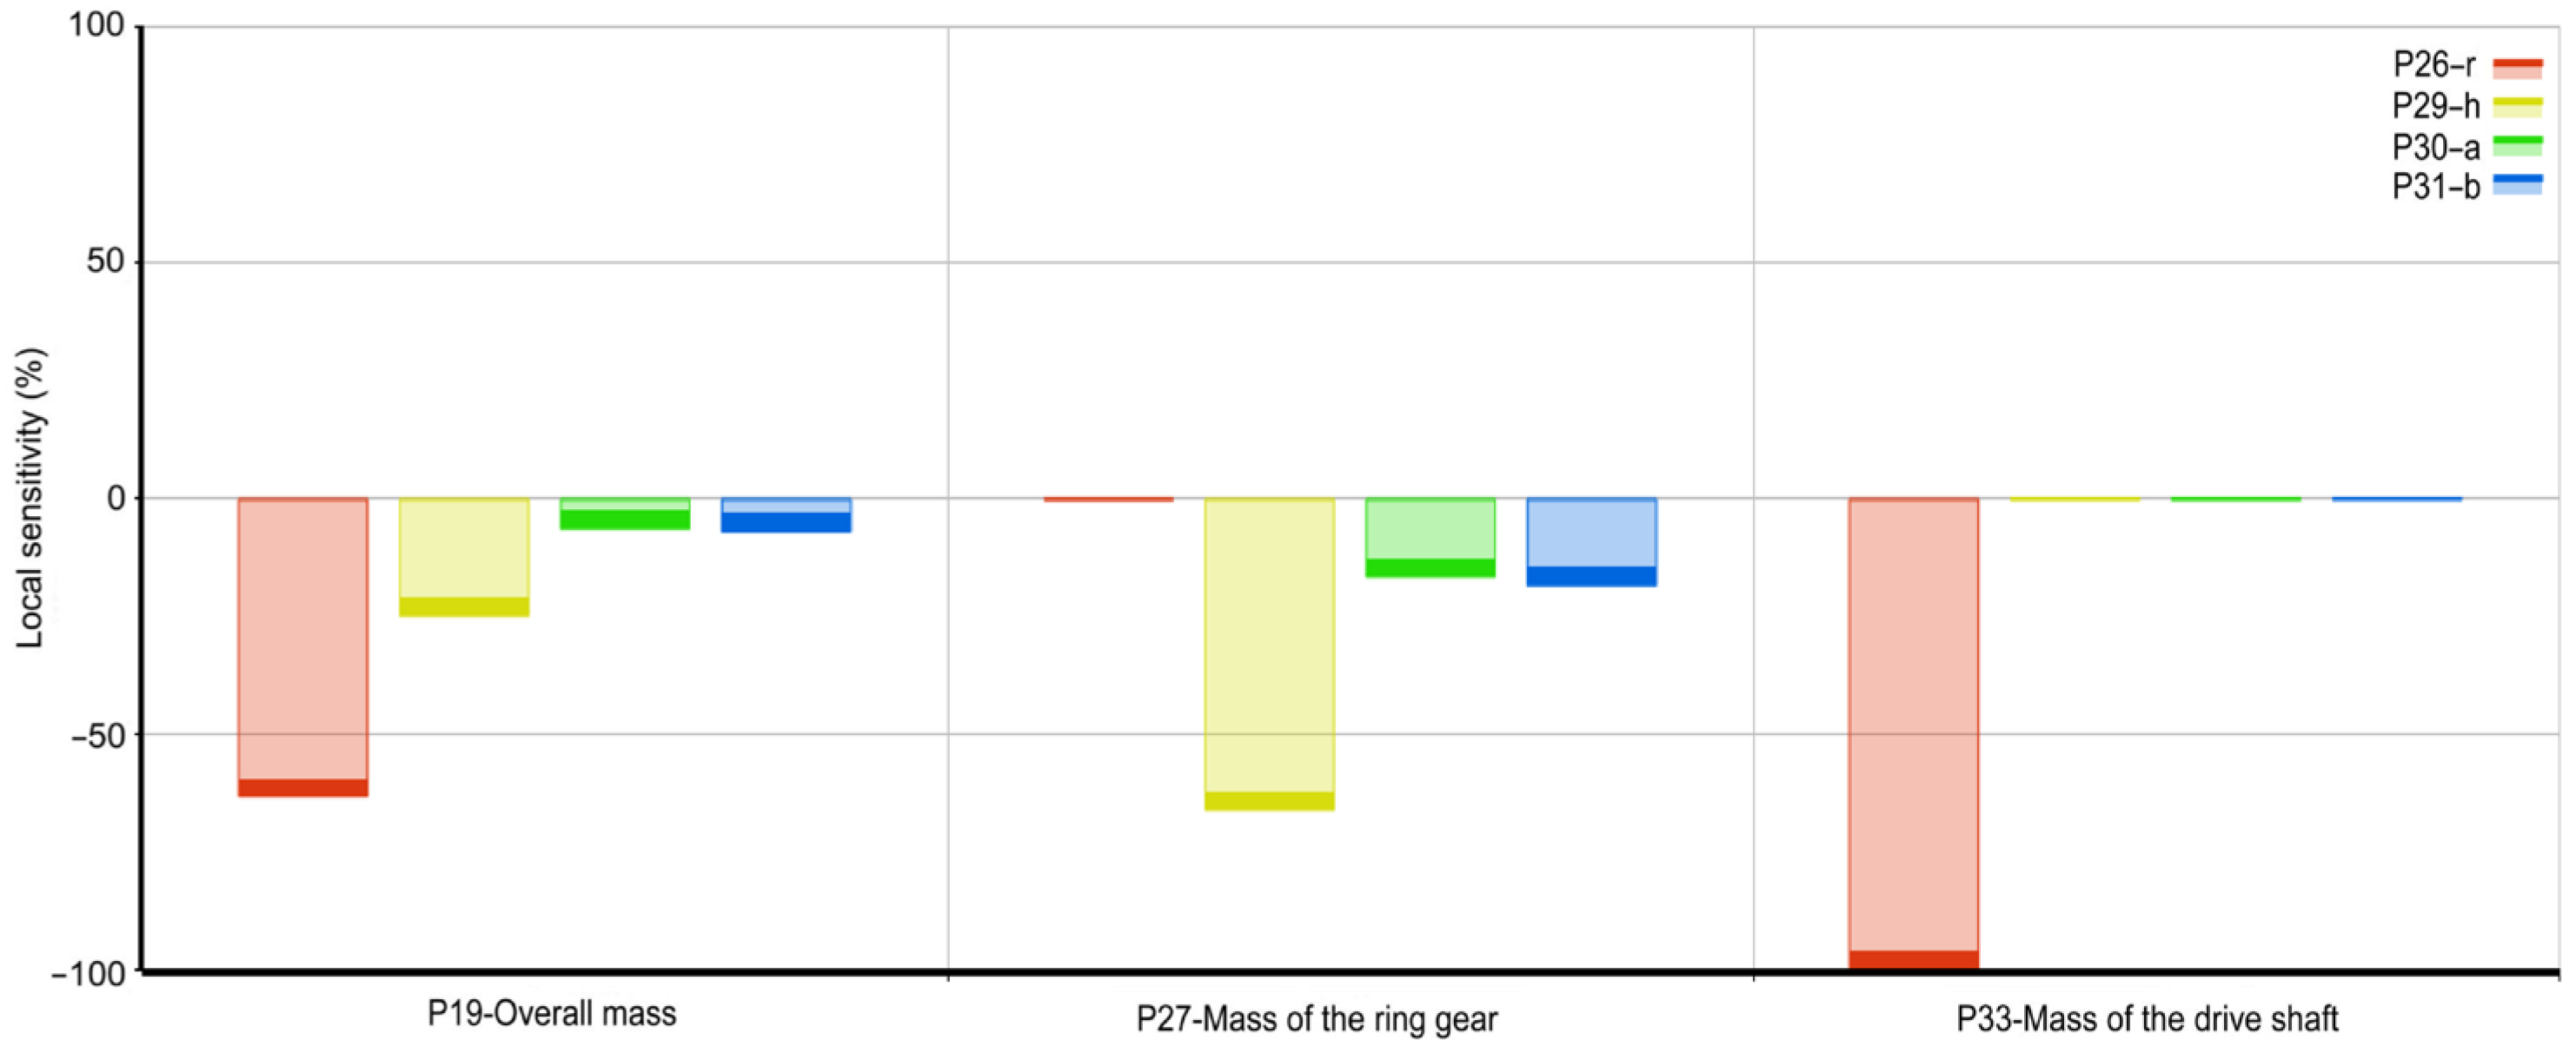
5.3. Analysis of Sensitivity of Parameter Change on Response Objective

The determination of local sensitivities in Ansys Workbench is carried out by the partial derivative of the output response with respect to the target design variable. The rate of change of the output response when the design variable changes is measured by this partial derivative. Depending on whether the output response increases or decreases with an increase in the design variable, the local sensitivity can be either positive or negative.
Local sensitivities are critical in design optimization because they allow us to determine which design factors have the greatest impact on the output response. By changing the design variables with the highest sensitivity, the response of the output can be improved while reducing the number of design iterations required. Local sensitivity indices of the influence of design parameters on the output mass parameters are shown in Figure 17.
It can be seen that all noticeable local sensitivities have a negative value, indicating that an increase in the value of the design variable leads to a decrease in the value of the output mass parameter. Looking at the overall mass parameter, it can be seen that an increase in all input parameters has an influence on the decrease in overall mass. The most influential parameter is the inner radius of the inner radius of the drive shaft (r), followed by the overhang height of the ring gear (h), while the horizontal and vertical chamfers of the ring gear (b, a) have a significantly smaller influence on the overall mass. These two parameters have a significant influence on the change in the mass of the ring gear, but the overhang height of the ring gear (h) has a significantly higher local sensitivity, indicating that the output response is very sensitive to changes in this parameter. The mass of the drive shaft is influenced exclusively by the inner radius of the drive shaft (r).

6. Numerical Calculation of the Optimized Differential Gear

Since topological optimization is performed using allowable stress and manufacturing limits as constraints, the largest values of observed design parameters, shown in Table 12, are also determined as the optimal ones. The parameters were applied to the overall model, and a new numerical analysis for the model with minimal overall mass was performed as a control calculation.
Since the topological optimization is performed using the allowable stresses and manufacturing limits as constraints, the largest values of the observed design parameters listed in Table 12 are also determined to be the optimal ones. The parameters were applied to the overall model and a new numerical analysis for the model with minimum overall mass was performed as a control calculation. The numerical control calculation with the FEM includes the verification of the displacements and equivalent stresses according to von Mises. The check was carried out for the optimized design elements of the ring gear and the input shaft, together with the pinion (drive shaft). To perform the check calculation, the design elements in the CAD system for parametric modeling were redesigned, taking into account the general design parameters and their optimal values determined by previous analyses. The geometry of the optimized design elements of the gearbox was only changed in the part containing the general design parameters (Figure 14 and Figure 15). The rest of the geometry remained unchanged.
The fields of the von Mises equivalent stresses and the total displacements of the optimized drive shaft are shown in Figure 18. As with the original (unoptimized) model, the highest stresses occur on the part where the drive gear is located. The maximum stresses on the tooth side of the drive gear are 1337 MPa, while the maximum stresses in the tooth root are 306 MPa.
The maximum displacements are in the area of engagement of the pinion teeth with the ring gear teeth and are 0.064774 mm. Comparing the results of the stresses in the side and tooth root obtained by the numerical control calculation with the results of the analytical calculation (Table 5) and the results of the numerical calculation of the non-optimized model (Figure 12a), they confirm the correctness of the optimized drive shaft and drive gear.
The fields of the equivalent stresses according to von Mises on the submodel of the optimized ring gear are shown in Figure 19. The highest stresses occur on the teeth that are in contact with the teeth of the pinion gear. The maximum stresses on the side of the ring gear teeth are 1283.8 MPa, while the maximum stress in the tooth root is 290.4 MPa. The obtained result of the maximum equivalent stress at the tooth side (Figure 19) differs by 3% from the analytical calculation (Table 5), confirming the correctness of the finite element size, i.e., the boundary conditions specified for the partial model (1/6 ring gear). The stress results obtained for the submodel are transferred to the global model and describe the stress fields of the global model.
Since the amounts of the maximum stresses of the optimized design elements determined by numerical control calculations are lower than the allowable stresses, the design elements meet the strength criteria.
After performing a numerical control calculation for the optimized design elements of the ring gear and drive shaft with pinion, the differences in mass reduction of the initial and optimized design elements of the differential transmission are shown in Figure 20. The overall mass of the two design elements before optimization using the optimization method was 17.03 kg. After optimization, the overall mass was reduced by 17.1% and is 14.11 kg.
The greatest mass reduction was achieved in the drive shaft. Before optimization, the mass of the drive shaft was 9.4 kg and after optimization, it was 7.74 kg. The mass was thus reduced by 17.7%. Slightly less mass reduction was achieved for the ring gear. Its mass before optimization was 7.63 kg, and after optimization, its mass was reduced by 16.5% and is 6.37 kg (Figure 20).

7. Conclusions

ODT, due to its relatively simple design, is installed in road vehicles with rear drive, in order to achieve the transmission of power and motion from the driving machine to the vehicle’s wheels. Due to its robust (massive) structural performance, it has the effect of increasing the mass of the road vehicles in which it is installed. As the mass of the vehicle increases, the consumption of fossil fuels increases and the energy efficiency of internal combustion engine vehicles decreases. Therefore, the goal of the research presented in this paper is to propose an algorithm that, by combining FEM, TOM and RSM, allows finding design parameters for the two design elements (ring gear and drive shaft with pinion) whose optimization reduces the overall mass of the ODT. The emphasis is placed on finding design parameters that are not part of the micro and macro parameters of gears, but are general design parameters that must be found for both gears and ODT shafts.
According to ISO 23509:2006, an analytical calculation of ODT was performed. By applying FEM static analysis, an initial numerical calculation of the displacements and equivalent stresses according to von Mises was performed for the ring gear and the drive shaft with pinion. Using the submodeling method (global–local FEM approach), the amounts of the maximum equivalent stresses of the teeth in the engagement of the pinion and ring gear were obtained. After comparing the obtained numerical results with the results of the analytical calculation of stress at the tooth root and Hertzian stress at the tooth face flank, the validity of the numerical model was confirmed. Also, the amounts of the displacements and maximum equivalent stresses according to von Mises were obtained by the numerical calculation of the drive shaft with pinion.
From the initial calculation of the drive shaft using FEM analysis, due to the low values of the maximum equivalent stresses according to von Mises, one design parameter of the internal radius (r) is proposed as input parameters for the analysis by the RSM. The remaining three design parameters (a, b and h) were obtained by topological optimization of the ring gear.
By applying the RSM, a mathematical model described by three mathematical equations was developed. Through the mentioned equations, the influence of the mentioned four design parameters on the three response variables was analyzed. Using the obtained equations, three objective functions are described: mass reduction of the optimized design elements (mall), mass reduction of the ring gear (m1) and mass reduction of the drive shaft (m2). From the local sensitivity analysis, the parameters of the inner radius of the drive shaft (r) and overhang height of the ring gear (h) have the greatest influence on the mall response variable. Then, we followed the parameters vertical and horizontal chamfer of the ring gear (a and b). Based on the partial objective functions of mass reduction of each optimized design element (m1 and m2), a significant influence of the selected design parameters on this design element can be seen. All ring gear parameters h, b and a have influence on objective function m1 where parameter h is dominant. This is visible through the obtained mathematical Equation (40). The parameter r has the largest effect on the function m2.
By choosing general design parameters and analyzing their influence using the obtained mathematical model, it was possible to create a new geometry of the ring gear and drive shaft with pinion. After the optimization, the overall mass of the optimized design elements was reduced by 16.5% compared to the mass of the same elements before optimization with the proposed algorithm. The mathematical model and the proposed algorithm, presented in this paper, with sufficient reliability enable optimization of the ring gear and the drive shaft with pinion of the ODT and give insight into how each design parameter influences the overall mass of the ODT.
The next step of the investigation planned is to conduct research where the effects of dynamic loading would be included in the numerical analyses, and the achievement of more accurate and more comprehensive results is expected.

Author Contributions

Conceptualization, M.K., P.K. and H.G.; methodology, M.K., P.K. and H.G.; software, M.K. and P.K.; validation, M.K., P.K., H.G. and I.G.; formal analysis, P.K., M.K., I.G. and H.G.; investigation, M.K., P.K. and H.G.; resources, P.K. and M.K.; data curation, M.K. and P.K.; writing—original draft preparation, M.K., P.K. and H.G.; writing—review and editing, M.K., P.K., H.G. and I.G.; visualization, M.K., P.K. and H.G.; supervision M.K., P.K., H.G. and I.G.; project administration, M.K.; funding acquisition, M.K., P.K. and I.G. All authors have read and agreed to the published version of the manuscript.

Funding

This research received no external funding.

Institutional Review Board Statement

Not applicable.

Informed Consent Statement

Not applicable.

Data Availability Statement

Data are available upon request to the corresponding author. The data are not publicly available due to privacy.

Acknowledgments

The authors express their thanks to the partner and major coordinator of the EU project for the Center of Competences for Advanced Engineering Nova Gradiška CEKOM NI NG (KK.01.2.2.03.0011), who supported, enabled and participated in the implementation of the research presented in this paper. Also, the authors express their thanks to Daniel Novoselović, Ilija Svalina, Iva Samardžić and Mirela Brechelmacher for their contribution to this research.

Conflicts of Interest

The authors declare no conflict of interest.

Nomenclature

ahypoid offset
avvehicle acceleration
A3, A4, A5, A6, A7intermediate variables
btooth width
b1pinion gear face width
b2ring gear face width
b3tooth width of the planetary gear
b4tooth width of the sun gear
cclearance
da3planetary gear addendum circle diameter
da4sun gear addendum circle diameter
dia3planetary gear inner addendum diameter of tooth
dia4sun gear inner addendum diameter of tooth
dm1pinion mean pitch diameter
dm2ring gear mean pitch diameter
dm3planetary gear mean pitch diameter
dm4sun gear mean pitch diameter
dv3pitch diameter of equivalent gear (planetary)
dv4pitch diameter of equivalent gear (sun)
dva3addendum diameter of equivalent gear (planetary)
dva4addendum diameter of equivalent gear (sun)
dvb3base diameter of equivalent gear (planetary)
dvb4base diameter of equivalent gear (sun)
dvm3pitch diameter of middle equivalent gear (planetary)
dvm4pitch diameter of middle equivalent gear (sun)
d3pitch circle diameter of the planetary gear
d4pitch circle diameter of the sun gear
Fhypoid dimensional factor
Fffriction force
FINvehicle’s inertial force
Fmt1tangential force on the pinion
Fmt2tangential force on the ring gear
Fmt3tangential force on the planetary gear
Fmt4tangential force on the sun gear
FRIrising resistance force
FROrolling resistance force
fROrolling resistance factor
FTRtraction force
FTRDtotal resistance force of driven machine
Fwreaction force in the wheel
gacceleration of the earth’s gravity
Gvvehicle weight force
hoverhang height of the ring gear
h3planetary gear whole depth
h4sun gear whole depth
ha3addendum depth for zero pair of bevel gears (planetary)
ha4addendum depth for zero pair of bevel gears (sun)
hf3dedendum depth for zero pair of bevel gears (planetary)
hf4dedendum depth for zero pair of bevel gears (sun)
idtransmission ratio of the differential transmission
i1, i2, i3, i4, i5, iRgearbox transmission ratios
KFXsize influence factor
Kload distribution factor
Kload distribution factor along the length of the tooth flank
KHXfactor of dimensions influence on the load capacity of the tooth flank
Kload distribution factor
Kload distribution factor along the length of the tooth flank
KLinfluence factor of lubricating oil
malloverall mass of optimized design elements
mfmodule considering of load of tooth face flank
mnmean normal module
mrmodule considering of load of tooth root
mv, maxmaximum vehicle mass
m1mass of the ring gear
m2mass of the drive shaft
Pmaxdriving machine power (engine power)
Po maxpower on the motor output shaft
P1power delivered to the drive bevel gear (pinion gear)
P2output power of the differential transmission
Ralength of the derivative of the dividing cone
Rmintintermediate variable
Rm1mean cone distance of the pinion
Rm2mean cone distance of the ring gear
rinner radius of the drive shaft
SFminminimum safety factor against root breakage
SHlimminimum anti-pitting factor
SHminminimum safety factor against tooth flank fracture
TLtorques on the left drive wheel
T L torques on the left drive wheel
Tmaxmaximum engine torque
TRtorques on the right drive wheel
T R torques on the right drive wheel
TWtorque on the drive wheels
T W torque on the drive wheels
tzm1crossing point to calculation point along pinion axis
tzm2crossing point to calculation point along ring gear axis
T1input torque to the differential transmission
T2torque of the hypoid ring bevel gear (with included efficiency of the open differential)
T 2 torque of the hypoid ring bevel gear (without including the losses of the kinematic chain)
uvtransmission ratio of supplementary bevel gears
YFtooth shape factor
YNis service life factor
YRroughness factor
YSnotch action factor
Yβimpact factor of tooth locking on the stress distribution in the root
YεVload share factor of auxiliary gears
ZHVtooth shape factor
ZMmaterial factor
ZNservice life factor
ZRroughness influence factor
ZVspeed influence factor
ZWinfluence factor of flank hardening
z1teeth number of the hypoid pinion bevel gear
z2teeth number of the hypoid ring bevel gear
z3teeth number of the planetary bevel gear
z4teeth number of the sun bevel gear
ZεVcoverage factor
αlimlimit pressure angle
αnmean normal pressure angle
βm1spiral angle of hypoid pinion bevel gear
βm2spiral angle of hypoid ring bevel gear
γrising angle (slope angle)
δa3face angle of planetary gear
δa4face angle of sun gear
δ1pinion gear pitch angle
δ2ring gear pitch angle
δ3planetary gear pitch angle
ηcefficiency of the cardan shaft
ηdefficiency of the open differential
ηgefficiency of the gearbox
κa3planetary gear teeth face angle
κa4sun gear teeth face angle
λtooth width factor
µfriction factor for asphalt surface
ΔΣshaft angle departure
Σshaft angle
σFlim1amount of permanent dynamic strength for tooth root (pinion)
σFlim2amount of permanent dynamic strength for tooth root (ring gear)
σFlim3amount of permanent dynamic strength for tooth root (planetary gear)
σFlim4amount of permanent dynamic strength for tooth root (sun gear)
σF1bending stress on pinion tooth root
σF2bending stress on ring gear tooth root
σF3bending stress on planetary tooth root
σF4bending stress on sun tooth root
σFP1allowed stress on pinion tooth root
σFP2allowed stress on ring gear tooth root
σFP3allowed stress on planetary tooth root
σFP4allowed stress on sun tooth root
σHlim1permanent dynamic strength for tooth face flank (pinion)
σHlim2permanent dynamic strength for tooth face flank (ring gear)
σHlim3permanent dynamic strength for tooth face flank (planetary gear)
σHlim4permanent dynamic strength for tooth face flank (sun gear)
σH1Hertzian stress in the kinematic pole of pinion
σH2Hertzian stress in the kinematic pole of ring gear
σH3Hertzian stress in the kinematic pole of planetary gear
σH4Hertzian stress in the kinematic pole of sun gear
σHP1allowed Hertzian stress on pinion tooth face flank
σHP2allowed Hertzian stress on ring gear tooth face flank
σHP3allowed Hertzian stress on planetary tooth face flank
σHP4allowed Hertzian stress on sun tooth face flank
ζmpinion offset angle in the axial plane
ζmppinion offset angle in the pitch plane
υmauxiliary angle
ψcontribution factor of rotating masses
ωmaxangular velocity at which Tmax is reached
ω1angular velocity of the hypoid pinion bevel gear
ω2angular velocity of the hypoid ring bevel gear

References

  1. Veeranjaneyul, C.; Hari Babu, U. Design and structural analysis of differential gear box at different loads. Int. J. Adv. Eng. Res. Stud. 2012, 1, 65–69. [Google Scholar]
  2. Sivan Teja, N.; Dinesh Babu, K.; Siva Nagendra, M.; Phanideep, C.; Sai Trinadh, J. Design and analysis of differential gear box in automobiles. Int. J. Mech. Eng. Technol. 2017, 8, 175–185. [Google Scholar]
  3. Mohite, M.A.; Dohare, P.; Thange, R.; Dhorsinge, J.; Walunj, W. Design & Analysis of Electronically Controlled Self-locking Differential Gear Box. Int. J. Sci. Eng. Res. 2020, 11, 275–281. [Google Scholar]
  4. Waghmare, A.S.; Shinde, S.V.; Kavale, A.S.; Tathe, P.G. Differential Locking System. Int. J. Sci. Res. Dev. 2017, 4, 932–938. [Google Scholar]
  5. Huh, Y.; Kim, H.-I.; Shin, I.-H.; Koo, J.-M.; Seok, C.-S. A Study on the Differential Gearing Device with the Faculty of a Limited Slip Differential. Int. J. Precis. Eng. Manuf. 2009, 10, 91–96. [Google Scholar] [CrossRef]
  6. Gadola, M.; Chindamo, D. The Mechanical Limited–Slip Differential Revisited: High-Performance and Racing Car Applications. Int. J. Appl. Eng. Res. 2018, 13, 1478–1495. [Google Scholar]
  7. Cheli, F.; Pedrinelli, M.; Resta, F.; Travaglio, G.; Zanchetta, M.; Zorzutti, A. Development of a new control strategy for a semi-active differential for high-performance vehicle. Int. J. Veh. Mech. Mobil. 2007, 44, 202–215. [Google Scholar] [CrossRef]
  8. Yahiya, M.; Imaduddin, S.; Maviya, M.M.; Mujtabauddin, M.; Moulal, S. Design and Analysis of Torsen Differential. Int. J. Sci. Dev. Res. 2018, 3, 74–83. [Google Scholar]
  9. Directive 2012/27/EU of the European Parliament and of the Council. Available online: https://eur-lex.europa.eu/LexUriServ/LexUriServ.do?uri=OJ:L:2012:315:0001:0056:en:PDF (accessed on 13 December 2023).
  10. EN 16247-4:2022; Energy Audits—Part 4: Transport. CEN-CENELEC: Brussels, Belgium, 2022.
  11. Pandey, S.; Singh, N.N.; Sinha, P.K. Modeling, Design & Analysis of Differential Gear Box and its Housing through FEM, SolidWorks and Ansys Benchwork 14.0. Int. J. Eng. Sci. Res. Technol. 2017, 6, 127–139. [Google Scholar]
  12. Pawar, P.B.; Utpat, A.A. Analysis of Composite Material Spur Gear under Static Loading Condition. Mater. Today Proc. 2015, 2, 2968–2974. [Google Scholar] [CrossRef]
  13. Arul Prince, A.J.; Reddy, A.S.; Nagateja, K.; Chowdary, N.N. Design and Analysis of a Spur Gear with Composite Material. Int. J. Eng. Res. Technol. 2021, 10, 350–362. [Google Scholar]
  14. Demšar, I.; Černe, B.; Tavčar, J.; Vukašinović, N.; Zorko, D. Agile development of Polymer Power Transmission Systems for e-Mobility—A Novel Methodology Based on a e-Bike Drive Case Study. Polymers 2023, 15, 68. [Google Scholar] [CrossRef] [PubMed]
  15. Alcácer, V.; Ávila, F.; Marat-Mendes, R. Design, Manufacturing & Analysis of an ABS Differential Gear System model. In Proceedings of the 6th International Conference on Mechanics and Materials in Design, Azores, Portugal, 26–30 July 2015. [Google Scholar]
  16. Andersson, M. Churning Losses and Efficiency in Gearboxes. Ph.D. Thesis, Department of Machine Design, KTH Royal Institute of Technology, Stockholm, Sweden, 2014. [Google Scholar]
  17. Zou, L.; Du, M.; Jia, B.; Xu, J.; Ren, L. Numerical Simulation of the Churning Power Losses in the Automotive Hypoid Gear Reducer. J. Appl. Math. Phys. 2018, 6, 1951–1956. [Google Scholar] [CrossRef]
  18. Concli, F.; Gorla, C.; Della Torre, A.; Montenegro, G. Churning Power Losses of Ordinary Gears: A New Approach Based on the Internal Fluid Dynamics Simulations. Lubr. Sci. 2015, 27, 313–326. [Google Scholar] [CrossRef]
  19. Liu, H.; Jurkschat, T.; Lohner, T.; Stahl, K. Determination of Oil Distribution and Churning Power Loss of Gearboxes by Finite Volume CFD Method. Tribol. Int. 2017, 109, 346–354. [Google Scholar] [CrossRef]
  20. Liu, Y.; Shi, L.; Gao, Y.; Kou, C.; Yang, S.; Liu, L. Research of the Optimized Management of Agricultural Machinery Allocation Path Based on Teaching and Learning Optimization Algorithm. Tech. Gaz. 2022, 29, 456–463. [Google Scholar] [CrossRef]
  21. Qin, Z.; Wu, Y.-T.; Lyu, S.-K. A Review of Recent Advances in Design Optimization of Gearbox. Int. J. Precis. Eng. Manuf. 2018, 19, 1753–1762. [Google Scholar] [CrossRef]
  22. Tharmakulasingam, R. Transmission Error in Spur Gears: Static and Dynamic Finite-Element Modeling and Design Optimization. Ph.D. Thesis, School of Engineering and Design, Brunel University, London, UK, 2009. [Google Scholar]
  23. Chong, T.H.; Yang, W.Y.; Lee, K.H. An Optimum Design of Planetary Gear Considering the Volume. In Proceedings of the Korean Society of Manufacturing Technology Engineering Autumn Conference, Yeosu, Republic of Korea, 17–18 October 2019. [Google Scholar]
  24. Noh, S.Y.; Kim, L.S.; Cho, S.H.; Lyu, S.K. Study on the Tooth Micro-geometry Optimization of Planetary Gear for Drive Reducer. J. Korean Soc. Precis. Eng. 2017, 34, 371–376. [Google Scholar] [CrossRef]
  25. Jeon, M.H.; Joen, N.; Kim, L.S.; Cho, S.H.; Lyu, S.K. Study on the Gear Tooth Micro-Geometry Optimization of Angle Drive Unit. J. Korean Soc. Precis. Eng. 2018, 35, 473–478. [Google Scholar] [CrossRef]
  26. Yaw, M.W.; Chong, K.H. Optimize Volume for Planetary Gear Train by using Algorithm Based Artificial Immune System. Int. J. Adv. Trends Comput. Sci. Eng. 2020, 9, 3757–3762. [Google Scholar] [CrossRef]
  27. Urbas, U.; Zorko, D.; Vukašinović, N. Machine learning based nominal root stress calculation model for gears with a progressive curved path of contact. Mech. Mach. Theory 2021, 165, 104430. [Google Scholar] [CrossRef]
  28. Zorko, D.; Štiglic, J.; Černe, B.; Vukašinović, N. The effect of center distance error on the service life of polymer gears. Polym. Test. 2023, 123, 108033. [Google Scholar] [CrossRef]
  29. Daoudi, K.; Boudi, E.M. Genetic Algorithm Approach for Spur Gears Design Optimization. In Proceedings of the International Conference on Electronics, Control, Optimization and Computer Science (ICECOCS), Kenitra, Morocco, 5–6 December 2018. [Google Scholar] [CrossRef]
  30. Taleb, A.A.; El Amine, M.; Sallaou, M.; Zaghar, H. Multi-level Optimization of Gear Trains with Spur Gears. In Proceedings of the 5th International Conference on Optimization and Applications (ICOA), Kenitra, Morocco, 25–26 April 2019. [Google Scholar] [CrossRef]
  31. Maputi, E.S.; Arora, R. Design optimization of a three-stage transmission using advanced optimization techniques. Int. J. Simul. Multidiscip. Des. Optim. 2019, 10, A8. [Google Scholar] [CrossRef]
  32. Gan, S.; Fang, X.; Wei, X. Parametric Analysis on Landing Gear Strut Friction of Light Aircraft for Touchdown Performance. Appl. Sci. 2021, 11, 5445. [Google Scholar] [CrossRef]
  33. Kalanchiam, M.; Mannai, B. Topology Optimization of Aircraft Fuselage Structure. Int. J. Aerosp. Mech. Eng. 2013, 7, 820–823. [Google Scholar] [CrossRef]
  34. Zhu, J.-H.; Zhang, W.-H.; Xia, L. Topology Optimization in Aircraft and Aerospace Structures Design. Arch. Comput. Methods Eng. 2016, 23, 595–622. [Google Scholar] [CrossRef]
  35. ISO 23509:2006; Bevel and Hypoid Gear Geometry. International Standard Organization: Geneva, Switzerland, 2006.
  36. Ferraiuolo, M.; Leo, M.; Citarella, R. On the Adoption of Global/Local Approaches for the Thermomechanical Analysis and Design of Liquid Rocket Engines. Appl. Sci. 2020, 10, 7664. [Google Scholar] [CrossRef]
  37. Guiggiani, M. The Science of Vehicle Dynamics, 1st ed.; Springer: Dordrecht, The Netherlands, 2014; pp. 1–356. [Google Scholar]
  38. Salamunović, D.; Karakašić, M.; Kljajin, M.; Glavaš, H. Design of the strengthened framework for a designed concept of the sport car body. In Proceedings of the IX International Conference—Industrial Engineering and Environmental Protection (IIZS 2019), Zrenjanim, Serbia, 3–4 October 2019. [Google Scholar]
  39. Kljajin, M.; Ivandić, Ž.; Karakašić, M. Elementi Strojeva-Zbirka Projektno-Konstrukcijskih Zadataka, 1st ed.; Mechanical Engineering Faculty: Slavonski Brod, Croatia, 2018; pp. 1–232. [Google Scholar]
  40. Miltenović, Đ.; Tica, M.; Miltenović, A.; Banić, M.; Živković, S.; Mišković, Ž. Pitting of Tooth Flanks of Crossed Helical Gears made of Sintered Steel. Trans. Famena 2014, 38, 77–88. [Google Scholar]
  41. Decker, K.-H. Elementi Strojeva, 3rd ed.; Golden Marketing—Tehnička Knjiga: Zagreb, Croatia, 2006; pp. 1–661. [Google Scholar]
  42. Ansys Workbench. Available online: https://www.ansys.com/products/ansys-workbench (accessed on 10 September 2023).
  43. Koutromanos, I. Foundamentals of Finite Element Analysis, 1st ed.; John Wiley & Sons Ltd.: Hoboken, NJ, USA, 2018; pp. 1–736. [Google Scholar]
  44. Ansys SpaceClaim. Available online: https://www.ansys.com/products/3d-design/ansys-spaceclaim (accessed on 15 September 2023).
  45. TuringBot. Available online: https://turingbotsoftware.com (accessed on 17 September 2023).
Figure 1. Algorithm of the proposed methodology.
Applsci 13 13300 g001
Figure 2. Kinematic chain of an ODT.
Applsci 13 13300 g002
Figure 3. Effect of torque, reaction force and friction force on the vehicle’s driving wheels.
Applsci 13 13300 g003
Figure 4. CAD model of ODT with bevel gears.
Applsci 13 13300 g004
Figure 5. Contact surfaces: (a) on the ring gear; (b) on the pinion gear.
Applsci 13 13300 g005
Figure 6. Global model: (a) tetrahedral finite element mesh; (b) boundary conditions.
Applsci 13 13300 g006
Figure 7. Distribution of total displacements in mm, pinion and bevel gear.
Applsci 13 13300 g007
Figure 8. Equivalent stress fields according to von Mises in MPa, pinion and bevel gear.
Applsci 13 13300 g008
Figure 9. Submodel of the pinion and ring gear: (a) finite element mesh; (b) distribution of total displacement in mm.
Applsci 13 13300 g009
Figure 10. Distribution of equivalent von Mises stress in MPa in the pinion and ring gear submodel.
Applsci 13 13300 g010
Figure 11. Drive shaft finite element model: (a) finite element mesh; (b) boundary conditions.
Applsci 13 13300 g011
Figure 12. Stress and displacement distribution of the drive shaft: (a) distribution of equivalent von Mises stress in MPa; (b) total deformation in mm.
Applsci 13 13300 g012
Figure 13. Ring gear geometry: (a) geometry obtained by the topological optimization method; (b) corrected geometry.
Applsci 13 13300 g013
Figure 14. General design parameters of the ring gear obtained by the TOM.
Applsci 13 13300 g014
Figure 15. Internal radius of the drive shaft.
Applsci 13 13300 g015
Figure 16. Values of the numerical model versus predicted values: (a) mass of the ring gear; (b) mass of the drive shaft; (c) overall mass of the optimized design elements.
Applsci 13 13300 g016
Figure 17. Sensitivity indices for the responses: overall mass, mass of the ring gear and mass of the drive shaft.
Applsci 13 13300 g017
Figure 18. Stress and displacement distribution of the optimized drive shaft: (a) distribution of equivalent stresses according to von Mises in MPa; (b) total displacements in mm.
Applsci 13 13300 g018
Figure 19. Distribution of equivalent von Mises stresses on ring gear.
Applsci 13 13300 g019
Figure 20. Mass comparison of the design elements of the differential transmission before and after optimization.
Applsci 13 13300 g020
Table 1. Vehicle design requirements and technical characteristics of the driving machine.
Design RequirementsAmount
Maximum vehicle speed at the highest transmission ratio (vmax), km/h220
Time required to reach a speed of 100 km/h (t0–100), s8.9
Vehicle mass (mv), kg1550
Maximum vehicle mass (mv, max), kg2100
Vehicle acceleration (av), m/s22.5
Dynamic wheel radius (rd), mm394.2
Technical characteristics of the driving machine
Max. engine torque (Tmax), Nm340
Number of revolutions at which Tmax is reached (nTmax), min−11600
Power delivered to the drive bevel gear (P1), kW53.05
Input torque to the differential transmission (T1), Nm1108.14
Table 2. Values of forces, transmission ratio, power and torques from the transmission’s input/output side.
Differential Transmission Forces and TorquesAmount
Reaction force in the wheel (Fw), N5150.25
Friction force (Ff), N4635.23
Traction force (FTR), N9270.45
Transmission ratio of the differential transmission (id)3.286
Output power of the differential transmission (P2), kW51.457
Rolling resistance force (FRO), N412.02
Rising resistance force (FRI), N2153.39
Vehicle’s inertial force (FIN), N6116.25
Total resistance force of driven machine (FTRD)8681.66
Torque of the hypoid ring bevel gear (T2), Nm3546.31
Torque of drive wheel (TW, TR, TL), Nm1773.16
Table 3. Variable values determined by iterative calculation.
VariablesFirst IterationLast Iteration
Ring gear mean pitch diameter (dm2), mm304.08305.59
Pinion offset angle in the axial plane (ζm), °11.2810.51
Pinion offset angle in the pitch plane (ζmp), °11.7811.34
Pinion gear pitch angle (δ1), °16.5922.31
Ring gear pitch angle (δ2), °67.5767.69
Mean normal module (mn), mm5.415.44
Spiral angle of pinion (βm1), °46.7846.34
Hypoid dimensional factor (F)1.1961.187
Pinion mean pitch diameter (dm1), mm110.7110.36
Mean cone distance of the pinion (Rm1), mm190.07145.35
Mean cone distance of the ring gear (Rm2), mm158.93165.16
Auxiliary angle (υm), °10.89.74
Iteration condition: ( R mint R m 1 < 0.0001 · R m 1 )|−47.537| < 0.019|−0.010| < 0.0145
Table 4. Geometric quantities determined by the control calculation of hypoid bevel gears.
Geometric QuantitiesAmount
PinionRing Gear
Shaft angle departure (ΔΣ), °00
Pinion offset angle in the axial plane (ζm), °10.68-
Pinion offset angle in the pitch plane (ζmp), °11.55-
Mean normal module (mn), mm5.55.5
Limit pressure angle (αlim), °−1.32−1.32
Mean normal pressure angle (αn), °2020
Crossing point to calculation point along ring gear axis (tzm2), mm-55
Crossing point to calculation point along pinion axis (tzm1), mm149.71-
Table 5. Amounts of stress in the tooth root and tooth face flank of pinion and ring bevel gear.
Pinion gearStress on tooth rootσFP1 = 357.14 MPaσF1 < σFP1
Fmt1 = 20,082.3 N
σF1 = 226.79 MPa
Stress on tooth face flankσHP1 = 1310.14 MPaσH1 < σHP1
σH1 = 1286 MPa
Ring gearStress on tooth rootσFP2 = 357.14 MPaσF2 < σFP2
Fmt2 = 23,987 N
σF2 = 149 MPa
Stress on tooth face flankσHP2 = 1324 MPaσH2 < σHP2
σH2 = 852.23 MPa
Table 6. Geometric quantities of planetary and sun bevel gears.
Geometric QuantitiesMarkAmount
PlanetarySunPlanetarySun
Pitch circle diameter, mmd3d4102136
Length of the derivative of the dividing cone, mmRa85
Tooth width, mmb3b42626
Middle pitch diameter of bevel gear, mmdm3dm485115.2
Clearance, mmc2.125
Whole depth, mmh3h419.12519.125
Addendum depth for zero pair of bevel gears, mmha3ha48.58.5
Dedendum depth for zero pair of bevel gears, mmhf3hf410.62510.625
Addendum circle diameter, mmda3da4115.599146.2
Teeth face angle, °κa3κa45.715.71
Face angle of bevel gear, °δa3δa442.5858.84
Inner addendum diameter of tooth, mmdia3dia484.24101.48
Pitch diameter of middle equivalent gear, mmdvm3dvm4106.25192
Pitch diameter of equivalent gear, mmdv3dv4127.5226.67
Addendum diameter of equivalent gear, mmdva3dva4144.5243.67
Base diameter of equivalent gear, mmdvb3dvb4119.81213
Table 7. Amounts of stress in the tooth root and tooth face flank of planetary and sun bevel gears.
Planetary gearStress on tooth rootσFP3 = 512.15 MPaσF3 < σFP3
Fmt3 = 15.391 N
σF3 = 274.93 MPa
Stress on tooth face flankσHP3 = 1441.1 MPaσH3 < σHP3
σH3 = 1400.04 MPa
Sun gearStress on tooth rootσFP4 = 512.5 MPaσF4 < σFP4
Fmt4 = 15.391 N
σF4 = 224.03 MPa
Stress on tooth face flankσHP4 = 1441.1 MPaσH4 < σHP4
σH4 = 954.44 MPa
Table 8. General design parameters and their values.
ParametersNameLower Value, mmUpper Value, mm
aVertical chamfer of the ring gear17
bHorizontal chamfer of the ring gear113
hOverhang height of the ring gear13
rInner radius of the drive shaft2.513.5
Table 9. Description of response variables.
ResponseNameDescription
mallOverall mass of optimized design elementsObjective function—mass reduction of the optimized design elements
m1Mass of the ring gearObjective function—mass reduction of the ring gear
m2Mass of the drive shaftObjective function—mass reduction of the drive shaft
Table 10. Values of general design parameters in the central composite design of the experiment.
No.a,
mm
b,
mm
h,
mm
r,
mm
No.a,
mm
b,
mm
h,
mm
r,
mm
1.472814.6.112.771.304.13
2.4722.515.6.112.771.3011.87
3.47213.516.6.112.772.704.13
4.471817.6.112.772.7011.87
5.473818.1.8911.231.304.13
6.172819.1.8911.231.3011.87
7.772820.1.8911.232.704.13
8.412821.1.8911.232.7011.87
9.4132822.6.1111.231.304.13
10.1.892.771.304.1323.6.1111.231.3011.87
11.1.892.771.3011.8724.6.1111.232.704.13
12.1.892.772.704.1325.6.1111.232.7011.87
13.1.892.772.7011.87
Table 11. Accuracy of the RS model for response variables.
ResponsesR2RMSE
Overall mass0.995320.03193
Mass of the ring gear0.995890.00149
Mass of the drive shaft0.999880.00700
Table 12. Optimized values of input design parameters.
ParameterValue, mm
a7
b13
h3
r13.5
Disclaimer/Publisher’s Note: The statements, opinions and data contained in all publications are solely those of the individual author(s) and contributor(s) and not of MDPI and/or the editor(s). MDPI and/or the editor(s) disclaim responsibility for any injury to people or property resulting from any ideas, methods, instructions or products referred to in the content.

