Article

Multidirectional Landing Kinetics, Stabilisation Times, and Associated Isokinetic Knee Torques of High-Level Female Netball Players

1
Physical Activity, Sport, and Recreation (PhASRec) Research Focus Area, North-West University (NWU), Potchefstroom 2531, South Africa
2
Centre for Health and Human Performance, North-West University (NWU), Potchefstroom 2531, South Africa
*
Author to whom correspondence should be addressed.
Appl. Sci. 2023, 13(3), 1261; https://doi.org/10.3390/app13031261
Submission received: 11 December 2022 / Revised: 12 January 2023 / Accepted: 12 January 2023 / Published: 17 January 2023

Abstract

:

Featured Application

Evaluation of stabilisation times and landing strength requirements in high-level female netball players.

Abstract

Netball is a multidirectional sport afflicted by a relatively high proportion of lower-extremity injuries. The purpose of this study was to evaluate the relationships between multidirectional landing stabilisation times, unilateral landing kinetics, and isokinetic knee joint torques in elite female netball players. A total of 15 players volunteered for the study (age: 20.80 ± 1.42 years; height: 1.75 ± 0.06 m; body mass: 71.69 ± 13.58 kg). All players completed a minimum of 25 multidirectional, unilateral landing tasks, as well as isokinetic dynamometry, to evaluate both concentric and eccentric knee flexion and extension torques. Players showed rapid stabilisation times upon landing (2.02 ± 0.69 s) coupled with moderately high landing forces (4.06 ± 0.82 BWs) and comparatively low isokinetic knee extensor (2.01 ± 0.49 N·m·kg−1) and flexor (1.33 ± 0.30 N·m·kg−1) strength. Moderate positive ( r ¯ = 0.61) and negative ( r ¯ = −0.63) correlations were observed between peak isokinetic knee joint strength and the force–time waveform during the early and late weight-acceptance phases of multidirectional jump landings prior to stabilisation. Multidirectional landing kinetics can potentially provide valuable insights related to TTS and possible associations with isolated knee joint musculature during the weight-acceptance phase of jump landings.

1. Introduction

Netball is a multidirectional team sport that is reliant on high levels of endurance, speed, power, strength, agility, and flexibility for optimal performance [1,2]. Netball players, in particular, are challenged further on the basis that their sport requires frequent accelerations, decelerations, and directional changes that result in a non-trivial probability of injury, especially to the knee and ankle joints [1,3]. More specifically, the injury incidence rate of netball players is ~11.3–14 injuries per 1000 player hours, with the ankle and knee joints accounting for 13–86% and 8–50% of all injuries, respectively, depending on the age and level of play [1,3,4,5]. Given the physical demands (e.g., agility), outcomes (e.g., potential injury), and growing competitiveness of the sport, the monitoring of certain performance characteristics has become increasingly important.
The most common mechanisms of injury in netball are largely ascribed to landing (~12–38%), trips/falls (~12–29%), collisions (~8–28%), and direct ball contact (~6%) [1,3,6,7,8]. Given that injuries from landing tend to predominate the injury spectrum and that the choice of landing is situationally dependent, the evaluation of landing mechanics is likely to inform injury risk, as well as guide conditioning strategies to mitigate these risks [2,7,9]. In this line, experimental evidence has shown that dynamic postural control during landing, which is contingent on a functional neuromuscular system, is a likely contributing factor for injury, especially in soft tissue structures of the knee and ankle in female athletes [10,11,12,13].
Although neuromuscular deficits of the lower extremities are typically measured using static unilateral positions [5,14,15,16], more dynamic tasks are considered a better fit for the evaluation of athletic populations [17,18]. As such, to provide an objective measure of postural stability, the time-to-stabilisation (TTS) measurement technique is used to evaluate the time taken to reach a stable position following a jump-landing task [17,18,19]. The evaluation of dynamic stability exhibits additional utility on the basis that it is dependent on good lower-extremity muscular strength, as strength deficits have been associated with slower stabilisation times [20,21]. However, to determine whether the TTS demonstrates a relationship between knee joint strength and dynamic stability would require further research, especially among athletic populations. Furthermore, almost no research exists on the functional integration between unilateral multidirectional landing kinetics, TTS, and lower-extremity muscular strength in elite netball players [22].
Therefore, the primary objectives of the current study were fourfold: (i) to assess differences in unilateral knee-joint muscle strength; (ii) to evaluate whether unilateral landing kinetics differ as a function of landing direction; (iii) to determine whether TTS values are dependent on the unilaterality and directionality of landing, as well as knee joint strength; and (iv) to examine the relationship between unilateral multidirectional landing kinetics, TTS, and knee-joint strength in high-level netball players. We hypothesised that: (i) force–time profiles would differ as a function of jump-landing direction [22], (ii) TTS would exhibit significant differences depending on landing direction and unilaterality and would be negatively correlated with eccentric knee-extensor strength [19], and (iii) eccentric knee-extensor torque would likely exhibit significant negative correlations with landing force and TTS [21]. The expected findings should therefore provide useful information related to the effectiveness of knee-joint strengthening and conditioning with respect to the ability to stabilise the body upon landing and whether there is any transferability between isokinetic strength testing and dynamic joint loading during functional landing tasks.

2. Materials and Methods

2.1. Participants

To achieve a statistical power of 0.80, a minimum sample size of 13 participants was calculated a priori based on the following inputs: (i) repeated measures study design with 5 repeated measures, (ii) an anticipated effect size f of 0.25, (iii) alpha-error probability of 0.05, and (iv) a minimum expected correlation of at least 0.70 between repeated measurements [23,24]. A total of 15 high-level female netball players volunteered to participate in this study. For inclusion, participants had to be aged 18–25 years; play for the first team at the university level; and be free of any physical limitations, health problems, or musculoskeletal injuries at the time of testing. All participants were informed of the benefits and risks of the study, as well as all procedures associated with data collection. Furthermore, all participants read and signed an informed consent form prior to their initiation in the study.

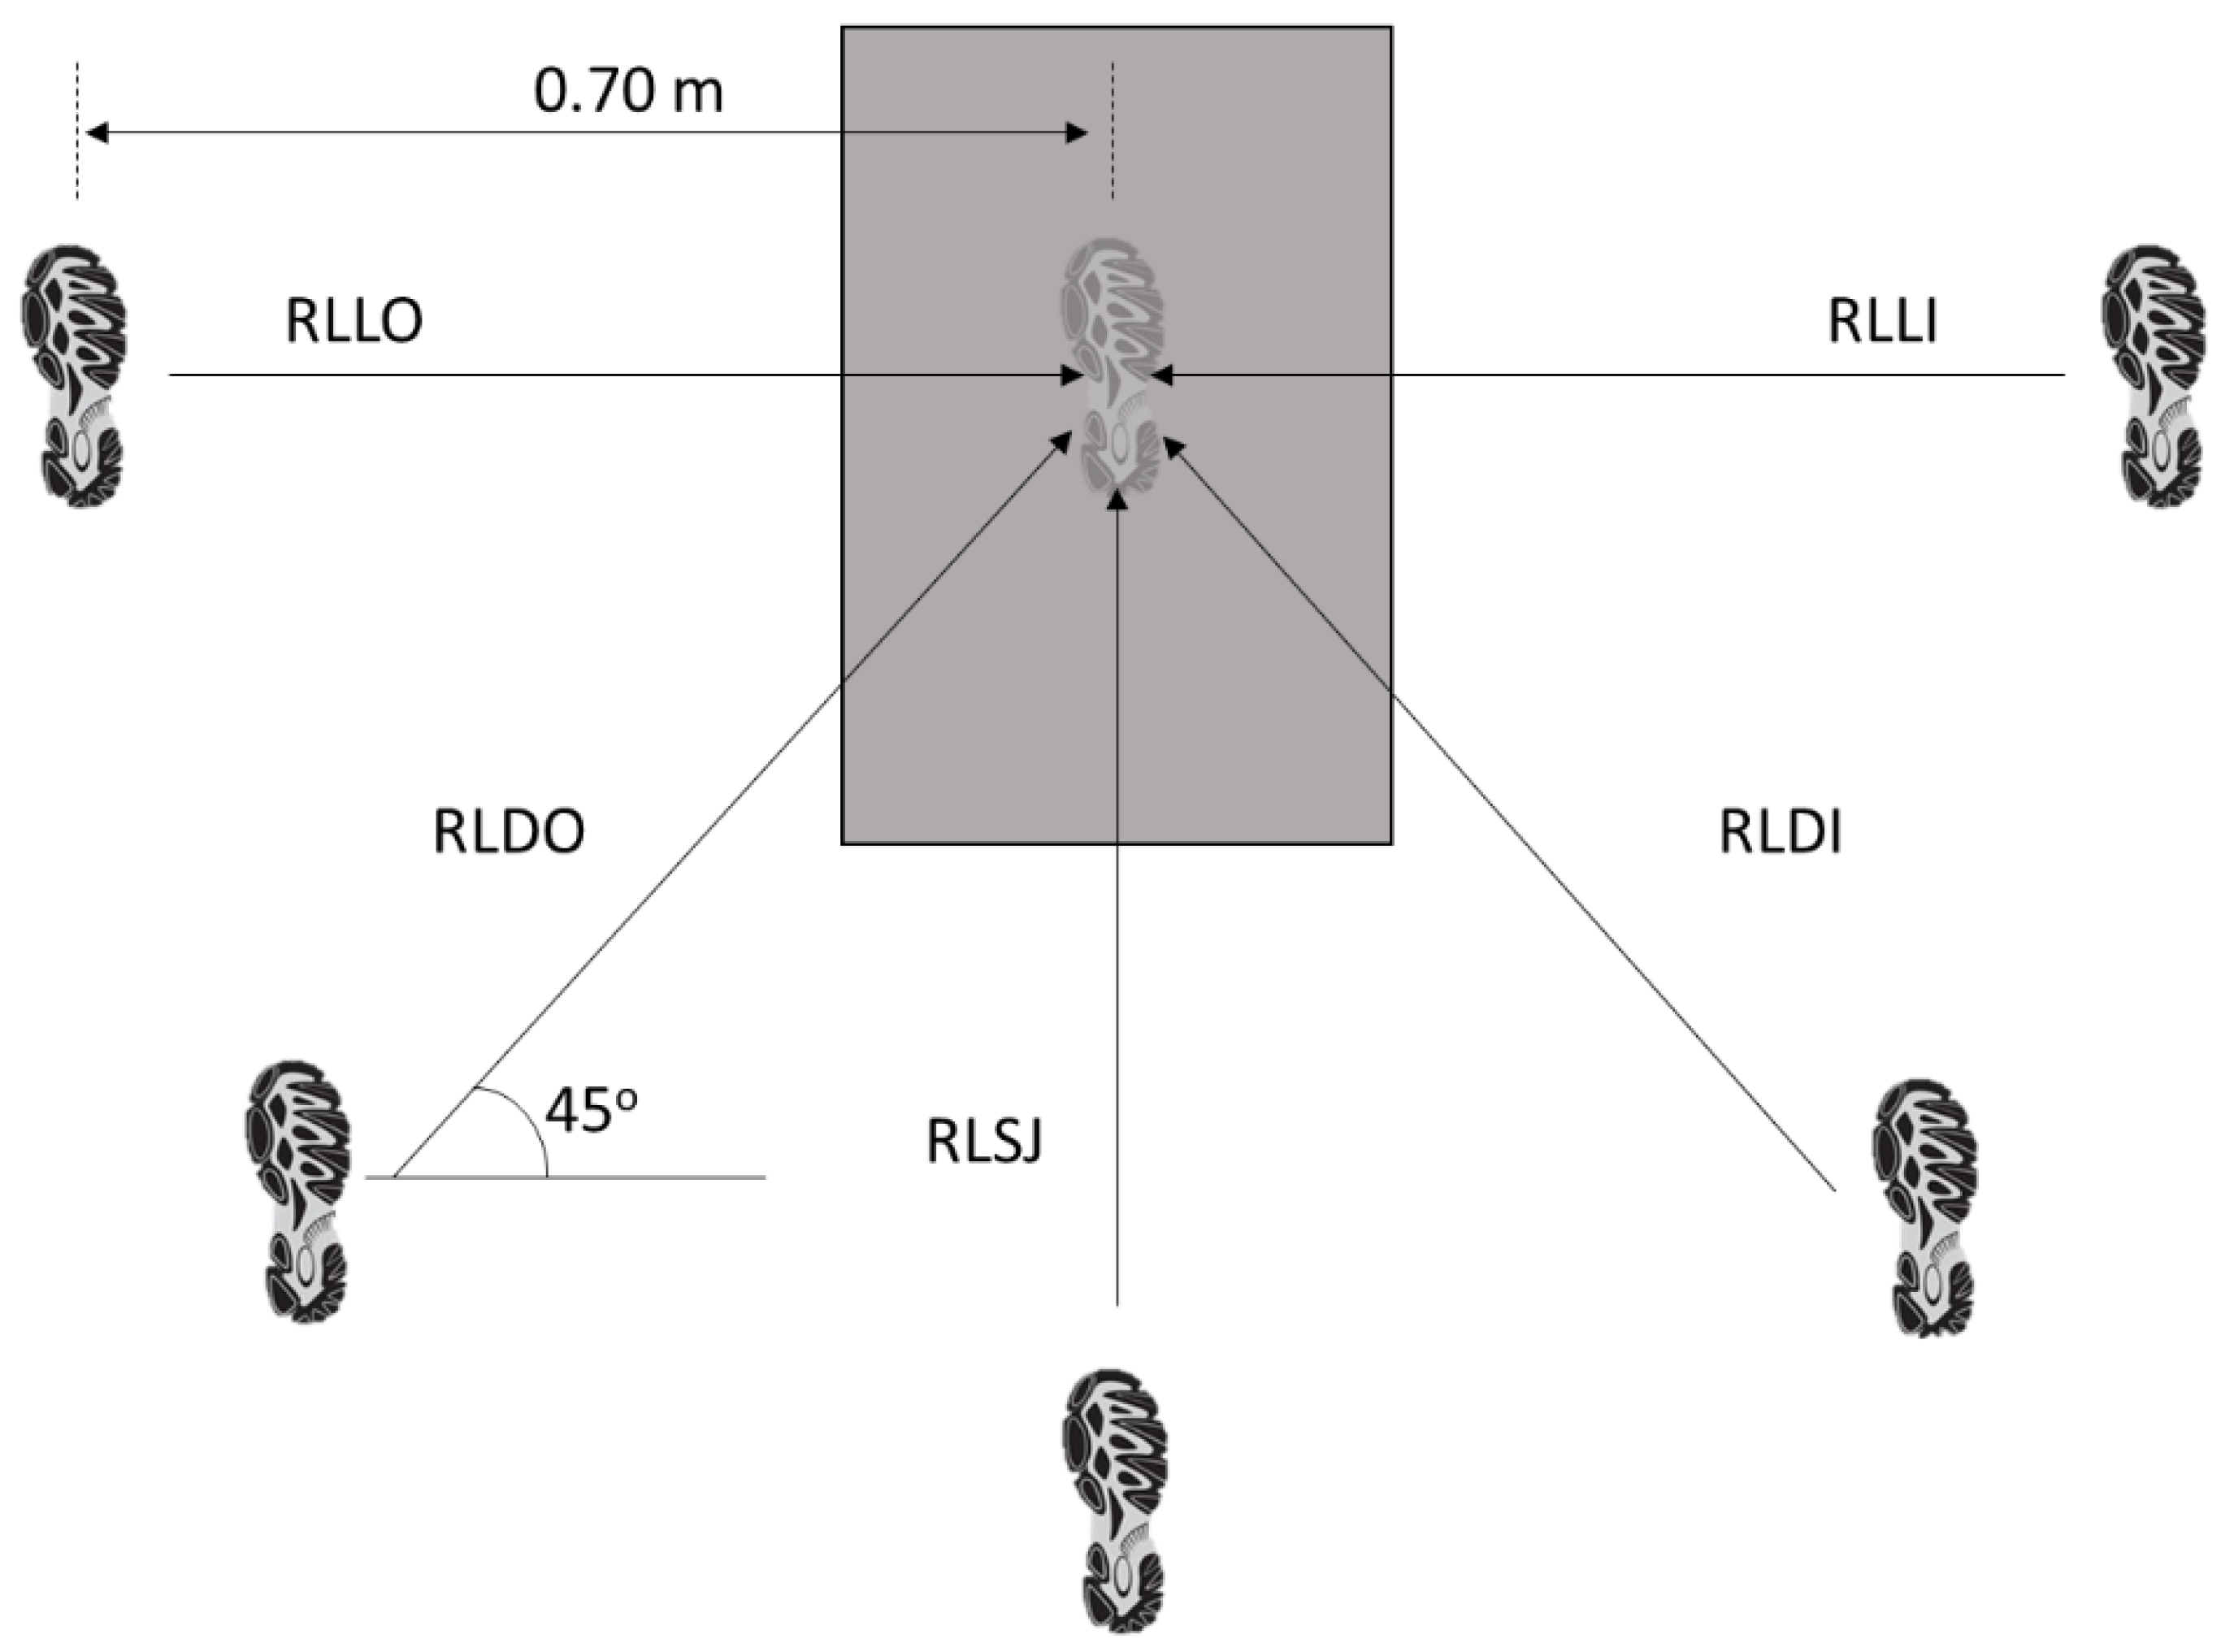
2.2. Experimental Design

A repeated measures study design was utilised to compare multidirectional landing forces (direction: forward, diagonal inside, diagonal outside, lateral inside, and lateral outside) of the dominant and non-dominant legs, as well as the concentric and eccentric isokinetic knee flexion and extension torques at an angular velocity of 60 °/s. Jumping and strength tests were separated by 72 h and were completed at the same time of day (within ± 1 h) and under similar environmental conditions (~21–22 °C and ~55–60% humidity).

2.3. Testing Procedures

A standardised 5 min warm up preceded all testing, consisting of cycling at a cadence of 75 rpm at a rating of perceived exertion (RPE) of 2 (modified Borg Scale), followed by dynamic stretches of the quadriceps and hamstring musculature [25,26]. For all isokinetic tests, participants were evaluated in a seated position with straps placed over their shoulders, waist, and distal thigh for stabilisation. The axis of rotation of the dynamometer was aligned with the lateral epicondyle of the knee, and participants were obligated to cross their arms across their chest during testing to avoid force transfer. The bottom edge of the resistance pad of the dynamometer was fixed to the shank of the lower leg approximately 3 cm above the lateral malleolus [27]. For concentric isokinetic trials (CON), participants were required to complete 5 maximal repetitions for each leg at 60 °/s. Following a 5 min rest period, eccentric isokinetic trials (ECC) were completed at 60 °/s for a total of 5 repetitions for each leg. All torque values were gravity-corrected, and the average of all 5 trials for each leg (i.e., dominant vs. non-dominant), as well as each contraction type (i.e., concentric vs. eccentric), was used for analysis.
All jump-landing trials were completed by jumping bilaterally from a 0.30 m box and landing unilaterally onto a force plate located 0.70 m from the box (see Figure 1) [28,29]. Participants were instructed to stabilise as quickly as possible upon landing and to remain as motionless as possible during the capture period of 8 s. A capture period of 8 s was chosen to account for the lag time between the instruction to jump and the athlete initiating the jump, such that at least 5 s can be recorded on the force plate [19]. A total of 5 successful landing trials for each leg and each jumping direction were required, resulting in a total of 50 landings (i.e., 25 per leg). Any unsuccessful landings (e.g., loss of balance or landing bilaterally) were repeated. During testing, participants were not required to keep their hands akimbo but rather to position their hands in preparation to catch a netball ball in order to simulate match-play requirements more accurately and enhance the ecological validity of the testing. Finally, leg dominance was defined as the leg used to kick a ball; all participants identified as right-leg-dominant [30]. In each instance, the average of all 5 trials for each landing direction was retained for analysis.

2.4. Measurement Equipment and Data Analysis

Height (Stadiometer Seca 202, Seca Ltd., Hamburg, Germany) and body mass (Seca Scale, Seca Ltd., Hamburg, Germany) were evaluated upon arrival at the testing facility. Cycling-based warmups were completed on a stationary cycling ergometer (WattbikePro, Technogym, Fairfield, NJ, USA). All concentric and eccentric knee torques were evaluated on an isokinetic dynamometer (Cybex II, HUMAC®/Norm™; Computer Sports Medicine, Inc., Stoughton, MA, USA), and the raw data were exported to MATLAB for further analysis (R2022a, Mathworks™, Natick, MA, USA). Custom MATLAB code separated extension and flexion torques, normalised the torques to the relative movement time as well as body mass, calculated the mean torques across all repetitions, and extracted the peak torque values relative to the normalised duration.
The landing forces were recorded on an AMTI force plate (AMTI, Watertown, MA, USA) at 2000 Hz with all force data files exported to MATLAB for further analysis. Custom MATLAB code was written to (i) normalise the landing duration from the instant of landing (defined as the point at which vertical ground reaction force (GRF) first exceeds 30 N) until the end of the recording (i.e., 8 s), (ii) normalise the landing force relative to body mass, (iii) extract the peak normalised landing force, (iv) ascertain the time to stabilisation (TTS) upon landing after which the force trace remained within a an average range of variation of body weight (mean + 5 SD), and (v) derive the centre of mass (CoM) displacement using inverse kinetics to contextualise the eccentric and concentric landing phases [14,19,31,32,33].

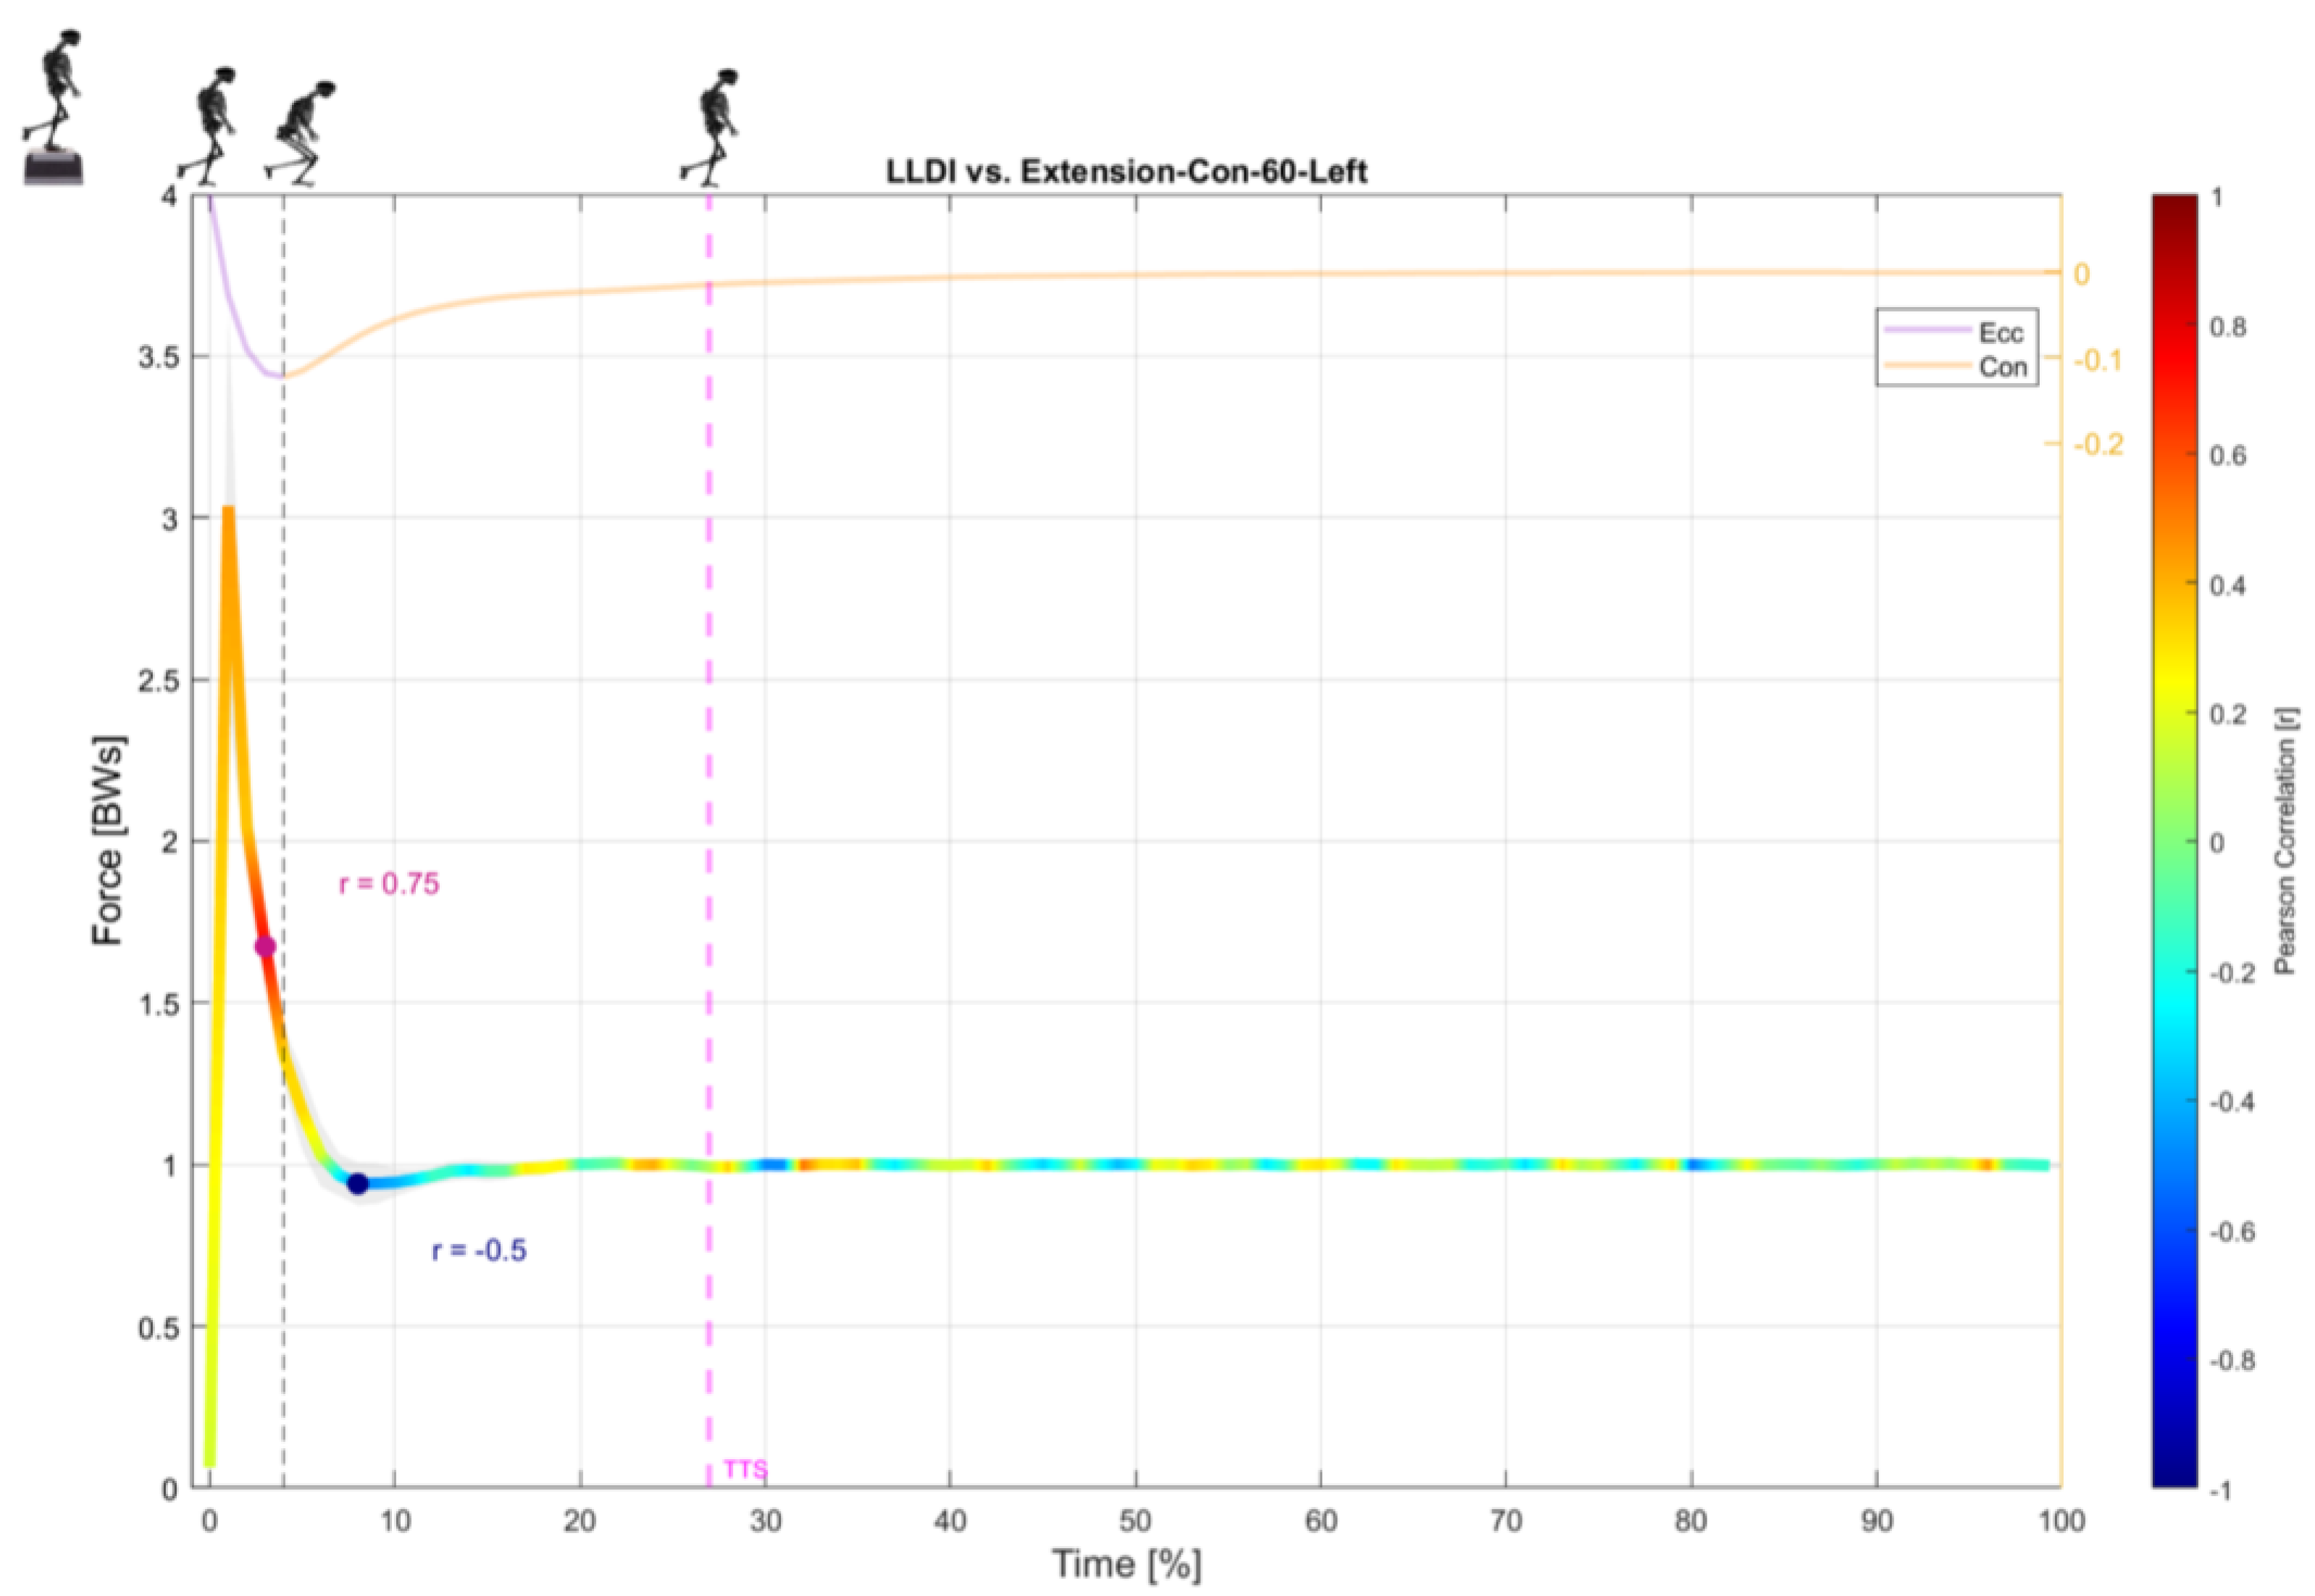
2.5. Statistical Analyses
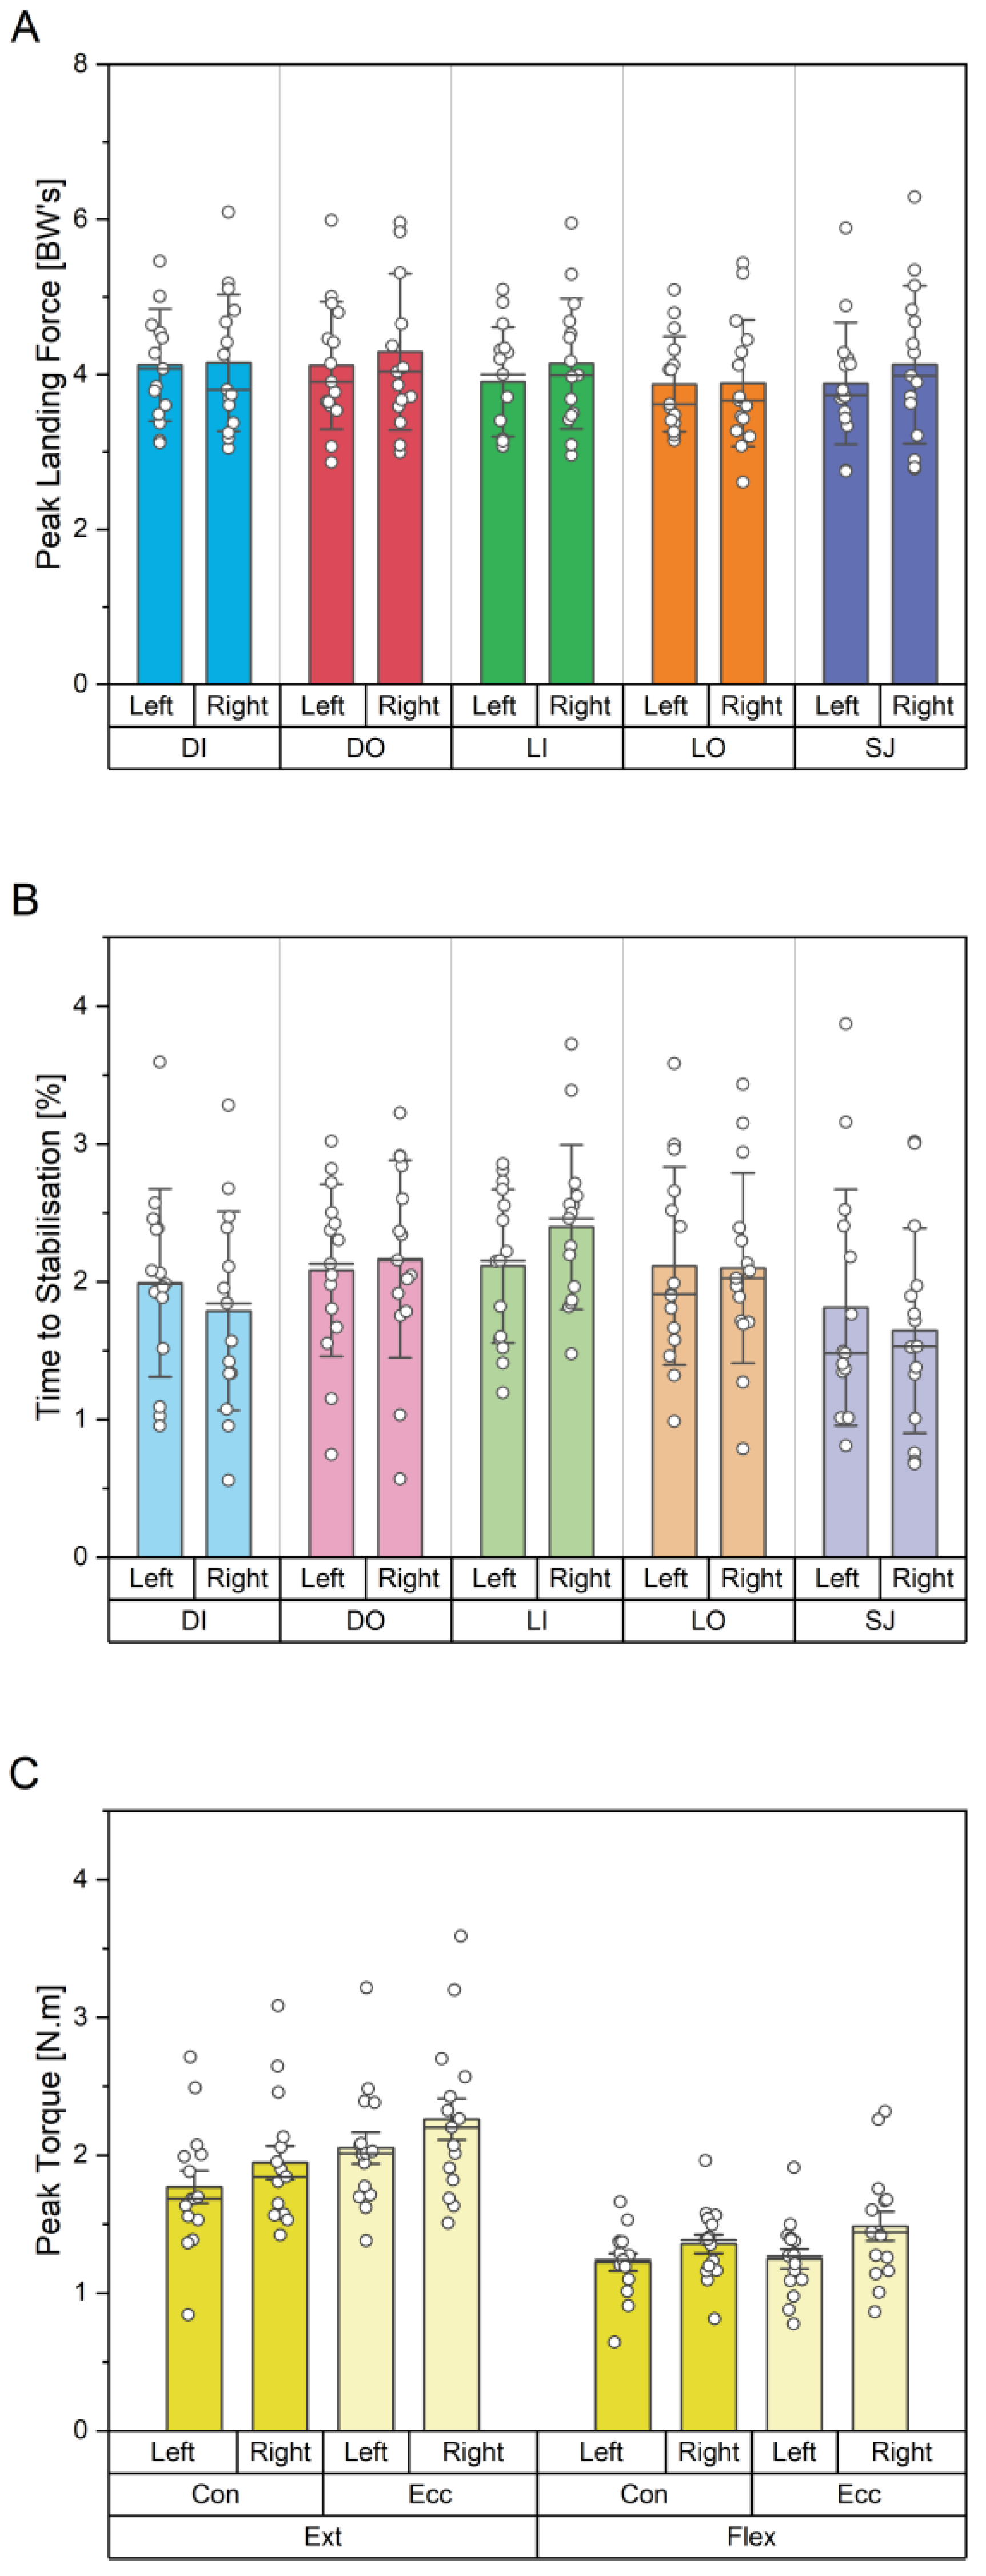
Data were evaluated for normality using the Shapiro–Wilk test, normality being accepted at an alpha > 0.05. Given that data conformed to normality, they are presented as mean ± SD unless otherwise stated.
For the first objective, a two-way repeated measures ANOVA was utilised (factor A: leg (dominant vs. non-dominant); factor B: contraction type (concentric vs. eccentric)) to evaluate differences in normalised peak torques. To meet the second and third objectives, we used a two-way repeated measures ANOVA (factor A: leg (left (non-dominant) vs. right (dominant)); factor B: landing direction (diagonal inside (DI), diagonal outside (DO), lateral inside (LI), lateral outside (LO), or straight jump (SJ)) to evaluate differences in normalised peak landing force and TTS. For instances in which significant within-subject effects were present, post hoc Tukey correction was used to evaluate these differences, coupled with partial eta square (η2p) as a measure of the standardised effect size. Spearman rank correlation was used to evaluate the association between isokinetic knee torques and TTS values, with the correlation coefficient qualitatively interpreted in absolute terms as follows: rs: |0.00–0.20| = negligible; |0.21–0.40| = weak; |0.41–0.60| = moderate; |0.61–0.80| = strong; |0.81–1.00| = very strong [34].
To accomplish the fourth objective, we employed the statistical parametric mapping (SPM) equivalent of regression to evaluate the relationship between the continuous 1-D force–time curve from the force plate and the 0-D peak torque values from an isokinetic dynamometer (MATLAB, SPM1d, v. M.0.4.7). The correlation coefficients from the regression analyses were qualitatively interpreted in absolute terms as follows: r: |0.00–0.10| = negligible; |0.10–0.39| = weak; |0.40–0.69| = moderate; |0.70–0.89| = strong; |0.90–1.00| = very strong [35]. SPM analyses are based on random field theory, which describes the probabilistic behaviour of random curves and accounts for the smoothness of the data, which is used to set a critical threshold (α = 0.05) [36,37]. If the SPM curves exceed this critical threshold, the variable of interest (e.g., force–time curve or torque–time curve) is deemed to be significantly different at these specific time nodes.
All statistical analyses were completed using Jamovi (Version 2.2.5.0, R 4.0) and MATLAB (R2022a, Mathworks™, Natick, MA, USA). Statistical significance was accepted when p ≤ 0.05.

3. Results

A total of 15 participants were included in the final analysis (age: 20.80 ± 1.42 years; height: 1.75 ± 0.06 m; body mass: 71.69 ± 13.58 kg). The summary data and individual data points for peak landing forces, TTS, and isokinetic peak torques are highlighted in Figure 2.
The two-way repeated measures ANOVA results for the isokinetic knee torques are shown in Table 1.
Follow-up analysis using Tukey correction showed that significant unilateral leg strength differences were present in favour of the dominant leg (Mdiff = 0.19 N·m·kg−1, t(14) = 2.84, pTukey = 0.013). Similarly, significant differences were present between CON and ECC contraction types in favour of ECC (Mdiff = 0.19 N·m·kg−1, t(14) = 2.88, pTukey = 0.012). The two-way repeated measures ANOVA results for both peak landing forces and TTS are shown in Table 2. Of the leg * muscle interactions, significant differences were specifically noted between left and right flexors (Mdiff = 0.18 N·m·kg−1, t(14) = 3.49, pTukey = 0.017) in favour of the non-dominant leg.
In terms of peak landing forces, post hoc Tukey correction was employed for follow-up analyses, showing that statistically significant differences were evident between DI and LO directions (Mdiff = 0.25 BWs, t(14) = 3.16, pTukey = 0.046), as well as between DO and LO directions (Mdiff = 0.32 BWs, t(14) = 4.29, pTukey = 0.006), but not for the other directions (see Supplementary Tables S1–S4). Similarly, follow-up evaluation of the leg * direction interaction revealed significant differences between the right leg in the DI and LO directions (Mdiff = 0.41 BWs, t(14) = 2.77, pTukey = 0.010) but not for the other interactions (see Supplementary Tables S1–S4).
Significant directional differences were repeatedly observed for TTS, specifically between the DI and LI directions (Mdiff = −0.37 s, t(14) = −3.14, pTukey = 0.048). Comparable mean differences were also observed between DO and SJ (Mdiff = 0.39 BWs, t(14) = 2.34, pTukey = 0.191), as well as between the LI and SJ directions (Mdiff = 0.53 BWs, t(14) = 3.05, pTukey = 0.052), although these differences did not reach statistical significance (see Supplementary Tables S1–S4).
Correlation analyses between multidirectional TTS and isokinetic knee torques are shown in Figure 3. There is evidence of a moderate negative association between eccentric knee extensor and flexor strength and TTS in the DI direction, whereas all other associations are negligible or weak. There is also evidence of significant differences in TTS between jumping directions (e.g., DI vs. LI: rs = 0.38, p < 0.05; DO vs. LI: rs = 0.38, p < 0.05; DO vs. LO: rs = 0.44, p < 0.05).
The results for the SPM regression analyses are shown in Figure 4. A representative mean force–time waveform of all participants is shown for the non-dominant leg in the DI direction, together with the representative CoM displacement (see Supplementary Figures S1–S4 for all force–time traces for each landing direction). Strong positive correlations (red-shifted in Figure 4 and Supplementary Figures S1–S4) imply that higher force values within a given region are associated with higher peak torque values (i.e., greater quadricep or hamstring strength), whereas strong negative correlations (blue-shifted in Figure 4 and Supplementary Figures S1–S4) denote that lower force values are associated with higher peak torque denominations.

4. Discussion

Concerning high-level female netball players, the primary findings of the present study are fourfold. Firstly, although significant between-leg strength differences were present (F(1,14) = 8.92, p = 0.013, η2p = 0.39), these differences did not seem to translate to more challenging dynamic stabilisation tasks (F(1,14) = 0.00, p = 0.966, η2p < 0.01). Secondly, peak landing forces and TTS values were both influenced by landing direction, specifically in the diagonal direction, highlighting this as an important yet potentially under-researched component. Thirdly, eccentric knee extensor and flexor strengths exhibited a moderate negative correlation with TTS values in the diagonal direction, again highlighting the importance of directionality in conjunction with eccentric muscle strength. Finally, the SPM results reveal weak-to-strong correlations between knee torque and landing force at specific time nodes during both early and late weight acceptance when landing. The magnitude of the association varied considerably along the force waveform and was dependent on the landing direction, potentially highlighting the varying role of both concentric and eccentric quadricep and hamstring strength at specific time points during landing.
Explosive jumps and abrupt landing decelerations are fundamental components of many movements performed within netball [7,22]. Players typically complete ~58 jumps during a game, the majority of which (~66%) are unilateral across multiple directions [22,38]. The ability to repeatedly tolerate moderately high loads upon landing (e.g., 3.4–5.7 BWs) throughout a match is of considerable importance and largely dependent on both the concentric and eccentric strength of the lower limb musculature. Because peak-impact GRFs are proportional to landing height, jumping distance, and landing strategy [22,39,40], in the present study, we sought to isolate the effects of directionality by fixing the jump height and distance. Within the sample of athletes analysed herein, the peak landing loads (4.05 ± 0.82 BWs) were on par with those reported in the literature [21,39,41], but the concentric and eccentric knee extensor and flexor torques of the participants were considerably lower than literature reports [42,43]. Despite the subpar torques, knee-joint strength was adequate to comfortably withstand all jump landings. Importantly, no preceding studies have investigated whether diagonal jump-landing tasks pose a meaningful challenge to netball athletes that could be considered distinctive compared to lateral, vertical, and forward directions [22,33,44]. However, the results of the present study show that diagonal landing does lead to significant differences in both landing force and TTS and should therefore form part of testing and training batteries.
Given that neuromuscular control during landing is an important performance component for netball players, the present study demonstrates that high-level players were able to stabilise rapidly upon landing. Although the jump-landing task used in the present study is relatively straightforward, the choice of jump-landing task is a trade-off between the rules of netball (i.e., stick the landing) and the evaluation of dynamic stability. Because single-leg landings are likely to challenge the postural control system of individuals, baseline reference data such as that provided in the present study may allow clinicians to identify specific unstable landing patterns that may be associated with injury [17,33,45]. Experimental evidence suggests that dynamic stability is associated with lower-extremity strength, as well as neuromuscular control [20,21]. The present study appears to corroborate such findings, as there seems to be credible evidence that TTS data are likely associated with eccentric knee extensor and flexor strength. More specifically, a novel finding of the present study is that moderately large negative correlations were evident between peak isokinetic knee-joint torques and peak landing forces specifically for the diagonal landing directions. Diagonal inside and outside landings seemed to yield substantially larger forces compared to straight-line landing, which can likely be ascribed to a potential lack of multidirectional training variability and/or specificity in netball conditioning and injury prevention programs (i.e., mostly dominated by sagittal plane movements not directly evaluated in the present study) [46,47]. Given such findings, coupled with the CoM displacements in the present study (see Figure 4 and Supplementary Figures S1–S4), it is plausible to infer that those with higher capacities for generating greater torques tend to exhibit ‘softer’ landings, given that larger knee angles are typically associated with lower GRF values upon landing [22,28]. Transferability of training and the potential for injury mitigation should therefore be a central tenet of any strength and conditioning program and is an area of research that should receive much more attention [48].
Kotsifaki et al. [49] showed that in healthy controls, the knee joint contributes the most joint work (e.g., ~65%) during single-leg landing, followed by the hip (~22%) and ankle (~13%). Additionally, the relative contributions of the knee are taxed to an even greater extent during landing following horizontal jumping (64.7%) compared to vertical jumping (34.3%) [50]. Although the general relationship between knee strength and jumping performance is well understood, no previous research has investigated the associations between these parameters at different time points during landing subphases [50,51,52]. The present study is the first to use SPM techniques to better understand the continuous association between unilateral knee joint torques and landing forces at specific time nodes, thereby providing insights into the relationship that extends beyond simple correlations such as those shown in Figure 3 (i.e., peak torque and peak landing force). More specifically, the SPM results demonstrate that CON strength was, on average, positively associated with force during the early weight-acceptance phase of jump landing (i.e., shortly after peak landing force) and negatively associated with force during the late weight-acceptance phase (i.e., shortly before TTS) (see Supplementary Figures S1–S4). The ECC strength was, on average, negatively associated with force during initial contact and positively associated with force during the early weight-acceptance phase (see Supplementary Figures S1–S4). Importantly, these associations were found to vary according to the landing direction, showing that multidirectional single-leg landings require both strength and proprioception to varying degrees for stabilisation in uninjured participants [45]. Future research should explore the extent to which these associations are malleable with regard to injury and/or conditioning.
Although the present study has several strengths, the limitations must also be acknowledged. While high-level netball players are difficult to source due to intense training and competition schedules, a larger sample size would increase the generalisability of the findings, as well as the statistical power of the results. More dynamic tasks such as drop-jump stabilisations should be in considered in future. The present study focused only on knee torques, but future research should incorporate hip and ankle torques if possible, although this would substantially increase the testing duration. Future studies should also include the effects of interventions focused on optimising TTS, landing kinetics, and knee torques or compare the effects of injury according to the same parameters. Finally, the associations between laboratory-based parameters and match-play parameters should also be investigated to ensure transferability of findings.

5. Conclusions

Multidirectional landing kinetics can provide valuable insights related to TTS and possible associations with isolated knee-joint, musculature particularly during the early and late weight-acceptance phase of jump landings. Moderate evidence was present for the association between eccentric knee extensor strength and TTS in the diagonal landing directions, and there appears to be a greater association between concentric knee extensor strength and the weight-acceptance landing force. Furthermore, significant differences in peak multidirectional landing forces, particularly for lateral and diagonal landings, may hint at a lack of training variability and/or specificity, which would likely need to be addressed.

Supplementary Materials

The following supporting information can be downloaded at: https://www.mdpi.com/article/10.3390/app13031261/s1. Figure S1: SPM Regression between multidirectional landing force waveforms and peak concentric knee extension torques. Figure S2: SPM Regression between multidirectional landing force waveforms and peak eccentric knee extension torques. Figure S3: SPM Regression between multidirectional landing force waveforms and peak concentric knee flexion torques. Figure S4: SPM Regression between multidirectional landing force waveforms and peak eccentric knee flexion torques. Table S1: Post Hoc Comparisons—Direction. Table S2: Post Hoc Comparisons-Leg * Direction. Table S3: Post Hoc Comparisons—Direction. Table S4: Post Hoc Comparisons-Leg * Direction.

Author Contributions

The contributions of the authors were as follows: conceptualization, H.V.H. and M.K.; methodology, H.V.H. and M.K.; formal analysis, M.K.; data curation, L.K. and M.K.; writing—original draft preparation, L.K. and M.K.; writing—review and editing, L.K., H.V.H., Y.W. and M.K.; visualization, M.K.; supervision, H.V.H., Y.W. and M.K. All authors have read and agreed to the published version of the manuscript.

Funding

This research received no external funding.

Institutional Review Board Statement

This study was conducted in accordance with the Declaration of Helsinki and approved by the Human Research Ethics Committee of North-West University (NWU-00955-19-S1).

Informed Consent Statement

Informed consent was obtained from all subjects involved in the study.

Data Availability Statement

The dataset for the study is freely available in the Harvard Dataverse and can be accessed via the following link: https://doi.org/10.7910/DVN/FYOJ4U.

Acknowledgments

The authors would like to thank all the athletes for their dedication and commitment to training and research.

Conflicts of Interest

The authors declare no conflict of interest.

References

  1. Pillay, T.; Frantz, J. Injury prevalence of netball players in South Africa: The need for injury prevention. S. Afr. J. Physiother. 2012, 68, 7–10. [Google Scholar] [CrossRef] [Green Version]
  2. Thomas, C.; Comfort, P.; Jones, P.A.; Dos’Santos, T. Strength and Conditioning for Netball: A Needs Analysis and Training Recommendations. Strength Cond. J. 2017, 39, 10–21. [Google Scholar] [CrossRef]
  3. Downs, C.; Snodgrass, S.J.; Weerasekara, I.; Valkenborghs, S.R.; Callister, R. Injuries in Netball-A Systematic Review. Sports Med.-Open 2021, 7, 3. [Google Scholar] [CrossRef] [PubMed]
  4. Hopper, D.; Elliott, B.; Lalor, J. A descriptive epidemiology of netball injuries during competition: A five year study. Br. J. Sports Med. 1995, 29, 223–228. [Google Scholar] [CrossRef] [Green Version]
  5. Fong, D.T.P.; Hong, Y.; Chan, L.K.; Yung, P.S.H.; Chan, K.M. A systematic review on ankle injury and ankle sprain in sports. Sports Med. 2007, 37, 73–94. [Google Scholar] [CrossRef] [Green Version]
  6. Collings, T.J.; Gorman, A.D.; Stuelcken, M.C.; Mellifont, D.B.; Sayers, M.G.L. Do the landing mechanics of experienced netball players differ from those of trained athletes competing in sports that do not require frequent landings? J. Sci. Med. Sport 2020, 23, 48–52. [Google Scholar] [CrossRef] [Green Version]
  7. Fox, A.S.; Spittle, M.; Otago, L.; Saunders, N. Descriptive analysis of landings during international netball competition: Enhancing ecological validity of laboratory testing environments. Int. J. Perform. Anal. Sport 2013, 13, 690–702. [Google Scholar] [CrossRef]
  8. Hopper, D.; Lo, S.K.; Kirkham, C.; Elliott, B. Landing patterns in netball: Analysis of an international game. Br. J. Sports Med. 1992, 26, 101–106. [Google Scholar] [CrossRef] [PubMed] [Green Version]
  9. Clark, N.C. Noncontact Knee Ligament Injury Prevention Screening in Netball: A Clinical Commentary with Clinical Practice Suggestions for Community-Level Players. Int. J. Sports Phys. Ther. 2021, 16, 911–929. [Google Scholar] [CrossRef]
  10. Meardon, S.; Klusendorf, A.; Kernozek, T. Influence of Injury on Dynamic Postural Control in Runners. Int. J. Sports Phys. Ther. 2016, 11, 366–377. [Google Scholar]
  11. Paterno, M.V.; Schmitt, L.C.; Ford, K.R.; Rauh, M.J.; Myer, G.D.; Huang, B.; Hewett, T.E. Biomechanical Measures during Landing and Postural Stability Predict Second Anterior Cruciate Ligament Injury after Anterior Cruciate Ligament Reconstruction and Return to Sport. Am. J. Sports Med. 2010, 38, 1968–1978. [Google Scholar] [CrossRef] [PubMed]
  12. Larwa, J.; Stoy, C.; Chafetz, R.S.; Boniello, M.; Franklin, C. Stiff landings, core stability, and dynamic knee valgus: A systematic review on documented anterior cruciate ligament ruptures in male and female athletes. Int. J. Environ. Res. Public Health 2021, 18, 3826. [Google Scholar] [CrossRef]
  13. Guo, L.; Zhang, J.; Wu, Y.; Li, L. Prediction of the Risk Factors of Knee Injury During Drop-Jump Landing with Core-related Measurements in Amature Basketball Players. Front. Bioeng. Biotechnol. 2021, 9, 738311. [Google Scholar] [CrossRef] [PubMed]
  14. Ross, S.E.; Guskiewicz, K.M. Effect of coordination training with and without stochastic resonance stimulation on dynamic postural stability of subjects with functional ankle instability and subjects with stable ankles. Clin. J. Sport Med. 2006, 16, 323–328. [Google Scholar] [CrossRef] [PubMed]
  15. Ross, S.E.; Guskiewicz, K.M.; Gross, M.T.; Yu, B. Balance measures for discriminating between functionally unstable and stable ankles. Med. Sci. Sports Exerc. 2009, 41, 399–407. [Google Scholar] [CrossRef]
  16. Bernier, J.N.; Perrin, D.H. Effect of coordination training on proprioception of the functionally unstable ankle. J. Orthop. Sports Phys. Ther. 1998, 27, 264–275. [Google Scholar] [CrossRef] [Green Version]
  17. Webster, K.A.; Gribble, P.A. Time to stabilization of anterior cruciate ligament-reconstructed versus healthy knees in nationalcollegiate athletic association division I female athletes. J. Athl. Train. 2010, 45, 580–585. [Google Scholar] [CrossRef] [Green Version]
  18. Colby, S.M.; Hintermeister, R.A.; Torry, M.R.; Steadman, J.R. Lower limb stability with ACL impairment. J. Orthop. Sports Phys. Ther. 1999, 29, 444–454. [Google Scholar] [CrossRef]
  19. Fransz, D.P.; Huurnink, A.; De Boode, V.A.; Kingma, I.; Van Dieën, J.H. Time to stabilization in single leg drop jump landings: An examination of calculation methods and assessment of differences in sample rate, filter settings and trial length on outcome values. Gait Posture 2015, 41, 63–69. [Google Scholar] [CrossRef] [Green Version]
  20. Cinarli, F.S.; Adanur, O.; Esen, O.; Barasinska, M.; Cepicka, L.; Gabrys, T.; Karayigit, R. Relationship between Unilateral Leg Extension Strength and Dynamic Balance in Healthy Young Men. Appl. Sci. 2022, 12, 8985. [Google Scholar] [CrossRef]
  21. Soylu, Ç.; Altundağ, E.; Akarçeşme, C.; Yildirim, N.Ü. The relationship between isokinetic knee flexion and extension muscle strength, jump performance, dynamic balance and injury risk in female volleyball players. J. Hum. Sport Exerc. 2020, 15, 502–514. [Google Scholar] [CrossRef]
  22. Mothersole, G.A.; Cronin, J.B.; Harris, N.K. Key prerequisite factors influencing landing forces in netball. Strength Cond. J. 2013, 35, 47–54. [Google Scholar] [CrossRef]
  23. Faul, F.; Erdfelder, E.; Lang, A.-G.; Buchner, A. G*Power 3, A flexible statistical power analysis program for the social, behavioral, and biomedical sciences. Behav. Res. Methods 2007, 39, 175–191. [Google Scholar] [CrossRef]
  24. Ebben, W.; van der Zanden, T.; Wurm, B.J.; Petushek, E.J. Evaluating plyometric exercises using time to stabilization. J. Strength Cond. Res. 2010, 24, 300–306. [Google Scholar] [CrossRef]
  25. Foster, C.; Hector, L.L.; Welsh, R.; Schrager, M.; Green, M.A.; Snyder, A.C. Effects of specific versus cross-training on running performance. Eur. J. Appl. Physiol. Occup. Physiol. 1995, 70, 367–372. [Google Scholar] [CrossRef]
  26. Lategan, L. Differences in knee flexion and extension angles of peak torque between men and women. Isokinet. Exerc. Sci. 2012, 20, 71–76. [Google Scholar] [CrossRef]
  27. Duvigneaud, N.; Bernard, E.; Stevens, V.; Witvrouw, E.; Van Tiggelen, D. Isokinetic assessment of patellofemoral pain syndrome: A prospective study in female recruits. Isokinet. Exerc. Sci. 2008, 16, 213–219. [Google Scholar] [CrossRef]
  28. Dufek, J.S.; Bates, B.T. The evaluation and prediction of impact forces during landings. Med. Sci. Sports Exerc. 1990, 22, 370–377. [Google Scholar] [CrossRef]
  29. Azevedo, A.M.; Oliveira, R.; Vaz, J.R.; Cortes, N. Professional Dancers Distinct Biomechanical Pattern during Multidirectional Landings. Med. Sci. Sports Exerc. 2019, 51, 539–547. [Google Scholar] [CrossRef]
  30. Kadri, M.A.; Noé, F.; Maitre, J.; Maffulli, N.; Paillard, T. Effects of Limb Dominance on Postural Balance in Sportsmen Practicing Symmetric and Asymmetric Sports: A Pilot Study. Symmetry 2021, 13, 2199. [Google Scholar] [CrossRef]
  31. Grozier, C.D.; Cagle, G.K.; Pantone, L.; Rank, K.B.; Wilson, S.J.; Harry, J.R.; Seals, S.; Simpson, J.D. Effects of medial longitudinal arch flexibility on propulsion kinetics during drop vertical jumps. J. Biomech. 2021, 118, 110322. [Google Scholar] [CrossRef]
  32. Harry, J.R.; Krzyszkowski, J.; Chowning, L.D.; Kipp, K. Phase-specific force and time predictors of standing long jump distance. J. Appl. Biomech. 2021, 37, 400–407. [Google Scholar] [CrossRef]
  33. Ross, S.E.; Guskiewicz, K.M.; Yu, B. Single-leg jump-landing stabilization times in subjects with functionally unstable ankles. J. Athl. Train. 2005, 40, 298–304. [Google Scholar]
  34. Prion, S.; Haerling, K.A. Making Sense of Methods and Measurement: Spearman-Rho Ranked-Order Correlation Coefficient. Clin. Simul. Nurs. 2014, 10, 535–536. [Google Scholar] [CrossRef]
  35. Schober, P.; Schwarte, L.A. Correlation coefficients: Appropriate use and interpretation. Anesth. Analg. 2018, 126, 1763–1768. [Google Scholar] [CrossRef]
  36. Pataky, T.C. One-dimensional statistical parametric mapping in Python. Comput. Methods Biomech. Biomed. Eng. 2012, 15, 295–301. [Google Scholar] [CrossRef]
  37. Pataky, T.C. Generalized n-dimensional biomechanical field analysis using statistical parametric mapping. J. Biomech. 2010, 43, 1976–1982. [Google Scholar] [CrossRef]
  38. Brooks, E.R.; Benson, A.C.; Fox, A.S.; Bruce, L.M. Physical movement demands of elite-level netball match-play as measured by an indoor positioning system. J. Sports Sci. 2020, 38, 1488–1495. [Google Scholar] [CrossRef]
  39. Ali, N.; Robertson, D.G.E.; Rouhi, G. Sagittal plane body kinematics and kinetics during single-leg landing from increasing vertical heights and horizontal distances: Implications for risk of non-contact ACL injury. Knee 2014, 21, 38–46. [Google Scholar] [CrossRef]
  40. Wang, L.I.; Peng, H.T. Biomechanical comparisons of single- and double-legged drop jumps with changes in drop height. Int. J. Sports Med. 2014, 35, 522–527. [Google Scholar] [CrossRef]
  41. Xaverova, Z.; Dirnberger, J.; Lehnert, M.; Belka, J.; Wagner, H.; Orechovska, K. Isokinetic Strength Profile of Elite Female Handball Players. J. Hum. Kinet. 2015, 49, 257–266. [Google Scholar] [CrossRef] [PubMed] [Green Version]
  42. Duvenage, K.-K.; Willemse, Y.; De Ridder, J.H. Bilateral Differences in Anthropometric Measurements and Isokinetic Strength Variables of Female University Netball Players. JPFMTS 2021, 9, 555752. [Google Scholar] [CrossRef]
  43. Vargas, V.Z.; Motta, C.; Peres, B.; Vancini, R.L.; Andre Barbosa De Lira, C.; Andrade, M.S. Knee isokinetic muscle strength and balance ratio in female soccer players of different age groups: A cross-sectional study. Physician Sportsmed. 2020, 48, 105–109. [Google Scholar] [CrossRef] [PubMed]
  44. Louw, Q.; Grimmer, K. Biomechanical factors associated with the risk of knee injury when landing from a jump. S. Afr. J. Sports Med. 2006, 18, 18–23. [Google Scholar] [CrossRef] [Green Version]
  45. Brown, C.; Ross, S.; Mynark, R.; Guskiewicz, K. Assessing Functional Ankle Instability with Joint Position Sense, Time to Stabilization, and Electromyography. J. Sport Rehabil. 2004, 13, 122–134. [Google Scholar] [CrossRef]
  46. Saad, T.; Davies, L.; Smith, M. Implementation of an injury prevention programme in community netball: An observational study. J. Sports Sci. 2021, 39, 2180–2188. [Google Scholar] [CrossRef]
  47. Gamble, P. Physical Preparation for Netball-Part 2, Approaching Programme Design; UK Strength & Conditioning Association: Lytham St. Anne’s, UK, 2011; pp. 13–21. [Google Scholar]
  48. Whitehead, S.; Weakley, J.; Cormack, S.; Alfano, H.; Kerss, J.; Mooney, M.; Jones, B. The Applied Sports Science and Medicine of Netball: A Systematic Scoping Review. Sports Med. 2021, 51, 1715–1731. [Google Scholar] [CrossRef]
  49. Kotsifaki, A.; Whiteley, R.; Van Rossom, S.; Korakakis, V.; Bahr, R.; Sideris, V.; Graham-Smith, P.; Jonkers, I. Single leg hop for distance symmetry masks lower limb biomechanics: Time to discuss hop distance as decision criterion for return to sport after ACL reconstruction? Br. J. Sports Med. 2021, 56, 249–256. [Google Scholar] [CrossRef]
  50. Kotsifaki, A.; Korakakis, V.; Graham-Smith, P.; Sideris, V.; Whiteley, R. Vertical and Horizontal Hop Performance: Contributions of the Hip, Knee, and Ankle. Sports Health 2021, 13, 128–135. [Google Scholar] [CrossRef]
  51. Fitzgerald, G.K.; Lephart, S.M.; Hwang, J.H.; Wainner, M.R.S. Hop Tests as Predictors of Dynamic Knee Stability. J. Orthop. Sports Phys. Ther. 2001, 31, 588–597. [Google Scholar] [CrossRef] [Green Version]
  52. Petschnig, R.; Baron, R.; Albrecht, M. The Relationship Between Isokinetic Quadriceps Strength Test and Hop Tests for Distance and One-Legged Vertical Jump Test Following Anterior Cruciate Ligament Reconstruction. J. Orthop. Sports Phys. Ther. 1998, 28, 23–31. [Google Scholar] [CrossRef] [PubMed]
Figure 1. Multidirectional landing setup for the dominant leg (i.e., right leg (RL)). The grey box represents the force plate. RLLI, right leg lateral inside; RLDI, right leg diagonal inside; RLSJ, right leg straight jump; RLDO, right leg diagonal outside; RLLO, right leg lateral outside. All directions were repeated on the non-dominant leg.
Applsci 13 01261 g001
Figure 2. Summary data for peak landing force (panel (A)), TTS (panel (B)) and isokinetic peak torques (panel (C)). DI = diagonal inside; DO = diagonal outside; LI = lateral inside; LO = lateral outside; SJ = straight jump; Con = concentric; Ecc = eccentric; Ext = extension; Flex = flexion.
Applsci 13 01261 g002
Figure 3. Spearman rank correlation for multidirectional TTS and normalised isokinetic peak torque values. Correlation coefficients are shown in the top-right corner; correlation ellipses and significance are shown in the bottom-left corner. Positive correlations are red-shifted, and negative correlations are blue-shifted on the colour spectrum. Ext = extensor; flex = flexor; CON = concentric; ECC = eccentric; DI = diagonal inside; DO = diagonal outside; LI = lateral inside; LO = lateral outside; SJ = straight jump.
Applsci 13 01261 g003
Figure 4. Representative landing force–time trace with SPM regression result for the relationship between landing force (bottom coloured line) and concentric extensor strength. Note: The force–time trace is linked to the primary y-axis, whereas each time node (x-axis) for the force trace exhibits a Pearson correlation coefficient that is colour-coded based on magnitude and direction (see colour bar). The largest positive (red) and negative (blue) coefficients are highlighted for reference. The displacement of the CoM (top line) is linked to the secondary y-axis and is colour-coded based on the eccentric (purple) and concentric (light orange) phases of landing. The vertical black dotted line represents the transition phase from eccentric to concentric landing. The vertical pink dotted line represents the time point at which stability was reached.
Applsci 13 01261 g004
Table 1. Two-way repeated measures ANOVA for isokinetic knee torques.
Sum of SquaresdfMean SquareFpη2p
Leg2584.1012584.108.920.0100.39
Residual4055.2014289.70
Contraction2891.1012891.108.440.0120.38
Residual4796.2014342.60
Leg * Contraction48.00148.000.510.4880.04
Residual1325.101494.60
Table 2. Two-way repeated measures ANOVA for peak landing force and TTS.
Peak Landing ForceSum of SquaresdfMean SquareFpη2p
Leg0.7210.723.490.0830.20
Residual2.89140.21
Direction1.8940.473.140.0210.18
Residual8.39560.15
Leg * Direction0.3840.092.990.0260.18
Residual1.76560.03
Time to StabilisationSum of SquaresdfMean SquareFpη2p
Leg0.0010.000.000.966<0.01
Residual6.27140.45
Direction5.2641.313.330.0160.19
Residual22.08560.39
Leg * Direction1.1740.291.110.3630.07
Residual14.87560.27
Disclaimer/Publisher’s Note: The statements, opinions and data contained in all publications are solely those of the individual author(s) and contributor(s) and not of MDPI and/or the editor(s). MDPI and/or the editor(s) disclaim responsibility for any injury to people or property resulting from any ideas, methods, instructions or products referred to in the content.

