Article

A Framework for Evaluating the Load-Carrying Capacity of Bridges without Design Document Using an AI Technique

Department of Civil Engineering, Seoul National University of Science and Technology, 232 Gongneung-ro, Nowon-gu, Seoul 01811, Republic of Korea
*
Author to whom correspondence should be addressed.
Appl. Sci. 2023, 13(3), 1283; https://doi.org/10.3390/app13031283
Submission received: 4 January 2023 / Revised: 15 January 2023 / Accepted: 16 January 2023 / Published: 18 January 2023
(This article belongs to the Section Civil Engineering)

Abstract

:
As the number of old bridges increases worldwide, economic and maintenance issues are emerging due to the deterioration of these structures. In general, the conventional approach for the safety assessment of existing bridges is based on performing structural analysis and safety verifications, starting from the material properties obtained from experimental tests. In particular, for some old bridges, the design documents are not computerized or stored, so many additional field tests may be required due to the uncertainty of information. In this paper, we proposed a framework that can estimate the load-carrying capacity of old bridges for which the design documents are absent, and field tests are not used in this process. The framework relies on computational design strength and features procedures for calculating calibration factors to reflect the current conditions. With only limited information available with regard to bridges, the key to this study is its use of AI technology. First, the relationship between externally measurable geometric characteristics and the design strength was established based on 124 design documents. In this process, we compared the performance of five regression algorithms: multiple linear regression (MLR), decision tree (DT), boosting tree (BT), support vector machine (SVM), and Gaussian process regression (GPR). It was confirmed that it is possible to predict the design strength using GPR, with an error rate of 0.3%. Second, an ANN model was built to estimate the calibration factor as a condition assessment of 82 in-service bridges. The ANN was determined using optimal parameters with a mean squared error (MSE) of 0.008. Each type of AI used in the proposed framework showed a high predictive performance, implying that it can be used to evaluate the load-carrying capacity of bridges without a design document.

1. Introduction

The deterioration of bridge structures is a worldwide problem affecting many developed and developing countries. In old bridges, the loss of strength and serviceability increases gradually due to the effects of weather conditions as well as the effects of loads and vibrations. In particular, for concrete bridges, damage such as cracks, efflorescence, water leaks, peeling, and exfoliation can occur due to certain material characteristics and environmental factors.
Bridge damage can cause indirect losses due to network disruptions as well as direct financial losses due to the repair interventions that must be performed to restore the load-carrying capacity and ensure traffic safety [1]. In Japan, the aging of many concrete bridges built during a period of rapid economic growth, from the 1950s to the 1970s, is apparent [2]. Moreover, according to an ASCE report, 40% of the 614,387 bridges in the United States are over 50 years old, and 56,007, or 9.7%, of bridges in the nation are classified as ‘structurally deficient’; the nation’s backlog for required bridge rehabilitation is estimated at USD 123 billion [3]. In addition, the average lifespan of bridges continues to increase. Therefore, it is important to implement a reasonable management strategy to maintain safe performance within acceptable levels during the life cycle of a bridge [4]. For proper structural maintenance, accurate evaluations of the current conditions and structural performance capabilities of structures in service are required [5].
In general, to evaluate the structural performance of bridges, the AASHTO Manual for Bridge Evaluation (MBE) estimates the load-carrying capacity based on reliability [6]. This manual is used to calculate the maximum live load that can be applied to a structure, and, for this purpose, the structural capacity reflecting the current condition of the bridge being examined is required. In many previous studies, calculation methods were used to implement actual bridge models by integrating the on-site damage inspection results of structures. Santarsiero et al. [7] presented a methodology to evaluate the deterioration of bridges using the condition index. Domenico et al. [8] undertook visual inspections, defect detection assessments, and an in situ experimental campaign to reduce the uncertainly associated with estimations of the material properties and attain accurate estimations of the structural capacities of bridges. An FE analysis, which reflects the estimated material properties based on a field test, was updated based on an additional static load test, enabling highly reliable safety evaluations. Moreover, several authors argued that the method of updating the material properties, boundary conditions, and complex actions using field test data in the FE model, which was created for the purpose of a bridge evaluation, is highly effective in reflecting the current condition [9,10,11,12].
However, these studies relied on data specified in the design documents. In some cases, the design documentation created at the time of construction of old bridges is lacking, has been improperly stored, and/or contains inconsistencies. Due to these issues, there are not enough records available to explain the design and construction of old bridges [13,14]. Some authors discussed the evaluations of the load-carrying capacity of a bridge without a design plan. Huang [15] and Huang and Shenton [16] developed a method to evaluate the load-carrying capacity of RC bridges without as-built information. Reinforcing bars embedded in concrete were estimated using non-destructive techniques such as a Schmidt hammer, and the bridge capacity was calculated by a cross-sectional analysis using the estimated rebars. Similarly, Aguilar et al. [17] performed a static load test and used a non-destructive material evaluation technique to evaluate the load-carrying capacity of a bridge with limited design documents, by calculating the structure’s capacity based on the explored reinforcing bar. Furthermore, Bargheri et al. [13] established a correlation between the geometric and modal characteristics established in advance, based on the FE analysis, to determine the structural capacity of an RC slab bridge without a structural plan and the uncertainty associated with the interior of the bridge according to the mode frequency.
With regard to structures, several studies have demonstrated that AI technology can be a successful approach for estimating target values based on limited information. Shakya et al. [18] obtained a high prediction accuracy by detecting the amount of damage to the structural and non-structural elements of various structures using AI techniques. The present study focuses on evaluating the load-carrying capacities of bridges with limited design documentation. Generally, the results of load-carrying capacity evaluations of bridges without design documentation were verified based on field tests and truck pass tests in prior studies [8,9,10,11,12,13,14,15,16,19]. However, these procedures are costly and time-consuming, and they sometimes cause large-scale traffic closures [19]. Therefore, the purpose of this study is to propose a load-carrying capacity evaluation method that excludes all test procedures performed on-site for old bridges without design documents. In particular, among the various bridge types, this study focuses on PSC girder bridges, which have been widely used since the 1950s. Two tasks are performed to propose a framework for economical and efficient load-carrying capacity evaluations of target bridges using AI technology. The first is to estimate the structural capacity of a bridge without a design document, and the second is to calculate a factor that compensates for the gap between the structural capacity of the estimated bridge and that of the actual bridge, by reflecting the bridge condition without a field test. In Section 2, the background of the existing load-carrying capacity evaluations is introduced, and, in Section 3, the methodology proposed in this paper is explained in detail. Then, we perform each task and confirm that the proposed method can be used to evaluate the load-carrying capacity.

2. Background of Load-Carrying Capacity Evaluations

An evaluation of the load-carrying capacity of a bridge is part of the bridge evaluation process. Such assessments quantitatively evaluate the live-load resistance that the bridge can safely support and can be used as basic data for the planning and maintenance of repair and reinforcement work. In the United States AASHTO Bridge Evaluation Manual, it is recommended to update the rating factor (RF) to evaluate the load-carrying capacity, such that it reflects the condition of the bridge [6]. The RF of the bridge is defined as shown in Equation (1).
R F = C γ D C D C γ D W D W γ L L L L ( 1 + I M )
where C represents the current load-carrying capacity of the bridge member; DC and DW are the dead load effect due to the structural components or wearing surface and utilities, respectively; LL is the live load; and IM is the allowance of dynamic load. γ D C , γ D W , and γ L L represent the load factors in each load type. In order for RF to be calculated, it is very important to calculate the structural capacity (C) that reflects the current condition. C defined by Equation (2):
C = ϕ c ϕ s ϕ R n
where R n , the nominal capacity of the member, is calculated based on the design plan. ϕ c , the condition factor, reflects the decrease in the nominal resistance due to structural deterioration. ϕ s , which is the system factor, is a factor of the nominal resistance that reflects the redundancy level of the entire deck system. ϕ is the resistance factor based on the construction materials.
As mentioned above, the evaluation of the nominal capacity is performed by calibrating the condition, system, and material components. These calibrations are conducted via engineers’ judgments based on the condition rating system, which relies on a visual inspection. On the other hand, it is argued that this calculation approach often underestimates the safe load-carrying capacities of bridges [20,21]. Accordingly, in order to calculate the precise structural capacity, as shown in Figure 1, it is important to identify the degree of deterioration through a field test along with condition evaluations. Field tests include examining the material strength, reinforcement condition, bearing plate condition, chloride content, exposure level, and the corrosion of the reinforcing bars. The response comparison through a static load test clearly reflects the uncertainty of the information about the bridge. However, these field trials and proof-loading tests require large-scale traffic closures that frequently prevent their implementation, especially on highways or bridges. For this reason, for many bridges, it is difficult to evaluate the load capacity as reflected in the current state.

3. Methodology of Load-Carrying Capacity Evaluation

In this paper, we propose a framework to which AI technology can be applied to evaluate the load-carrying capacity of bridges in their current state for bridges without design documents. In the proposed framework, the structural capacity is calculated in two steps. In the first step, the design strength of the girders is predicted based on the design document of the bridge in service where the design documents are sufficient. Given that all existing bridges are designed based on a relevant design code, it is natural to have a pattern of geometric characteristics determined for the expected load and the design strength of the girders. Using these characteristics, the relationship between the geometric characteristics of the structures and the design strength is studied based on machine learning. In this process, it is important to consider the geometrical parameters that can be measured for bridges without design documents.
In the second step, the calibration factor to be applied to the previously calculated design strength of the girders is calculated to obtain the structural capacity reflecting the condition of the bridge based on the safety-diagnosis history. ANN is used to estimate the correction factor, and parameters that can reflect ϕ ,   ϕ c , and ϕ s of the existing AASHTO are adopted as input parameters of ANN. A bridge that deteriorates due to aging produces different results from the responses calculated through the design information due to differences in the material strength, condition of the bridge bearings, cracks, and damage. The deflection amount has been adopted as an index that can indicate the gap between the calculated design strength and the actual bridge strength. For a simply supported beam-type bridge, the deflection is calculated with Equation (3), and the load (P) and stiffness (EI) have a proportional relationship. In the AI learning process, the bridge length is included as an input parameter. Since the basis is that the bridge in service is designed to satisfy serviceability and structural capacity, deflection over the expected deflection can be regarded as strength degradation. The ratio of the calculated deflection amount and the actual deflection response at the expected load means that it is possible to correct the gap between the elastic modulus of the material used and the secondary moment of sections due to cracks and damage.
δ = P L 3 48 E I
Learning using an artificial neural network was utilized, so the response ratio, which is the ratio of the calculated deflection of the bridge to the actual measured deflection of the bridge, could be predicted according to the bridge specifications and condition evaluation results shown in the bridge inspection history.
C = C × 1 K

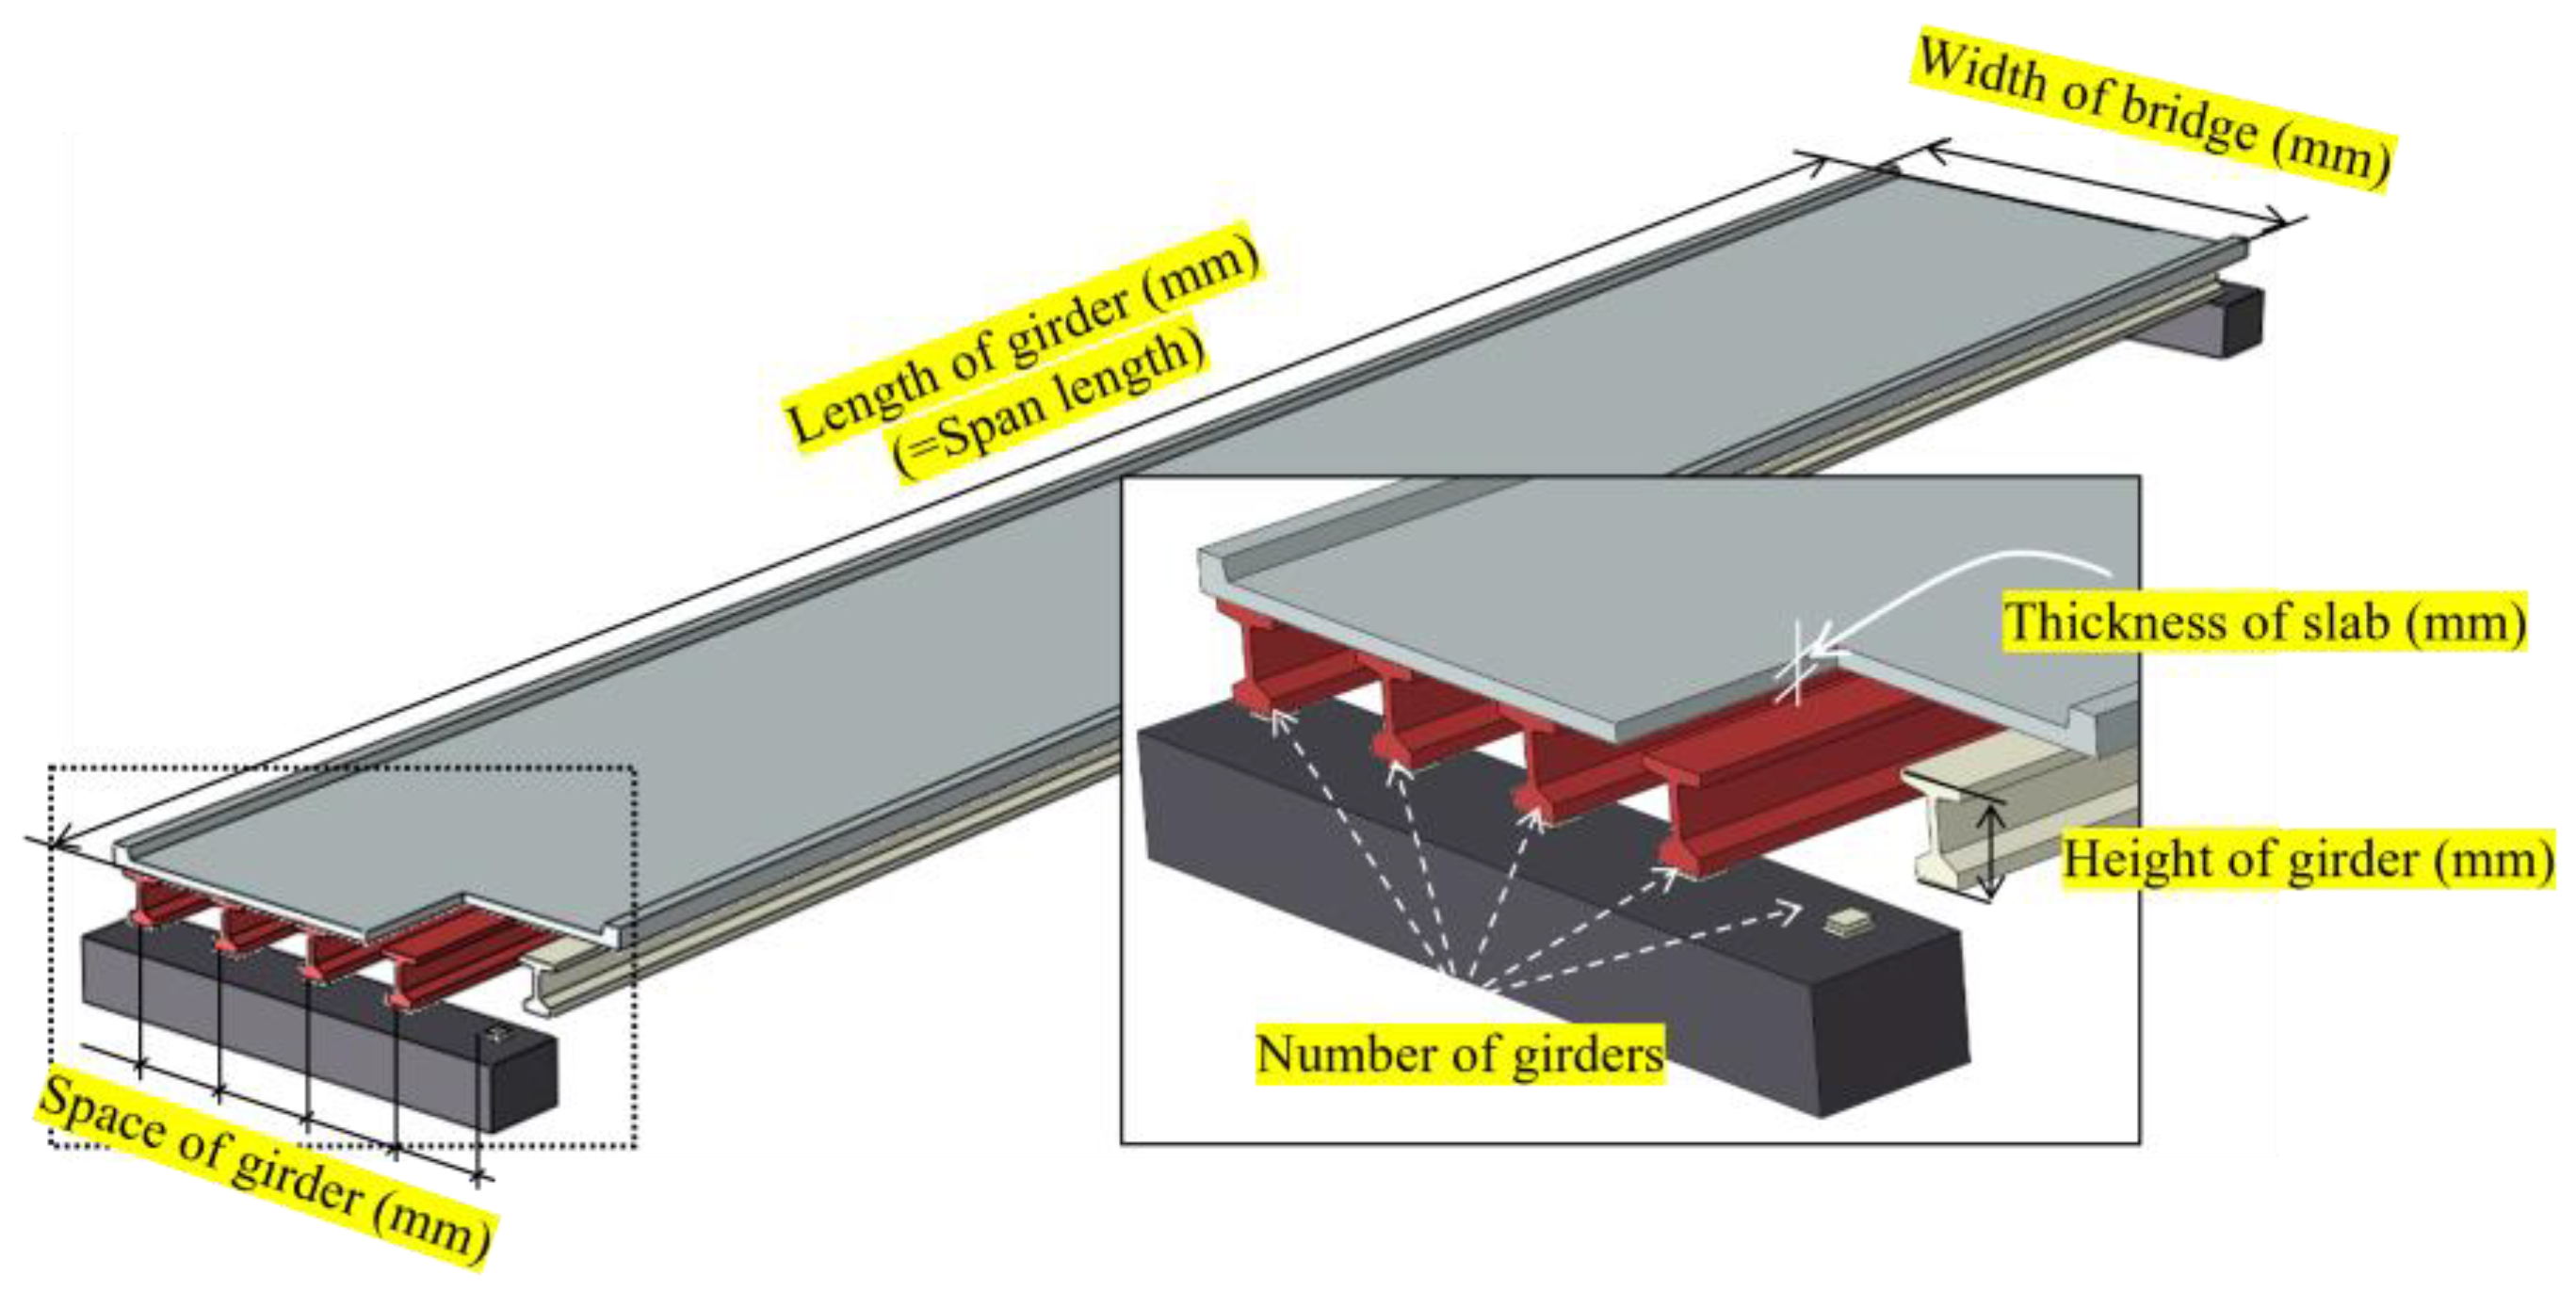
4. Prediction of Girder Design Strength for a Regression Algorithm

To estimate the design strength of the girders, the design documents of 124 PSC girder bridges were obtained. The parameters for predicting the design strength should be predictable even in the absence of design documentation. Figure 2 shows one span of the bridge. Six geometric properties that can be visually measured and that can potentially affect the design strength of the bridge were selected as the input parameters. These are the girder length, bridge width, slab thickness, number of girders, girder spacing, and the girder height. Figure 3 shows the distribution of the considered parameters. Table 1 summarizes the ranges and statistical characteristics of the individual parameters.

4.1. Introduction of Regression Algorithms

Various regression algorithms can be used to establish a relationship between the design strength of a structure and a certain geometric parameter. The present study compared the performances of models based on five popular algorithms: multiple linear regression (MLR), decision tree (DT), boosting tree (BT), support vector machine (SVM), and Gaussian process regression (GPR). A description of each algorithm is as follows.

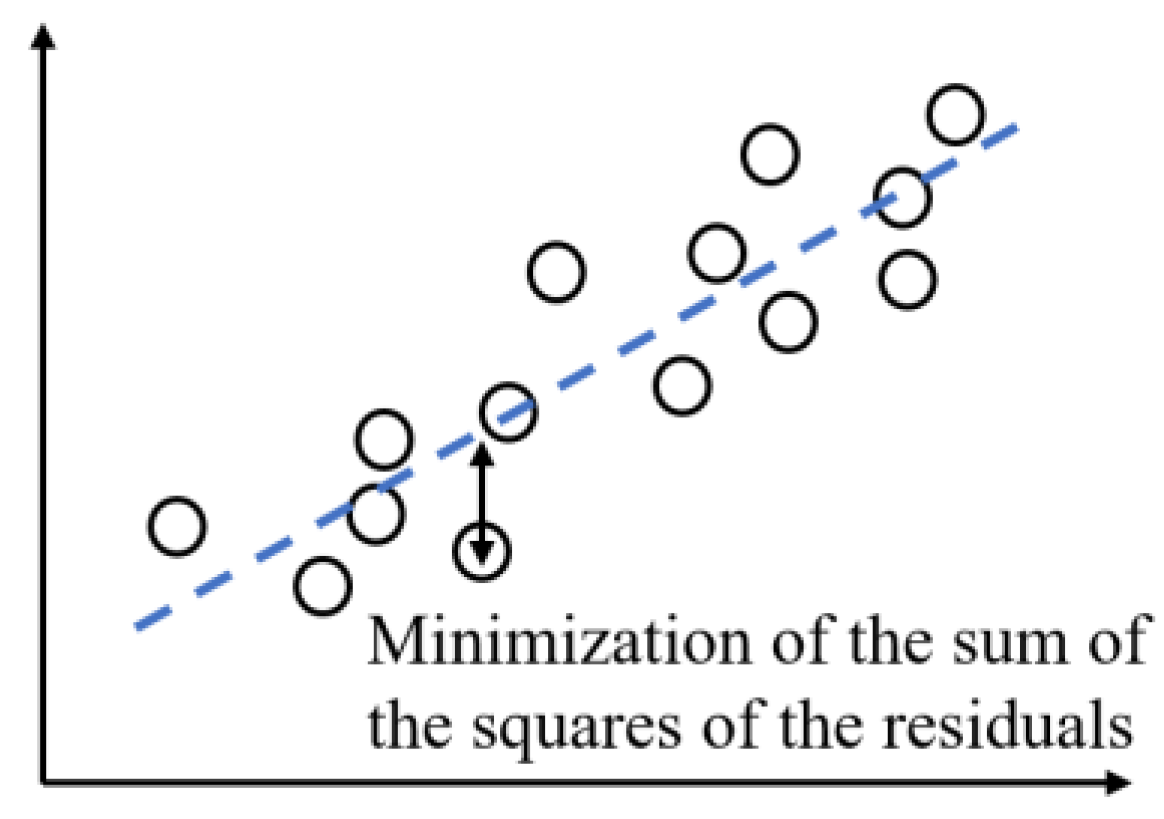
4.1.1. Multi-Linear Regression (MLR)

The relationship predicted through a multiple linear regression analysis is expressed as a functional formula with arbitrary coefficients for a given independent parameter. As shown in Figure 4, the least squares method is used to ensure that the predicted result has the proper target value and high accuracy. Several studies have used the MLR technique considering the interaction effect to improve the accuracy of the simple multiple linear regression process [22,23]. In this study, a regression method that also considers the interaction effects is used to improve the prediction accuracy of linear regression. In addition to the weight of each parameter considering the main effects of the independent parameters, a term that predicts the weights of the terms composed of the products between them was added and considered.
y = a 0 + a 1 x 1 + a 2 x 2 + a 3 x 3 + + a n x n   ( linear   regression ) + a 12 x 1 x 2 + a 13 x 1 x 3 + a i j x i x j +   ( interaction   term )

4.1.2. Decision Tree (DT)

A decision tree is a tree data structure that consists of nodes and branches at each node. The DT algorithm used for regression proceeds in a top-down fashion, finding the best branch in a greedy manner and dividing the branches. From among all independent variables X 1 ,   X 2 ,   ,   X p   and for all possible spilt points s, we choose j and s that minimize the SSE.
R a ( j ,   s ) = { X | X j < s }   a n d   R 2 ( j , s ) = { X | X j s }
S S E = i : x i R 1 ( j , s ) ( y i y ^ R 1 ) 2 + i : x i R 2 ( j , s ) ( y i y ^ R 2 ) 2
As mentioned above, each spilt point fits the regression model to the target variable according to whether the conditions for the independent variable are satisfied. Figure 5 shows a schematic diagram of the decision tree.

4.1.3. Boosting Tree (BT)

Boosting is one of the ways to improve predictions using the DT approach. Depending on the predicted results of the previous model, the importance of each of the independent variables is determined, and weights are assigned to affect the next model. This is the process used to create new classification rules by focusing on misclassified data. Compared to DT, it has the advantage of low error but has the disadvantages of a slow speed and overfitting.

4.1.4. Support Vector Machine (SVM)

The method in which the support vector machine (SVM) is applied to the regression relies on the concept of having only a certain amount of margin on the predicted linear graph based on the relationship between the target value and the predicted value. The size of the margin may be increased to include all predicted data, and the least squares method is utilized as a performance function until the minimum size of the margin is obtained. The method in which the support vector machine is applied to the regression is shown in Figure 6.

4.1.5. Gaussian Process Regression (GPR)

Determining appropriate hyper-parameters for complex datasets is a difficult task. Accordingly, conventional regression algorithms determine parameters based on the prior experience of model characteristics and shapes. However, GPR has flexibility in relation to this. It is devoted to a broad family of functions based on covariance functions. This has an advantage in that the accuracy of the estimation is very high because it can provide an uncertainty estimate along with the prediction.

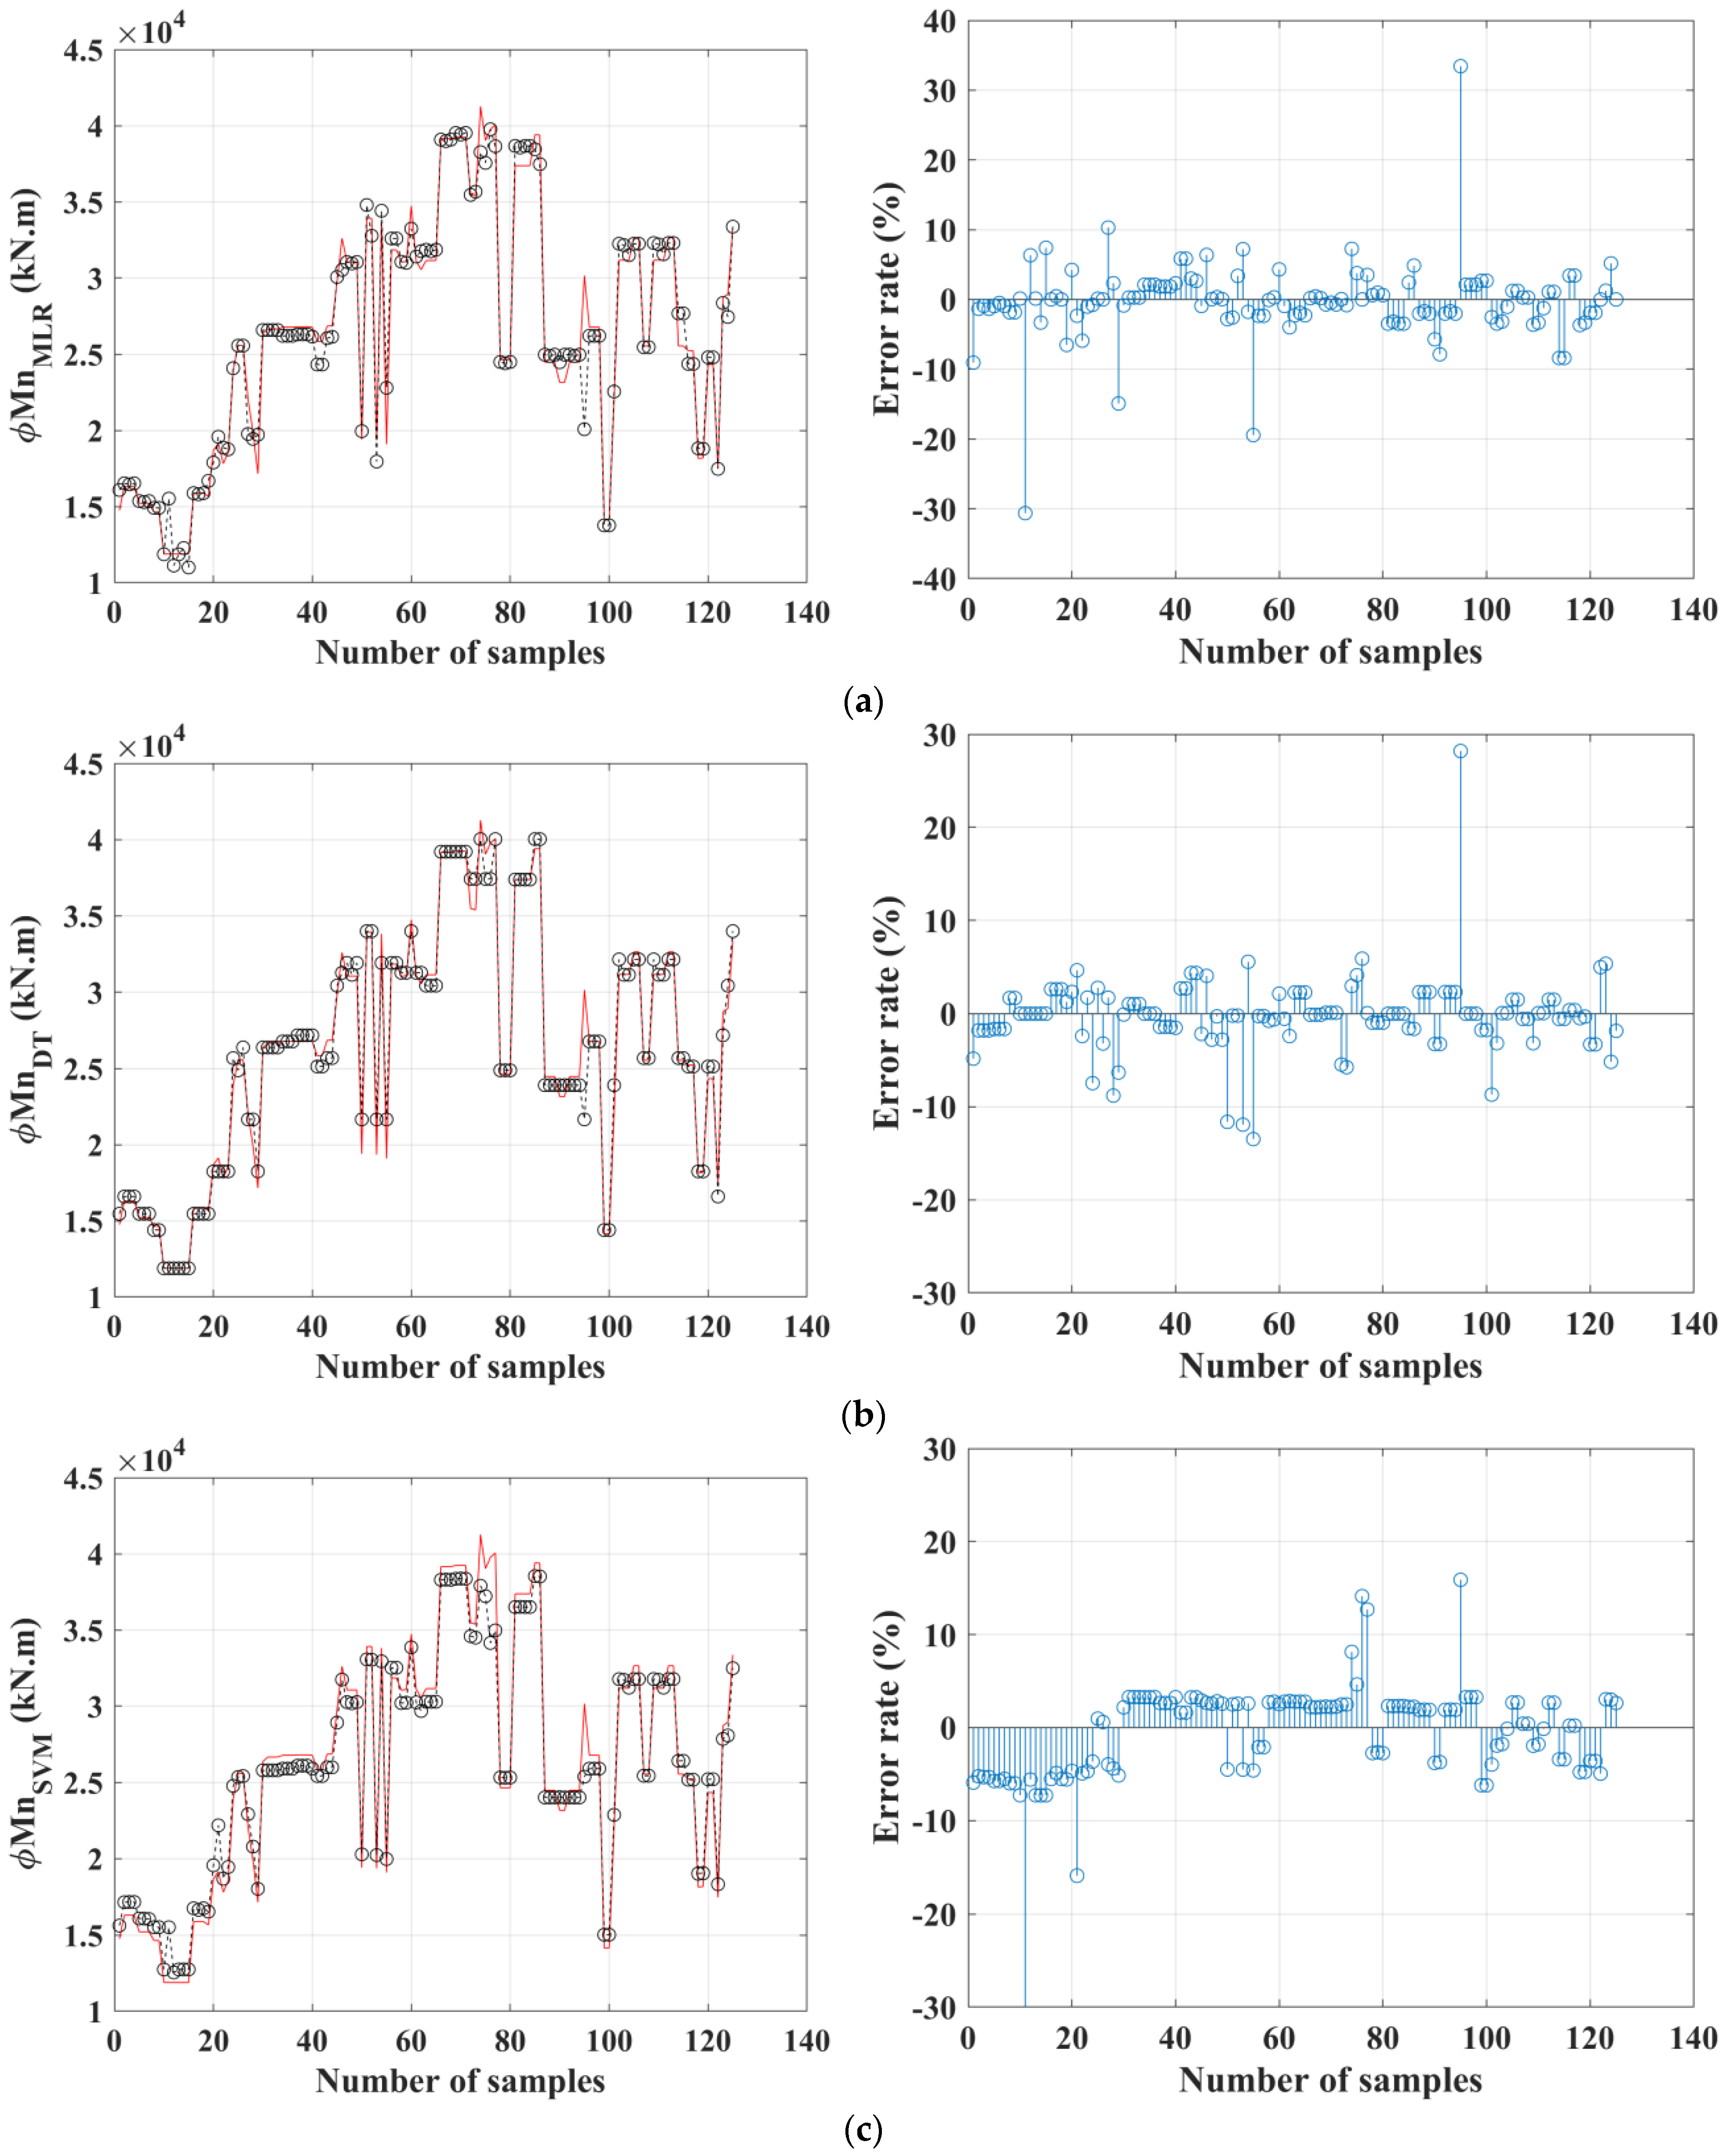
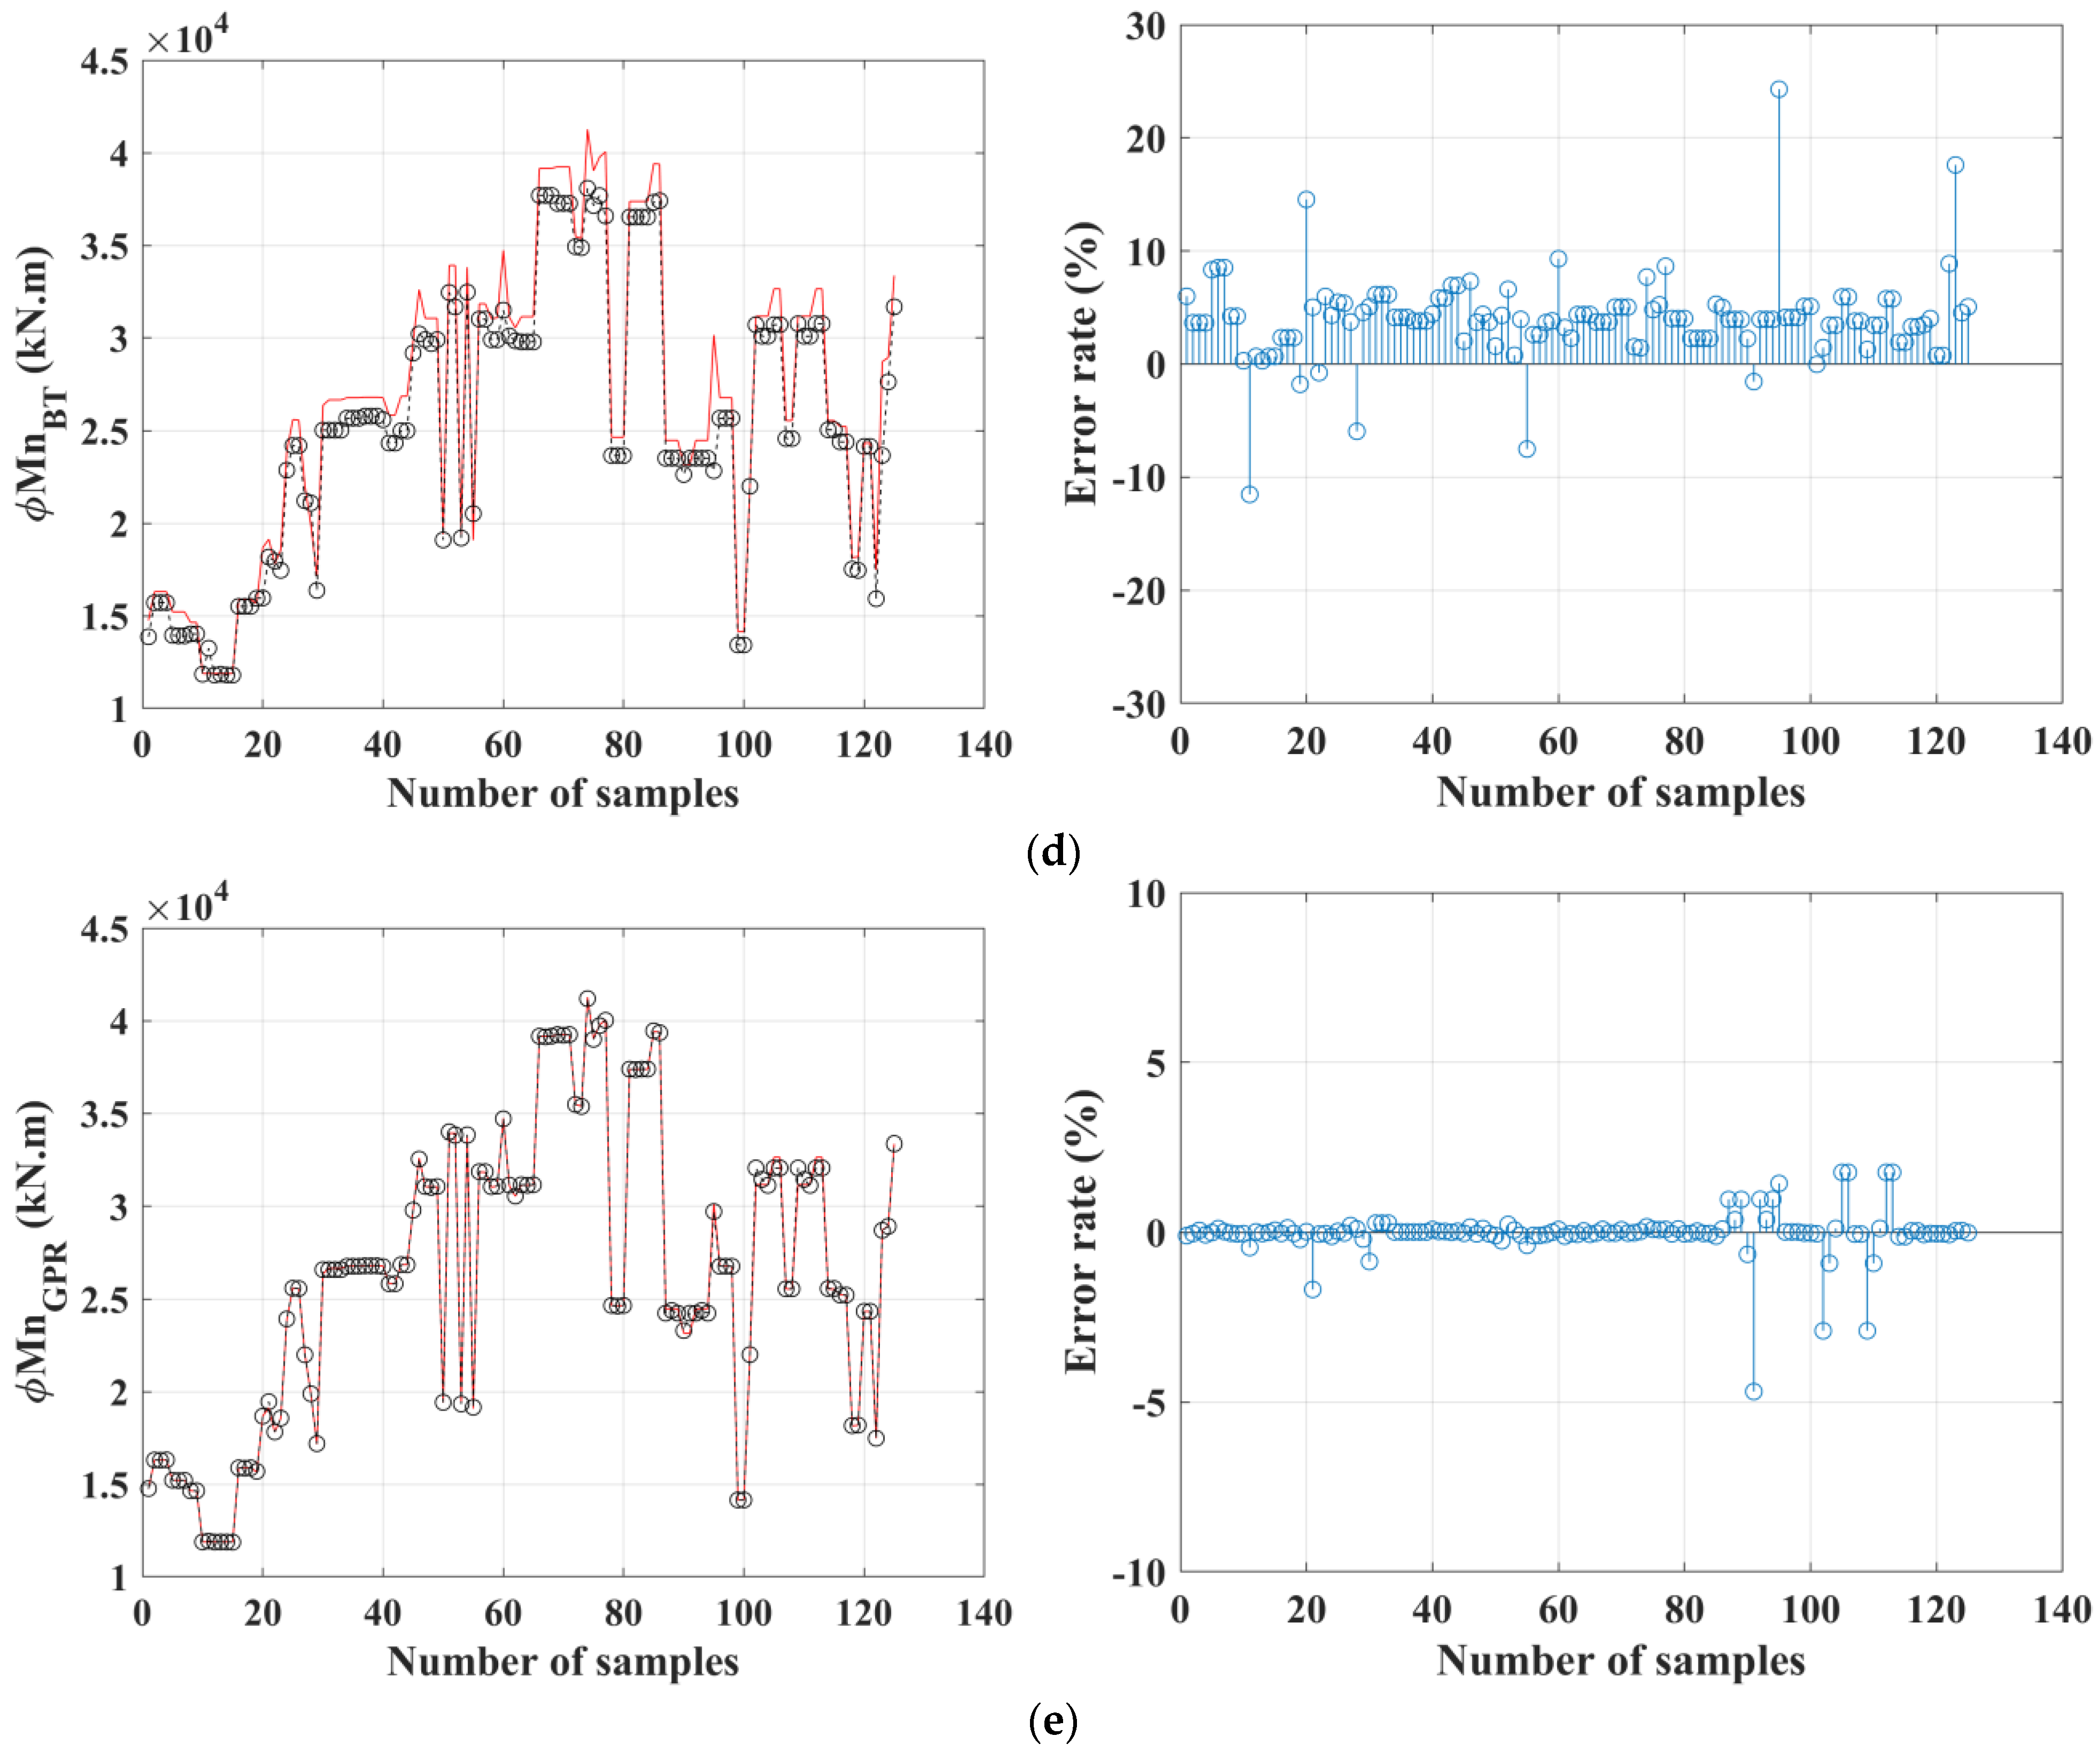
4.2. Performance of Regression Algorithms

In general, the performance of the model is evaluated through the coefficient of determination ( R 2 ). However, from a mathematical approach, the coefficient of determination increases as the number of independent parameters increases. Therefore, an adjusted coefficient of determination ( R a d j 2 ) that considers the number of independent parameters and the size of the dataset is used. R a d j 2 is calculated by Equation (8). In addition, because the parameters used for the regression are not subject to a scaling process, it is difficult to intuitively evaluate the error obtained by subtracting the predicted value from the target. Therefore, the absolute percentage error (MAPE) was used, so the predicted error could be intuitively identified.
R a d j 2 = 1 [ ( 1 R 2 ) ( n 1 ) n k 1 ]
As shown in Figure 7 and Table 2, the error rates in all algorithms used were as low as 5% or less, and R a d j 2 showed a high accuracy, of 0.9 or more. Among the algorithms used, the GPR algorithm showed the highest concordance rate with a coefficient of determination of 0.99, and the MAPE was the lowest at 0.3%. The prediction method through the GPR, which considers even potential errors based on reliability, is the most efficient, and it is implied that the prediction of the design strength with this method is the most reliable method.

5. Calibration of Structural Capacity

5.1. Introduction of Bridge-Condition Rating System

In order to predict the response ratio, which is the ratio of the calculated deflection and the measured deflection response, the safety-diagnosis history reports for multiple bridges were collected. Given that this study focuses on bridge girders, the scope of the collected condition evaluation consists of the condition evaluation items for girders and bridge bearings. As the collected safety-diagnosis reports are based on safety diagnoses performed in South Korea, the Korean condition evaluation rating system was introduced. During the evaluation of the condition of the girders, the crack width, the amount of damage to the reinforcing bars, and, for PSC girders, the presence of filling defects and the corresponding chloride content are evaluated. In addition, bearings are divided into elastic bearings and steel bearings, cracks and shear deformation are evaluated, and the cracks, peeling, and exfoliation of the concrete supporting the bearings are evaluated. The aforementioned items do not require a separate field test; instead, only visual inspections are required. Table 3 and Table 4 show the damage status according to the condition evaluation grading system for the girders and bridge bearings [24].

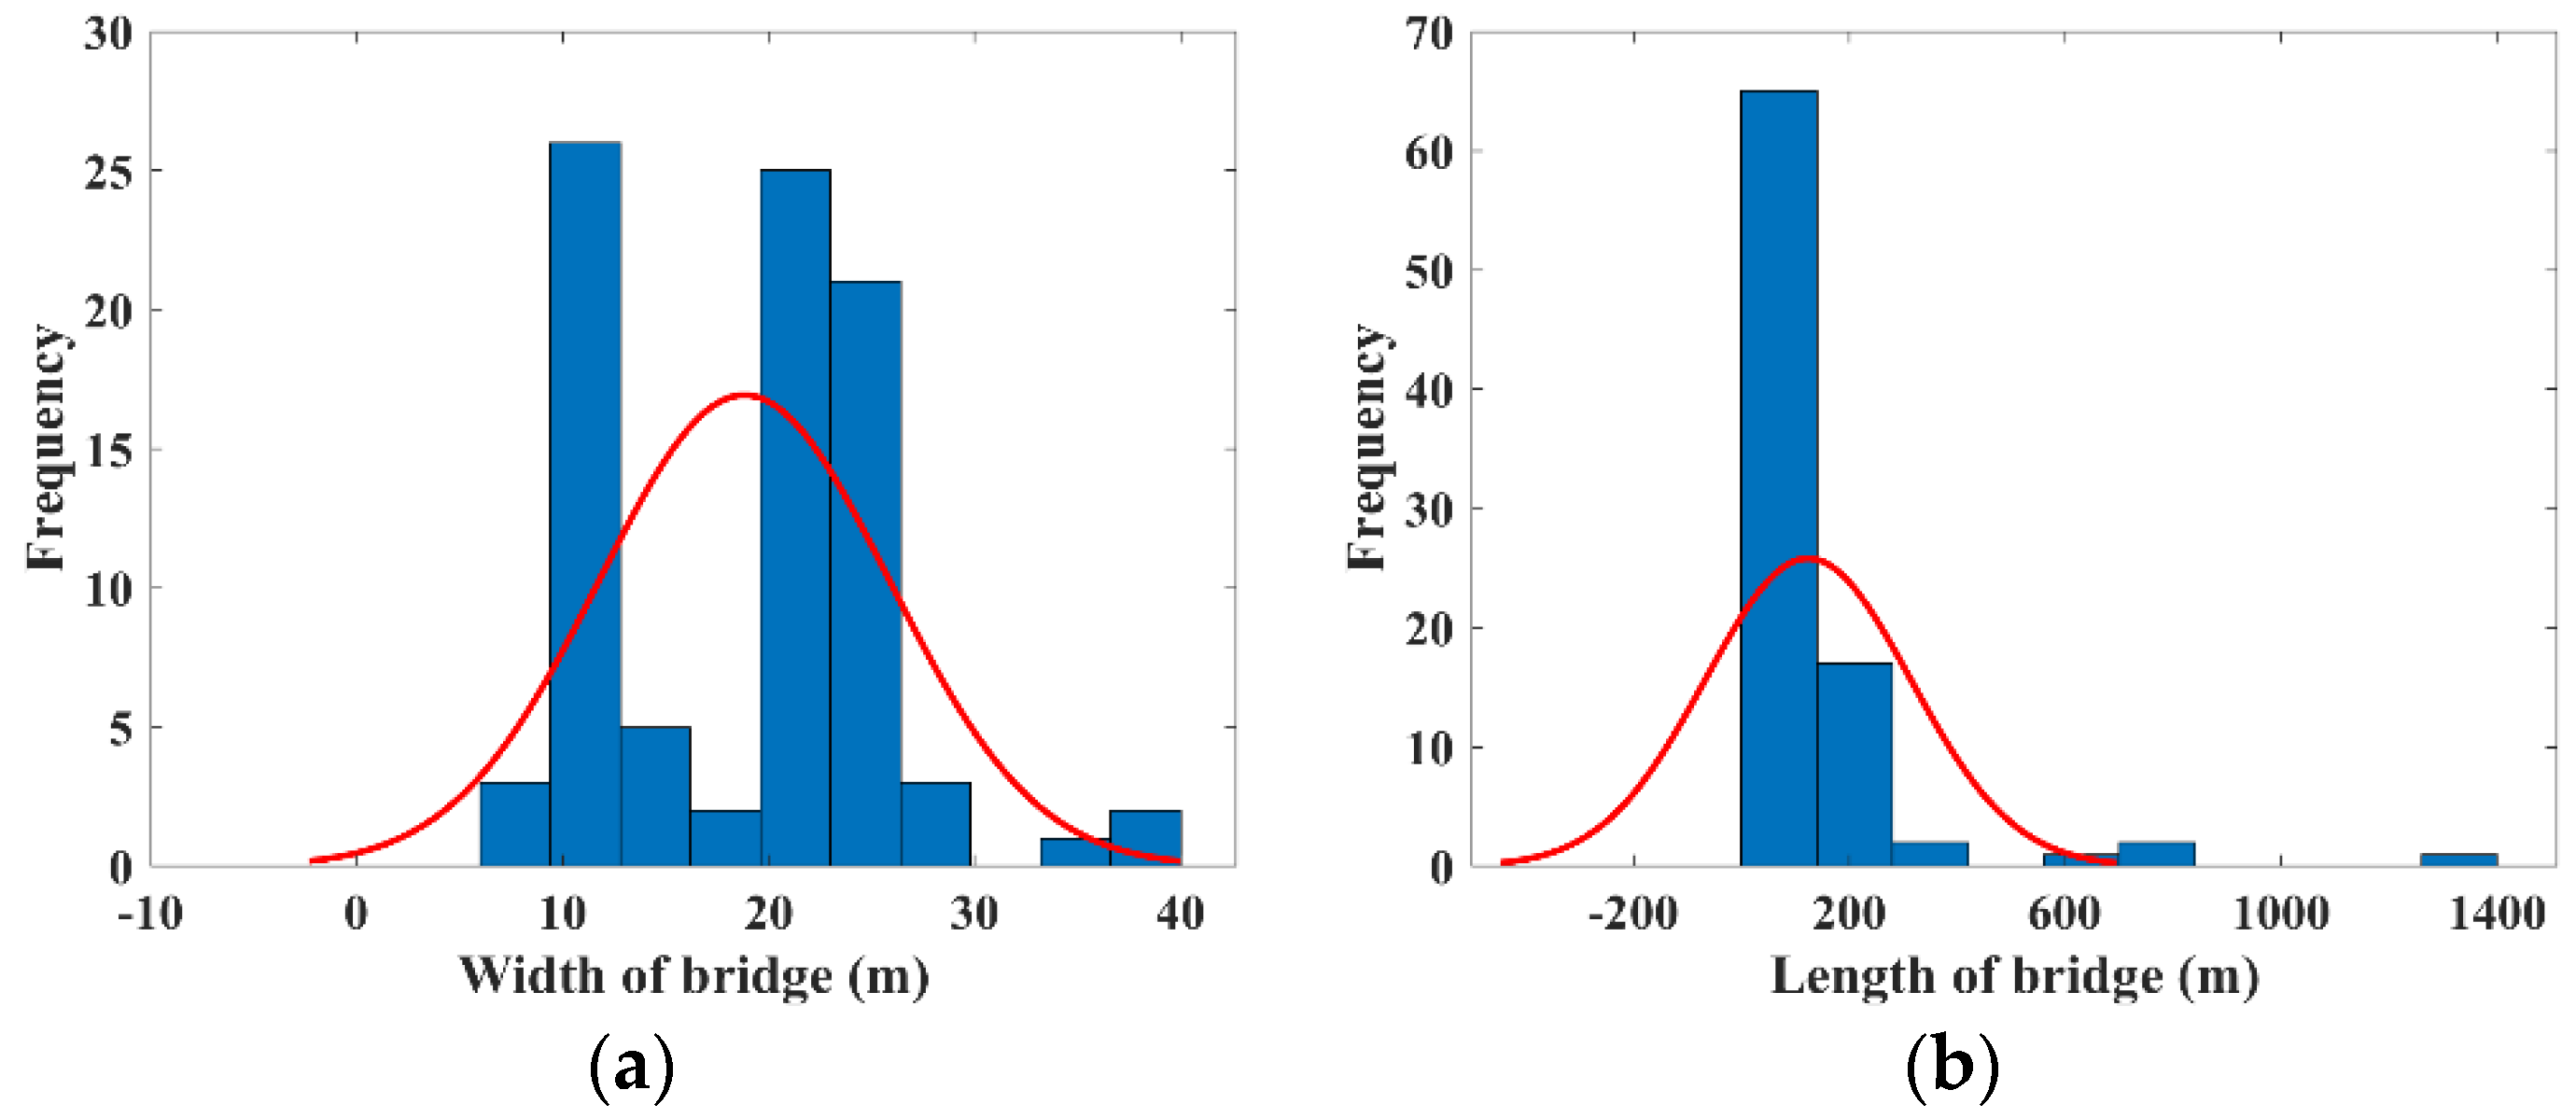
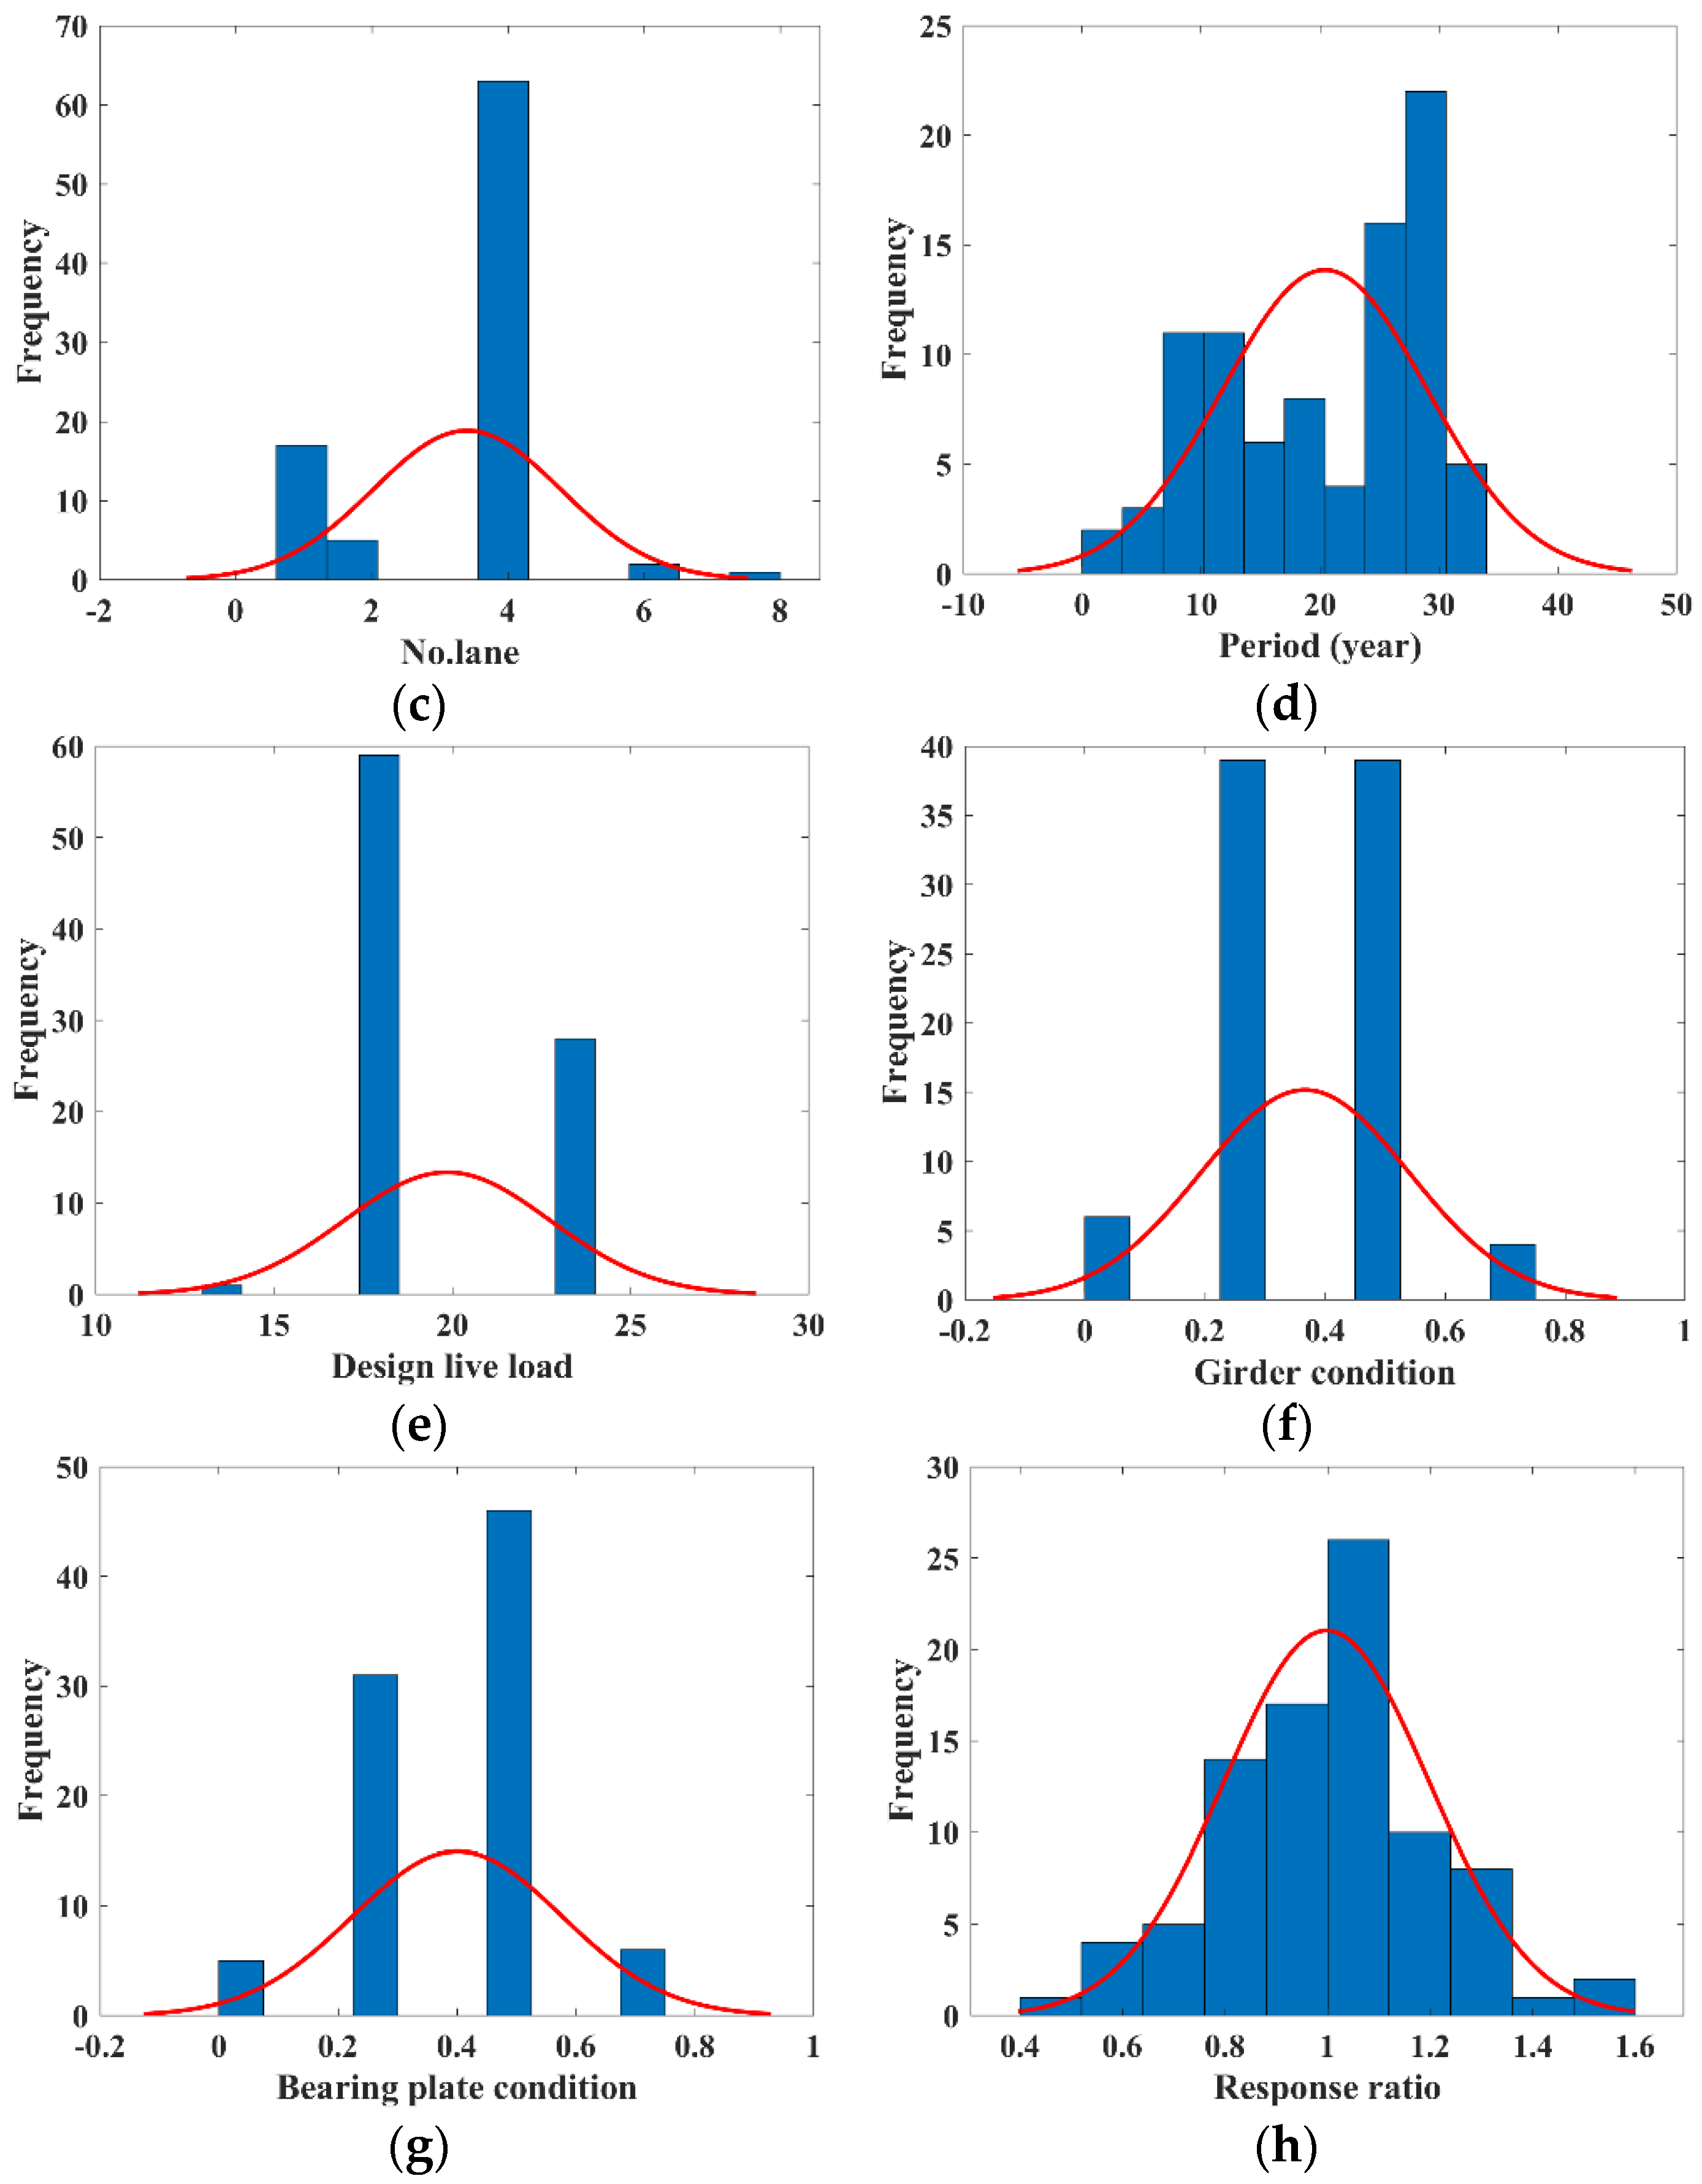
5.2. Data Collection and Driving

The basic information about the bridges and response ratios were obtained from 82 safety-diagnosis reports. In order to evaluate the condition of each bridge at a level amenable to visual inspections, the data pertaining to the specifications and loads, such as the bridge width, bridge length, number of lanes, service period, and design live load, as well as the condition of the girders and bearings that may indicate damage due to deterioration, are obtained. The specifications, load, and condition assessment results were adopted as input values. Table 5 summarizes the ranges and statistical characteristics of the individual parameters and response ratios.
The parameters representing the state are data with classes from A to E, which were normalized to numeric data between 0 and 1 to enable learning. The data distribution of the input parameters is shown in Figure 8.

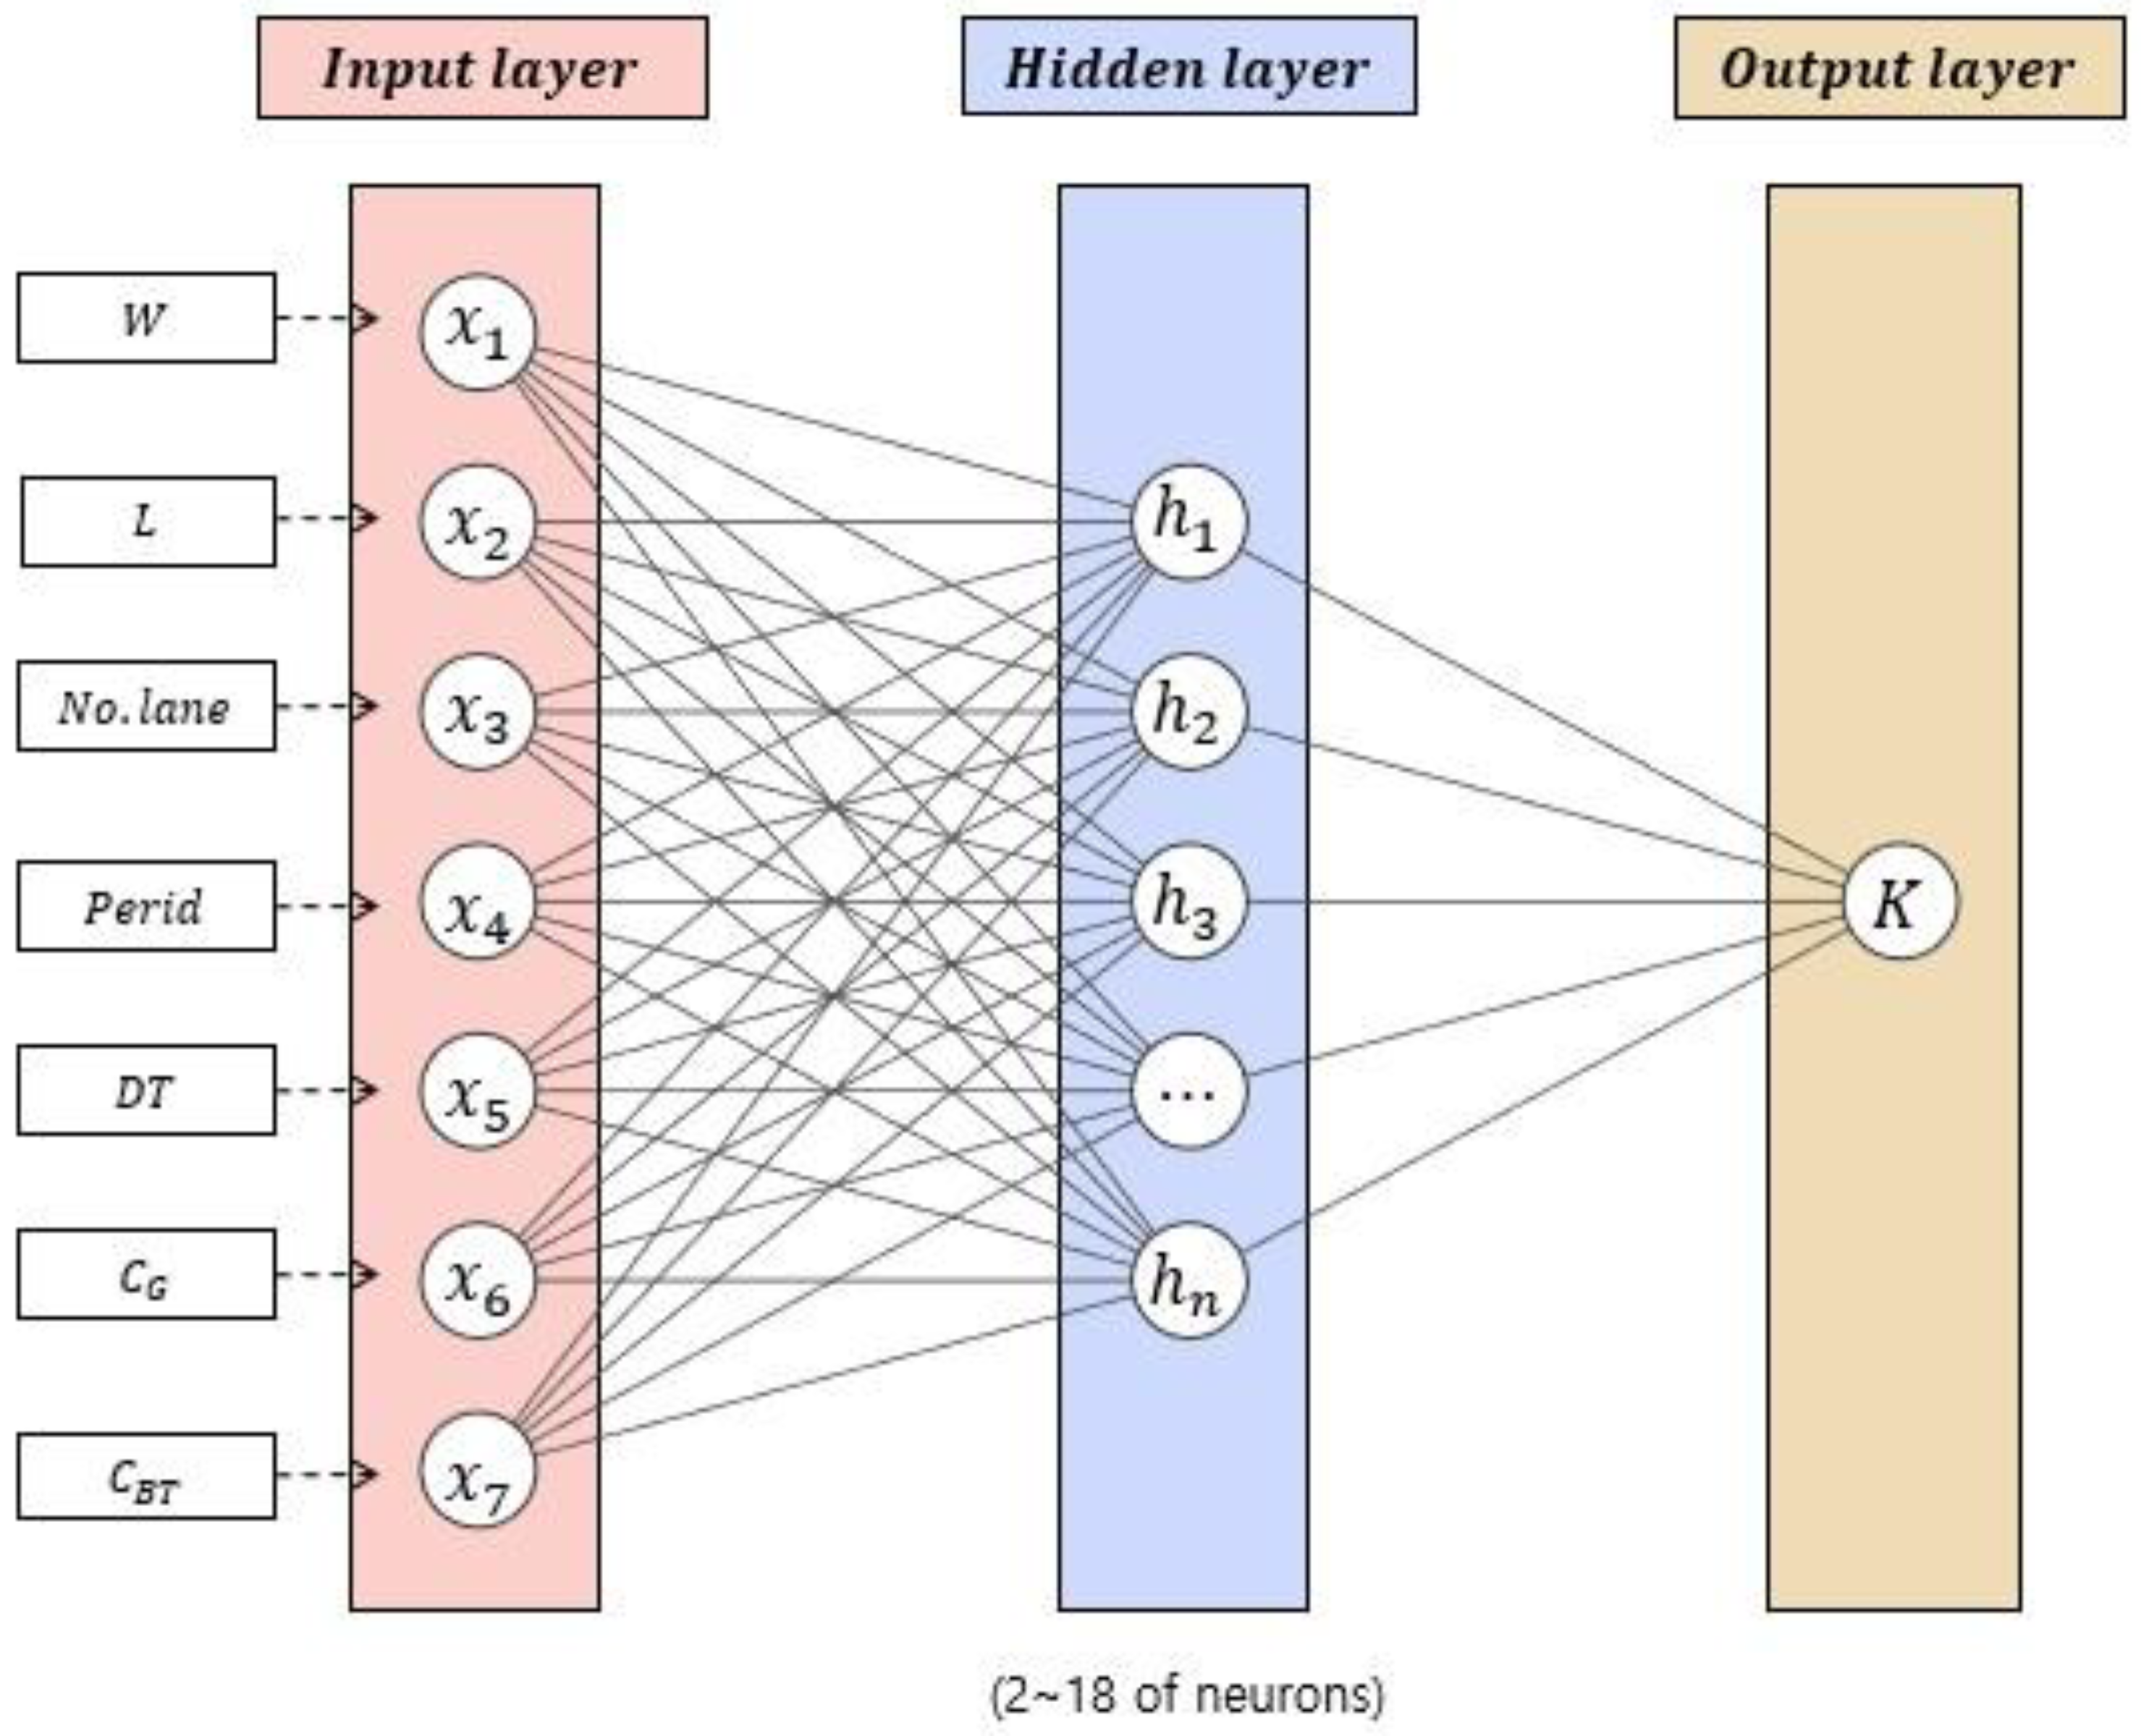
5.3. Prediction of Response Ratio Using ANN

In this section, an artificial neural network (ANN) model that can predict the response ratio based on the bridge information and condition evaluation results in the diagnosis report was developed.
An ANN is based on a feed-forward backpropagation (BPP) algorithm, so the predicted value reaches the target value. The ANN model consists of an input layer, a hidden layer, and an output layer, and each layer is connected by weights. The provided input values are propagated to the output layer through the hidden layer, and the calculated result value is displayed in the output layer. This process is called a forward propagation process, and the resulting value output through forward propagation represents the error from the provided target value to evaluate the model’s performance. At this time, the calculated error is propagated in the reverse direction, and the weights connected between each layer are adjusted. This process is called backpropagation, and the forward propagation and backpropagation processes are repeated, so the error converges to zero.
In order to model an optimal ANN, which is essential, various hyper-parameters, such as a training algorithm, an optimizer, a performance function, the number of hidden layers, and the number of nodes in the hidden layers, can be used [25]. According to numerous previous studies using ANNs, the training algorithm in the BPP learning process shows a low level of error and a level of high precision when using the Levenberg–Marquardt (LM) algorithm [26,27,28,29]. Thus, in this study, the ANN model was trained using the LM algorithm, and the gradient descent method (GDM) was adopted as an optimization function to increase the training efficiency. The default setting of the training used by the LM algorithm in MATLAB is that the data are divided as follows: training (70%), validation (15%), and testing (15%). For a better study of the insufficient data, k-fold cross-validation is performed to evaluate model errors realistically and to prevent overfitting [25]. In this study, five-fold cross-validation was used to train 82 sets of data. Additionally, the mean squared error and sum of squares error functions were used as the criteria for stopping the network training process, and an appropriate performance evaluation function was determined by a trial-and-error method.
When the BPP neural network is applied, the structure of the hidden layer largely determines the training speed and generalization ability [30]. Increasing the number of hidden layers is advantageous when desiring ANNs with a higher accuracy, but sometimes this causes overfitting problems [31]. Simulations according to the number of hidden layers have been performed by many scholars, which proved that the BPP neural network has a sufficient generalization ability with only a single hidden layer, when there are a sufficient number of neurons in the hidden layer [31,32,33]. Accordingly, the current ANN model was also developed into a structure using a single hidden layer. Then, a trial-and-error process was used, so the optimal number of neurons could be specified using the trial-and-error method. Figure 9 shows a schematic diagram of the proposed neural network.

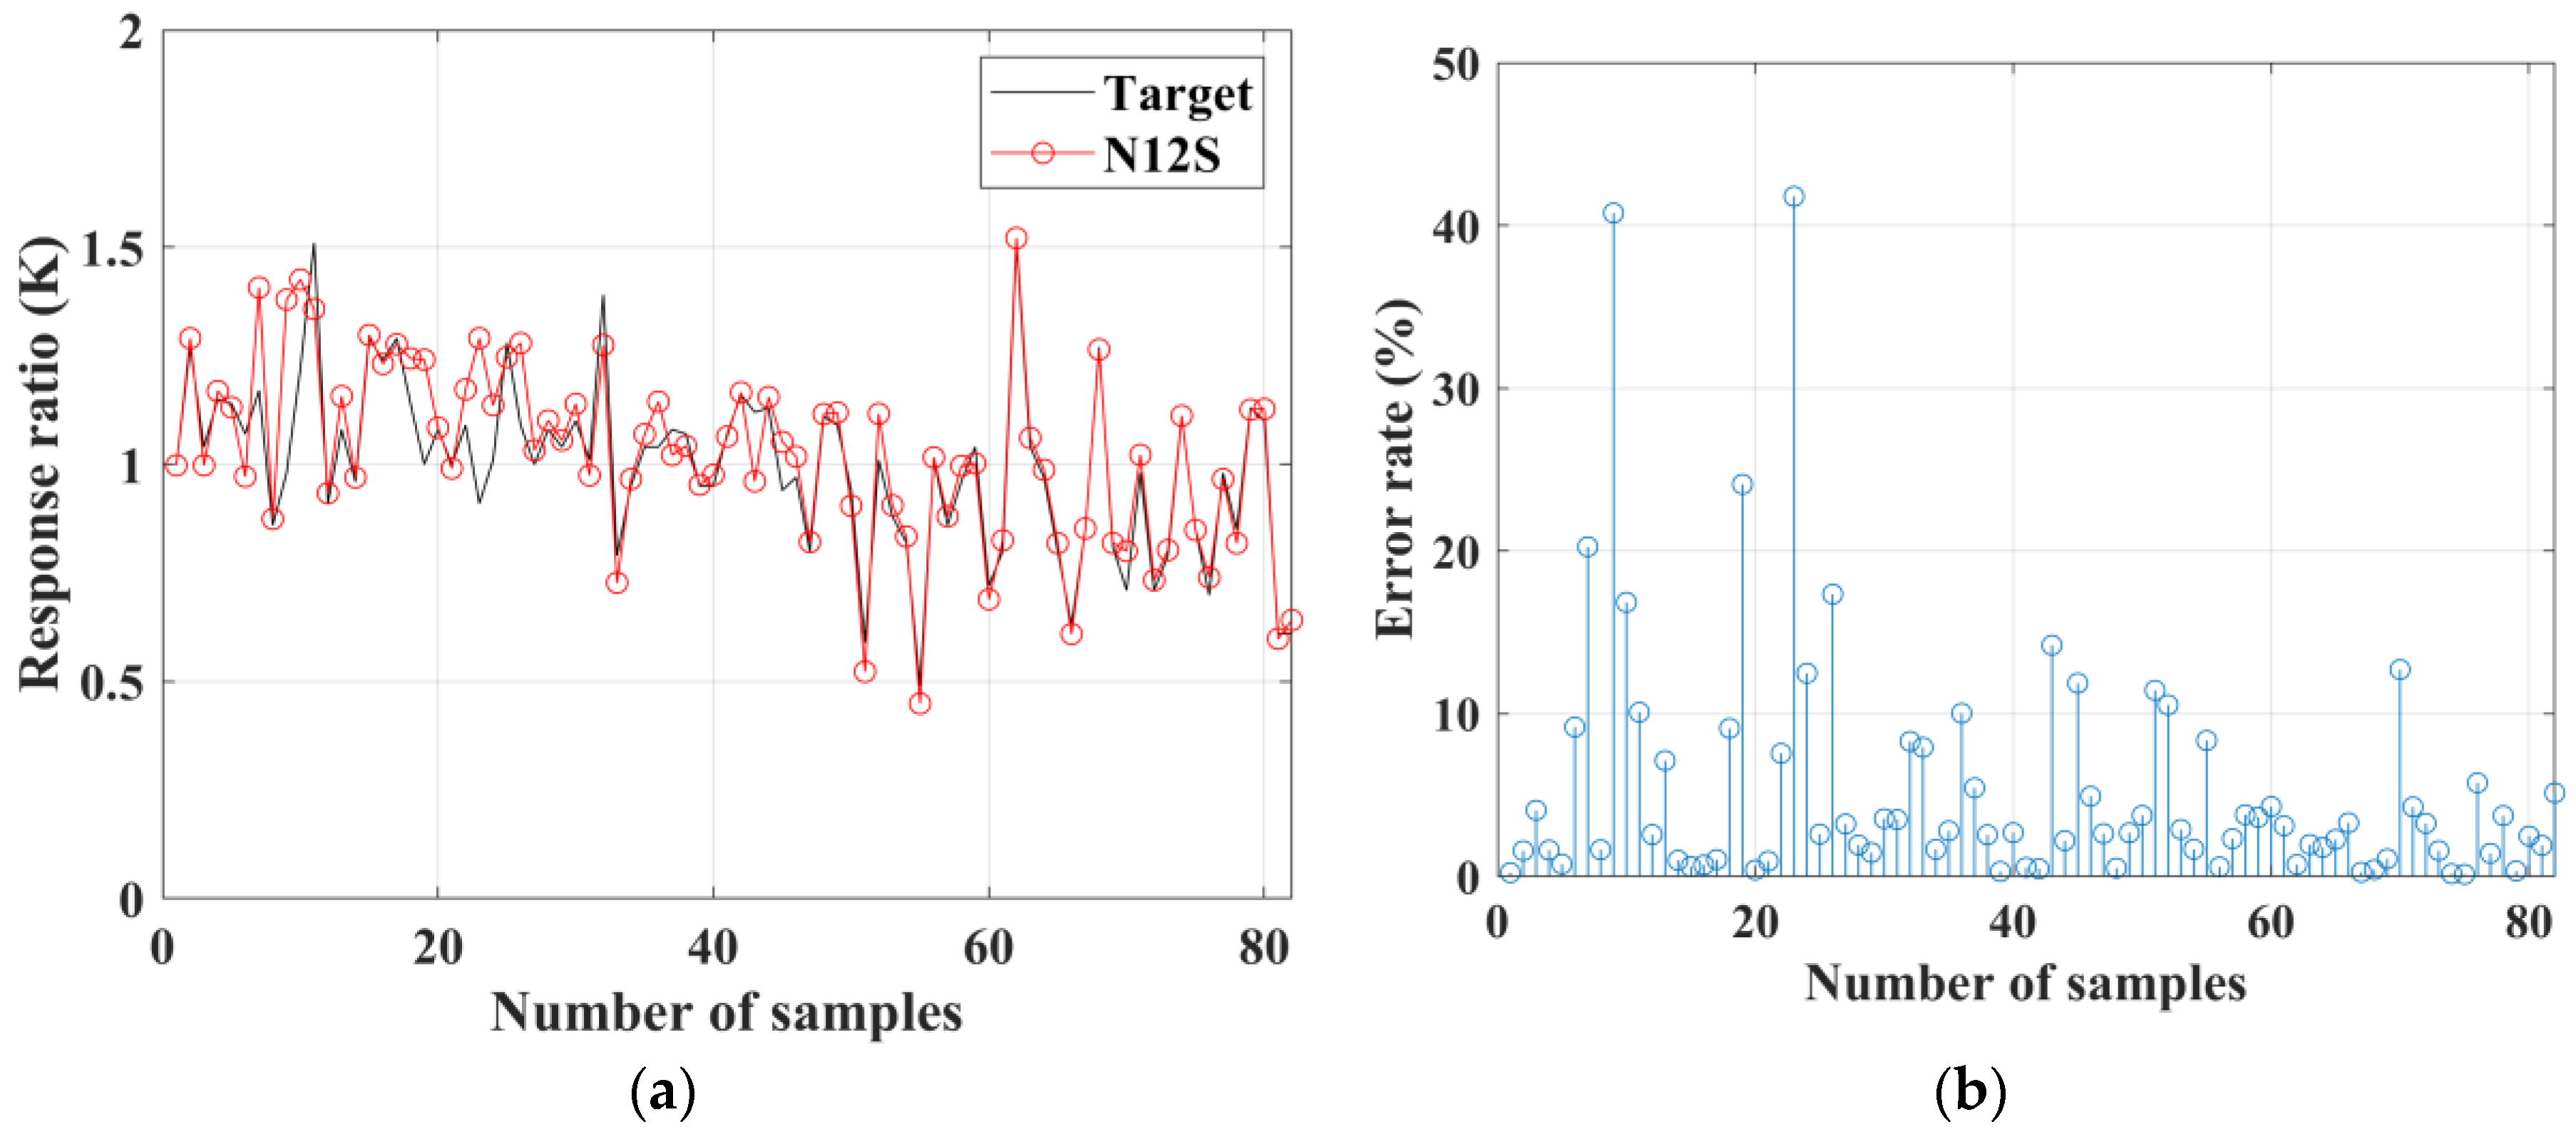
5.4. Optimization of the ANN Model and Performance Evaluation

The parameters for optimizing the neural network to predict the response ratio of the bridge are the performance function and the number of neurons in the hidden layer, consisting of two and eight parameters, respectively. The performance capabilities of 16 models, which combine the performance function and the number of neurons parameter in the hidden layer, were evaluated. The response ratio predicted by training each model is shown in Table 6, using the coefficient of determination ( R 2 ), which is an indicator that evaluates the accuracy compared to the target value, and the mean squared error (MSE), which evaluates the error with the target value.
The model of N12S showed a result that has a higher performance compared to the other model structures, as shown in Table 6. Furthermore, the response ratios of N12S were similar to the target data, and the error ratio of N12S was also the highest for the prediction performance, as shown in Figure 10. Figure 11 presents the response ratio between the prediction and target data using a scatter plot. Overall, the prediction of N12S showed linear trends compared to the point for the target data. Some data estimated outliers other than the target data. Although it is possible to develop a model with a better learning performance by adjusting some hyperparameters, as shown in Figure 12, generalization is limited due to overfitting. Therefore, the determined ANN model can be used to estimate the correction factor to calibrate the calculated design strength.

6. Summary and Conclusions

Load-carrying capacity evaluations of existing bridges are performed by calculating the structural capacity based on the design documents and updating the deterioration condition through field tests and static load tests using vehicles. However, for some old bridges, calculating the structural capacity is limited due to insufficient design planning. Additionally, field tests for bridges are time-consuming and expensive and sometimes require the closure of highways, causing a considerable amount of inconvenience.
In this study, AI technology was used in two steps to overcome these limitations. (1) Based on numerous design documents, the relationship between the design strength and the geometrical characteristics of a bridge that can be visually inspected was determined. Among the five regression algorithms used, the GPR algorithm was adopted, making it possible to predict the design strength with an error rate of less than 0.4% using externally measurable parameters such as the bridge width, girder length, number of girders, girder spacing, girder height, and slab thickness. In order to calculate the structural capacity reflecting the current state of the bridge, the response ratio (calculated deflection of the bridge/measured deflection of the actual bridge) was used as a correction factor. (2) Based on the safety-diagnosis history for 82 bridges, training using an artificial neural network was conducted to predict the response ratio according to the structural geometry information and the bridge-condition evaluation results. The response ratio, with an average error rate of about 5.4%, was predicted using the best ANN model, which was selected based on trial and error.
In the framework proposed in this study, the regression algorithm used in the first step and the ANN model used in the second step can easily predict the target value. On the other hand, this is not a framework aimed at a precision safety diagnosis. For a careful and precise evaluation of a single bridge level, which cannot be replaced by AI procedures, a sophisticated safety evaluation must be performed by conducting general field tests and finite element modeling. However, in order to perform a more reliable load-carrying capacity evaluation with the proposed framework, it may be necessary to incorporate more design documents and more diverse safety-diagnosis data into the training process.

Author Contributions

Conceptualization, S.-W.K. and J.-K.K.; methodology, S.-W.K.; software, S.-W.K.; validation, S.-W.K. and J.-K.K.; formal analysis, S.-W.K.; investigation, S.-W.K.; resources, J.-K.K.; data curation, S.-W.K.; writing—original draft preparation, S.-W.K.; writing—review and editing, J.-K.K.; visualization, S.-W.K.; supervision, J.-K.K.; project administration, S.-W.K.; funding acquisition, J.-K.K. All authors have read and agreed to the published version of the manuscript.

Funding

This study was supported by the Research Program funded by SeoulTech (Seoul National University of Science and Technology).

Institutional Review Board Statement

Not applicable.

Informed Consent Statement

Not applicable.

Data Availability Statement

Not applicable.

Conflicts of Interest

The authors declare no conflict of interest.

References

  1. Capacci, L.; Biondini, F.; Frangopol, D.M. Resilience of Aging Structures and Infrastructure Systems with Emphasis on Seismic Resilience of Bridges and Road Networks: Review. Resilient Cities Struct. 2022, 1, 23–41. [Google Scholar] [CrossRef]
  2. Chun, P.; Hayashi, S. Development of a concrete floating and delamination detection system using infrared thermography. IEEE/ASME Trans. Mechatron. 2021, 26, 2835–2844. [Google Scholar] [CrossRef]
  3. ASCE. A Comprehensive Assessment of America’s Infrastructures; ASCE: Reston, VA, USA, 2021. [Google Scholar]
  4. Frangopol, D.M.; Dong, Y.; Sabatino, S. Bridge life-cycle performance and cost: Analysis, prediction, optimization, and decision-making. Struct. Infrastruct. Eng. 2017, 13, 1239–1257. [Google Scholar] [CrossRef]
  5. Lee, J.H.; Cho, J.Y. Analysis of safety evaluation guidelines for practical maintenance of existing concrete structures. LHI J. 2020, 11, 83–92. [Google Scholar]
  6. AASHTO. Manual for Bridge Evaluation, 3rd ed.; AASHTO: Washington, DC, USA, 2018. [Google Scholar]
  7. Santarsiero, G.; Masi, A.; Picciano, V.; Digrisolo, A. The Italian Guidelines on Risk Classification and Management of Bridges: Applications and Remarks on Large Scale Risk Assessments. Infrastructures 2021, 6, 111. [Google Scholar] [CrossRef]
  8. Domenico, D.D.; Messina, D.; Requpero, A. Quality control and safety assessment of prestressed concrete bridge decks through combined field tests and numerical simulation. Structures 2022, 39, 1135–1157. [Google Scholar] [CrossRef]
  9. Brownjohn, J.M.W.; Xia, P.Q.; Hao, H.; Xia, Y. Civil structure condition assessment by FE model updating: Methodology and case studies. Finite Elem. Anal. Des. 2001, 37, 761–775. [Google Scholar] [CrossRef]
  10. Ding, L.; Hao, H.; Xia, Y.; Deeks, A.J. Evaluation of bridge load carrying capacity using updated finite element model and nonlinear analysis. Adv. Struct. Eng. 2012, 15, 1739–1750. [Google Scholar] [CrossRef] [Green Version]
  11. Xin, Y.; Li, J.; Hampson, K. Load-Carrying Capacity Assessment of an Existing Highway Bridge Based on Hybrid Finite-Element Model Updating. J. Perform. Constr. Facil. 2022, 36, 4022028. [Google Scholar] [CrossRef]
  12. Ye, C.; Kuok, S.C.; Butler, L.J.; Middleton, C.R. Implementing bridge model updating for operation and maintenance purposes: Examination based on UK practitioners’ views. Struct. Infrastruct. Eng. 2022, 18, 1638–1657. [Google Scholar] [CrossRef]
  13. Bagheri, A.; Ozbulut, O.E.; Harris, D.K.; Alipour, M.; Hosseinzadeh, A.Z. A hybrid experimental-numerical approach for load rating of reinforced concrete bridges with insufficient structural properties. Struct. Infrastruct. Eng. 2019, 15, 754–770. [Google Scholar] [CrossRef]
  14. Bagheri, A.; Alipour, M.; Ozbulut, O.E.; Harris, D.K. A nondestructive method for load rating of bridges without structural properties and plans. Eng. Struct. 2018, 171, 545–556. [Google Scholar] [CrossRef]
  15. Huang, J. Evaluating Bridge Performance: Load Rating Bridges without Plans and Experimental Displacement Influence Lines; University of Delaware ProQuest Dissertations Publishing: Ann Arbor, MI, USA, 2007. [Google Scholar]
  16. Huang, J.; Shenton, H.W. Load rating of concrete bridge without plans. In Proceedings of the Structures Congress 2010, Orlando, FL, USA, 12–15 May 2010. [Google Scholar]
  17. Aquilar, C.V.; Jáuregui, D.V.; Newtson, C.M.; Weldon, B.D.; Cortez, T.M. Load rating a prestressed concrete double T-beam bridge without plans by field testing. Transp. Res. Rec. 2015, 2522, 90–99. [Google Scholar] [CrossRef]
  18. Shakya, A.; Mishra, M.; Maity, D.; Santarsiero, G. Structural health monitoring based on the hybrid ant colony algorithm by using Hooke–Jeeves pattern search. SN Appl. Sci. 2019, 1, 799. [Google Scholar] [CrossRef] [Green Version]
  19. Sun, Z.; Siringoringo, D.M.; Fujino, Y. Load-carrying capacity evaluation of girder bridge using moving vehicle. Eng. Struct. 2021, 229, 111645. [Google Scholar] [CrossRef]
  20. Pinjarkar, S.G.; Guedelhoefer, O.C.; Smith, B.J.; Kritzler, R.W. Nondestructive load testing for bridge evaluation and rating. Final. Rep. NCHRP Proj. 1990, 13, 12–28. [Google Scholar]
  21. Bakht, B.; Jaeger, L.G. Bridge Testing: A Surprise Every Time. J. Struct. Eng. 1990, 116, 1370–1383. [Google Scholar] [CrossRef]
  22. Park, M.H.; Ju, M.; Jeong, S.; Kim, J.Y. Incorporating interaction terms in multivariate linear regression for post-event flood waste estimation. Waste Manag. 2021, 124, 337–384. [Google Scholar] [CrossRef]
  23. Kumar, S.; Nimchuk, N.; Kumar, R.; Zietsman, J.; Ramani, T.; Spiegelman, C.; Kenney, M. Specific model for the estimation of methane emission from municipal solid waste landfills in India. Bioresour. Technol. 2016, 216, 981–987. [Google Scholar] [CrossRef]
  24. Ministry of Land, Transport and Maritime Affairs. Detailed Safety Inspection and Precise Safety Diagnosis Guidelines (Bridge); Ministry of Land, Transport and Maritime Affairs: Seoul, Republic of Korea, 2012. (In Korean)
  25. Taheri, S.; Brodie, G.; Gupta, D. Optimised ANN and SVR models for online prediction of moisture content and temperature of lentil seeds in a microwave fluidised bed dryer. Comput. Electron. Agric. 2021, 182, 106003. [Google Scholar] [CrossRef]
  26. Daliakopoulos, I.N.; Coulibaly, P.; Tsanis, I.K. Groundwater level forecasting using artificial neural networks. J. Hydrol. 2005, 309, 229–240. [Google Scholar] [CrossRef]
  27. Tran, V.L.; Thai, D.K.; Kim, S.E. Application of ANN in predicting ACC of SCFST column. Compos. Struct. 2019, 228, 111332. [Google Scholar] [CrossRef]
  28. Hadi, M.N.S. Neural networks applications in concrete structures. Comput. Struct. 2003, 81, 373–381. [Google Scholar] [CrossRef]
  29. Banerjee, S.; Robi, P.S.; Srinivasan, A. Prediction of hot deformation behavior of Al–5.9% Cu–0.5% Mg alloys with trace additions of Sn. J. Mater. Sci. 2012, 47, 929–948. [Google Scholar] [CrossRef]
  30. Zhang, L.; Wang, F.; Xu, B.; Chi, W.; Wang, Q.; Sun, T. Prediction of stock prices based on LM-BP neural network and the estimation of overfitting point by RDCI. Neural Comput. Appl. 2018, 30, 1425–1444. [Google Scholar] [CrossRef]
  31. Nikbin, I.M.; Rahimi, S.; Allahyari, H. A new empirical formula for prediction of fracture energy of concrete based on the artificial neural network. Eng. Fract. Mech. 2017, 186, 466–482. [Google Scholar] [CrossRef]
  32. Naderpour, H.; Kheyroddin, A.; Amiri, G.G. Prediction of FRP-confined compressive strength of concrete using artificial neural networks. Compos. Struct. 2010, 92, 2817–2829. [Google Scholar] [CrossRef]
  33. Liang, X.; Chen, R.C. A unified mathematical form for removing neurons based on orthogonal projection and crosswise propagation. Neural Comput. Appl. 2010, 19, 445–457. [Google Scholar] [CrossRef]
Figure 1. Procedure of determining load-carrying capacity.
Applsci 13 01283 g001
Figure 2. Input parameters.
Applsci 13 01283 g002
Figure 3. Distribution of data information. (a) Length of girder. (b) Width of bridge. (c) Thickness of slab. (d) Number of girders. (e) Space of girder. (f) Hight of girder. (g) Design strength.
Applsci 13 01283 g003aApplsci 13 01283 g003b
Figure 4. Multiple linear regression.
Applsci 13 01283 g004
Figure 5. Decision tree.
Applsci 13 01283 g005
Figure 6. Support vector machine.
Applsci 13 01283 g006
Figure 7. Performance of each regression model. (a) MLR. (b) DT. (c) SVM. (d) BT. (e) GPR.
Applsci 13 01283 g007aApplsci 13 01283 g007b
Figure 8. Distribution of input and target parameters. (a) Input parameter 1. (b) Input parameter 2. (c) Input parameter 3. (d) Input parameter 4. (e) Input parameter 5. (f) Input parameter 6. (g) Input parameter 7. (h) Target.
Applsci 13 01283 g008aApplsci 13 01283 g008b
Figure 9. Schematic diagram of ANN model.
Applsci 13 01283 g009
Figure 10. Performance of N12S model. (a) Comparison between target and prediction of N12S. (b) Error rate of N12S prediction.
Applsci 13 01283 g010
Figure 11. Comparison of target and prediction.
Applsci 13 01283 g011
Figure 12. Overfitting problem caused by developing high abstraction model.
Applsci 13 01283 g012
Table 1. Statical properties of bridge design document data.
Input Data L g i r d e r W b r i d g e t s l a b N g i r d e r S g i r d e r H g i r d e r ϕ M n
(mm)(mm)(mm)-(mm)(mm)(kN m)
Max.5037,000270163090260041,261
Ave.4016,19924142690201326,380
Min.2710,00024042000110011,880
St. Dev.66111322004507800
Table 2. MAPE and R a d j 2 results of five regression algorithms.
MLRDTSVMBTGPR
MAPE3.1%2.3%3.0%4.5%0.3%
R a d j 2 0.9690.9790.9840.9850.999
Table 3. Condition rating system for girders.
Condition RatingGirderPrestressing Tendon
Crack
Width
Deterioration
and Damage
Tendon Exposure
and Damage
Cement Grout
Filling Defect
Sheath
Damage
A
No
No
No exposure
No filling defect
No
B
Less than 0.2 mm
Surface damage area less than 2%
Exposure (1)
Filling defect
Damage (5)
C
0.2~0.3 mm
Surface damage area 2~10%
Over than 2% of rebar corrosion area
Surface corrosion (2)
Chloride content (4) 1.2~2.5 kg/m3 on filling defect
-
D
0.3~0.5 mm
Over than 10% of surface damage area
Over than 2% of rebar corrosion area
Corrosion (3) with loss of area
Chloride content over than 2.5 kg/m3 on filling defect
-
E
More than 0.5 mm
Degradation of member stability due to severe damage at end concrete or anchorage zone
Rupture of tendon
--
(1) Exposure: state where strand(s) not covered due to grout filling defect. (2) Surface corrosion: state of rust on the strand(s) surface. (3) Corrosion: state of the cross-section loss by progressive surface corrosion, local corrosion, etc. (4) Chloride content: based on total chloride ion content. (5) Damage: leakage, efflorescence, fracture, etc.
Table 4. Condition grading system for bearing plates.
Condition RatingBearing Plate
Elastomeric Bearing PlateSteel Bearing PlateSupport Concrete
A
Good
Good
Good
B
Light deterioration such as microcracks
Exterior paint peeling and corrosion
Paint discoloration, dust accumulation
Damage such as partial peeling and dropping
C
Side swelling
Shear deformation less than 0.3 times the thickness of the bearing
Corrosion of sliding plate
Partial deformation, breakage and loosening of anchorage device
Cracks of 0.3 mm or more in the supporting concrete
Decreased support cross-section due to damage such as peeling and dropping, functional impairment
D
Rubber material damage, step difference, and deepening of cracks
Shear deformation more than 0.3 times the thickness of the bearing
The floating part is less than one-half of the total area without the support being in close contact
Poor stretching function of the support
Malfunction of bearing stretching due to corrosion of the bearing body
Damage to the bearing body
The floating part is less than one-half of the total area without the support being in close contact
There is a possibility of breakage of the supporting concrete and the possibility of falling off and subsidence of the bearing due to the lower cavity
E
Damage to bearing body and girder due to poor bearing stretching function
More than one-half of the total area of the floating part without the support being in close contact
Damage to main members such as girder due to poor stretching function of the bearing
More than one-half of the total area of the floating part without the support being in close contact
Inoperable condition
Table 5. Statical properties of bridge information from safety-diagnosis reports.
InputOutput
RangeWidthLengthNumber of LanesPeriodDesign LoadGirder ConditionBearing Plate ConditionResponse Ratio
Min.61211DB-13.5DD0.49
Max.401336834DB-24AA1.51
Table 6. Performance of ANN models.
ANN ModelParametersPerformance Evaluation
Performance FunctionNumber of Neurons R 2 MSE
N2MMSE20.460.024
N4M40.640.014
N6M60.620.015
N8M80.550.022
N10M100.360.045
N12M120.260.065
N14M140.490.025
N16M160.180.091
N18M180.440.040
Best model: N4M0.640.014
N2SSSE20.570.019
N4S40.570.025
N6S60.040.111
N8S80.220.156
N10S100.140.097
N12S120.820.008
N14S140.510.025
N16S160.190.117
N18S180.050.402
Best model: N12S0.820.008
Disclaimer/Publisher’s Note: The statements, opinions and data contained in all publications are solely those of the individual author(s) and contributor(s) and not of MDPI and/or the editor(s). MDPI and/or the editor(s) disclaim responsibility for any injury to people or property resulting from any ideas, methods, instructions or products referred to in the content.

