
A Review of the Recent Advances in Piezoelectric Materials, Energy Harvester Structures, and Their Applications in Analytical Chemistry


 ,
,  and
and 
Abstract
:1. Introduction
2. Piezoelectric Materials
3. Structures
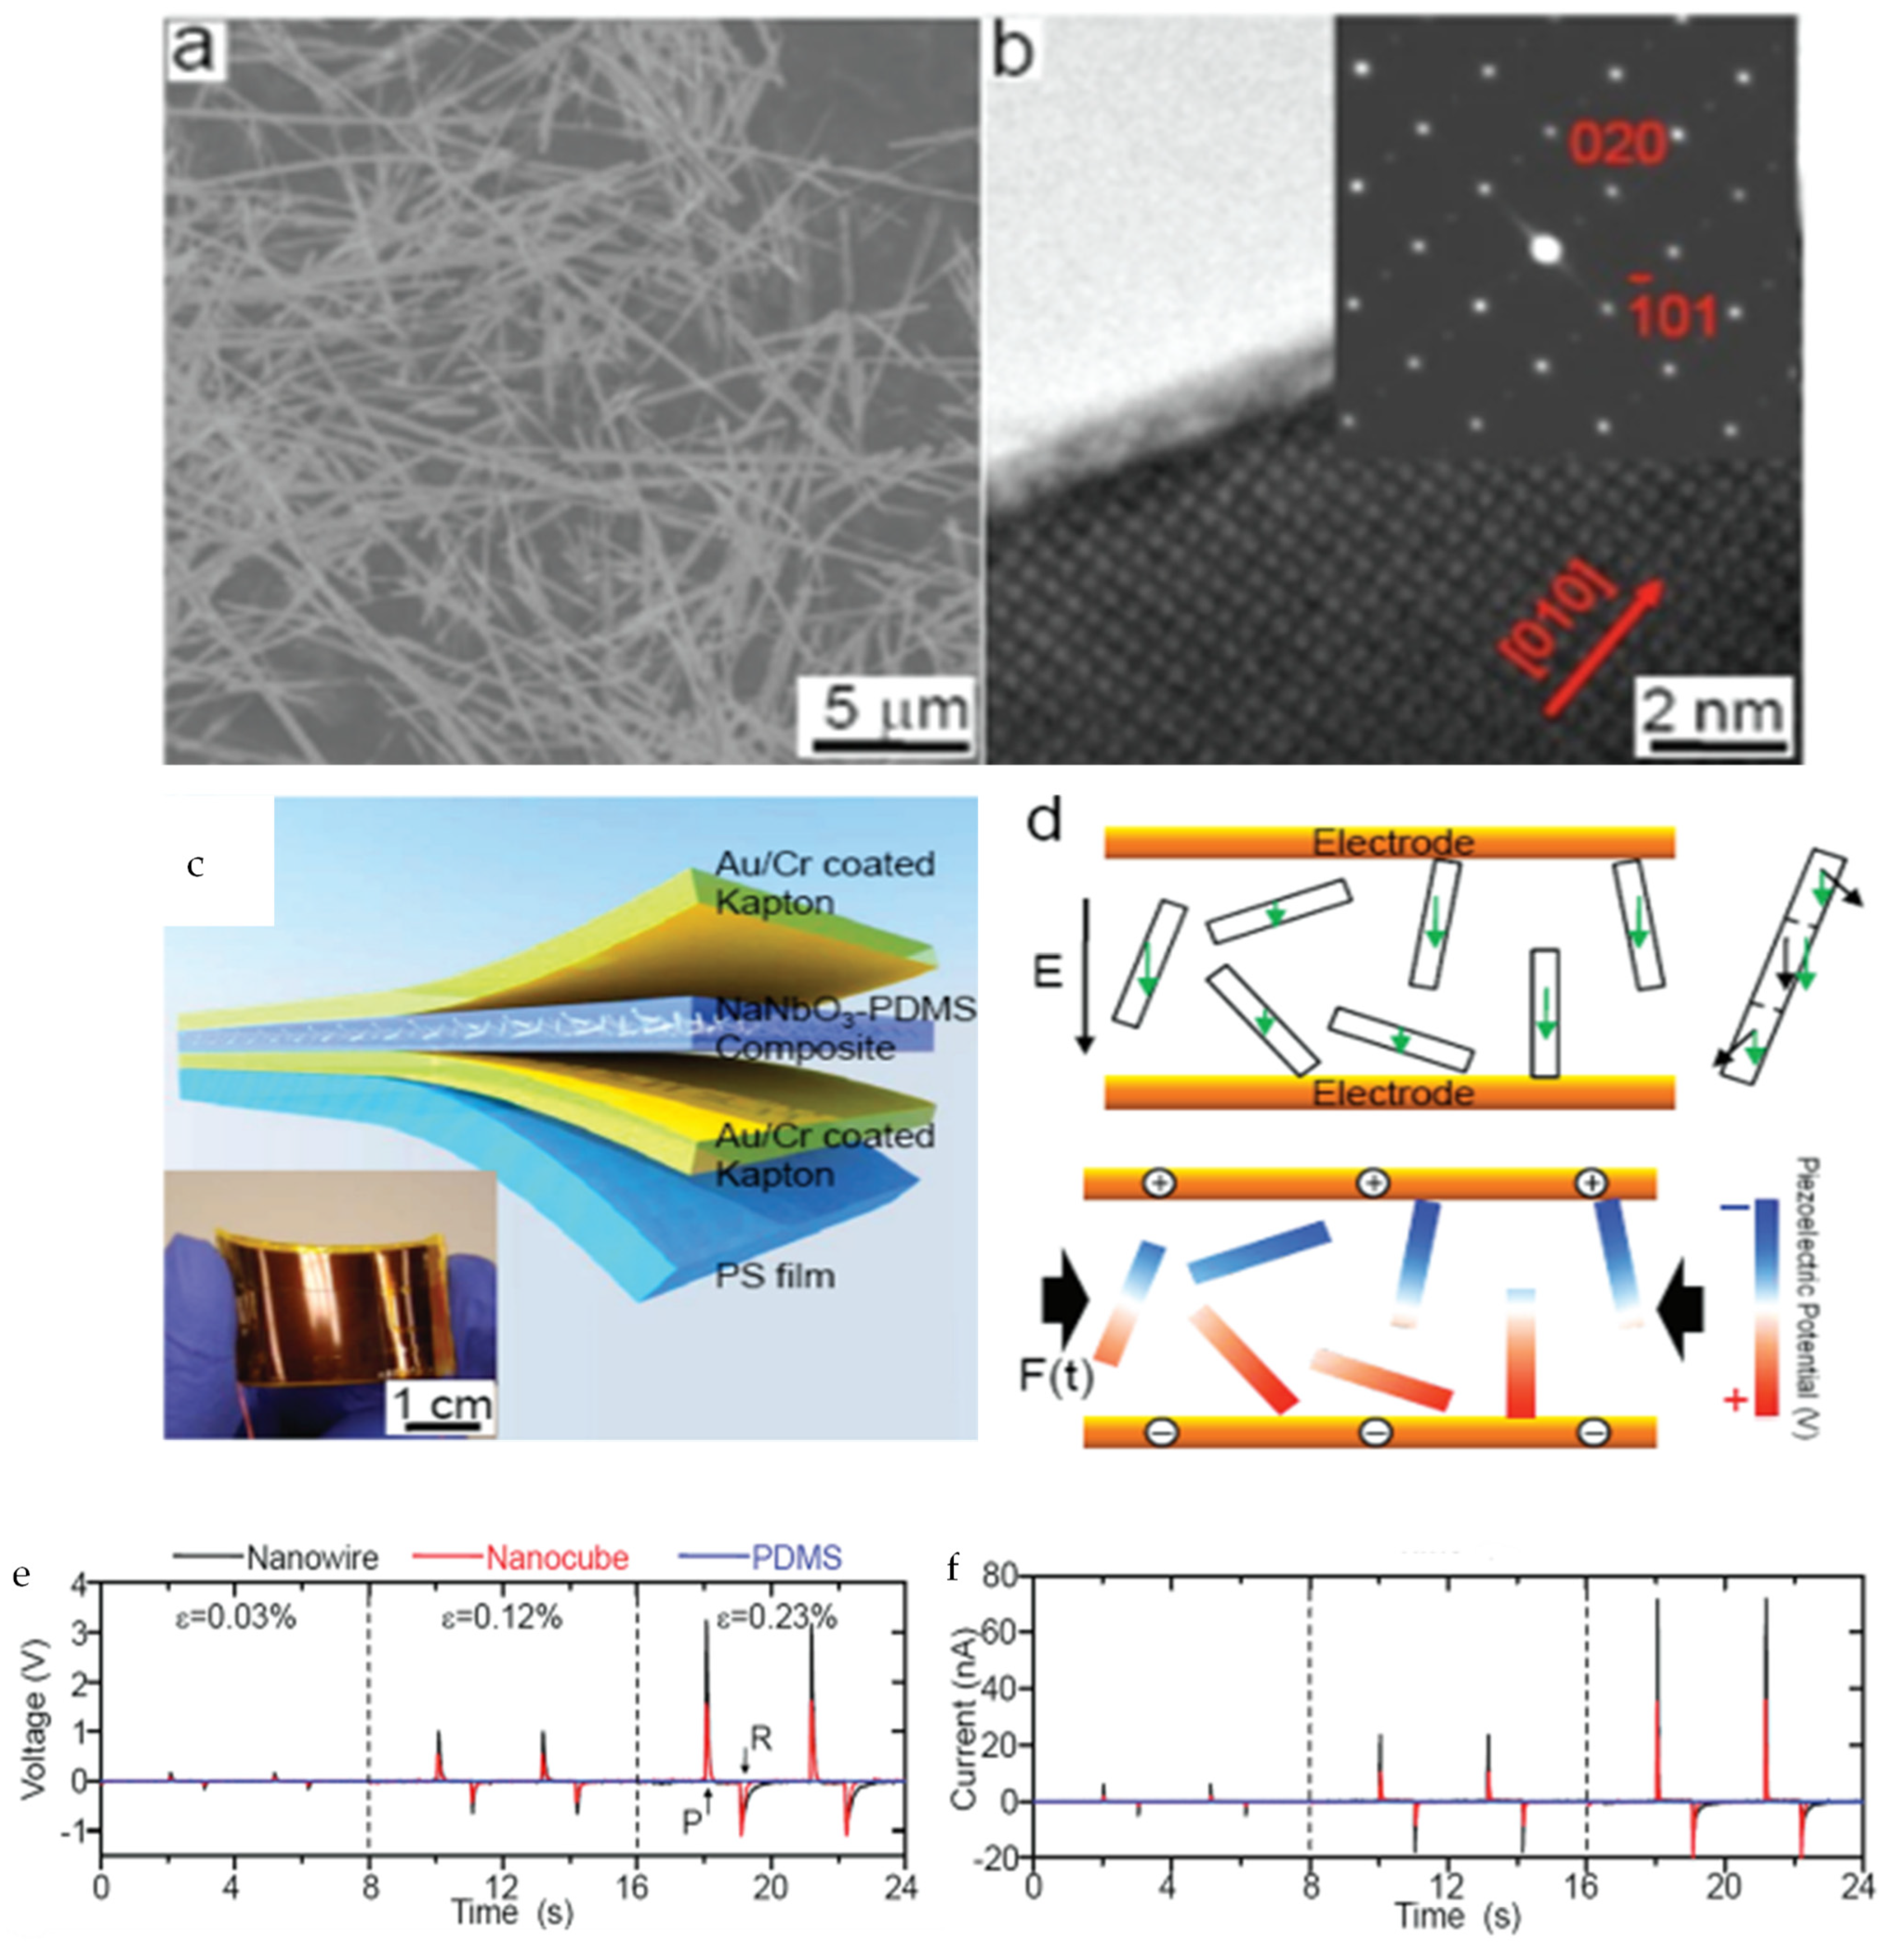
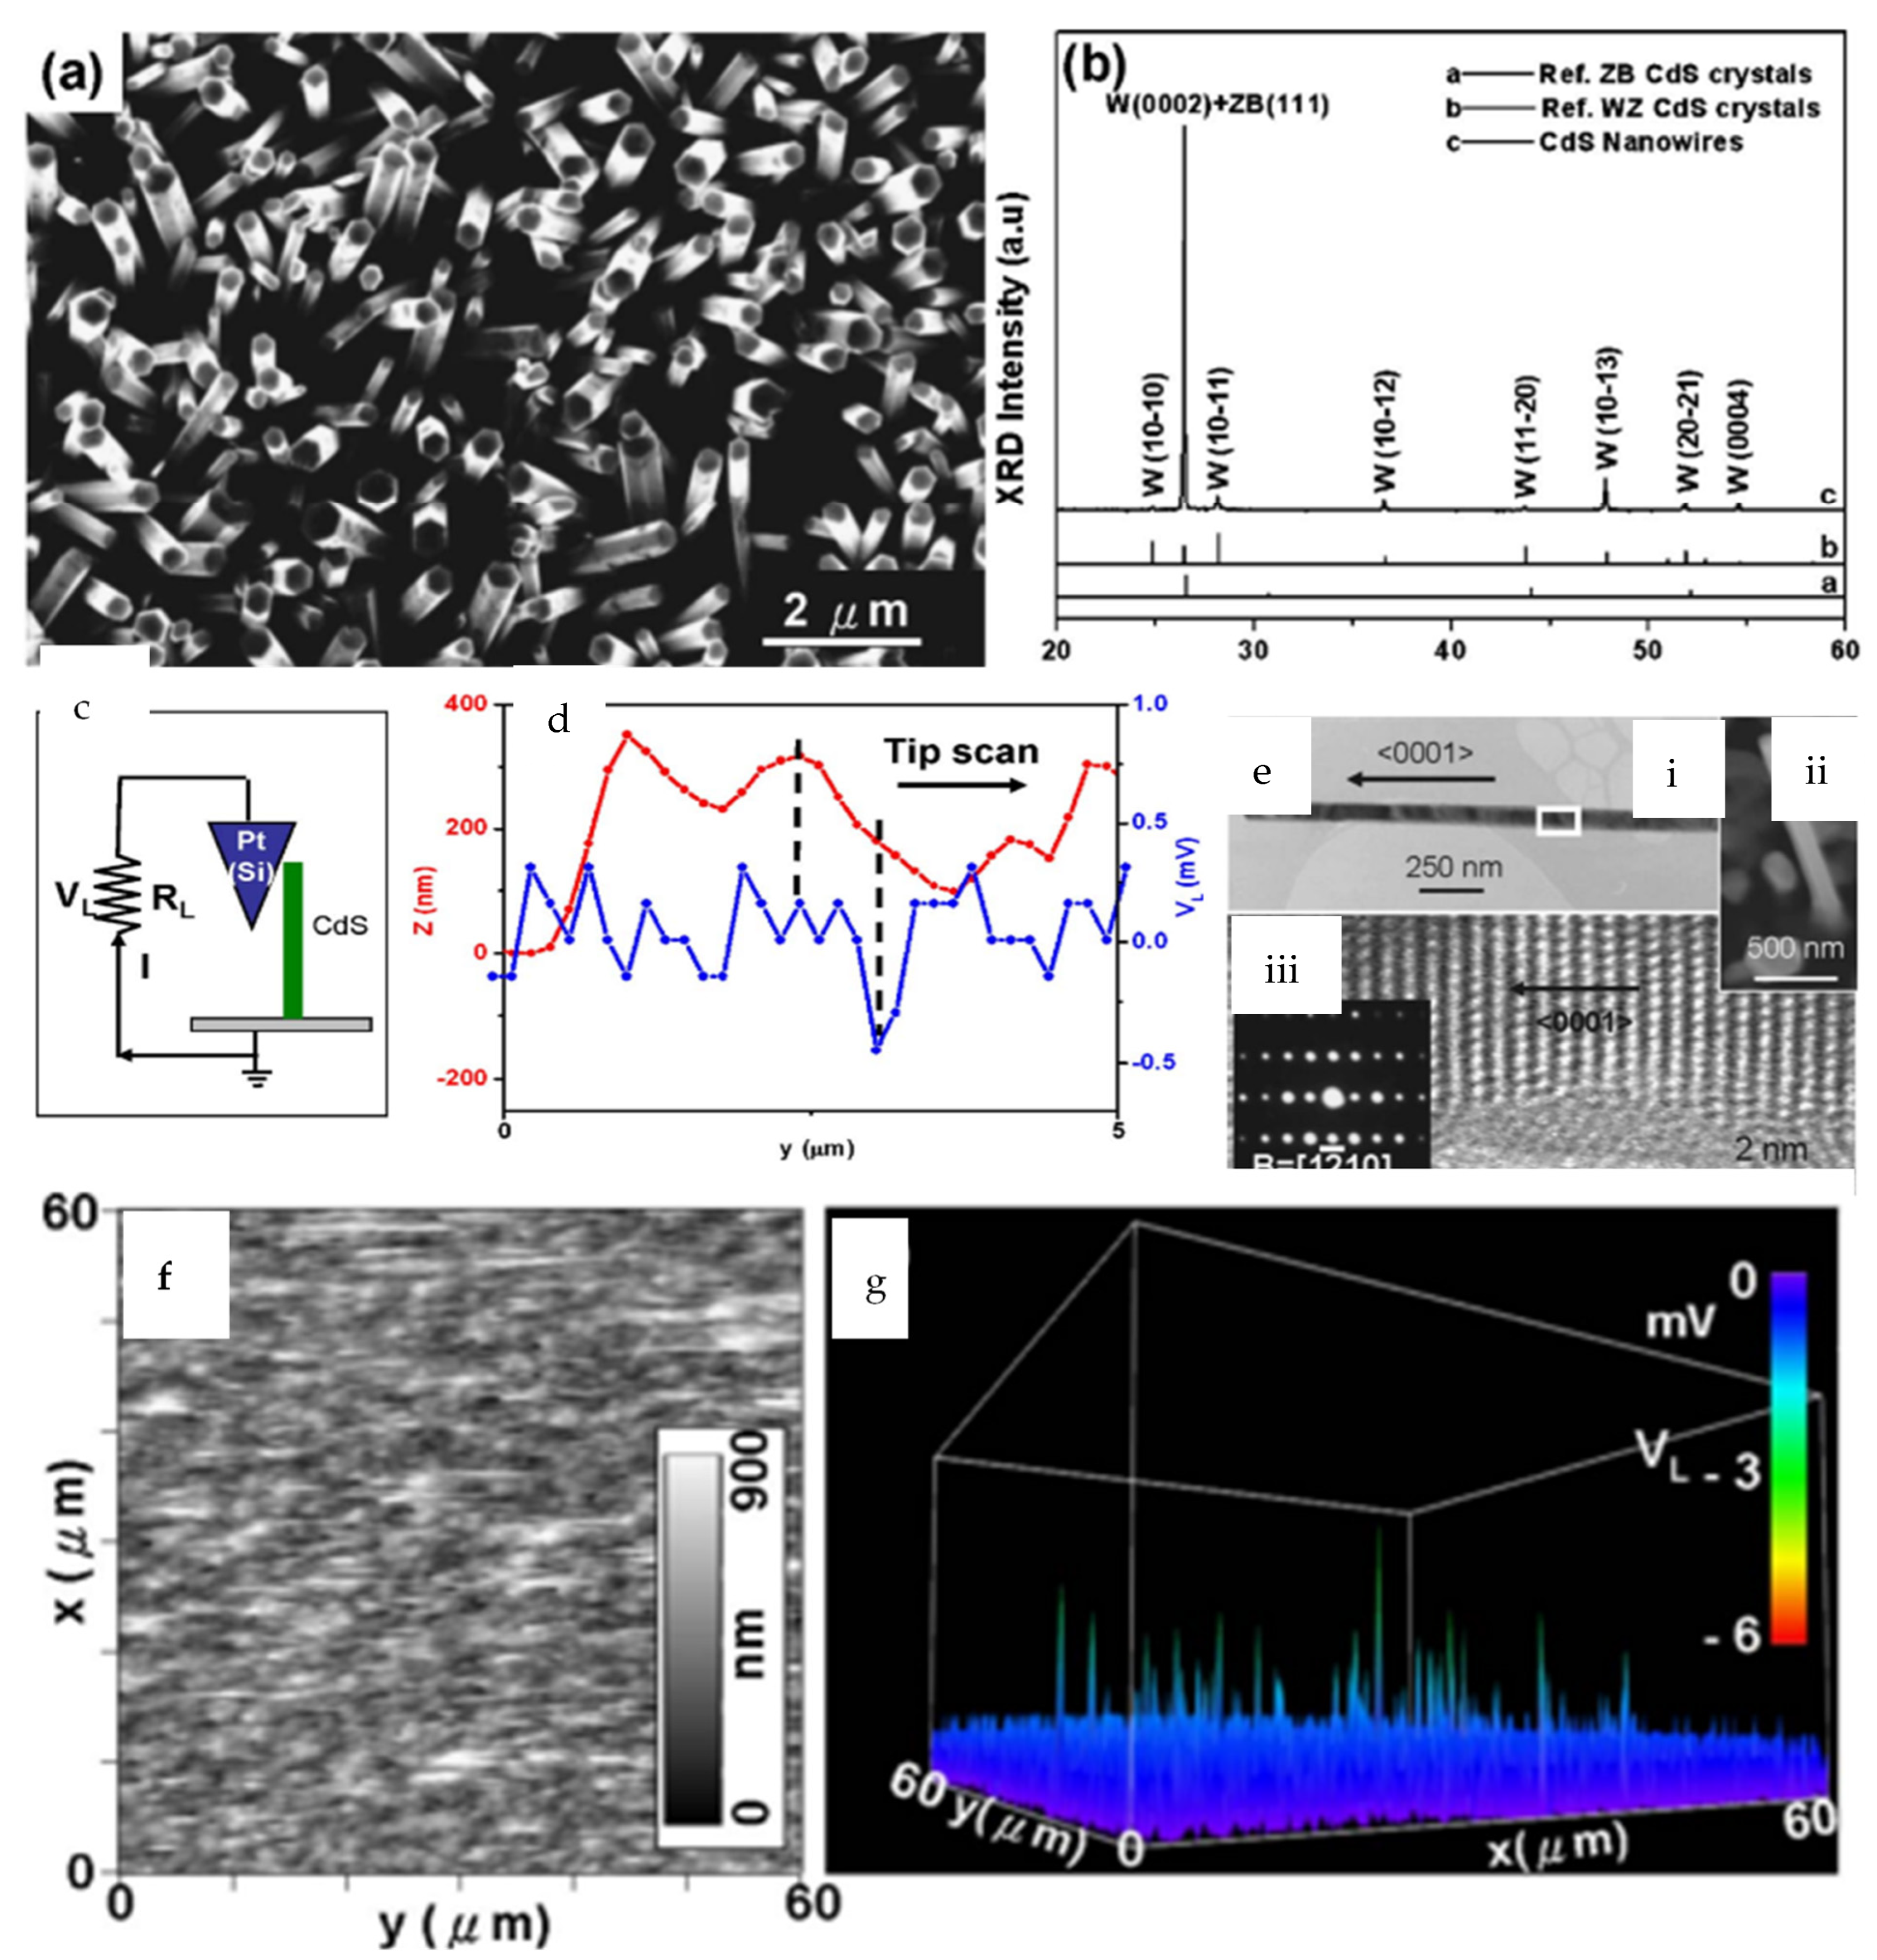
3.1. Nanowires
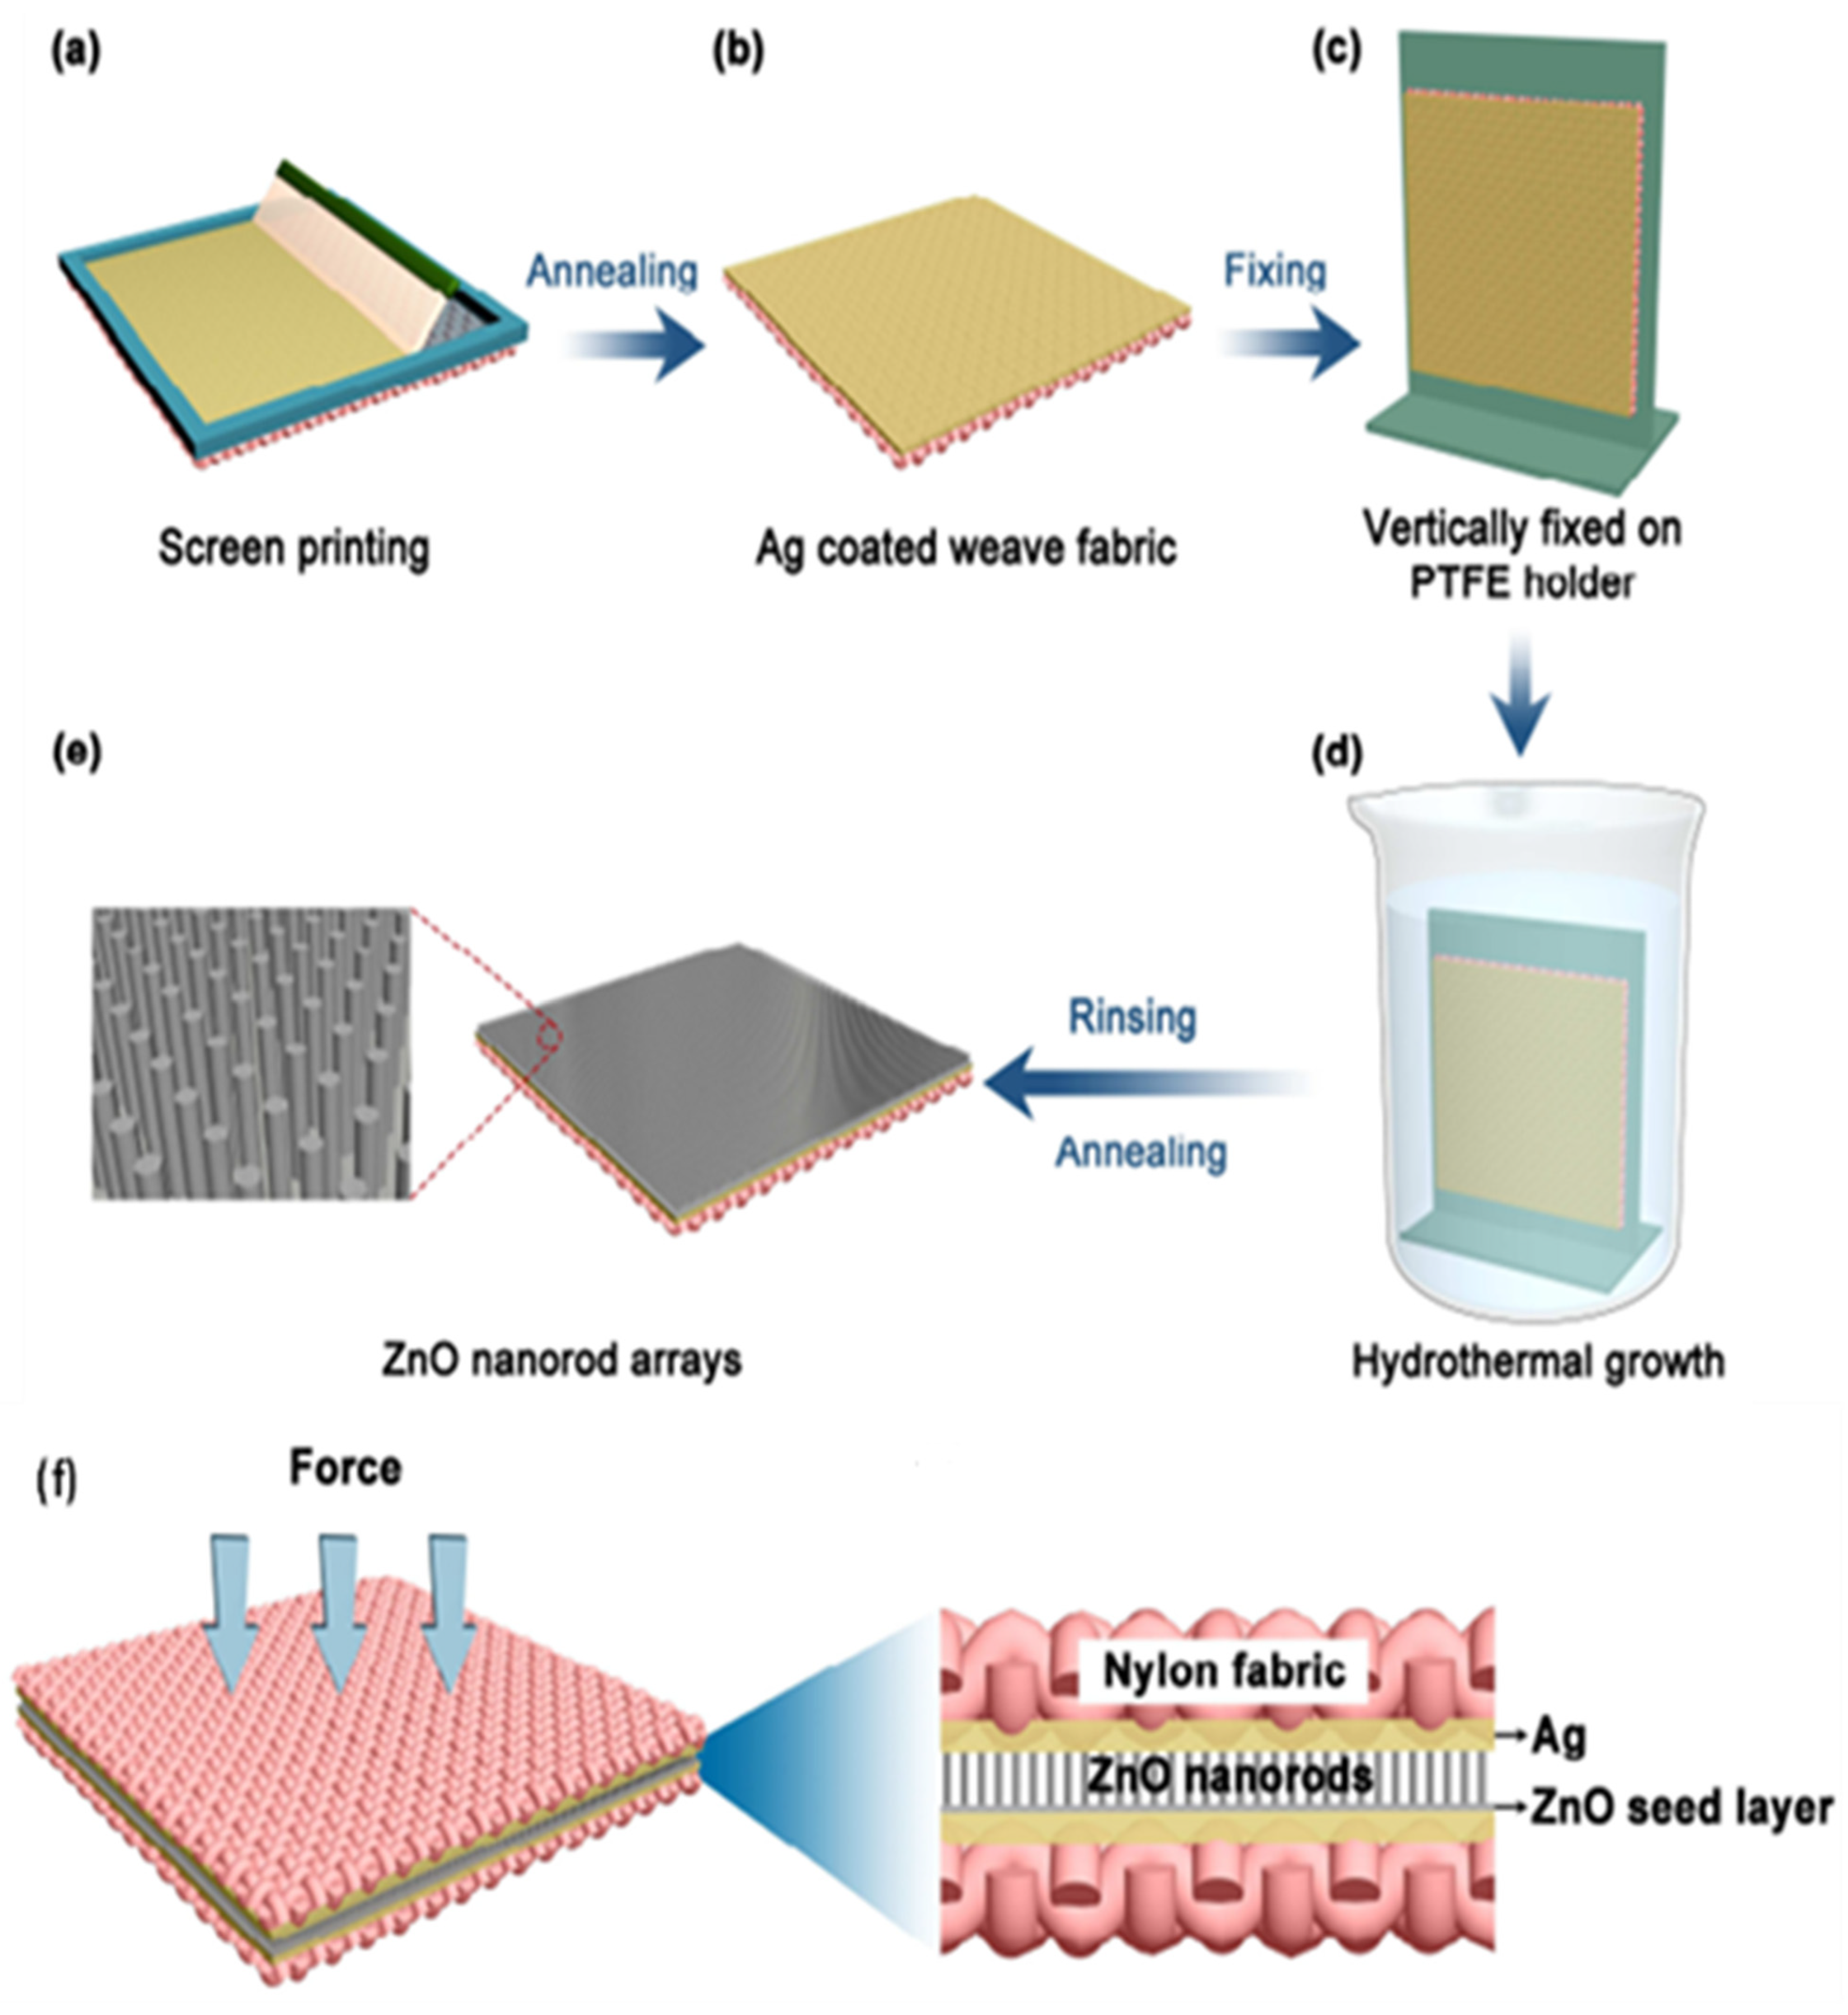
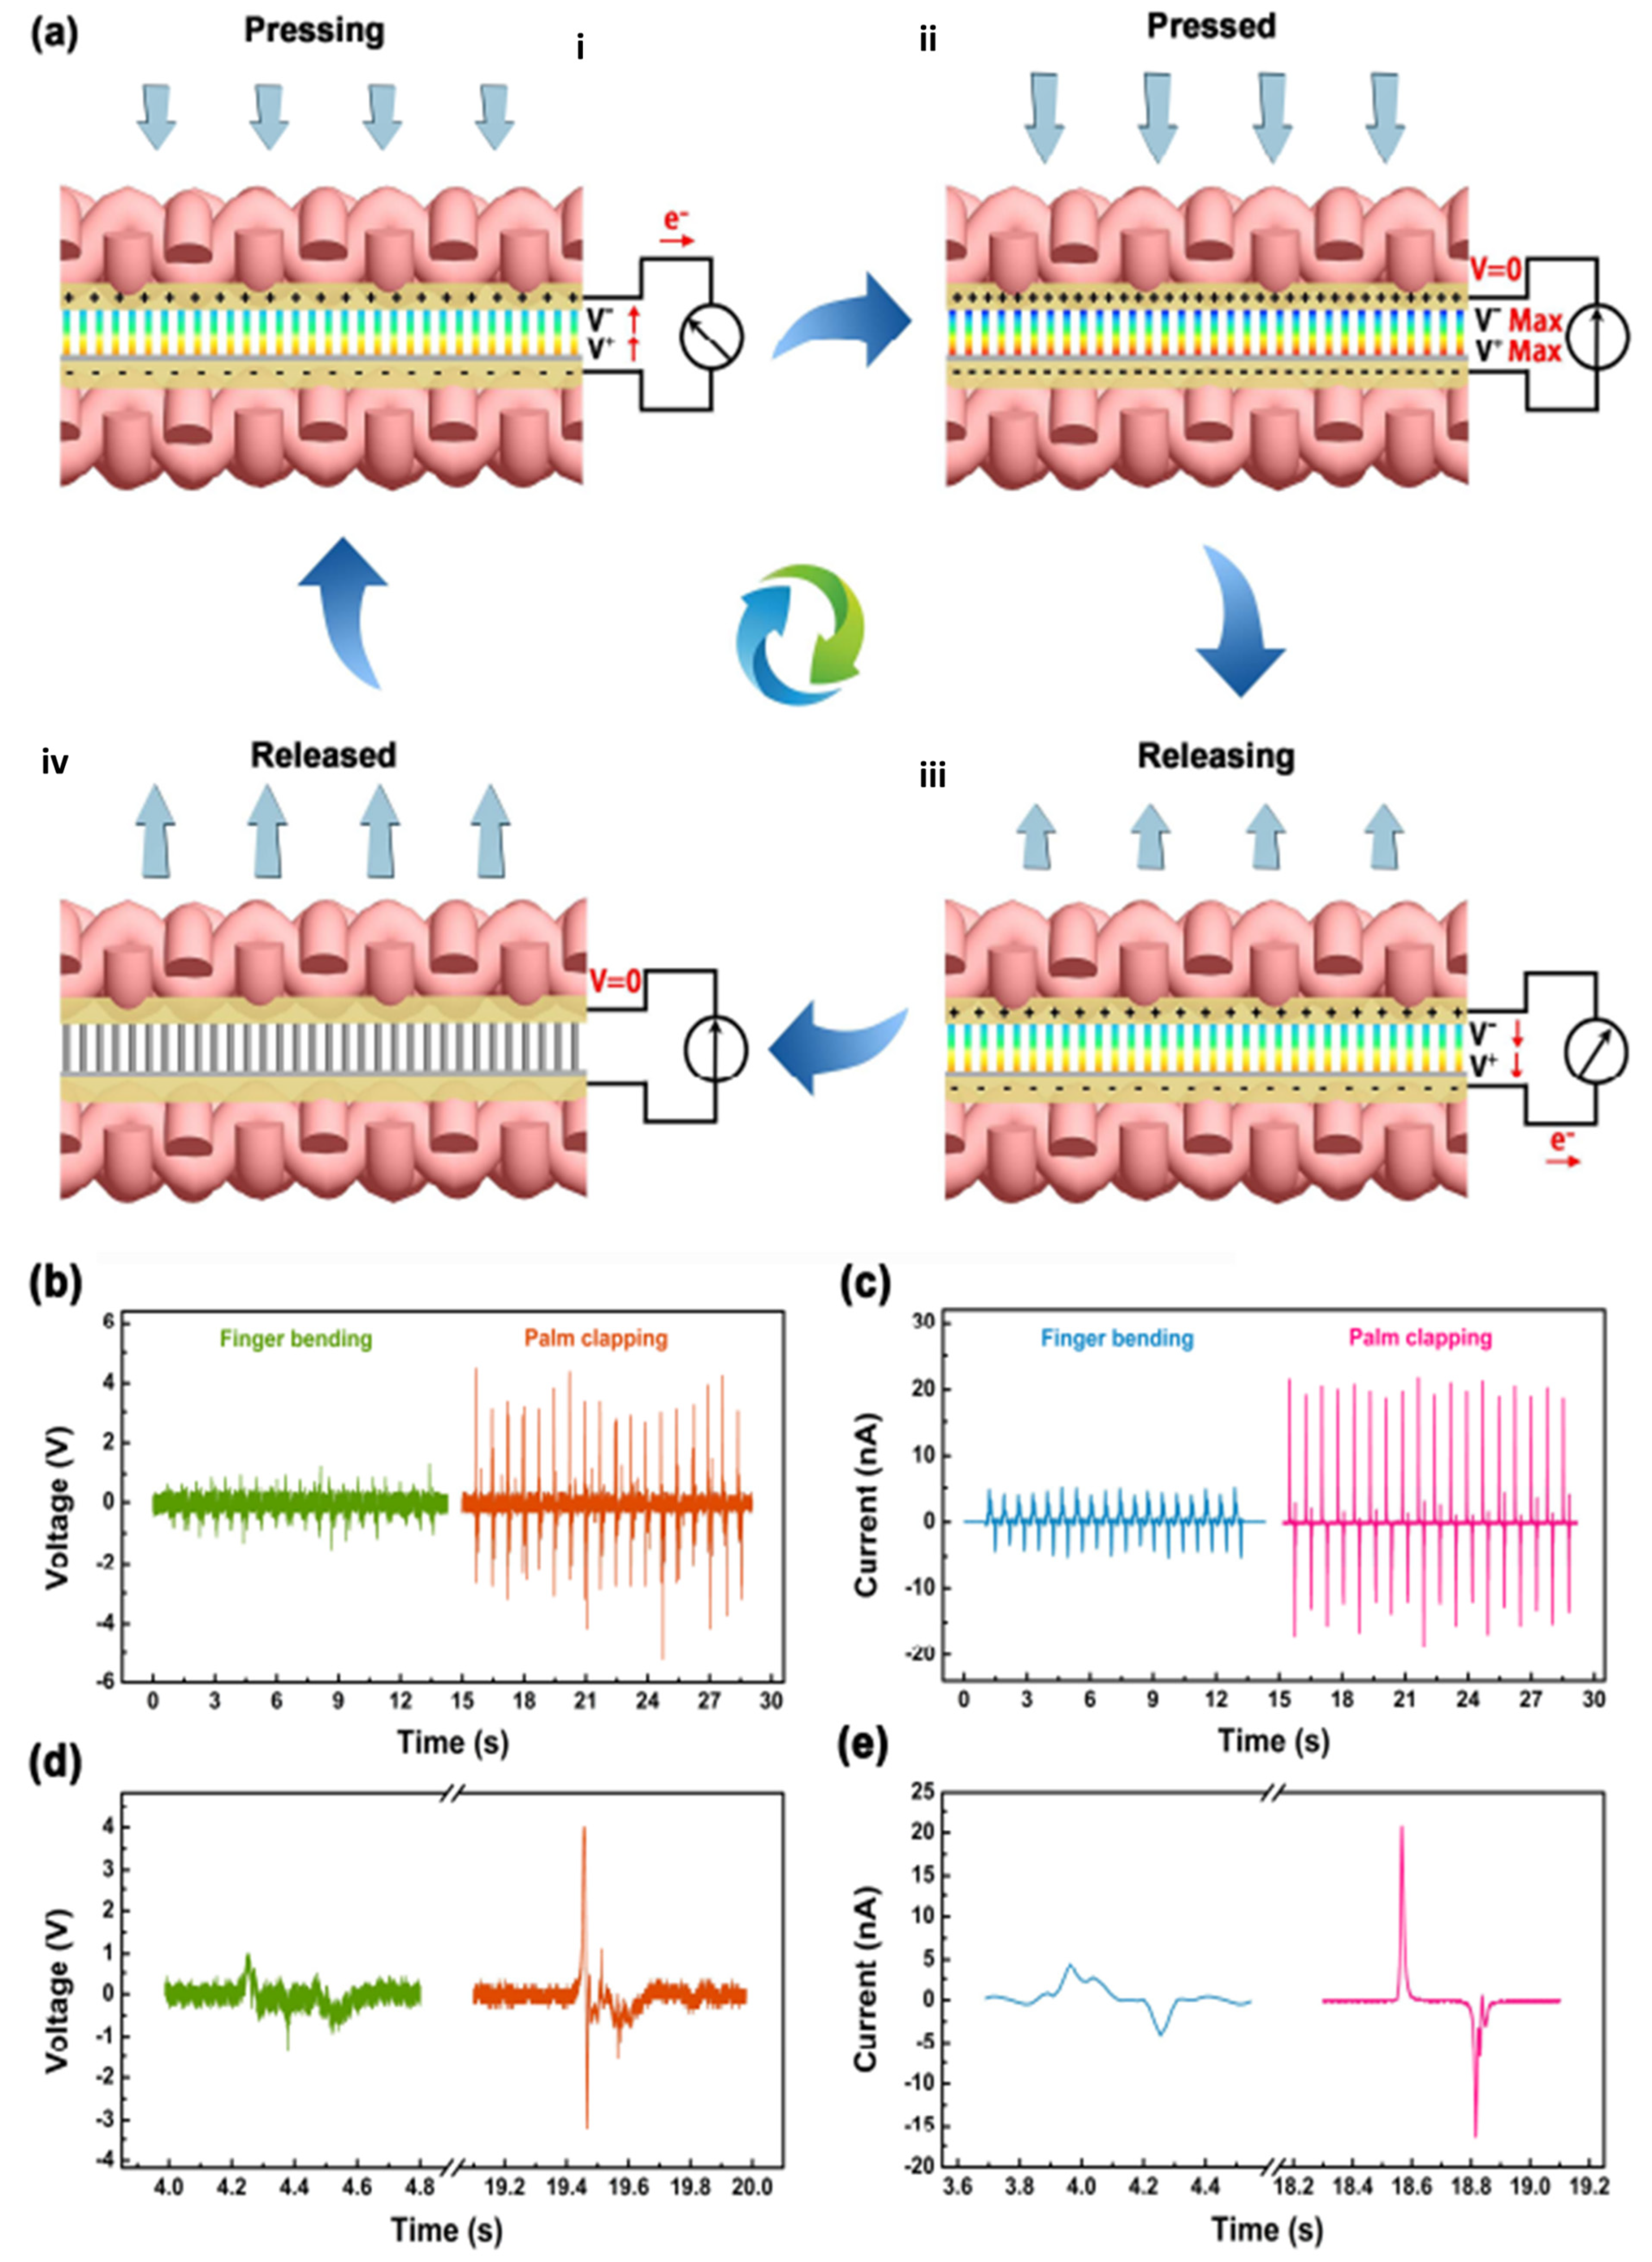
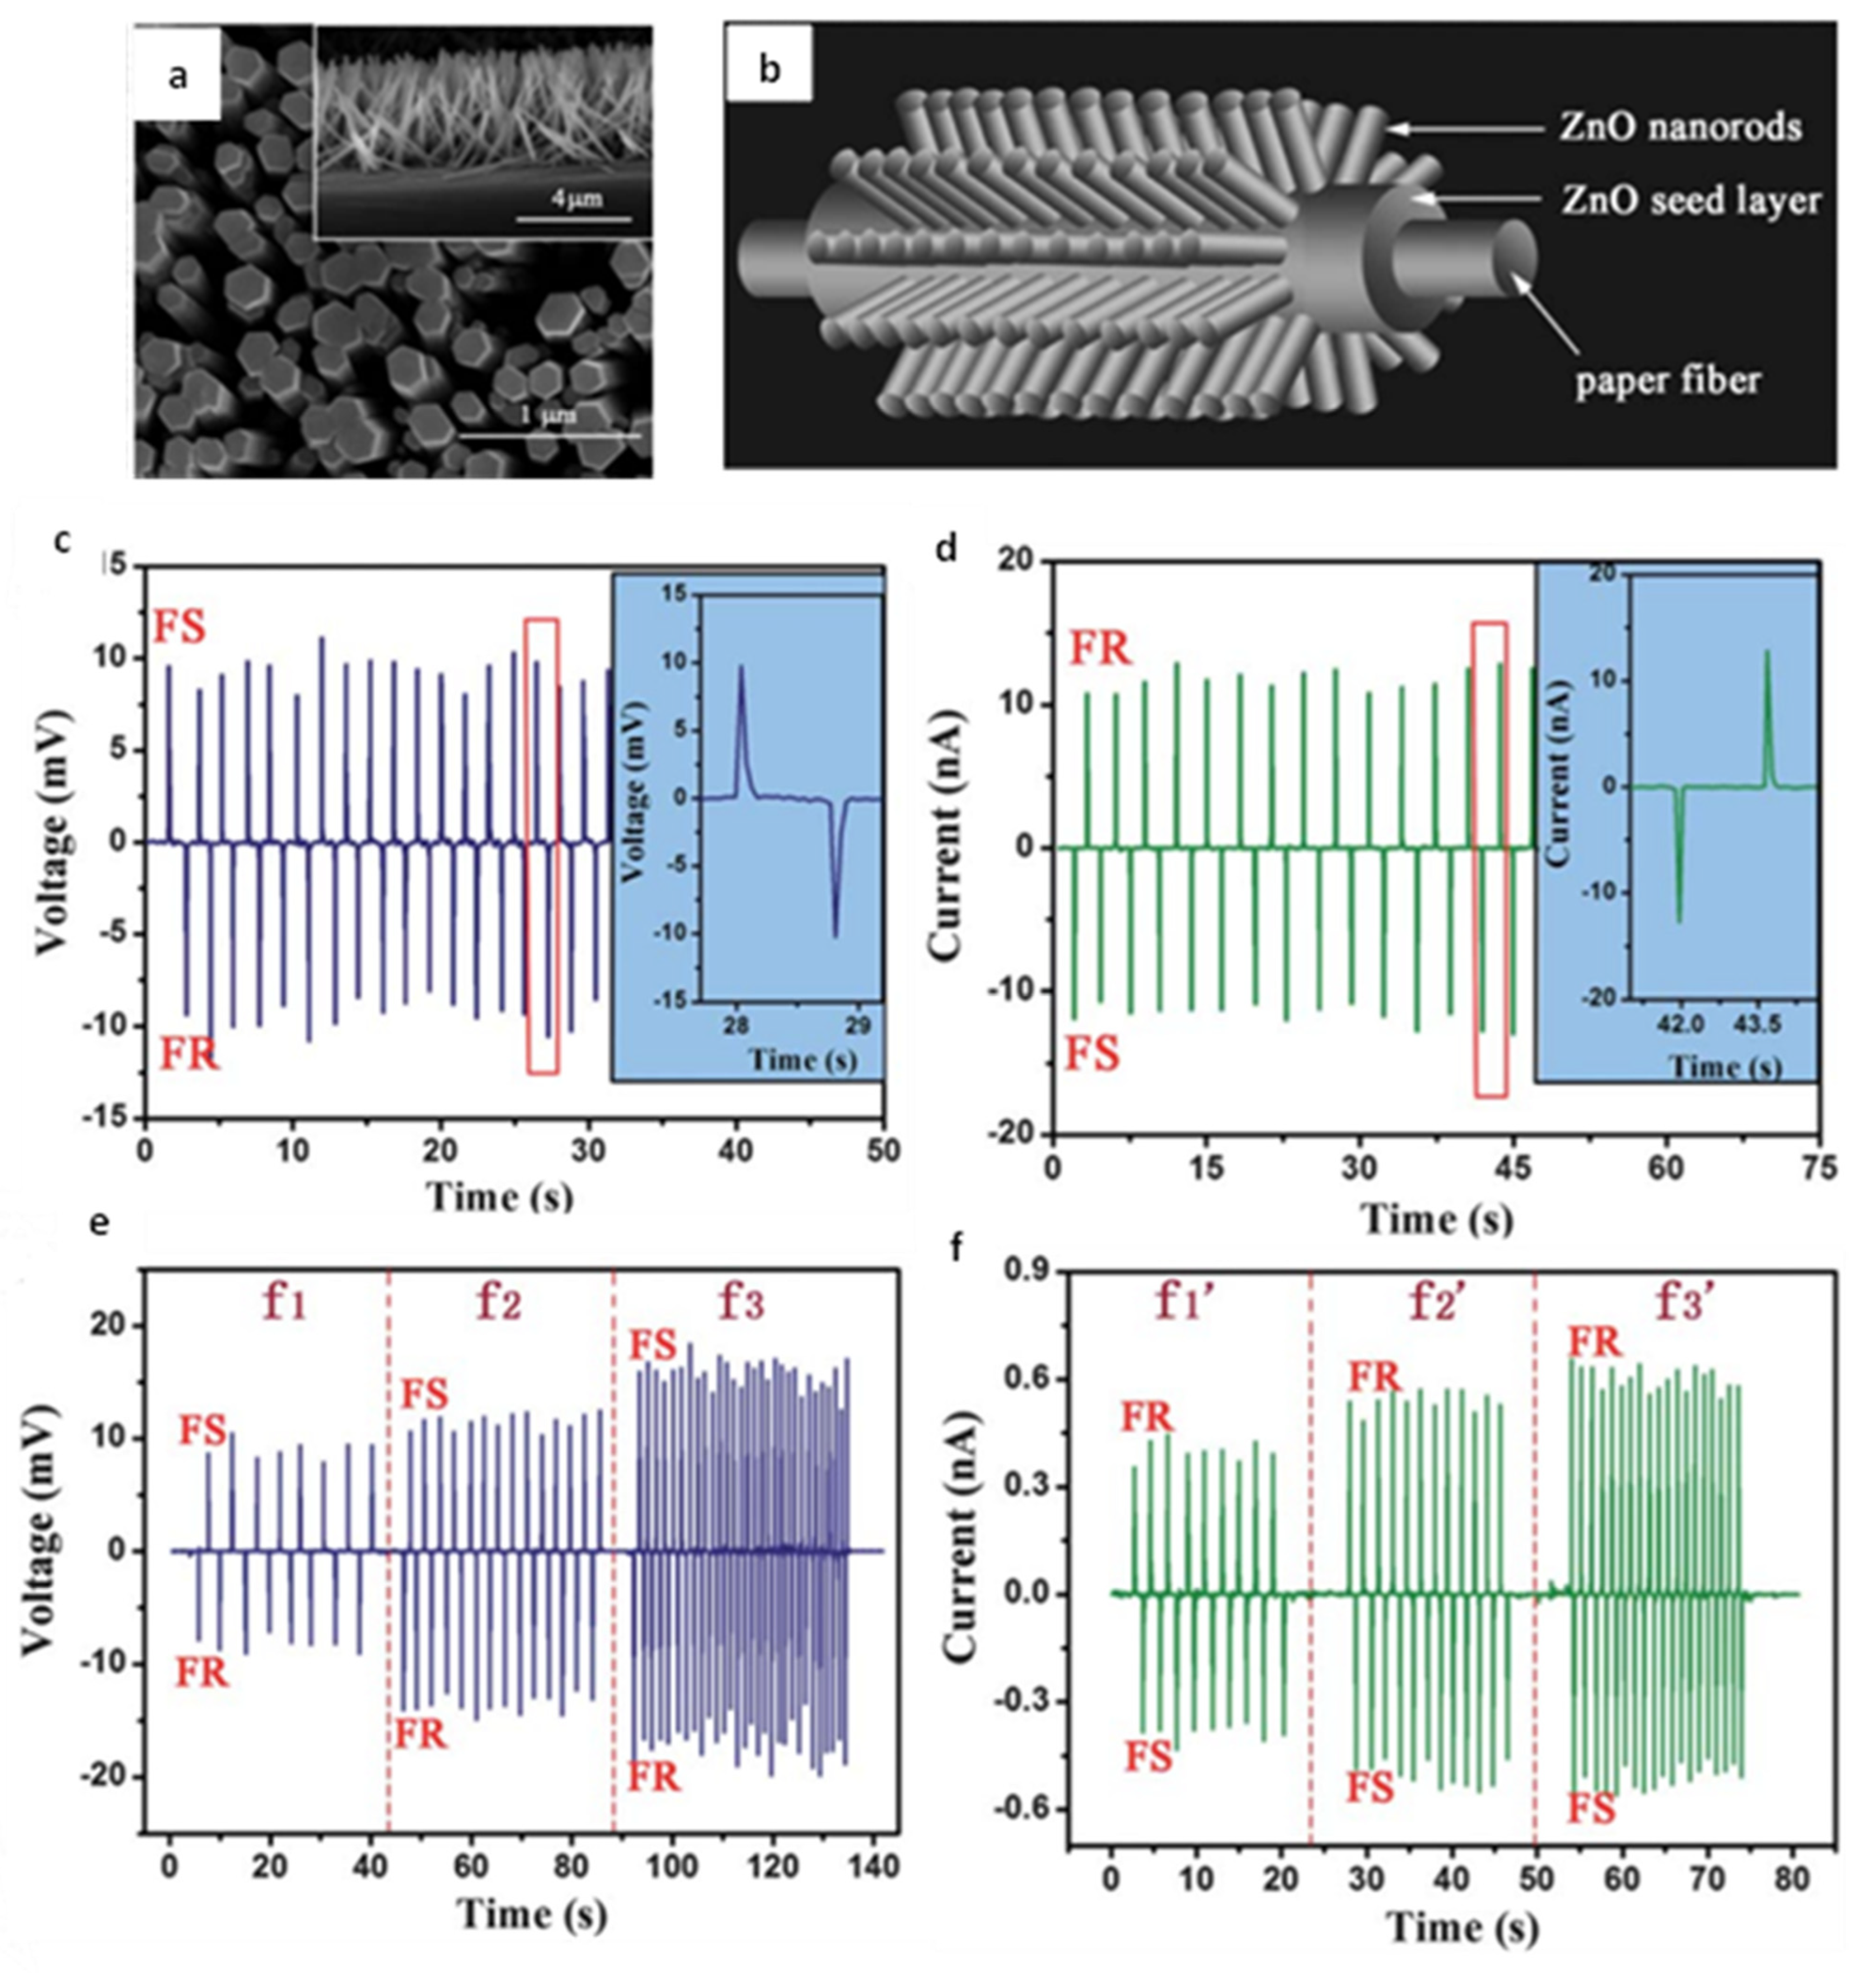
3.2. Nanorods
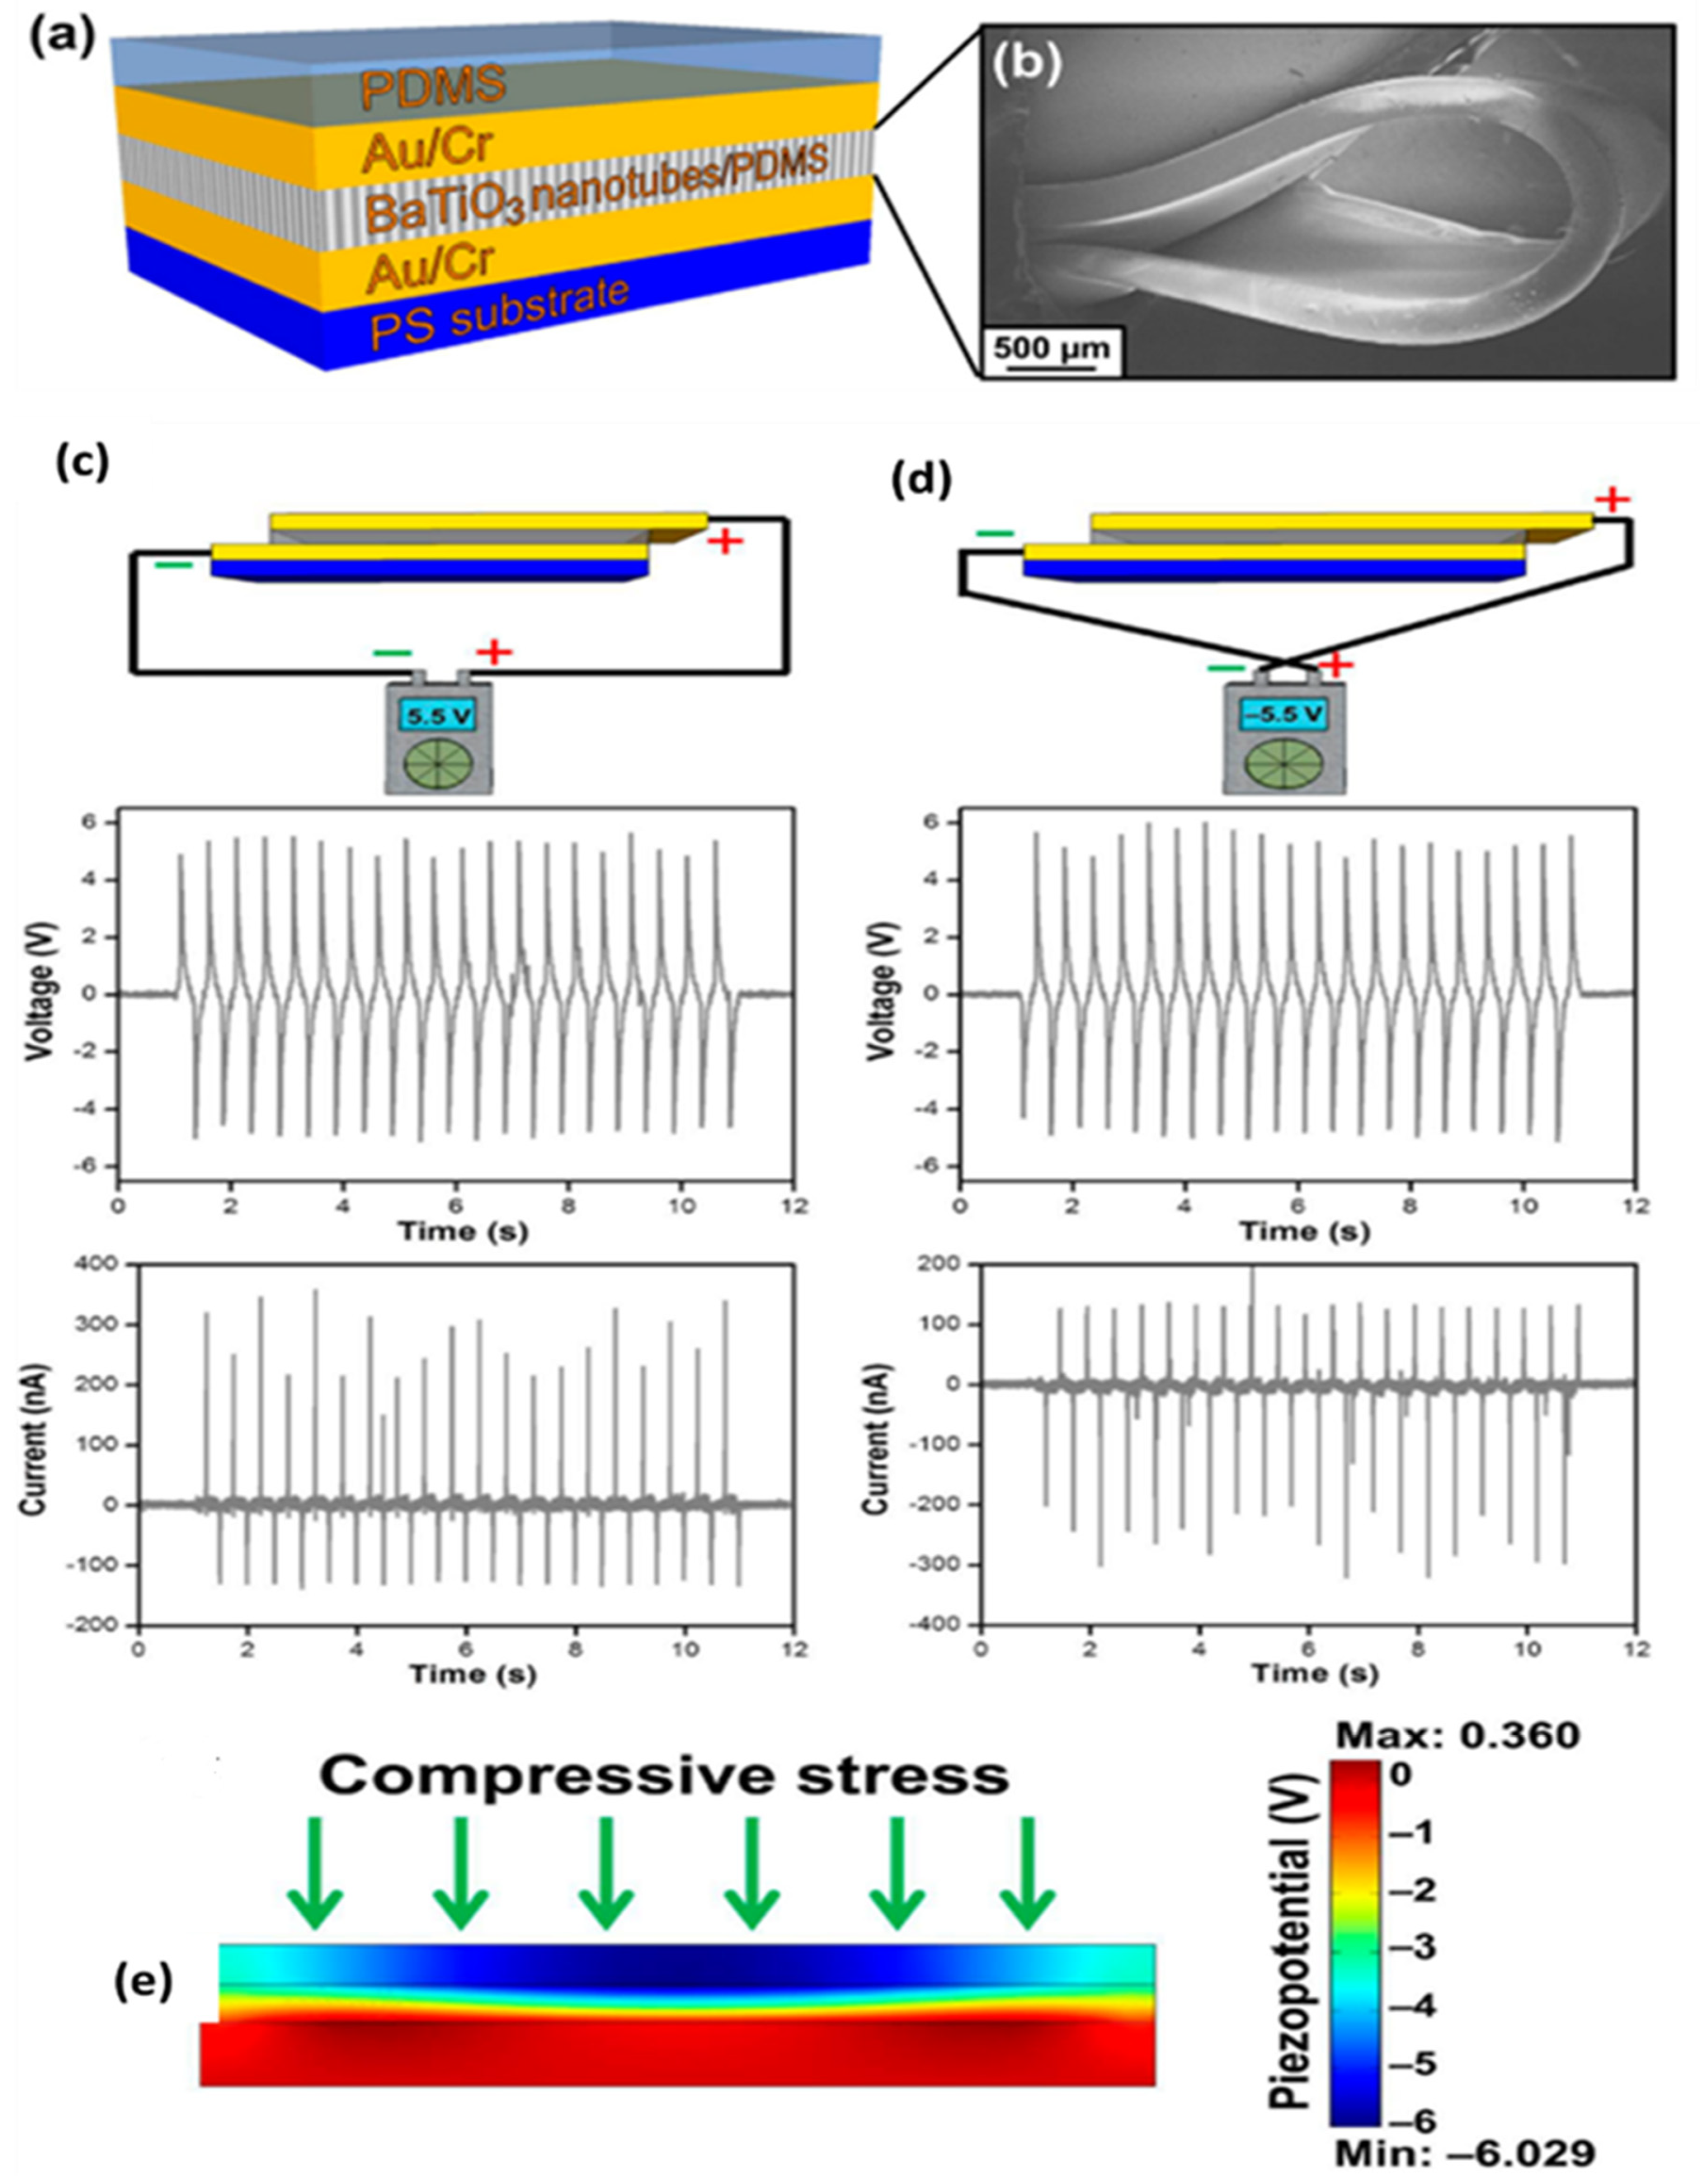
3.3. Nanotubes
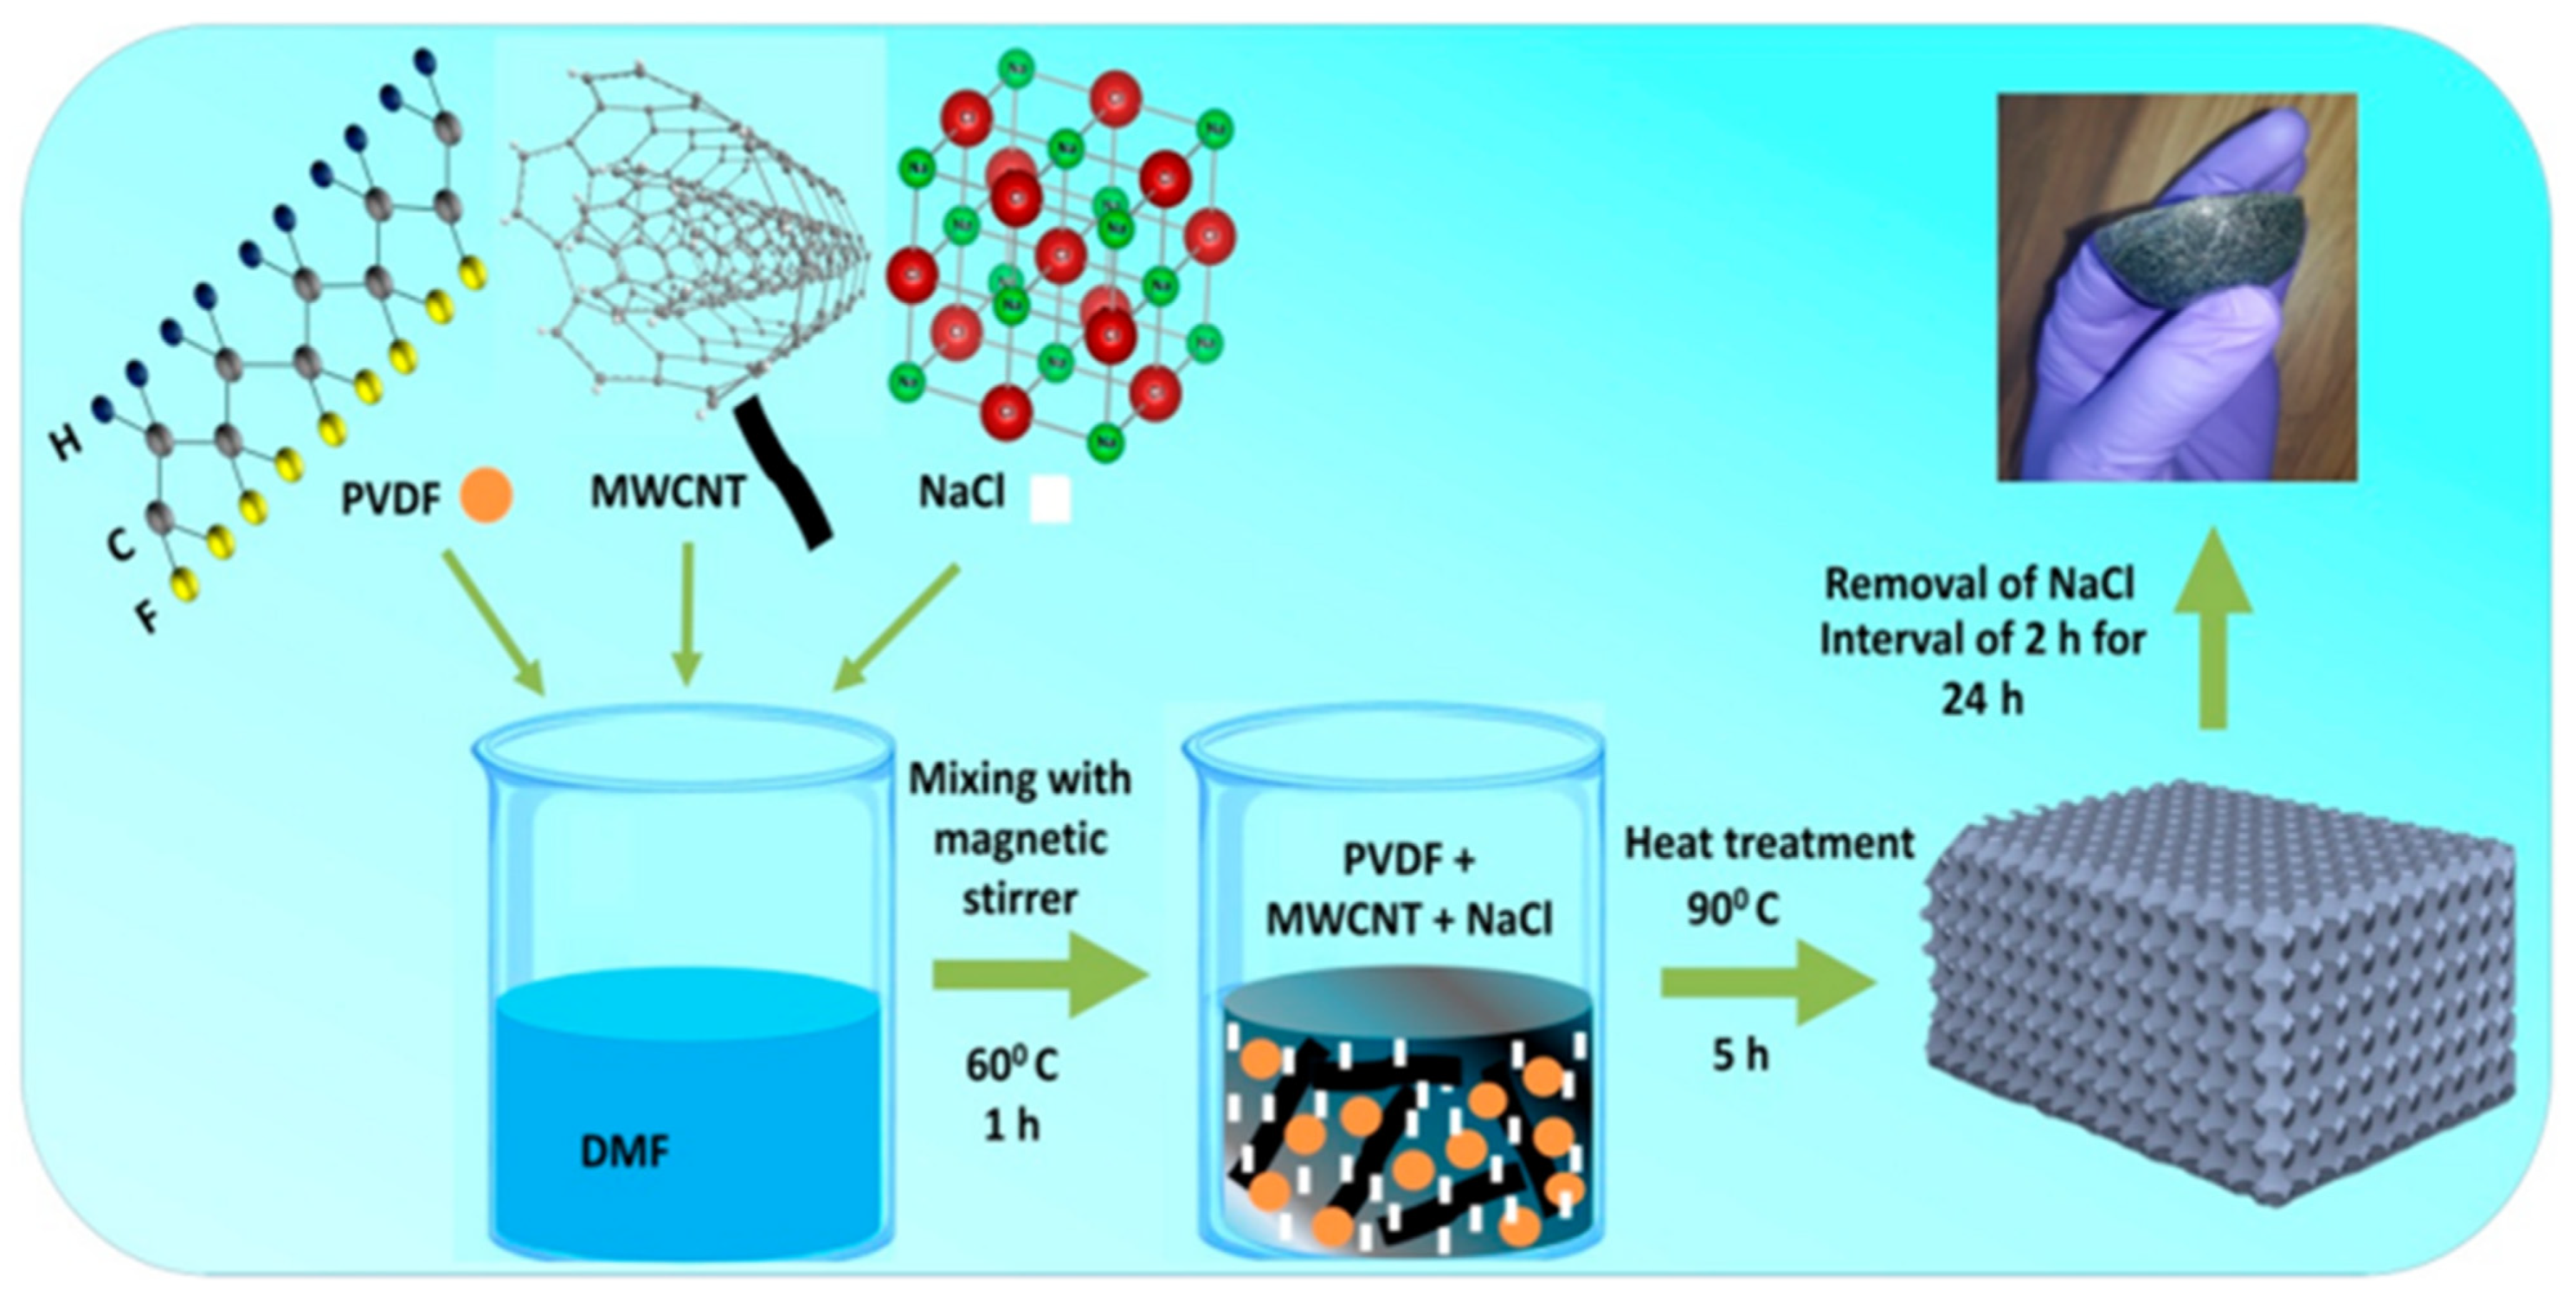
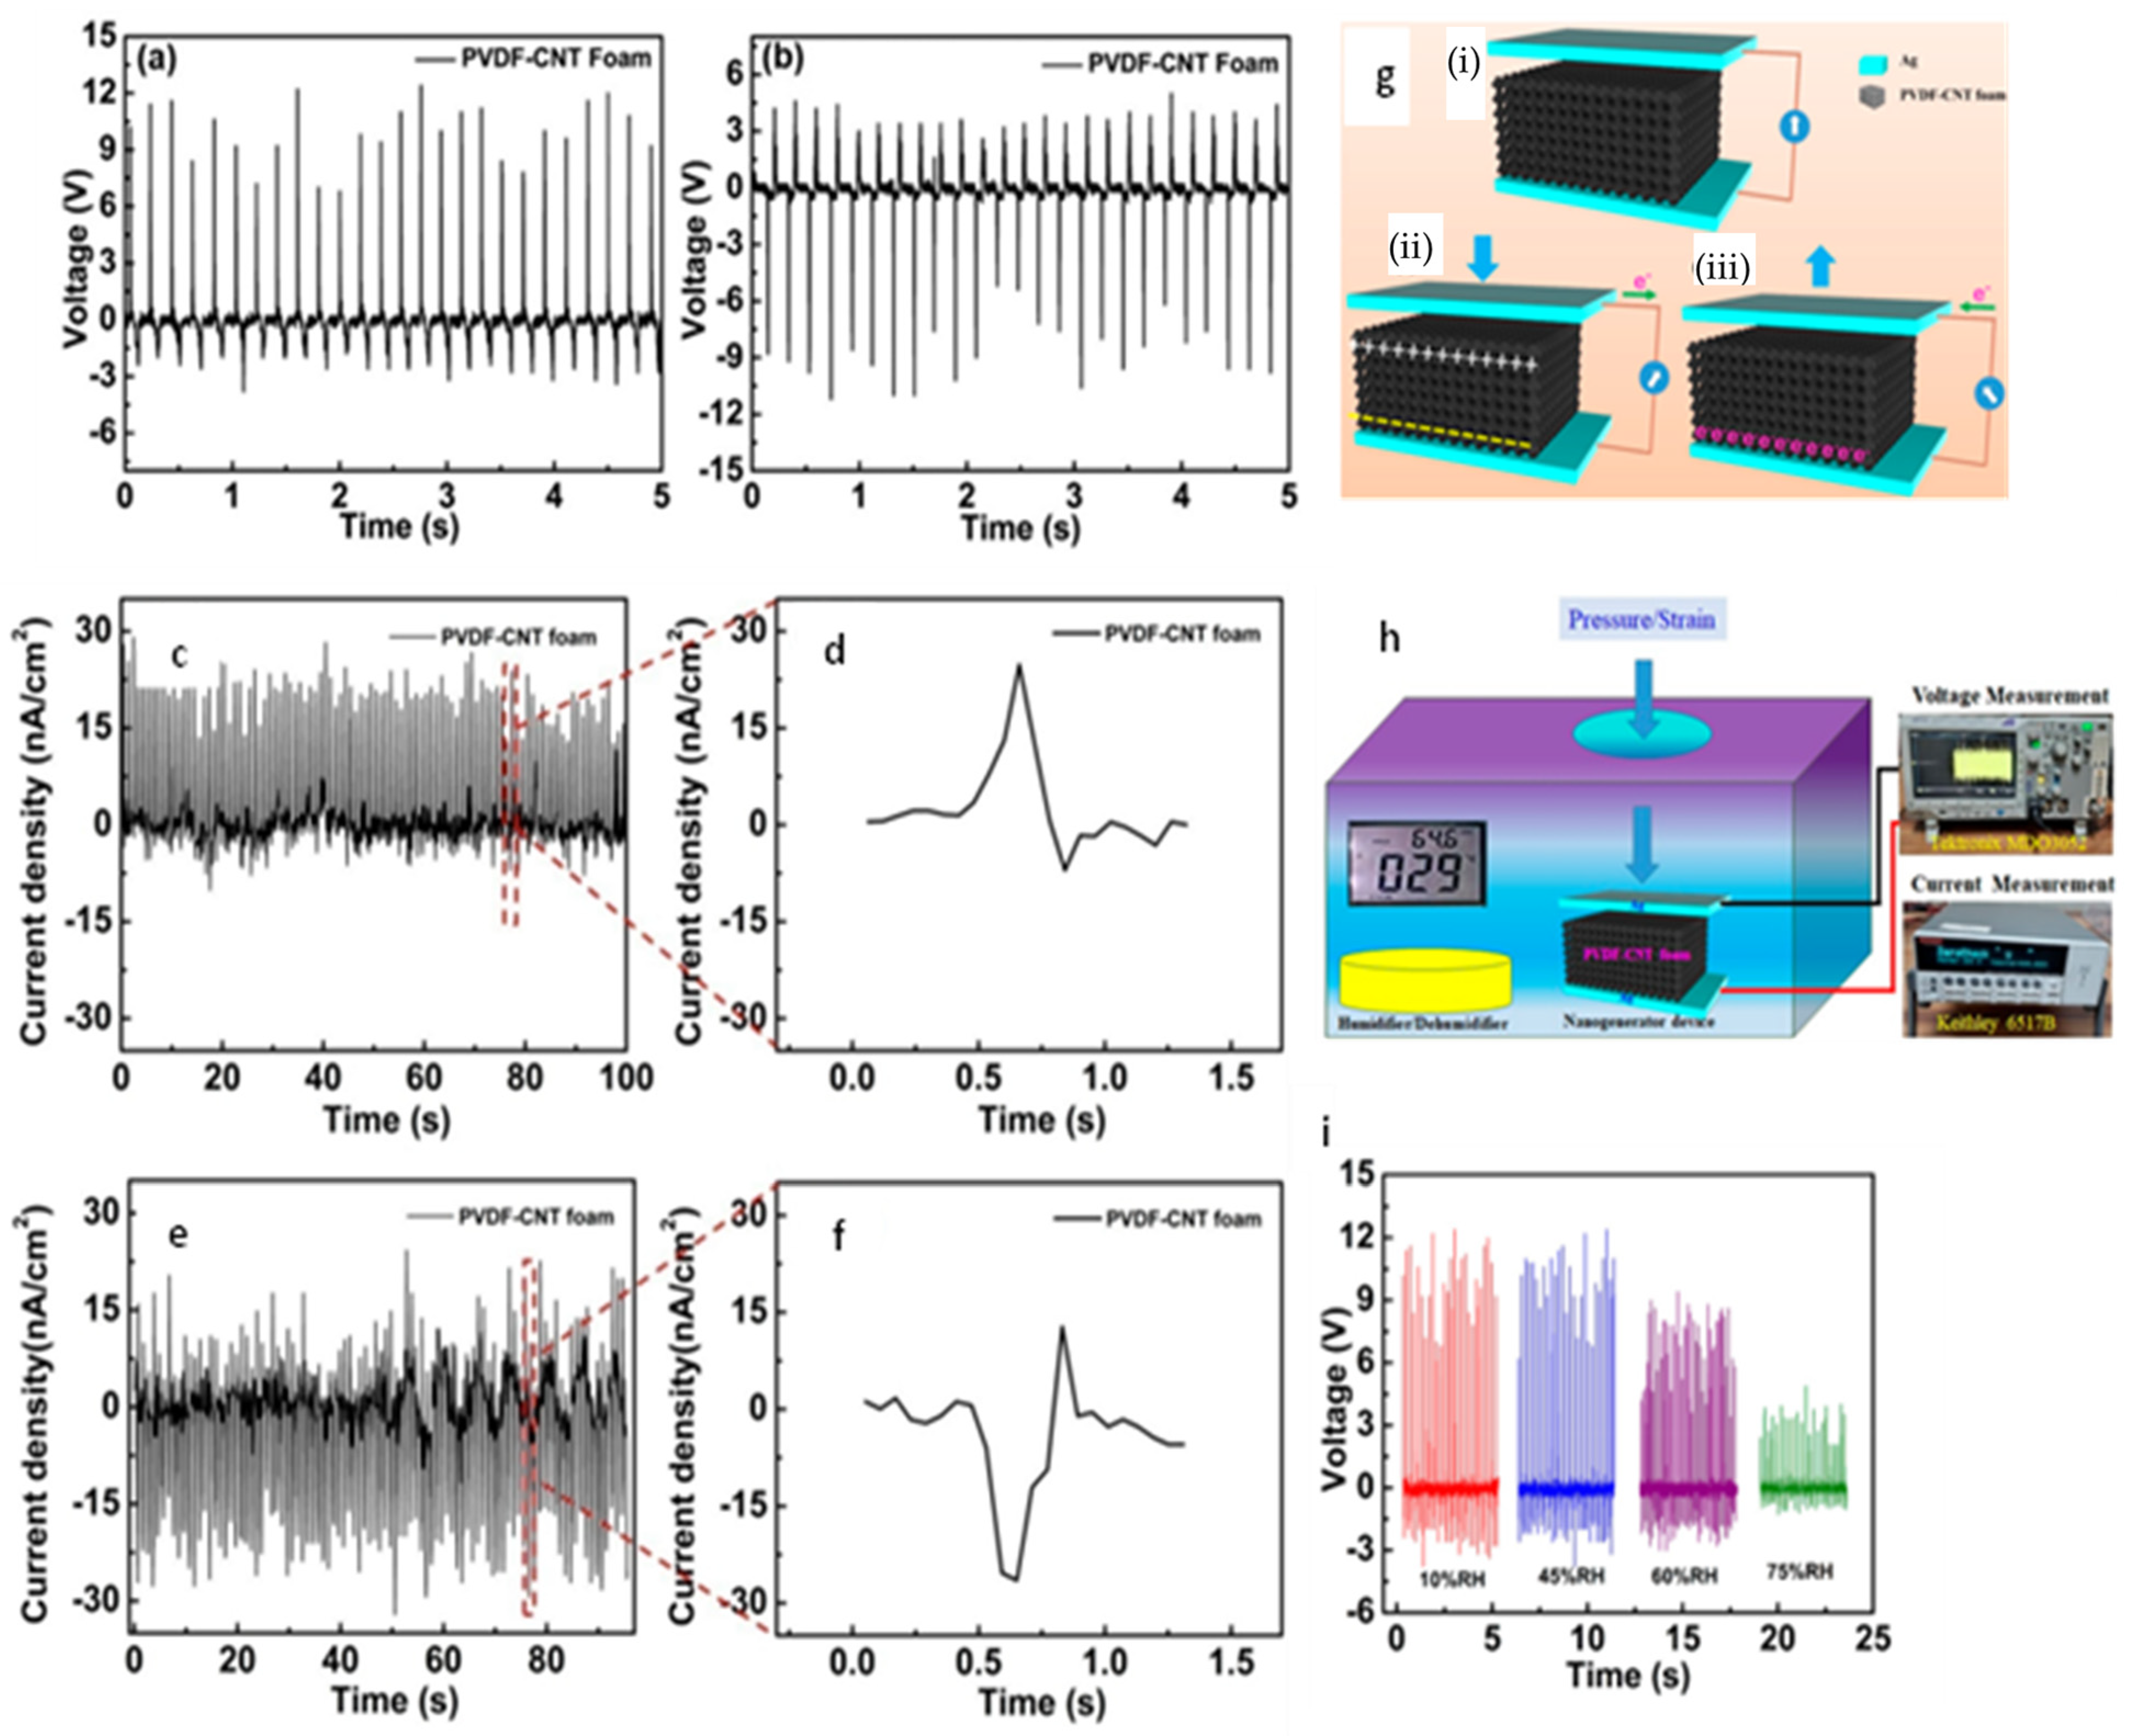
3.4. Nanoparticles
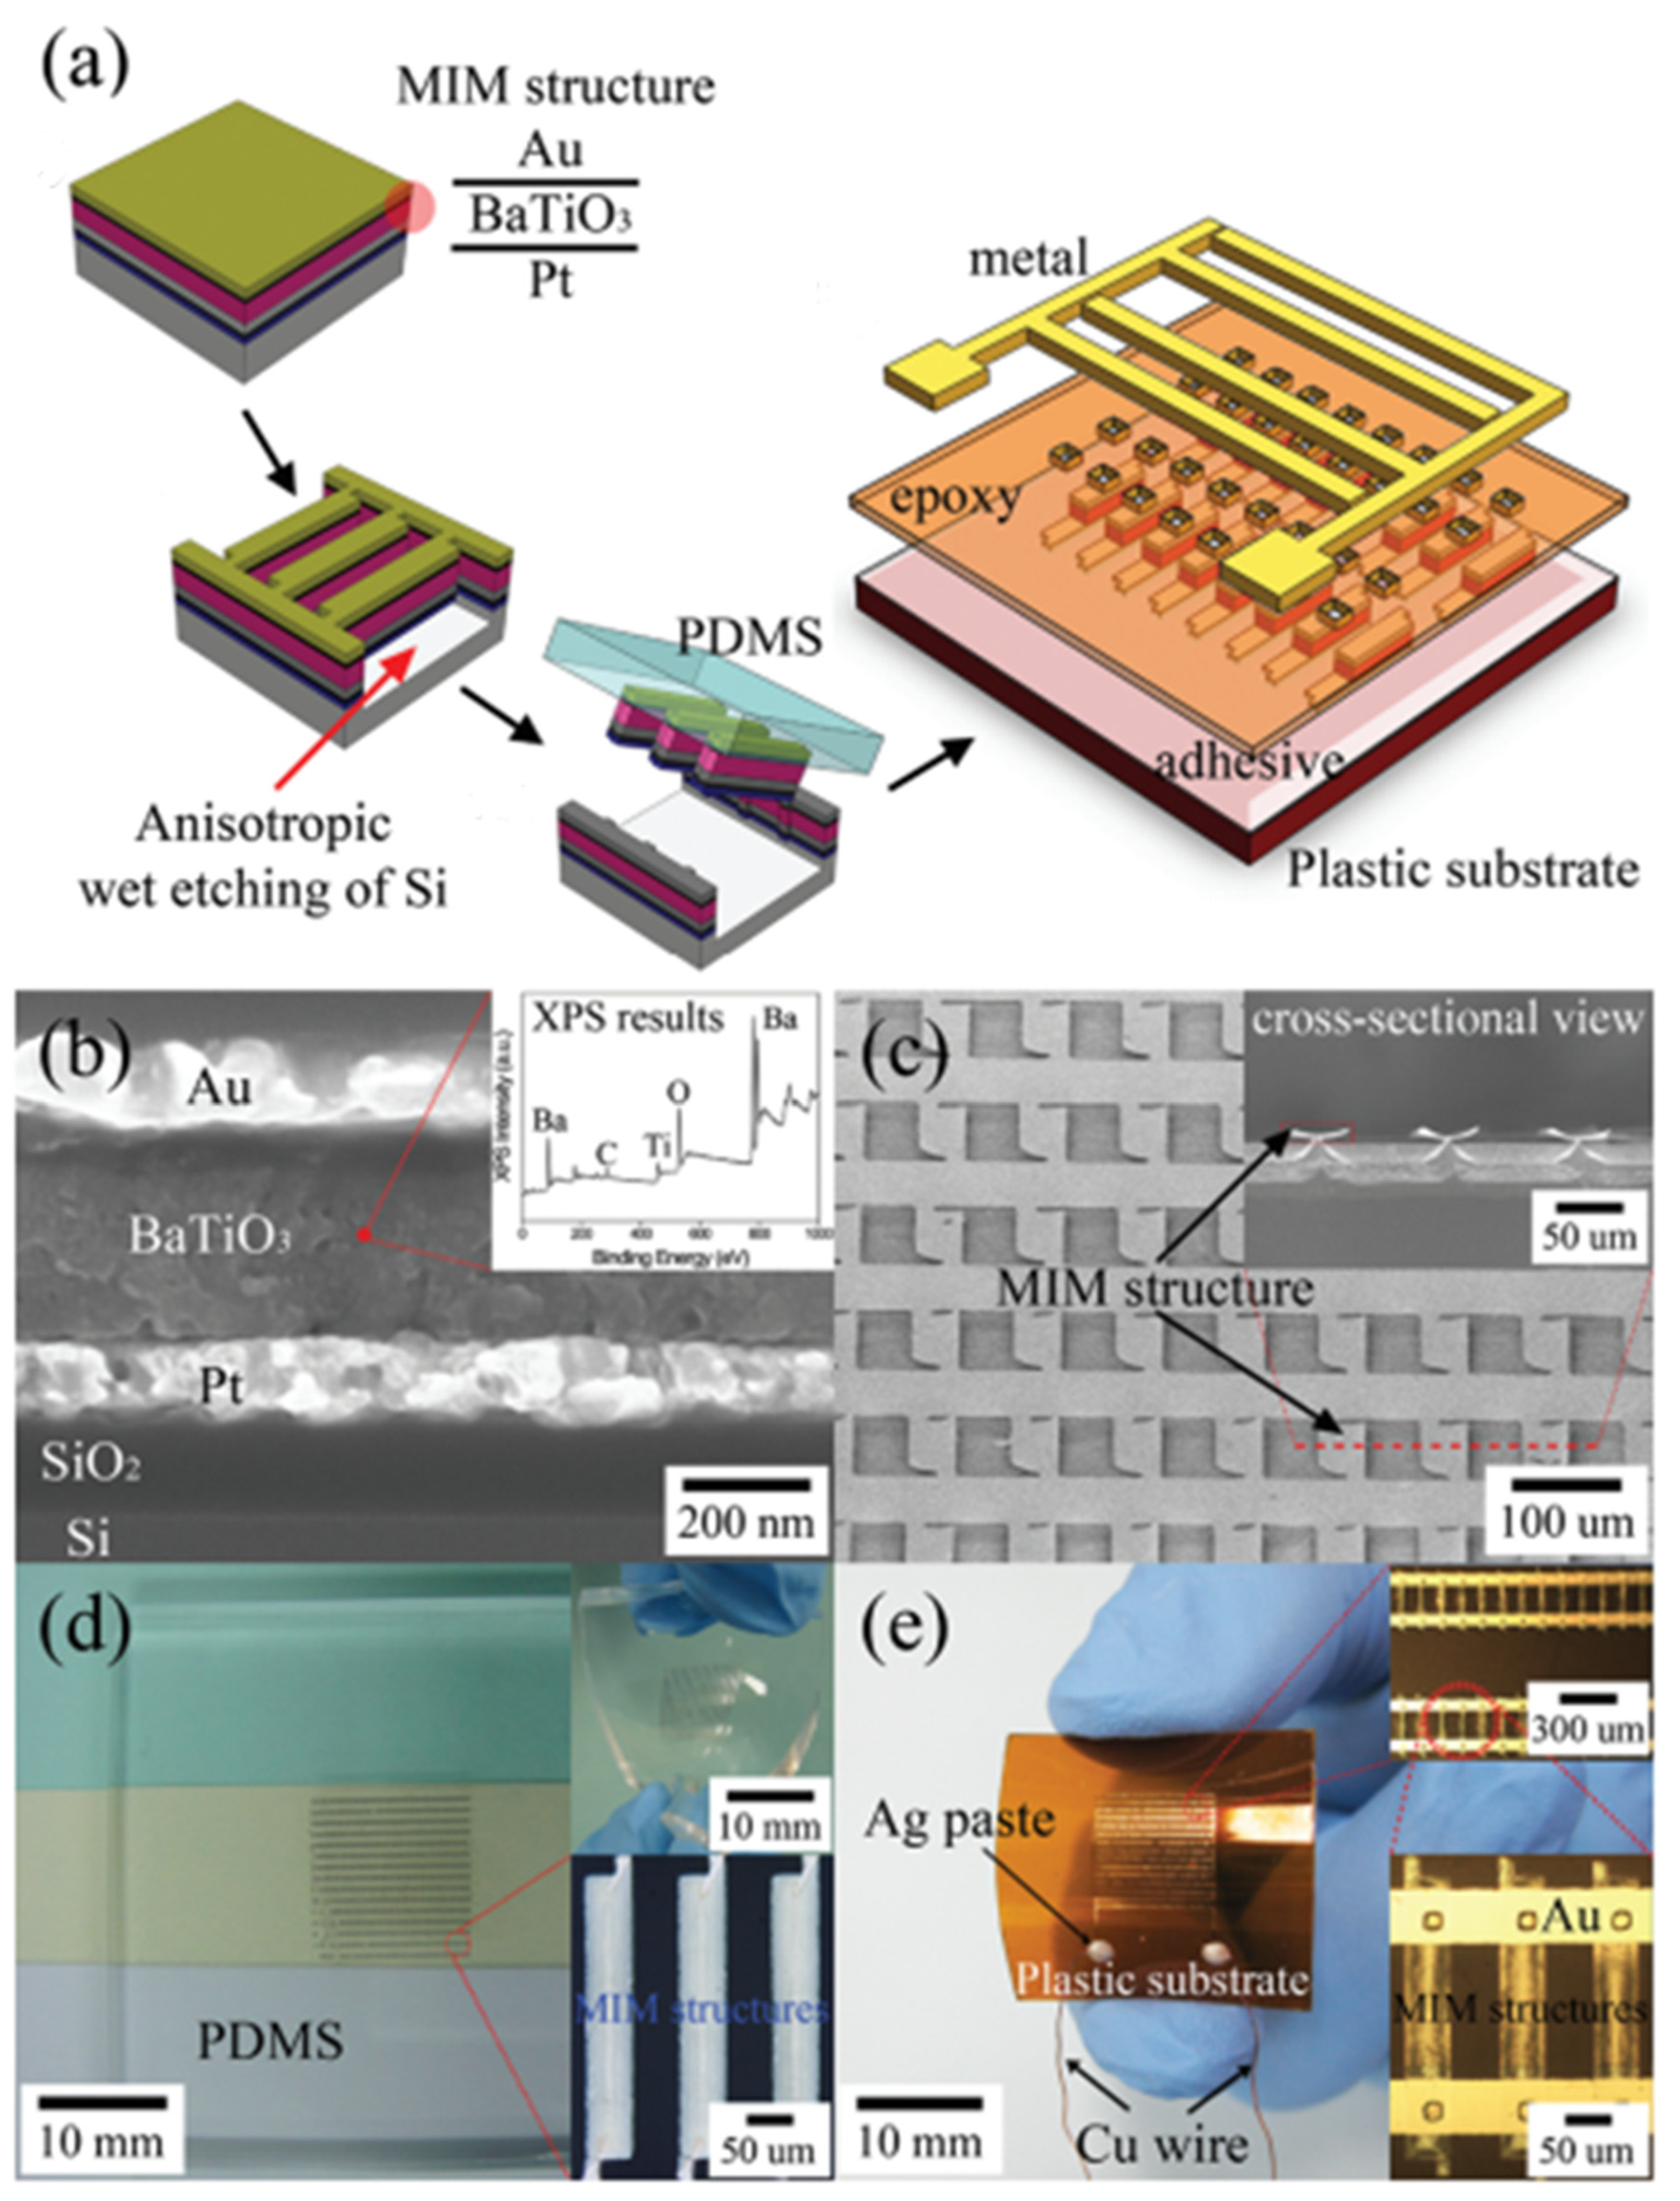
3.5. Thin Films

| Author | Accomplishments | Subdivisions | Highlights | Conclusion | References |
|---|---|---|---|---|---|
| Uchino | Considering the energy conversion efficiency, the PHE’s output power, the coupling coefficient, and the operating mode, including a mathematical model to match the PHE’s resonant frequency to the driving frequency, was reported | Piezoelectric materials and their selection criteria, thin PEH, energy conversion efficiency, mathematical modeling of PEH, piezoelectric basins, improved piezoelectric cantilever design, electrode optimization, PEH electronic interfaces and power storage circuit, power quantification and comparison strategies, hybrid energy harvesting mechanism | Explanation of the background of PEH, condemnation of various researchers’ misconceptions, a thorough examination of the energy flow in the energy harvesting system, a description of the methods for greatly enhancing efficiency, and helpful/significant comment regarding harvester output that is not useful | Importance of storage circuits and electric interface circuits | [83] |
| Priya | Considering the energy conversion efficiency, the PEH’s output power, the coupling coefficient, and the operating mode, including a mathematical model to match the PEH’s resonant frequency to the driving frequency, was reported | Piezoelectric materials and their selection criteria, thin PEH, energy conversion efficiency, mathematical modeling of PEH, power storage circuits of PEH, and electronic interfaces | Explains the criteria for choosing materials in on- and off-resonance situations. Explanation of the variables influencing PEH conversion efficiency. A number of low-profile PEHs are being used to create self-powered sensor nodes | Improvement of the material properties and material selection strategy | [84] |
| Yang et al. | Report the operating mode, coupling coefficient, and the mathematical model used to align the PEH’s resonant frequency with the drive frequency for energy conversion efficiency | Nonlinear systems, mathematical modeling of PEHs, geometric optimization, improved piezoelectric cantilever design, piezoelectric stack configurations, piezoelectric basins, electrode optimization, comparative strategies, and power quantification | Evaluation of different designs, nonlinear approaches, optimization techniques, and materials to increase performance. Introducing the set of indicators to compare PEH performance | Importance of storage circuits and electric interface circuits | [85] |
| Li et al. | Considering the energy conversion efficiency, the PEH’s output power, the coupling coefficient, and the operating mode, including a mathematical model to match the PEH’s resonant frequency to the driving frequency, were reported. | Manual frequency tuning, frequency up-conversion approach, piezoelectric material and its selection criteria, mathematical modeling of PEH, improved piezoelectric cantilever design, piezoelectric basin, piezoelectric stack configuration, electronic interface, and power storage circuit for PEH | A discussion of the main challenges of PEHs and an explanation of the main limitations of piezoelectric materials | Importance of storage circuits and electric interface circuits | [60] |
| Talib et al. | A discussion of the main challenges of PEHs and an explanation of the main limitations of piezoelectric materials | Nonlinear systems, two-way and three-way systems, geometric optimization, design improvements for piezoelectric cantilevers, hybrid energy harvesting mechanisms, piezoelectric materials and their selection criteria | Finding a balance between the bandwidth and the output power will enable piezo harvesters to perform as expected | Importance of storage circuits and electric interface circuits | [86] |
| Ibrahim and Wahied | Report on the power output of PEH, including a mathematical model that matches the resonance frequency to the driving frequency | Manual frequency adjustment, autonomous frequency adjustment, mathematical modeling of PEH | Review, comparison, and classification of several autonomous and manual tuning methods. Addressing the challenges of energy consumption | Importance of storage circuits and electric interface circuits | [87] |
| Liu et al. | Considering the energy conversion efficiency, the PEH output power, the coupling factor and the mode of operation. This includes a mathematical model to match the PEH’s resonant frequency to the driving frequency that was reported | Multi-frequency systems, frequency up-conversion approaches, non-linear systems, bi-directional and tri-directional systems, mathematical modeling of PEHs, piezoelectric materials and their selection criteria, improved piezoelectric cantilever design, piezoelectric stack configurations, piezoelectric basins, hybrid energy harvesting | Describes various important aspects of improving the overall performance of PEH devices. Classification of performance improvement approaches | Increasing endurance and lifetime of PEHs and their manufacturability, size reduction, and packaging | [64] |
| Yildirim et al. | Report of PEH output power, including mathematical model to match PEH resonance frequency to driving frequency | Manual frequency tuning, multi-frequency system, autonomous frequency tuning, non-linear system, floating mass system, frequency up-conversion approach, bi-directional and three-way systems | A new taxonomy of performance-enhancing techniques. Comparison of many performance-enhancing techniques | Increasing the PEHs’ frequency tuning and bandwidth | [88] |
| Maamer et al. | PEH output power report with a mathematical model that matches the PEH resonance frequency to the driving frequency and accounts for the energy conversion efficiency | Manual frequency tuning, multi-frequency systems, autonomous frequency tuning, non-linear systems, free moving mass systems, frequency up conversion approaches, piezoelectric materials and their selection criteria, two-way and three-way systems | A proposal for a new general classification using approaches based on aspects of harvester improvement, such as techniques for extending operating frequencies, design of non-resonant systems, and multi-directional harvesters. Evaluation of applicability and compatibility with MEMS technology of performance improvement technology under various conditions | Increasing the PEHs’ frequency tuning and bandwidth | [89] |
| Piezoelectric Materials | Const. Strain (S) | Const. Stress (T) | Charge Constant (d15 pC/N) | Charge Constant (d31 C/N) | Coupling Factor (k33) | Mechanical Quality Factor (Q) | SE11 (p/Pa) | SE33 (p/Pa) | Voltage Constant (g31 10−3 Vm/N) | Curie Temperature (°C) | References |
|---|---|---|---|---|---|---|---|---|---|---|---|
| PZT-4H | 635 | 1300 | 495 | −1.23 × 10⁻¹² | 289 | 500 | 12.3 | 15.5 | - | 328 | [90] |
| PZT-5H | 1470 | 340 | 741 | −274 × 10−12 | 593 | 65 | 16.4 | 20.8 | - | 193 | [90] |
| α-quartz | 4.63 | 4.63 | - | - | - | 105–106 | 12.8 | 9.72 | - | - | [91] |
| BaTiO3 | 910 | 1200 | 242 | −158 × 10−12 | 149 | 400 | 8.6 | 9.1 | - | 115 | [49,90] |
| PMN-PT | 680 | 8200 | 146 | −1320 × 10−12 | 2820 | 43–2050 | 69 | 119.6 | - | - | [49,92,93] |
| PVDF | 5–13 | 7.20 | −27 | 21 × 10−12 | −33 | 3–10 | 365 | 742 | - | 100 | [94,95] |
| LiNbO3 | 27.9 | 28.7 | 69 | −1.0 × 10⁻¹² | 6 | 106 | 5.83 | 5.02 | - | - | [91,96] |
| ZnO | 8.84 | 11.0 | −8.3 | −5.0 × 10⁻¹² | 12.4 | 1770 | 7.86 | 6.94 | - | - | [90,91,93,96,97,98] |
| AIN | 10 | 11.9 | 3.2 | −2 × 10⁻¹² | 5 | 2800 | 2.85 | 2.824 | - | - | [93,95,99,100] |
| GaN | 11.2 | - | 3.1 | −1.9 × 10⁻¹² | 3.7 | 2800 | 3.23 | 2.91 | - | - | [95,100,101,102] |
| CdS | 9.53 | 10.33 | −13.9 | −5.18 × 10⁻¹² | 10.3 | 1000 | 20.69 | 16.97 | - | - | [103] |
| PZT (I) BM 400 | - | - | - | −115 × 10−3 | - | 500 | - | - | −10.5 | 350 | [9,102] |
| PZT (II) BM 500 | - | - | - | −165 × 10−3 | - | 80 | - | - | −11.5 | 360 | [9,102] |
| PZT (III) BM 800 | - | - | - | −80 × 10−3 | - | 1000 | - | - | −10.5 | 325 | [9,103] |
| PZT (VI) BM 532 | - | - | - | −250 × 10−3 | - | 70 | - | - | −7.5 | 210 | [9,103] |
| PZT-5A | - | - | 584 | −171 × 10−12 | 0.71 | 75 | - | - | −11.4 | 365 | [104] |
| PZT-8 | - | - | 330 | −97 × 10−12 | 0.64 | 1000 | - | - | −11 | 300 | [104] |
| PMN-33%PT | - | - | - | −920 × 10−12 | 0.93 | 69 | - | - | −17.1 | 145 | [104] |
| PZN-6%PT | - | - | - | −1400 × 10−12 | 0.9 | - | - | - | 24.3 | 100 | [104] |
4. Applications of Piezoelectric Materials in Analytical Chemistry
4.1. Sorption Detector
4.2. Piezoelectric Crystal Detector for Water
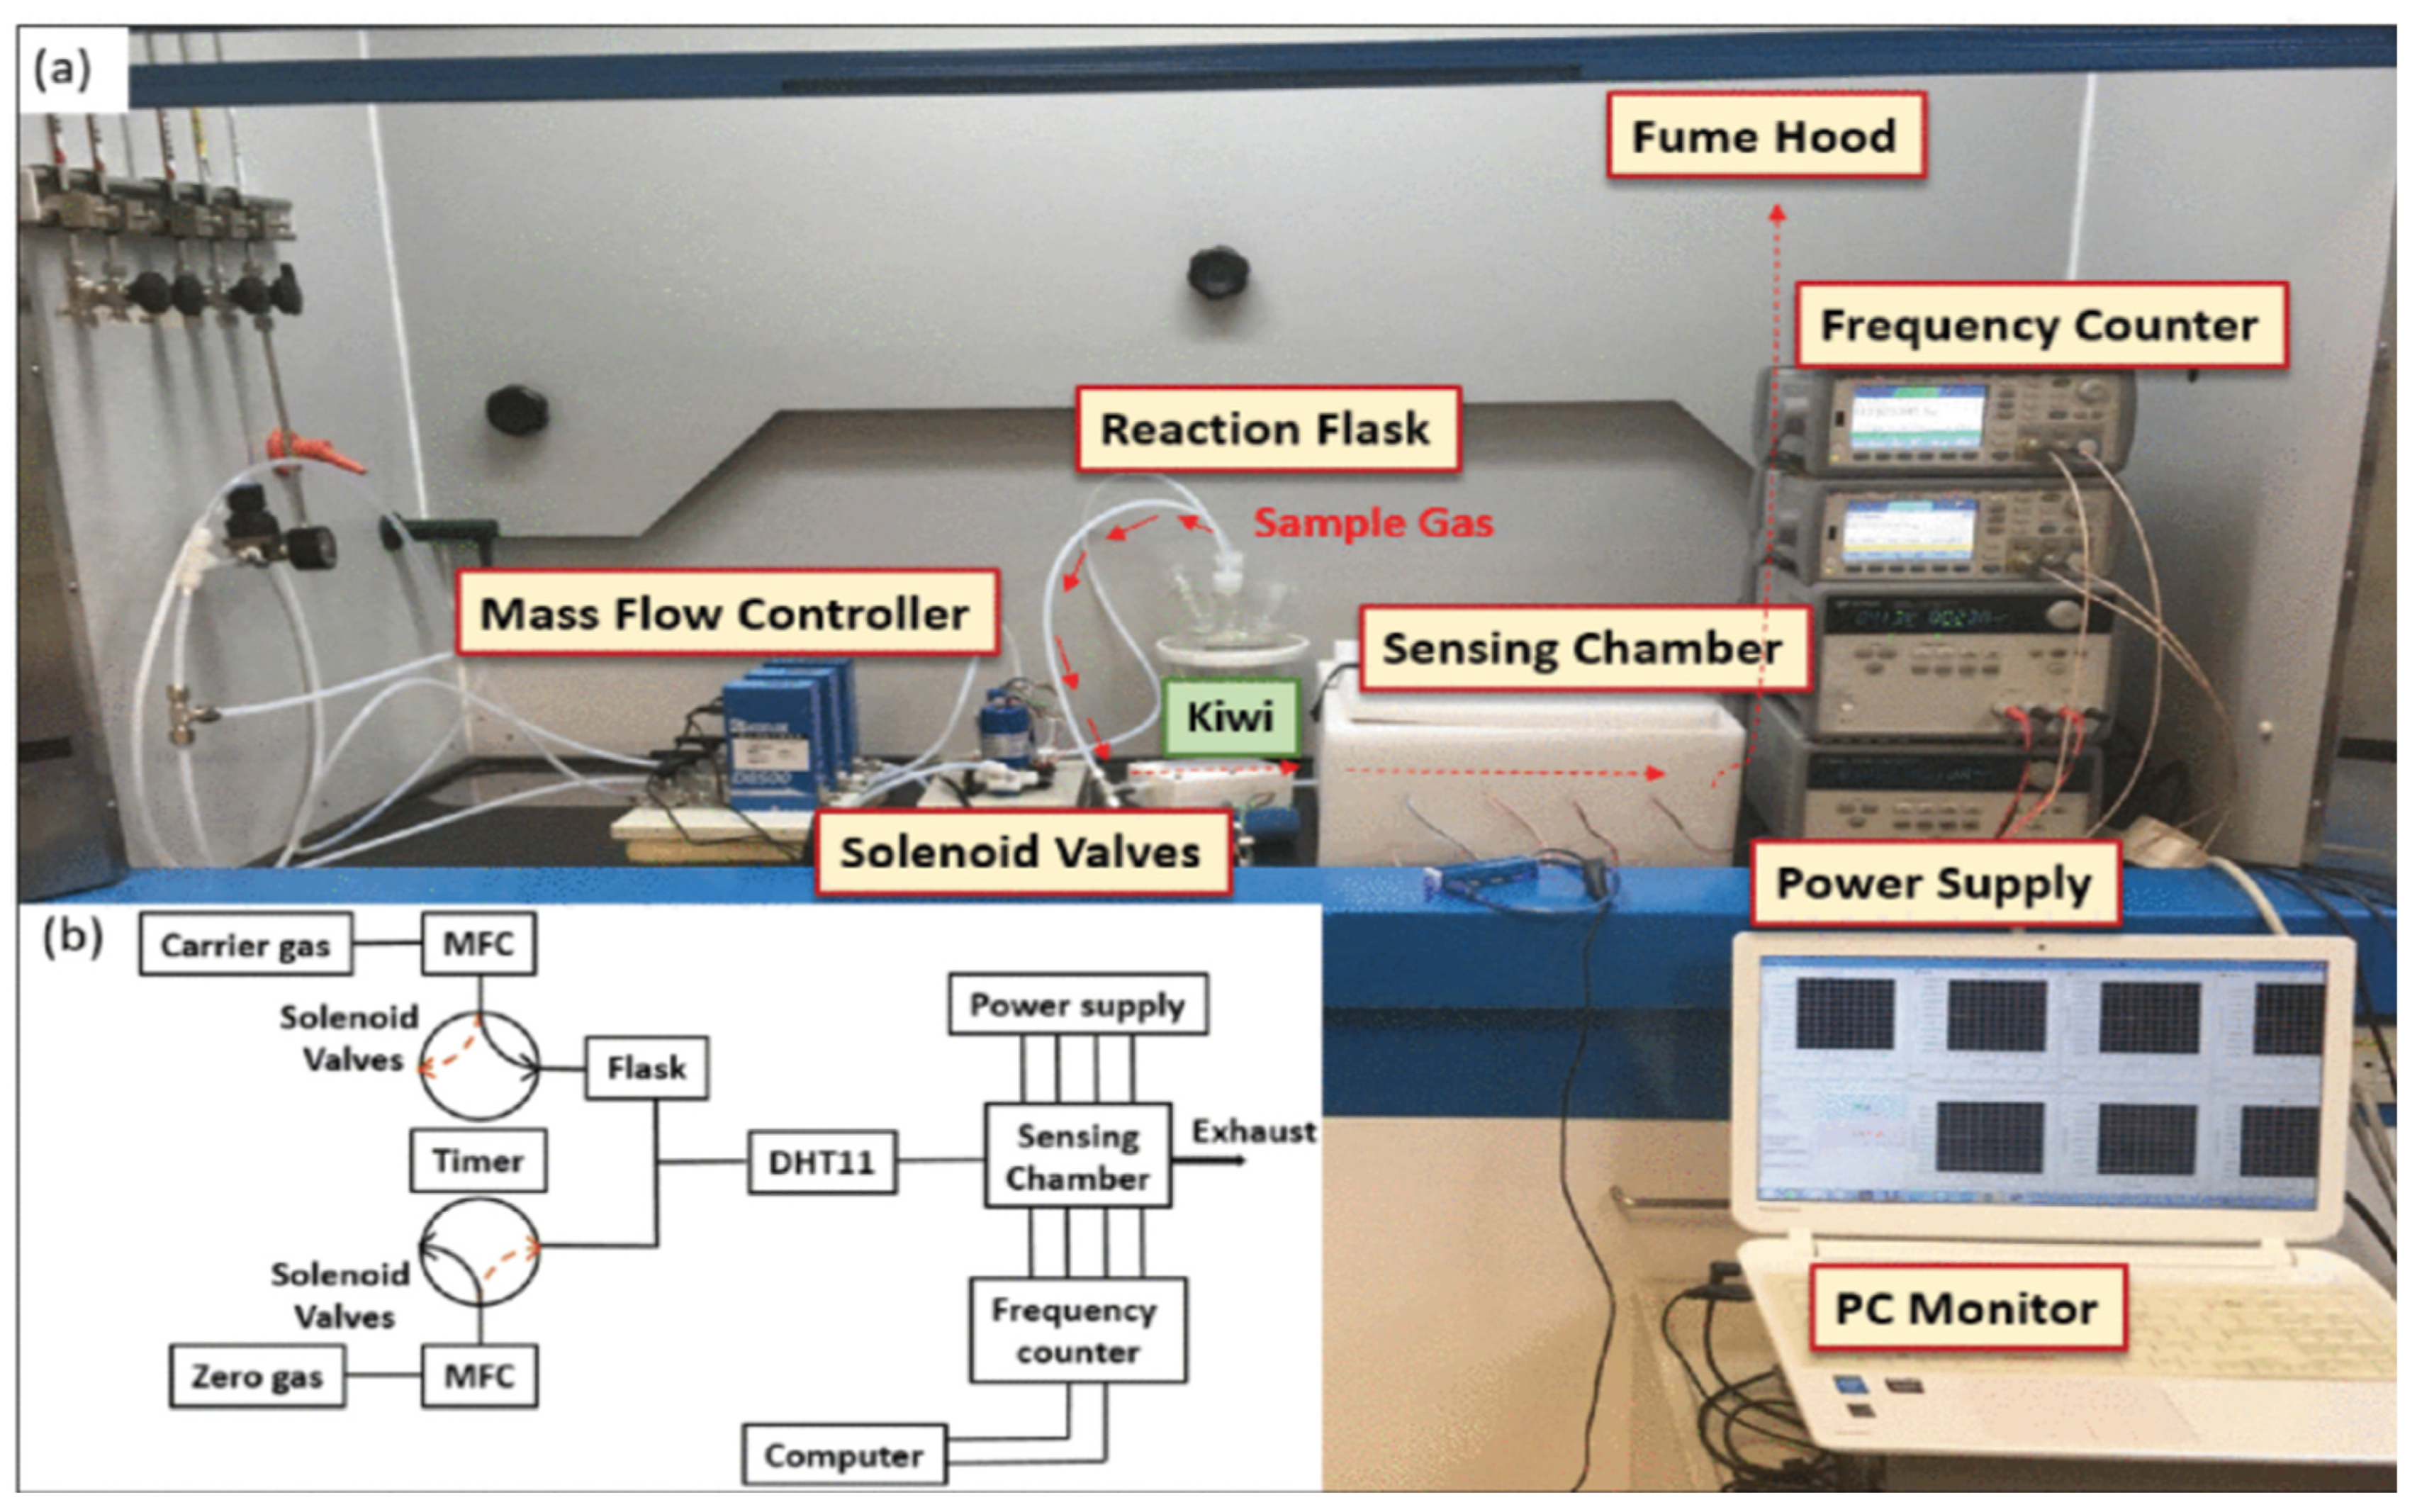
4.3. Detector for Gas Chromatography
| Crystal Coatings | Column Packing | Temperature (°C) | Time (min) | Carrier Gas (mL/min) | Samples | References |
|---|---|---|---|---|---|---|
| Squalane | Carbowax 1540, dinonyl phthalate (DNP) | 62 °C | - | He | n-pentane, n-octane, n-hexane, benzene | [121] |
| Squalane | Squalane | 27 °C | 4 min | He | n-pentane, benzene, n-hexane, n-heptane, n-octane, toluene, o-xylene, ethyl benzene, | [111] |
| 1,2,3-Tris cyano-ethoxy-propane (TRIS) | TRIS | 23 °C | 28 min | He | Benzene, ethyl benzene, toluene, propyl benzene, pentyl benzene, butyl benzene, heptyl benzene, hexyl benzene | [122] |
| OV-17 | 5% of OV-17 on the chromosorb W | 22 °C | 2.5 min | He | n-hexane 35.5 wt. %, n-octane 18.4 wt. %, n-heptane 17.9 wt. %, n-decane 9.5 wt. %, n-nonane 18.7 wt. % | [115] |
| Carbowax 20 M | 10% of carbowax 400 on the chromosorb W | 22 °C | 5.5 min | He | Ethanol, Acetone, n-propanol, cyclohexanone, water | [115] |
| Carbowax 20 M | 10% of carbowax 400 on the chromosorb W | 22 °C | 2 min | He | Breath containing ethyl alcohol and normal breath | [115] |
| Carbowax 20 M | 10% of carbowax 400 on the chromosorb W | 22 °C | 5.5 min | He | Diethyl ketone, acetone, 2-methyl-pent-2-enol, cyclo-hexanone, n-butanol | [115] |
| Carbowax 400 | Carbowax 400 on the chromosorb W | 22 °C | 7 min | Dry air | 40.0% ethanol, 53.4% methanol, 6.6% propanol | [123] |
| OV-17 | 5% of OV-17 on the chromosorb W | 22 °C | 4 min | He | Chloro benzene, benzene, m-dichlorobenzene | [115] |
| Carbowax 400 (about 4 µg) | 5% of carbowax 400 on the chromosorb W | 25 °C | 1 min | Air | SO2 in nitrogen | [116] |
| OV-17 (about 4 µg) | 5% of OV-17 on the chromosorb W | 25 °C | 14 min | Air | benzene, n-hexane, n-octane, n-decane, toluene | [116] |
| Rubber cement | 5% of carbowax 400 on the chromosorb W | 25 °C | - | - | n-decane, n-nonane, dodecane, b-undecane | [116] |
| Carbowax 400 (about 4 µg) | 5% of carbowax 400 on the chromosorb W | 25 °C | 14 min | Air | Propyl-, ethyl-, butyl-, alcohol, amyl- | [116] |
| Carbowax 400 (about 7 µg) | 5% of carbowax 400 on the chromosorb W | 74 °C | - | Air | n-octane, n-hexane, n-dodecane, n-decane | [117] |
| Carbowax 400 (about 7 µg) | 5% of carbowax 400 on the chromosorb W | 40–100 °C | - | N2 | benzene, -n-butanol, -n-decane | [117] |
| Ucon LB550X (about 4 µg) | 5% of Ucon LB550X on the chromosorb W | 25 °C | 8 min | Air | Propyl acetate, ethyl acetate, butyl acetate, hexyl acetate, amyl acetate | [116] |
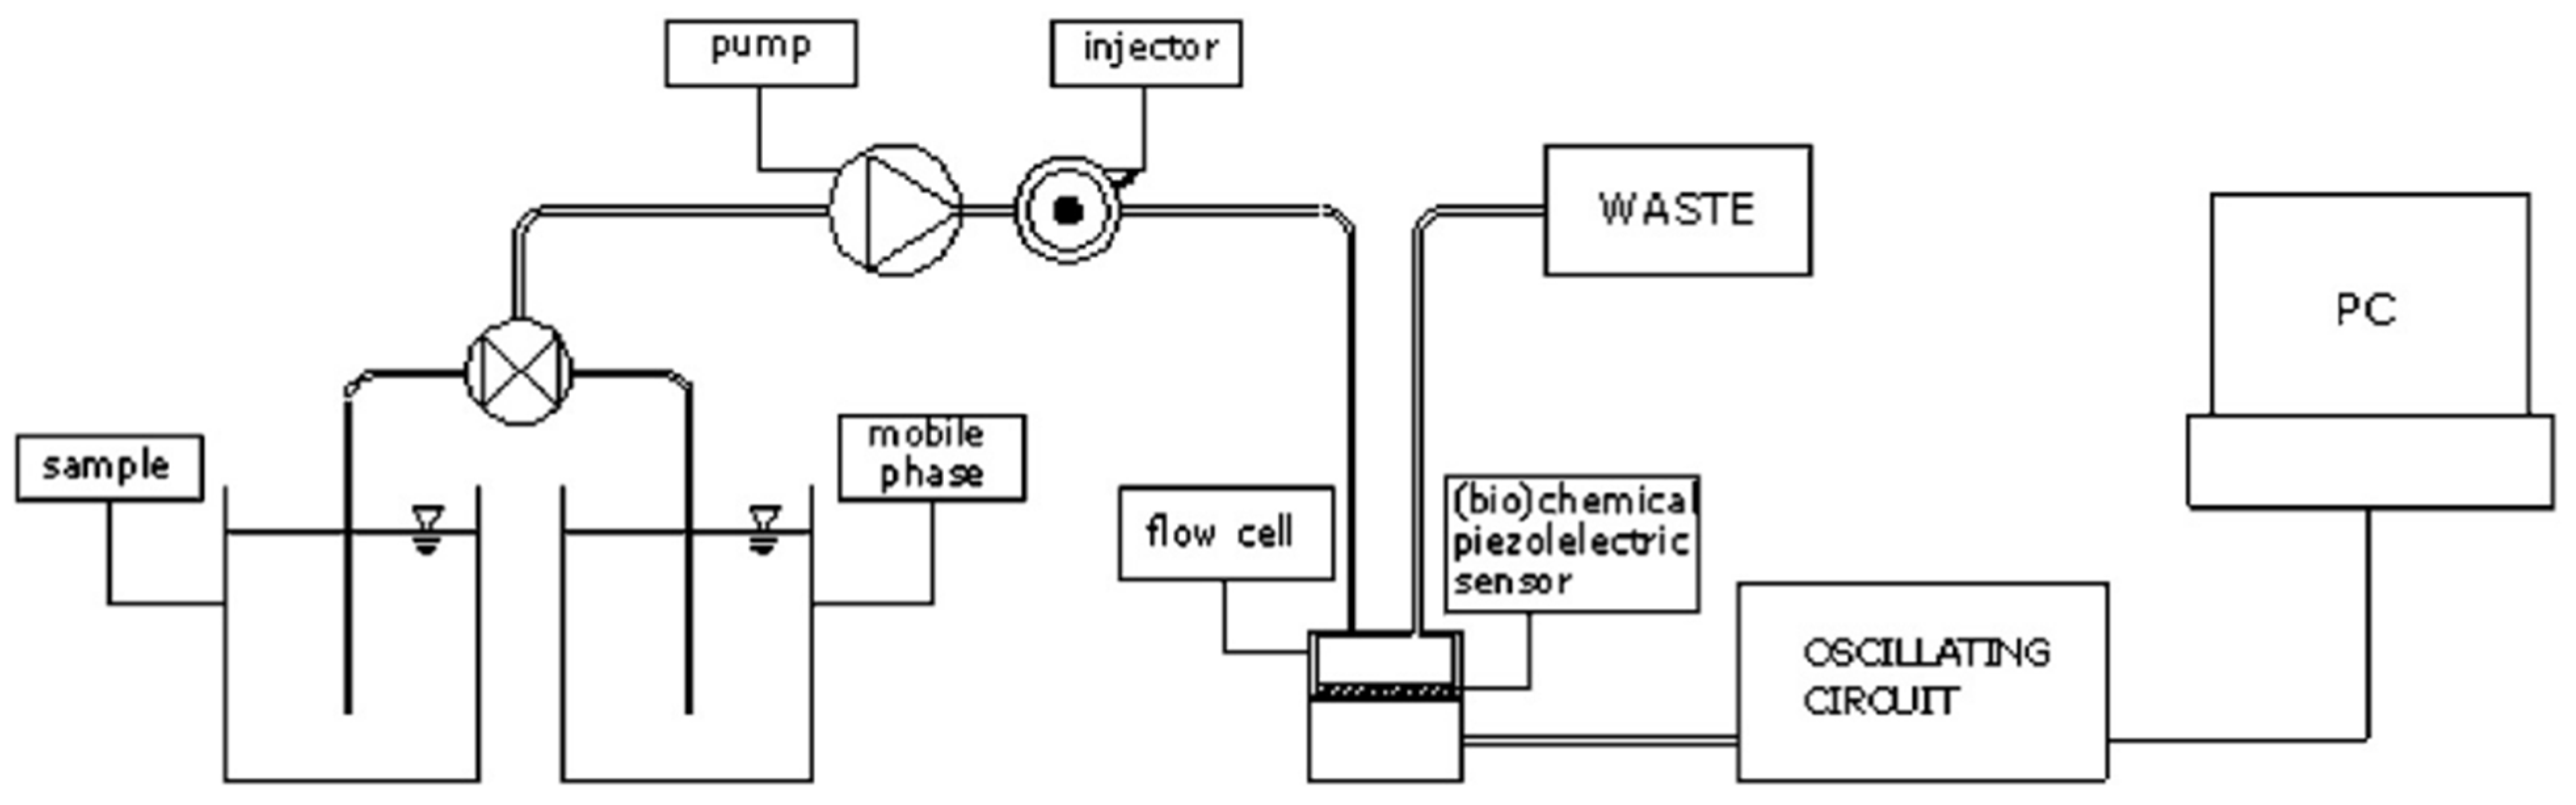
4.4. Detector for Liquid Chromatography
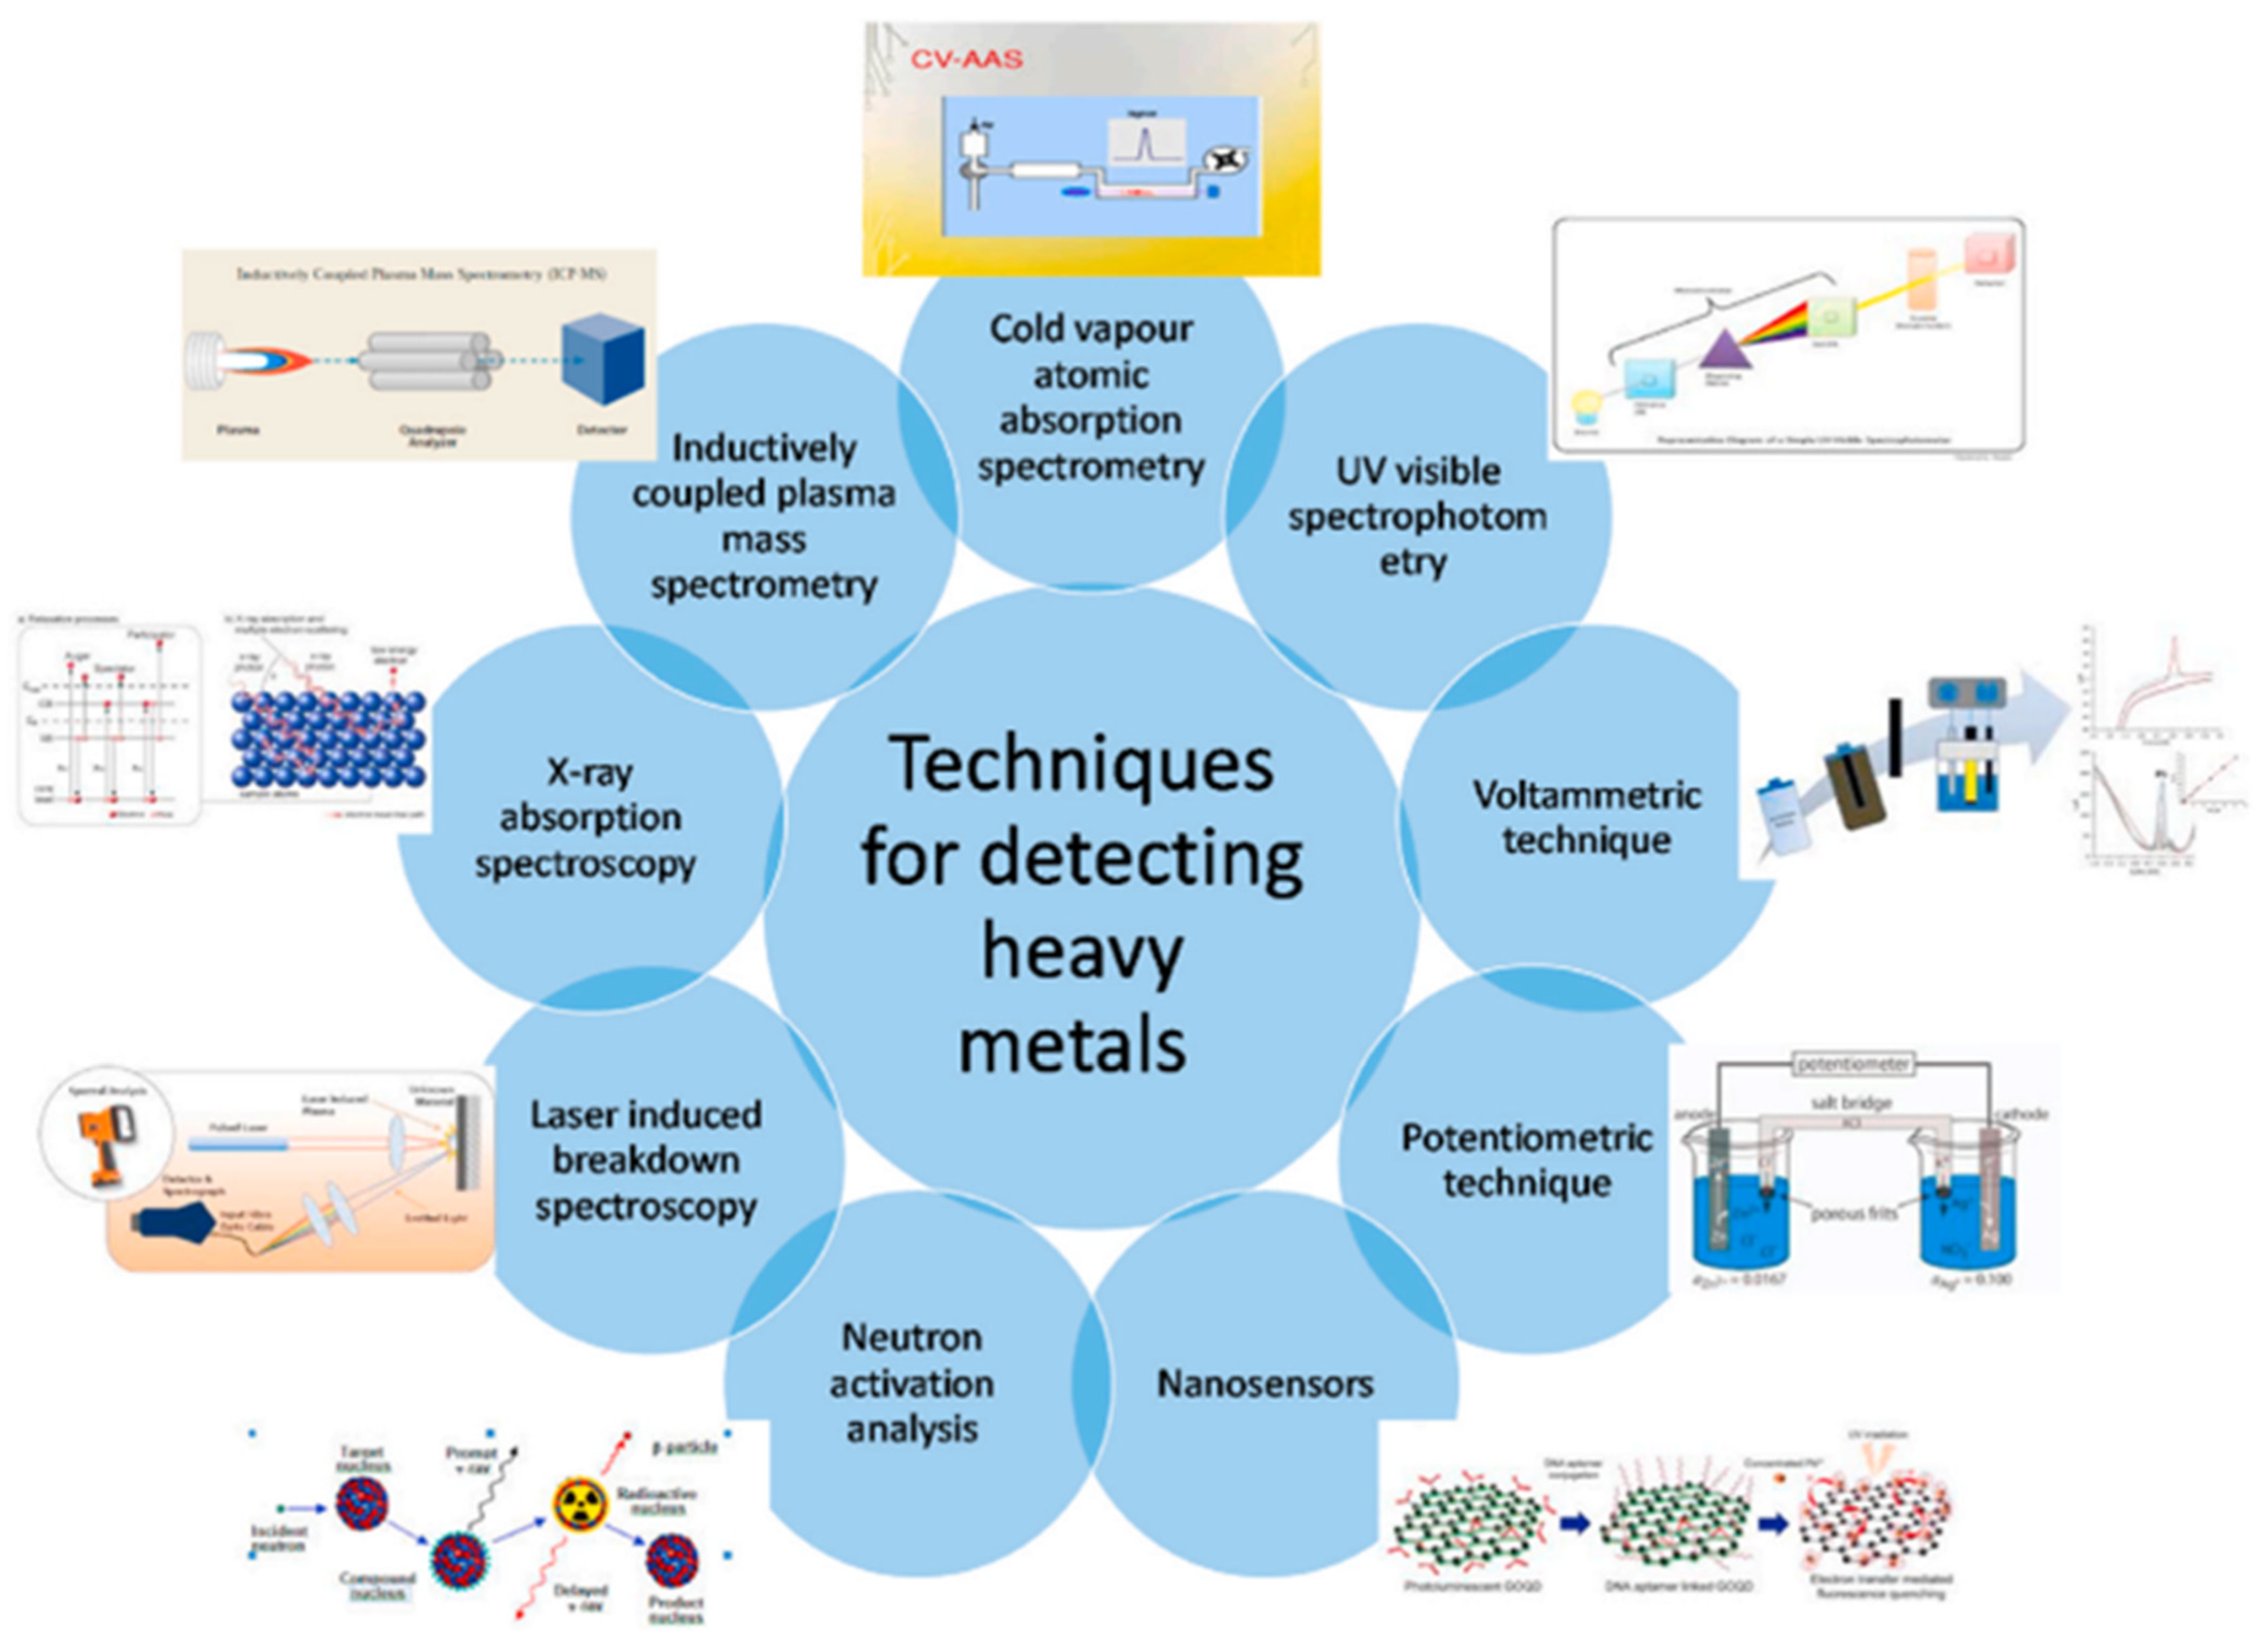
4.5. Trace Metal Analysis
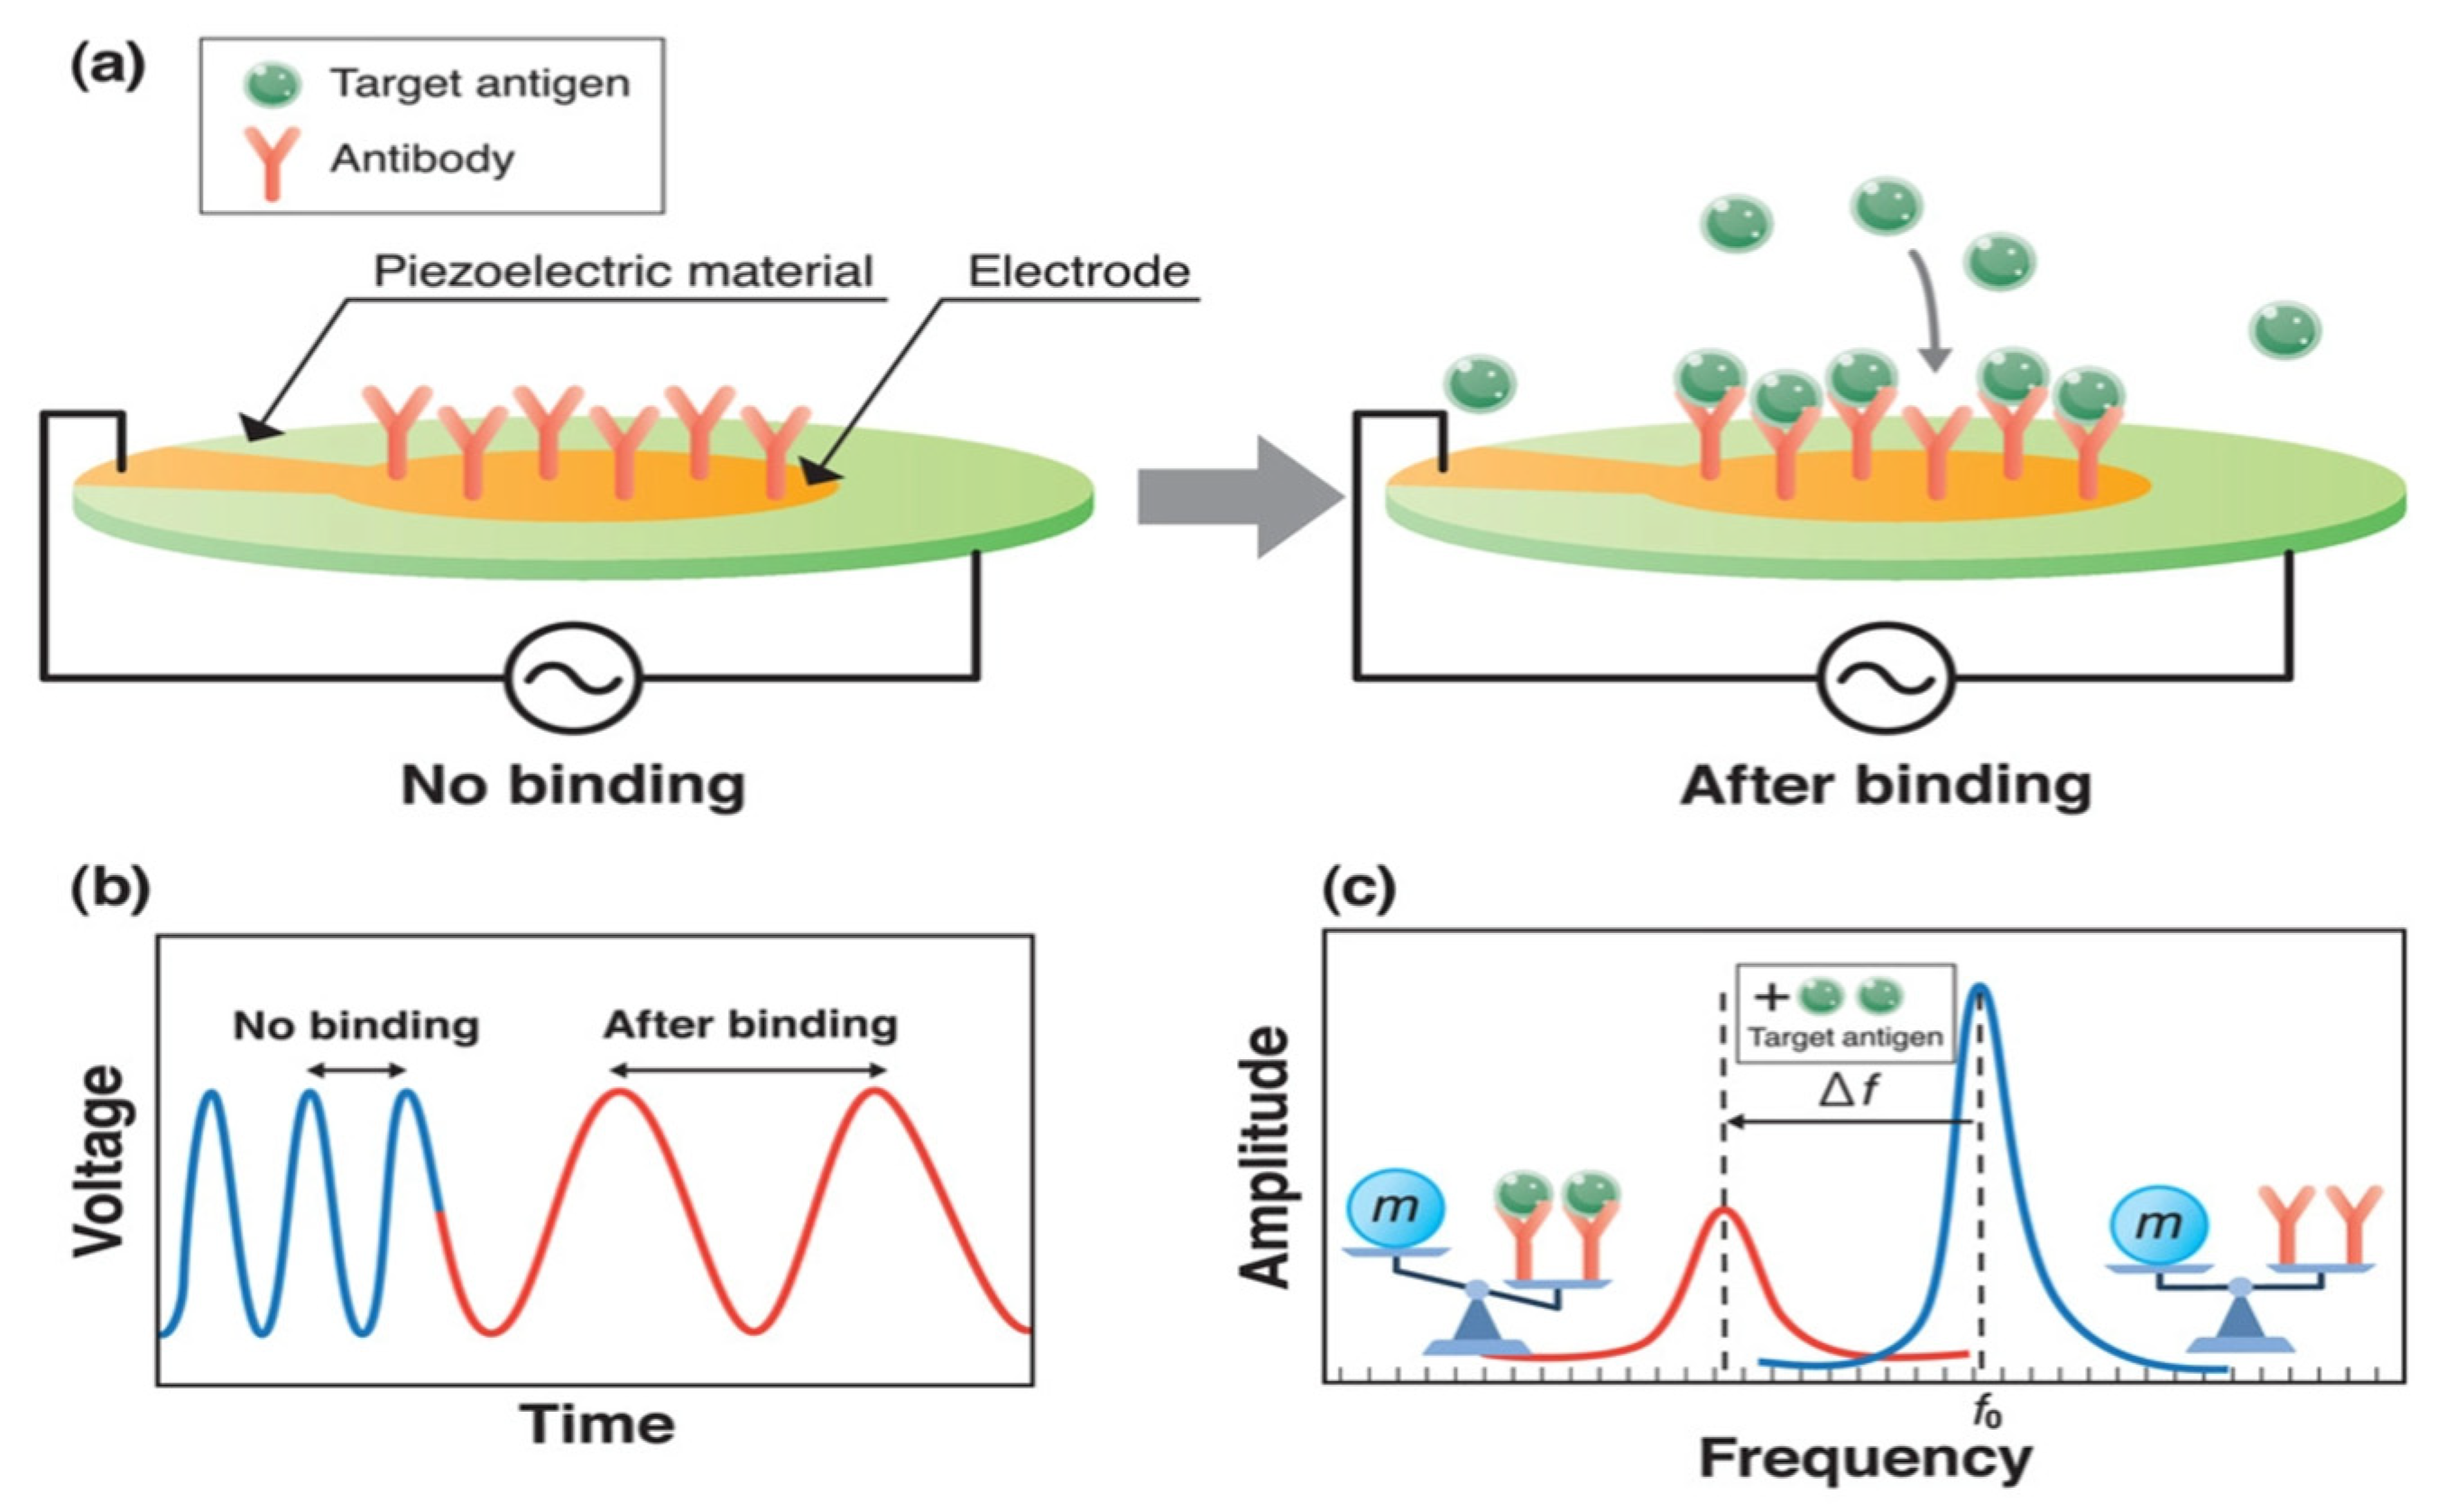
4.6. Detection of Viruses
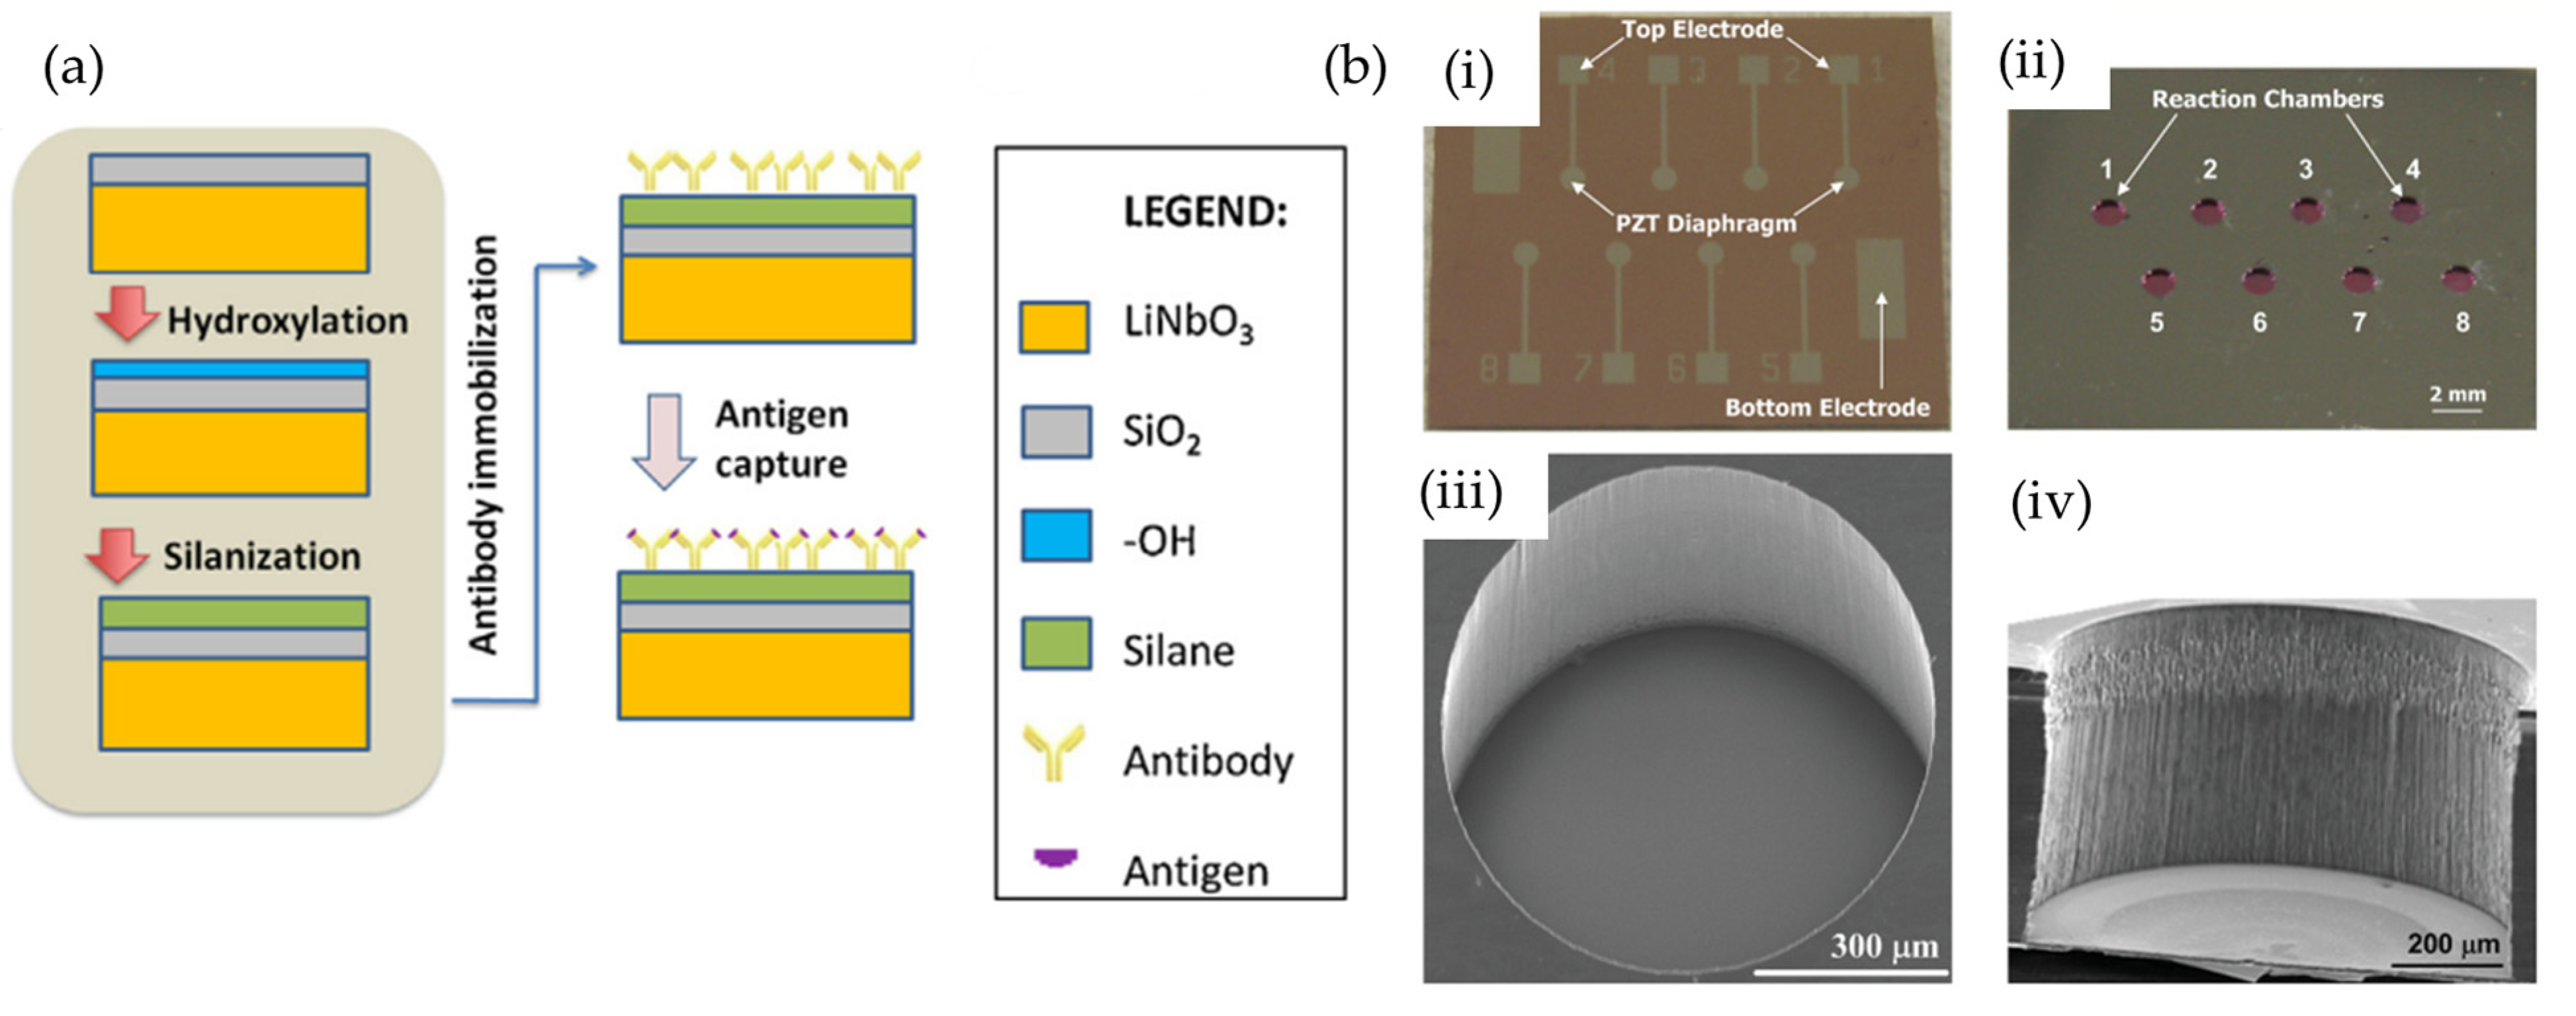
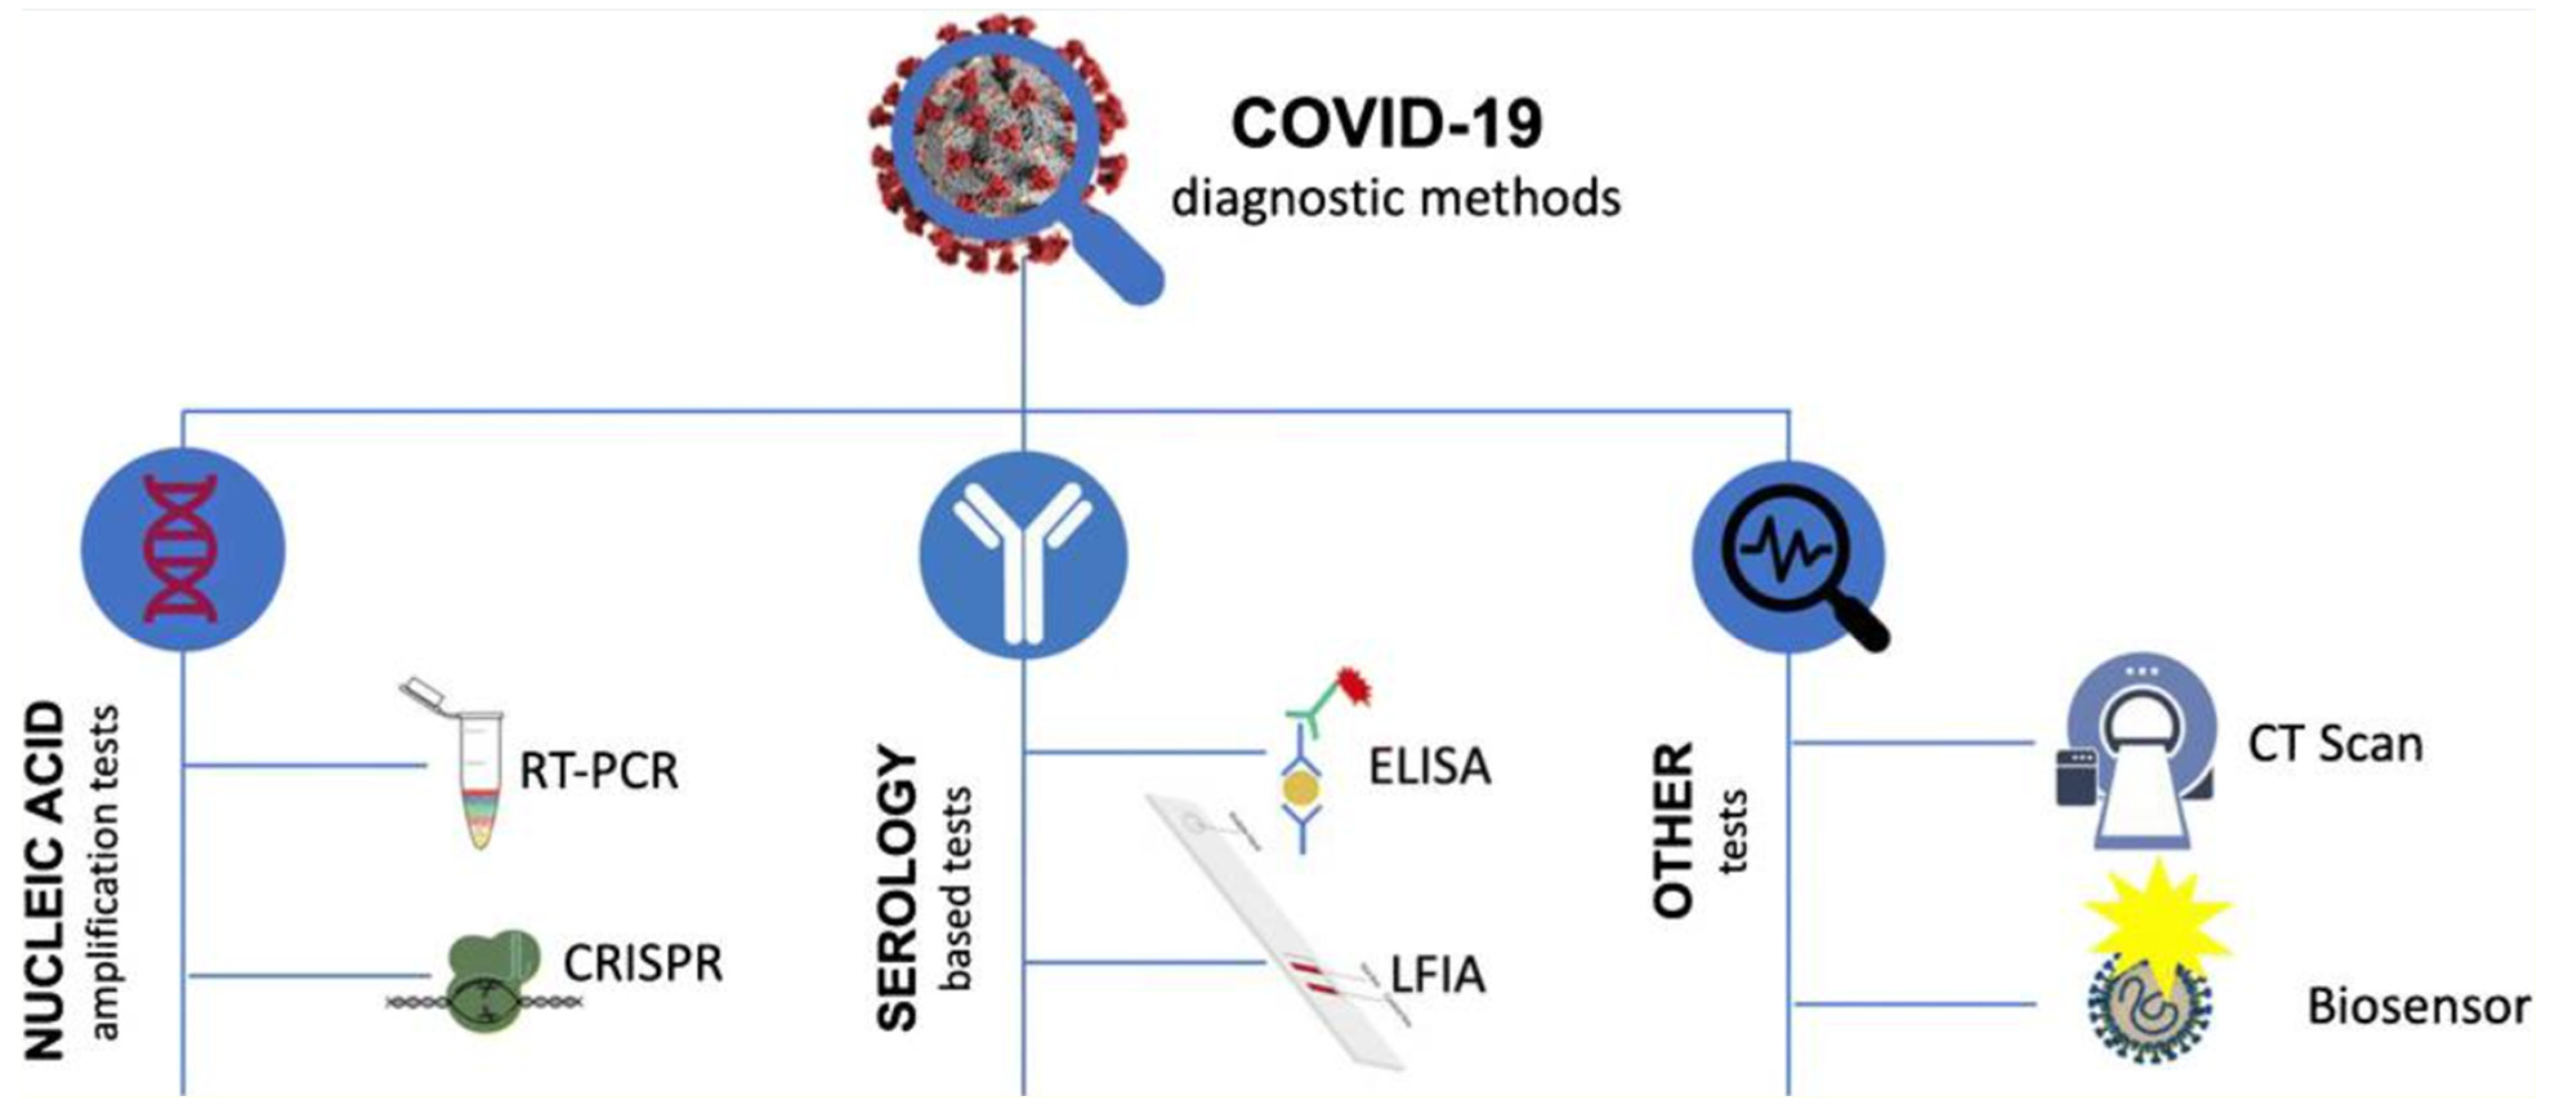
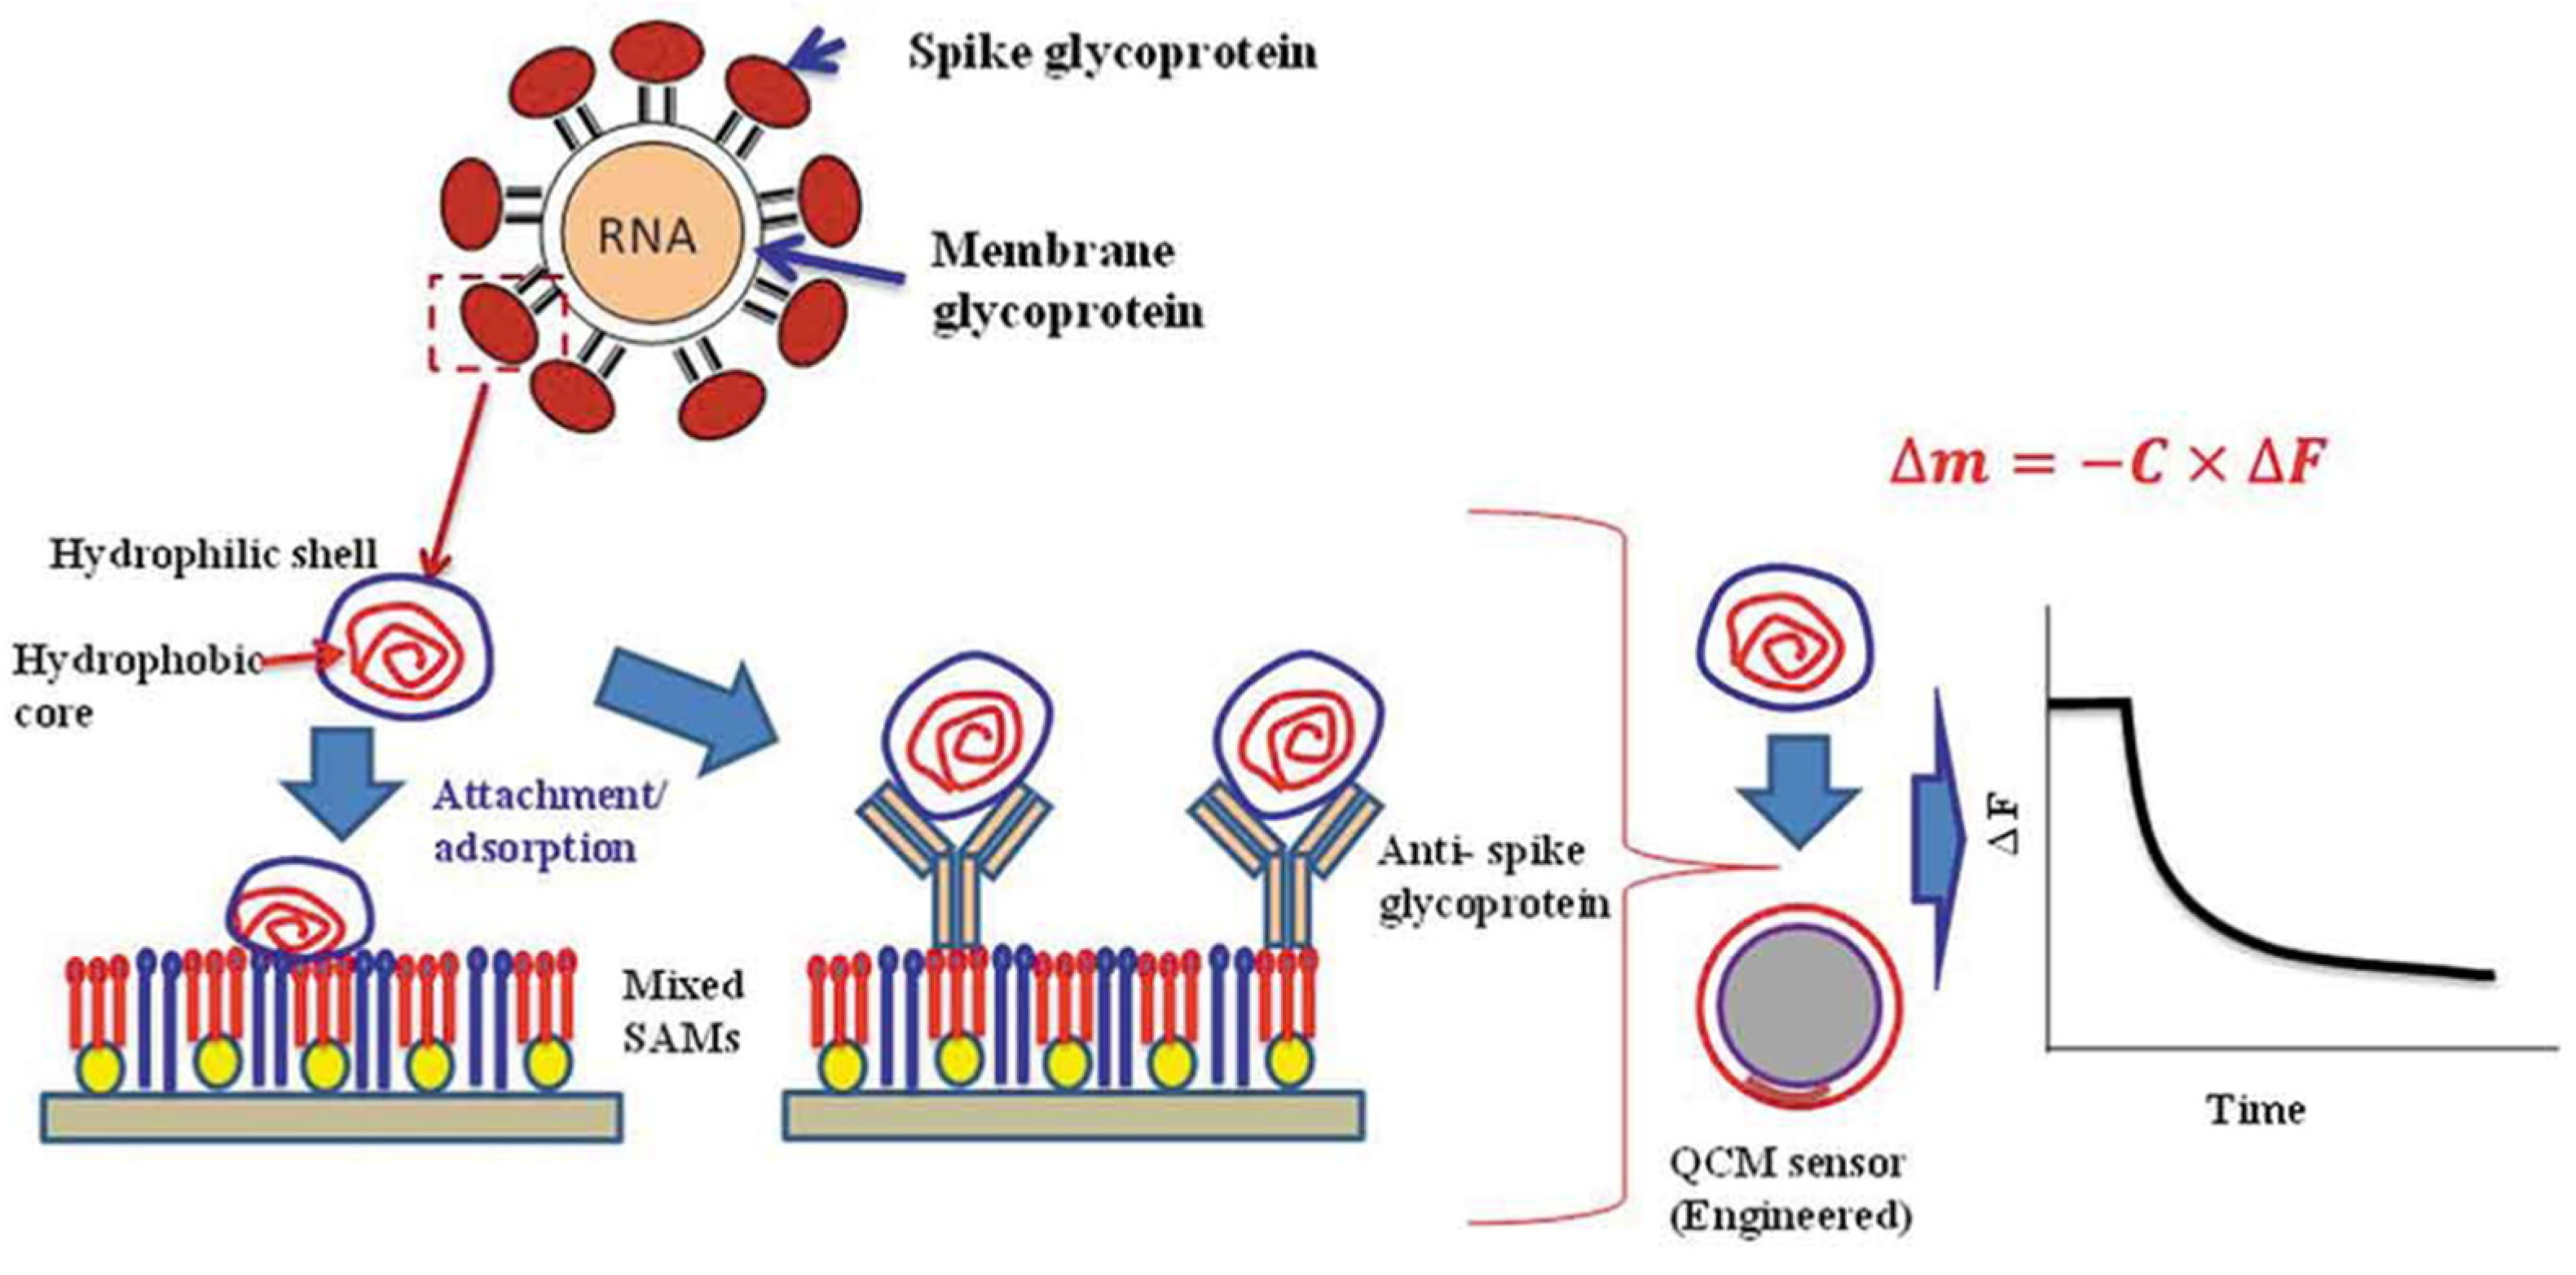
4.7. COVID-19 Detection
4.8. Detector for Air Pollutant Detection and Determination
4.9. Solution Measurement
4.10. Miscellaneous Applications
5. Future Perspective and Conclusions
Author Contributions
Funding
Institutional Review Board Statement
Informed Consent Statement
Data Availability Statement
Conflicts of Interest
References
- Bettini, S.; Pagano, R.; Bonfrate, V.; Maglie, E.; Manno, D.; Serra, A.; Valli, L.; Giancane, G. Promising Piezoelectric Properties of New ZnO@Octadecylamine Adduct. J. Phys. Chem. C 2015, 119, 20143–20149. [Google Scholar] [CrossRef]
- Săvescu, C.; Comeagă, D.; Morega, A.; Veli, Y. Experimental Tests with Piezoelectric Harvester for Tuning Resonant Frequency to Vibrating Source. Rev. Roum. Sci. Techn.—Électrotechn. Énerg. 2022, 67, 457–460. [Google Scholar]
- Kouritem, S.A.; Altabey, W.A. Ultra-broadband natural frequency using automatic resonance tuning of energy harvester and deep learning algorithms. Energy Convers. Manag. 2022, 272, 116332. [Google Scholar] [CrossRef]
- Bani-Hani, M.; Aljanaideh, K.; Almomani, A.; Kouritem, S.A. Analytical Modeling and Numerical Investigation of Earthquake-Induced Structural Vibration Energy Harvester. IEEE Sens. J. 2022, 22, 19237–19248. [Google Scholar] [CrossRef]
- Elahi, H.; Mughal, M.R.; Eugeni, M.; Qayyum, F.; Israr, A.; Ali, A.; Munir, K.; Praks, J.; Gaudenzi, P. Characterization and Implementation of a Piezoelectric Energy Harvester Configuration: Analytical, Numerical and Experimental Approach. Integr. Ferroelectr. 2020, 212, 39–60. [Google Scholar] [CrossRef]
- Wu, J.; Wu, Z.; Qian, W.; Jia, Y.; Wang, Y.; Luo, H. Electric-field-treatment-induced enhancement of photoluminescence in Er3+-doped (Ba0.95Sr0.05)(Zr0.1Ti0.9)O3 piezoelectric ceramic. Mater. Lett. 2016, 184, 131–133. [Google Scholar] [CrossRef]
- Zhu, R.; Yang, R. Introduction to the Piezotronic Effect and Sensing Applications. In Synthesis and Characterization of Piezotronic Materials for Application in Strain/Stress Sensing; Springer: Cham, Switzerland, 2018; pp. 1–4. [Google Scholar] [CrossRef]
- Hehn, T.; Manoli, Y. CMOS Circuits for Piezoelectric Energy Harvesters. Springer Ser. Adv. Microelectron. 2015, 38, 21–40. [Google Scholar] [CrossRef]
- Sezer, N.; Koç, M. A comprehensive review on the state-of-the-art of piezoelectric energy harvesting. Nano Energy 2021, 80, 105567. [Google Scholar] [CrossRef]
- Kobayashi, T.; Ichiki, M.; Kondou, R.; Nakamura, K.; Maeda, R. Fabrication of piezoelectric microcantilevers using LaNiO3 buffered Pb(Zr,Ti)O3 thin film. J. Micromech. Microeng. 2008, 18, 035007. [Google Scholar] [CrossRef]
- Katsouras, I.; Asadi, K.; Li, M.; Van Driel, T.B.; Kjær, K.S.; Zhao, D.; Lenz, T.; Gu, Y.; Blom, P.W.M.; Damjanovic, D.; et al. The negative piezoelectric effect of the ferroelectric polymer poly(vinylidene fluoride). Nat. Mater. 2015, 15, 78–84. [Google Scholar] [CrossRef]
- Ueda, S.; Okada, M.; Nakaue, Y. Transient thermal response of a functionally graded piezoelectric laminate with a crack normal to the bimaterial interface. J. Therm. Stress. 2017, 41, 98–118. [Google Scholar] [CrossRef]
- Elahi, H.; Eugeni, M.; Gaudenzi, P. Electromechanical Degradation of Piezoelectric Patches. Adv. Struct. Mater. 2018, 81, 35–44. [Google Scholar] [CrossRef]
- Kouritem, S.A.; Bani-Hani, M.A.; Beshir, M.; Elshabasy, M.M.; Altabey, W.A. Automatic Resonance Tuning Technique for an Ultra-Broadband Piezoelectric Energy Harvester. Energies 2022, 15, 7271. [Google Scholar] [CrossRef]
- Elahi, H.; Eugeni, M.; Gaudenzi, P. A Review on Mechanisms for Piezoelectric-Based Energy Harvesters. Energies 2018, 11, 1850. [Google Scholar] [CrossRef] [Green Version]
- Xia, Y.; Michelin, S.; Doaré, O. Fluid-Solid-Electric Lock-In of Energy-Harvesting Piezoelectric Flags. Phys. Rev. Appl. 2015, 3, 014009. [Google Scholar] [CrossRef] [Green Version]
- Yang, Z.; Erturk, A.; Zu, J. On the efficiency of piezoelectric energy harvesters. Extrem. Mech. Lett. 2017, 15, 26–37. [Google Scholar] [CrossRef]
- Kouritem, S.A.; Al-Moghazy, M.A.; Noori, M.; Altabey, W.A. Mass tuning technique for a broadband piezoelectric energy harvester array. Mech. Syst. Signal Process. 2022, 181, 109500. [Google Scholar] [CrossRef]
- Ali, A.; Pasha, R.A.; Sheeraz, M.A.; Butt, Z.; Elahi, H.; Khan, A.A. Investigation of Electrical Properties for Cantilever-Based Piezoelectric Energy Harvester. Adv. Sci. Technol. Res. J. 2019, 13, 76–85. [Google Scholar] [CrossRef]
- Ali, F.; Raza, W.; Li, X.; Gul, H.; Kim, K.-H. Piezoelectric energy harvesters for biomedical applications. Nano Energy 2019, 57, 879–902. [Google Scholar] [CrossRef]
- Ghazanfarian, J.; Mohammadi, M.M.; Uchino, K. Piezoelectric Energy Harvesting: A Systematic Review of Reviews. Actuators 2021, 10, 312. [Google Scholar] [CrossRef]
- Li, H.; Sang, Y.; Chang, S.; Huang, X.; Zhang, Y.; Yang, R.; Jiang, H.; Liu, H.; Wang, Z.L. Enhanced Ferroelectric-Nanocrystal-Based Hybrid Photocatalysis by Ultrasonic-Wave-Generated Piezophototronic Effect. Nano Lett. 2015, 15, 2372–2379. [Google Scholar] [CrossRef] [PubMed]
- Qian, W.; Zhao, K.; Zhang, D.; Bowen, C.R.; Wang, Y.; Yang, Y. Piezoelectric Material-Polymer Composite Porous Foam for Efficient Dye Degradation via the Piezo-Catalytic Effect. ACS Appl. Mater. Interfaces 2019, 11, 27862–27869. [Google Scholar] [CrossRef] [PubMed]
- Zhang, Y.; Schultz, A.M.; Salvador, P.A.; Rohrer, G.S. Spatially selective visible light photocatalytic activity of TiO2/BiFeO3 heterostructures. J. Mater. Chem. 2011, 21, 4168–4174. [Google Scholar] [CrossRef]
- Bermúdez, V.; Caccavale, F.; Sada, C.; Segato, F.; Diéguez, E. Etching effect on periodic domain structures of lithium niobate crystals. J. Cryst. Growth 1998, 191, 589–593. [Google Scholar] [CrossRef]
- Holstein, W.L. Etching study of ferroelectric microdomains in LiNbO3 and MgO:LiNbO3. J. Cryst. Growth 1997, 171, 477–484. [Google Scholar] [CrossRef]
- Nassau, K.; Levinstein, H.J.; Loiacono, G.M. The domain structure and etching of ferroelectric lithium niobate. Appl. Phys. Lett. 1965, 6, 228–229. [Google Scholar] [CrossRef]
- Sones, C.L.; Mailis, S.; Brocklesby, W.S.; Eason, R.W.; Owen, J.R. Differential etch rates in z-cut LiNbO3 for variable HF/HNO3 concentrations. J. Mater. Chem. 2001, 12, 295–298. [Google Scholar] [CrossRef]
- Xue, X.; Wang, S.; Guo, W.; Zhang, Y.; Wang, Z.L. Hybridizing Energy Conversion and Storage in a Mechanical-to-Electrochemical Process for Self-Charging Power Cell. Nano Lett. 2012, 12, 5048–5054. [Google Scholar] [CrossRef] [Green Version]
- Ramadoss, A.; Saravanakumar, B.; Lee, S.W.; Kim, Y.-S.; Kim, S.J.; Wang, Z.L. Piezoelectric-Driven Self-Charging Supercapacitor Power Cell. ACS Nano 2015, 9, 4337–4345. [Google Scholar] [CrossRef]
- Song, R.; Jin, H.; Li, X.; Fei, L.; Zhao, Y.; Huang, H.; Chan, H.L.-W.; Wang, Y.; Chai, Y. A rectification-free piezo-supercapacitor with a polyvinylidene fluoride separator and functionalized carbon cloth electrodes. J. Mater. Chem. A 2015, 3, 14963–14970. [Google Scholar] [CrossRef]
- Wang, F.; Jiang, C.; Tang, C.; Bi, S.; Wang, Q.; Du, D.; Song, J. High output nano-energy cell with piezoelectric nanogenerator and porous supercapacitor dual functions—A technique to provide sustaining power by harvesting intermittent mechanical energy from surroundings. Nano Energy 2016, 21, 209–216. [Google Scholar] [CrossRef]
- Parida, K.; Bhavanasi, V.; Kumar, V.; Wang, J.; Lee, P.S. Fast charging self-powered electric double layer capacitor. J. Power Sources 2017, 342, 70–78. [Google Scholar] [CrossRef]
- Lee, B.-S.; Yoon, J.; Jung, C.; Kim, D.Y.; Jeon, S.-Y.; Kim, K.-H.; Park, J.-H.; Park, H.; Lee, K.H.; Kang, Y.-S.; et al. Silicon/Carbon Nanotube/BaTiO3 Nanocomposite Anode: Evidence for Enhanced Lithium-Ion Mobility Induced by the Local Piezoelectric Potential. ACS Nano 2016, 10, 2617–2627. [Google Scholar] [CrossRef] [PubMed]
- Kim, S.; Choi, S.J.; Zhao, K.; Yang, H.; Gobbi, G.; Zhang, S.; Li, J. Electrochemically driven mechanical energy harvesting. Nat. Commun. 2016, 7, 10146. [Google Scholar] [CrossRef] [Green Version]
- Lang, S.B.; Tofail, S.A.M.; Kholkin, A.L.; Wojtaś, M.; Gregor, M.; Gandhi, A.A.; Wang, Y.; Bauer, S.; Krause, M.; Plecenik, A. Ferroelectric Polarization in Nanocrystalline Hydroxyapatite Thin Films on Silicon. Sci. Rep. 2013, 3, 2215. [Google Scholar] [CrossRef] [Green Version]
- Baxter, F.R.; Bowen, C.; Turner, I.G.; Dent, A.C.E. Electrically Active Bioceramics: A Review of Interfacial Responses. Ann. Biomed. Eng. 2010, 38, 2079–2092. [Google Scholar] [CrossRef]
- Touach, N.; Ortiz-Martínez, V.; Salar-García, M.; Benzaouak, A.; Hernández-Fernández, F.; de Ríos, A.P.; El Mahi, M.; Lotfi, E. On the use of ferroelectric material LiNbO3 as novel photocatalyst in wastewater-fed microbial fuel cells. Particuology 2017, 34, 147–155. [Google Scholar] [CrossRef]
- Tiwari, D.; Dunn, S.; Zhang, Q. Impact of Zr/Ti ratio in the PZT on the photoreduction of silver nanoparticles. Mater. Res. Bull. 2009, 44, 1219–1224. [Google Scholar] [CrossRef] [Green Version]
- Mushtaq, F.; Chen, X.; Hoop, M.; Torlakcik, H.; Pellicer, E.; Sort, J.; Gattinoni, C.; Nelson, B.J.; Pané, S. Piezoelectrically Enhanced Photocatalysis with BiFeO3 Nanostructures for Efficient Water Remediation. iScience 2018, 4, 236–246. [Google Scholar] [CrossRef]
- Sun, C.; Fu, Y.; Wang, Q.; Xing, L.; Liu, B.; Xue, X. Ultrafast piezo-photocatalytic degradation of organic pollutions by Ag2O/tetrapod-ZnO nanostructures under ultrasonic/UV exposure. RSC Adv. 2016, 6, 87446–87453. [Google Scholar] [CrossRef]
- Hong, D.; Zang, W.; Guo, X.; Fu, Y.; He, H.; Sun, J.; Xing, L.; Liu, B.; Xue, X. High Piezo-photocatalytic Efficiency of CuS/ZnO Nanowires Using Both Solar and Mechanical Energy for Degrading Organic Dye. ACS Appl. Mater. Interfaces 2016, 8, 21302–21314. [Google Scholar] [CrossRef] [PubMed]
- Wu, M.-H.; Lee, J.-T.; Chung, Y.J.; Srinivaas, M.; Wu, J.-M. Ultrahigh efficient degradation activity of single- and few-layered MoSe2 nanoflowers in dark by piezo-catalyst effect. Nano Energy 2017, 40, 369–375. [Google Scholar] [CrossRef]
- Masimukku, S.; Hu, Y.-C.; Lin, Z.-H.; Chan, S.-W.; Chou, T.-M.; Wu, J.M. High efficient degradation of dye molecules by PDMS embedded abundant single-layer tungsten disulfide and their antibacterial performance. Nano Energy 2018, 46, 338–346. [Google Scholar] [CrossRef]
- Xing, L.; Nie, Y.; Xue, X.; Zhang, Y. PVDF mesoporous nanostructures as the piezo-separator for a self-charging power cell. Nano Energy 2014, 10, 44–52. [Google Scholar] [CrossRef]
- Kim, Y.-S.; Xie, Y.; Wen, X.; Wang, S.; Kim, S.J.; Song, H.-K.; Wang, Z.L. Highly porous piezoelectric PVDF membrane as effective lithium ion transfer channels for enhanced self-charging power cell. Nano Energy 2015, 14, 77–86. [Google Scholar] [CrossRef] [Green Version]
- Noris-Suárez, K.; Lira-Olivares, J.; Ferreira, A.M.; Graterol, A.; Feijoo, J.L.; Lee, S.W. Electrochemical Influence of Collagen Piezoelectric Effect in Bone Healing. Mater. Sci. Forum 2007, 544–545, 981–984. [Google Scholar] [CrossRef]
- Giocondi, J.L.; Rohrer, G.S. The Influence of the Dipolar Field Effect on the Photochemical Reactivity of Sr2Nb2O7 and BaTiO3 Microcrystals. Top. Catal. 2008, 49, 18–23. [Google Scholar] [CrossRef]
- Hong, K.-S.; Xu, H.; Konishi, H.; Li, X. Direct Water Splitting through Vibrating Piezoelectric Microfibers in Water. J. Phys. Chem. Lett. 2010, 1, 997–1002. [Google Scholar] [CrossRef]
- Starr, M.B.; Shi, J.; Wang, X. Piezopotential-Driven Redox Reactions at the Surface of Piezoelectric Materials. Angew. Chem. 2012, 124, 6064–6068. [Google Scholar] [CrossRef]
- Tan, C.F.; Ong, W.L.; Ho, G.W. Self-Biased Hybrid Piezoelectric-Photoelectrochemical Cell with Photocatalytic Functionalities. ACS Nano 2015, 9, 7661–7670. [Google Scholar] [CrossRef]
- Lin, J.-H.; Tsao, Y.-H.; Wu, M.-H.; Chou, T.-M.; Lin, Z.-H.; Wu, J.M. Single- and few-layers MoS2 nanocomposite as piezo-catalyst in dark and self-powered active sensor. Nano Energy 2017, 31, 575–581. [Google Scholar] [CrossRef]
- Lv, W.; Kong, L.; Lan, S.; Feng, J.; Xiong, Y.; Tian, S. Enhancement effect in the piezoelectric degradation of organic pollutants by piezo-Fenton process. J. Chem. Technol. Biotechnol. 2016, 92, 152–156. [Google Scholar] [CrossRef]
- Hong, K.-S.; Xu, H.; Konishi, H.; Li, X. Piezoelectrochemical Effect: A New Mechanism for Azo Dye Decolorization in Aqueous Solution through Vibrating Piezoelectric Microfibers. J. Phys. Chem. C 2012, 116, 13045–13051. [Google Scholar] [CrossRef]
- Xue, X.; Zang, W.; Deng, P.; Wang, Q.; Xing, L.; Zhang, Y.; Wang, Z.L. Piezo-potential enhanced photocatalytic degradation of organic dye using ZnO nanowires. Nano Energy 2015, 13, 414–422. [Google Scholar] [CrossRef]
- Liu, L.; Lu, K.; Wang, T.; Liao, F.; Peng, M.; Shao, M. Flexible piezoelectric nanogenerators based on silicon nanowire/α-quartz composites for mechanical energy harvesting. Mater. Lett. 2015, 160, 222–226. [Google Scholar] [CrossRef]
- Zhang, H.; Zhang, S.; Yao, G.; Huang, Z.; Xie, Y.; Su, Y.; Yang, W.; Zheng, C.; Lin, Y. Simultaneously Harvesting Thermal and Mechanical Energies based on Flexible Hybrid Nanogenerator for Self-Powered Cathodic Protection. ACS Appl. Mater. Interfaces 2015, 7, 28142–28147. [Google Scholar] [CrossRef]
- Ali, A.; Sheeraz, M.A.; Bibi, S.; Khan, M.Z.; Malik, M.S.; Ali, W. Artificial neural network (ANN)-based optimization of a numerically analyzed m-shaped piezoelectric energy harvester. Funct. Mater. Lett. 2021, 14, 2151046. [Google Scholar] [CrossRef]
- Gosavi, S.K.; Balpande, S.S. A Comprehensive Review of Micro and Nano Scale Piezoelectric Energy Harvesters. Sens. Lett. 2019, 17, 180–195. [Google Scholar] [CrossRef]
- Li, H.; Tian, C.; Deng, Z.D. Energy harvesting from low frequency applications using piezoelectric materials articles. Appl. Phys. Rev. 2014, 1, 41301. [Google Scholar] [CrossRef] [Green Version]
- Narita, F.; Fox, M. A Review on Piezoelectric, Magnetostrictive, and Magnetoelectric Materials and Device Technologies for Energy Harvesting Applications. Adv. Eng. Mater. 2017, 20, 1700743. [Google Scholar] [CrossRef]
- Lefeuvre, E.; Sebald, G.; Guyomar, D.; Lallart, M.; Richard, C. Materials, structures and power interfaces for efficient piezoelectric energy harvesting. J. Electroceram. 2007, 22, 171–179. [Google Scholar] [CrossRef]
- Safaei, M.; Sodano, H.A.; Anton, S.R. A review of energy harvesting using piezoelectric materials: State-of-the-art a decade later (2008–2018). Smart Mater. Struct. 2019, 28, 113001. [Google Scholar] [CrossRef]
- Liu, H.; Zhong, J.; Lee, C.; Lee, S.-W.; Lin, L. A comprehensive review on piezoelectric energy harvesting technology: Materials, mechanisms, and applications. Appl. Phys. Rev. 2018, 5, 041306. [Google Scholar] [CrossRef] [Green Version]
- Amin, A.R.; Ali, A.; Ali, H.M. Application of Nanofluids for Machining Processes: A Comprehensive Review. Nanomaterials 2022, 12, 4214. [Google Scholar] [CrossRef]
- Yuan, X.; Changgeng, S.; Yan, G.; Zhenghong, Z. Application review of dielectric electroactive polymers (DEAPs) and piezoelectric materials for vibration energy harvesting. J. Phys. Conf. Ser. 2016, 744, 12077. [Google Scholar] [CrossRef] [Green Version]
- Mishra, S.; Unnikrishnan, L.; Nayak, S.K.; Mohanty, S. Advances in Piezoelectric Polymer Composites for Energy Harvesting Applications: A Systematic Review. Macromol. Mater. Eng. 2018, 304, 1800463. [Google Scholar] [CrossRef] [Green Version]
- Bowen, C.R.; Kim, H.A.; Weaver, P.M.; Dunn, S. Piezoelectric and ferroelectric materials and structures for energy harvesting applications. Energy Environ. Sci. 2013, 7, 25–44. [Google Scholar] [CrossRef] [Green Version]
- Mukherjee, A.; Datta, U. Comparative study of piezoelectric materials properties for green energy harvesting from vibration. In Proceedings of the 2010 Annual IEEE India Conference (INDICON), Kolkata, India, 17–19 December 2010. [Google Scholar] [CrossRef]
- Jung, J.H.; Lee, M.; Hong, J.-I.; Ding, Y.; Chen, C.-Y.; Chou, L.-J.; Wang, Z.L. Lead-Free NaNbO3 Nanowires for a High Output Piezoelectric Nanogenerator. ACS Nano 2011, 5, 10041–10046. [Google Scholar] [CrossRef]
- Moorthy, B.; Baek, C.; Wang, J.E.; Jeong, C.K.; Moon, S.; Park, K.-I.; Kim, D.K. Piezoelectric energy harvesting from a PMN–PT single nanowire. RSC Adv. 2016, 7, 260–265. [Google Scholar] [CrossRef]
- Lin, Y.-F.; Song, J.; Ding, Y.; Lu, S.-Y.; Wang, Z.L. Piezoelectric nanogenerator using CdS nanowires. Appl. Phys. Lett. 2008, 92, 022105. [Google Scholar] [CrossRef]
- Naqvi, A.; Ali, A.; Altabey, W.A.; Kouritem, S.A. Energy Harvesting from Fluid Flow Using Piezoelectric Materials: A Review. Energies 2022, 15, 7424. [Google Scholar] [CrossRef]
- Zhang, Z.; Chen, Y.; Guo, J. ZnO nanorods patterned-textile using a novel hydrothermal method for sandwich structured-piezoelectric nanogenerator for human energy harvesting. Phys. E Low-Dimens. Syst. Nanostruct. 2018, 105, 212–218. [Google Scholar] [CrossRef]
- Qiu, Y.; Zhang, H.; Hu, L.; Yang, D.; Wang, L.; Wang, B.; Ji, J.; Liu, G.; Liu, X.; Lin, J.; et al. Flexible piezoelectric nanogenerators based on ZnO nanorods grown on common paper substrates. Nanoscale 2012, 4, 6568–6573. [Google Scholar] [CrossRef]
- Lin, Z.-H.; Yang, Y.; Wu, J.M.; Liu, Y.; Zhang, F.; Wang, Z.L. BaTiO3 Nanotubes-Based Flexible and Transparent Nanogenerators. J. Phys. Chem. Lett. 2012, 3, 3599–3604. [Google Scholar] [CrossRef] [Green Version]
- Badatya, S.; Bharti, D.K.; Sathish, N.; Srivastava, A.K.; Gupta, M.K. Humidity Sustainable Hydrophobic Poly(vinylidene fluoride)-Carbon Nanotubes Foam Based Piezoelectric Nanogenerator. ACS Appl. Mater. Interfaces 2021, 13, 27245–27254. [Google Scholar] [CrossRef]
- Ding, R.; Zhang, X.; Chen, G.; Wang, H.; Kishor, R.; Xiao, J.; Gao, F.; Zeng, K.; Chen, X.; Sun, X.W.; et al. High-performance piezoelectric nanogenerators composed of formamidinium lead halide perovskite nanoparticles and poly(vinylidene fluoride). Nano Energy 2017, 37, 126–135. [Google Scholar] [CrossRef]
- Vivekananthan, V.; Chandrasekhar, A.; Alluri, N.R.; Purusothaman, Y.; Kim, W.J.; Kang, C.-N.; Kim, S.-J. A flexible piezoelectric composite nanogenerator based on doping enhanced lead-free nanoparticles. Mater. Lett. 2019, 249, 73–76. [Google Scholar] [CrossRef]
- Lee, S.-G.; Monteiro, R.G.; Feigelson, R.S.; Lee, H.S.; Lee, M.; Park, S.-E. Growth and electrostrictive properties of Pb(Mg1/3Nb2/3)O3 crystals. Appl. Phys. Lett. 1999, 74, 1030–1032. [Google Scholar] [CrossRef]
- Shin, S.-H.; Kim, Y.-H.; Lee, M.H.; Jung, J.-Y.; Nah, J. Hemispherically Aggregated BaTiO3 Nanoparticle Composite Thin Film for High-Performance Flexible Piezoelectric Nanogenerator. ACS Nano 2014, 8, 2766–2773. [Google Scholar] [CrossRef]
- Park, K.-I.; Xu, S.; Liu, Y.; Hwang, G.-T.; Kang, S.-J.L.; Wang, Z.L.; Lee, K.J. Piezoelectric BaTiO3 Thin Film Nanogenerator on Plastic Substrates. Nano Lett. 2010, 10, 4939–4943. [Google Scholar] [CrossRef] [Green Version]
- Uchino, K. Piezoelectric Energy Harvesting Systems—Essentials to Successful Developments. Energy Technol. 2018, 6, 829–848. [Google Scholar] [CrossRef]
- Priya, S. Advances in energy harvesting using low profile piezoelectric transducers. J. Electroceram. 2007, 19, 167–184. [Google Scholar] [CrossRef]
- Yang, Z.; Zhou, S.; Zu, J.; Inman, D. High-Performance Piezoelectric Energy Harvesters and Their Applications. Joule 2018, 2, 642–697. [Google Scholar] [CrossRef] [Green Version]
- Talib, N.H.H.A.; Salleh, H.; Youn, B.D.; Resali, M.S.M. Comprehensive Review on Effective Strategies and Key Factors for High Performance Piezoelectric Energy Harvester at Low Frequency. Int. J. Automot. Mech. Eng. 2019, 16, 7181–7210. [Google Scholar] [CrossRef] [Green Version]
- Ibrahim, S.W.; Ali, W.G. A review on frequency tuning methods for piezoelectric energy harvesting systems. J. Renew. Sustain. Energy 2012, 4, 062703. [Google Scholar] [CrossRef]
- Yildirim, T.; Ghayesh, M.H.; Li, W.; Alici, G. A review on performance enhancement techniques for ambient vibration energy harvesters. Renew. Sustain. Energy Rev. 2017, 71, 435–449. [Google Scholar] [CrossRef] [Green Version]
- Maamer, B.; Boughamoura, A.; El-Bab, A.M.F.; Francis, L.A.; Tounsi, F. A review on design improvements and techniques for mechanical energy harvesting using piezoelectric and electromagnetic schemes. Energy Convers. Manag. 2019, 199, 111973. [Google Scholar] [CrossRef]
- Young, K.F.; Frederikse, H.P.R. Compilation of the Static Dielectric Constant of Inorganic Solids. J. Phys. Chem. Ref. Data 1973, 2, 313–410. [Google Scholar] [CrossRef] [Green Version]
- Turner, R.; Fuierer, P.; Newnham, R.; Shrout, T. Materials for high temperature acoustic and vibration sensors: A review. Appl. Acoust. 1994, 41, 299–324. [Google Scholar] [CrossRef]
- Cheng, K.; Chan, H.; Choy, C.; Yin, Q.; Luo, H.; Yin, Z. Single crystal PMN-0.33PT/epoxy 1-3 composites for ultrasonic transducer applications. IEEE Trans. Ultrason. Ferroelectr. Freq. Control. 2003, 50, 1177–1183. [Google Scholar] [CrossRef] [Green Version]
- Tadigadapa, S.A.; Mateti, K. Piezoelectric MEMS sensors: State-of-the-art and perspectives. Meas. Sci. Technol. 2009, 20, 092001. [Google Scholar] [CrossRef]
- Shung, K.K.; Cannata, J.M.; Zhou, Q.F. Piezoelectric materials for high frequency medical imaging applications: A review. J. Electroceram. 2007, 19, 141–147. [Google Scholar] [CrossRef]
- Guy, I.L.; Muensit, S.; Goldys, E.M. Extensional piezoelectric coefficients of gallium nitride and aluminum nitride. Appl. Phys. Lett. 1999, 75, 4133–4135. [Google Scholar] [CrossRef]
- Weis, R.S.; Gaylord, T.K. Lithium niobate: Summary of physical properties and crystal structure. Appl. Phys. A 1985, 37, 191–203. [Google Scholar] [CrossRef]
- Wilson, S.A.; Jourdain, R.P.; Zhang, Q.; Dorey, R.A.; Bowen, C.R.; Willander, M.; Wahab, Q.U.; Al-Hilli, S.M.; Nur, O.; Quandt, E.; et al. New materials for micro-scale sensors and actuators: An engineering review. Mater. Sci. Eng. R Rep. 2007, 56, 1–129. [Google Scholar] [CrossRef] [Green Version]
- Crisler, D.; Cupal, J.; Moore, A. Dielectric, piezoelectric, and electromechanical coupling constants of zinc oxide crystals. Proc. IEEE 1968, 56, 225–226. [Google Scholar] [CrossRef]
- Qin, L.; Wang, Q.-M. Mass sensitivity of thin film bulk acoustic resonator sensors based on polar c-axis tilted zinc oxide and aluminum nitride thin film. J. Appl. Phys. 2010, 108, 104510. [Google Scholar] [CrossRef]
- Muensit, S.; Goldys, E.M.; Guy, I.L. Shear piezoelectric coefficients of gallium nitride and aluminum nitride. Appl. Phys. Lett. 1999, 75, 3965–3967. [Google Scholar] [CrossRef]
- Qin, L.; Wang, Q.-M. Analysis of dual-mode thin film bulk acoustic resonators based on polar c-axis tilted wurtzite gallium nitride. J. Appl. Phys. 2010, 107, 114102. [Google Scholar] [CrossRef]
- Nam, C.-Y.; Jaroenapibal, P.; Tham, D.; Luzzi, D.E.; Evoy, S.; Fischer, J.E. Diameter-Dependent Electromechanical Properties of GaN Nanowires. Nano Lett. 2006, 6, 153–158. [Google Scholar] [CrossRef]
- Gao, P.; Liu, K.; Liu, L.; Wang, Z.; Liao, Z.; Xu, Z.; Wang, W.; Bai, X.; Wang, E.; Li, Y. Higher-order harmonic resonances and mechanical properties of individual cadmium sulphide nanowires measured by in situ transmission electron microscopy. J. Electron Microsc. 2010, 59, 285–289. [Google Scholar] [CrossRef] [PubMed]
- Ali, A.; Pasha, R.A.; Elahi, H.; Sheeraz, M.A.; Bibi, S.; Hassan, Z.U.; Eugeni, M.; Gaudenzi, P. Investigation of Deformation in Bimorph Piezoelectric Actuator: Analytical, Numerical and Experimental Approach. Integr. Ferroelectr. 2019, 201, 94–109. [Google Scholar] [CrossRef]
- Maarsen, J.W.; Smit, M.C.; Matze, J. The Raman and infra-red spectra of some compounds (iH7C3O)2PXO. Recl. Trav. Chim. Pays-Bas 1957, 76, 713–723. [Google Scholar] [CrossRef]
- Sheeraz, M.A.; Butt, Z.; Khan, A.M.; Mehmood, S.; Ali, A.; Azeem, M.; Nasir, A.; Imtiaz, T. Design and Optimization of Piezoelectric Transducer (PZT-5H Stack). J. Electron. Mater. 2019, 48, 6487–6502. [Google Scholar] [CrossRef]
- Guilbault, G.G.; Jordan, J.M.; Scheide, E. Analytical Uses of Piezoelectric Crystals: A Review. CRC Crit. Rev. Anal. Chem. 1988, 19, 1–28. [Google Scholar] [CrossRef]
- Lu, C.; Czanderna, A.W. Applications of Piezoelectric Quartz Crystal Microbalances; Elsevier Science: Burlington, NJ, USA, 2012. [Google Scholar]
- Guilbault, G.G.; Ngeh-Ngwainbi, J. Use of Protein Coatings on Piezoelectric Crystals for Assay of Gaseous Pollutants. In Analytical Uses of Immobilized Biological Compounds for Detection, Medical and Industrial Uses; Springer: Dordrecht, The Nethelands, 1988; pp. 187–194. [Google Scholar] [CrossRef]
- Blum, L.J.; Coulet, P.R. Biosensor Principles and Applications; Dekker: New York, NY, USA, 1991. [Google Scholar]
- King, W.H. Piezoelectric Sorption Detector. Anal. Chem. 1964, 36, 1735–1739. [Google Scholar] [CrossRef]
- Lee, C.; Fung, Y.; Fung, K. A piezoelectric crystal detector for water in gases. Anal. Chim. Acta 1982, 135, 277–283. [Google Scholar] [CrossRef]
- Shahid, M.; Javed, H.M.A.; Ahmad, M.I.; Qureshi, A.A.; Khan, M.I.; Alnuwaiser, M.A.; Ahmed, A.; Khan, M.A.; Tag-ElDin, E.S.M.; Shahid, A.; et al. A Brief Assessment on Recent Developments in Efficient Electrocatalytic Nitrogen Reduction with 2D Non-Metallic Nanomaterials. Nanomaterials 2022, 12, 3413. [Google Scholar] [CrossRef]
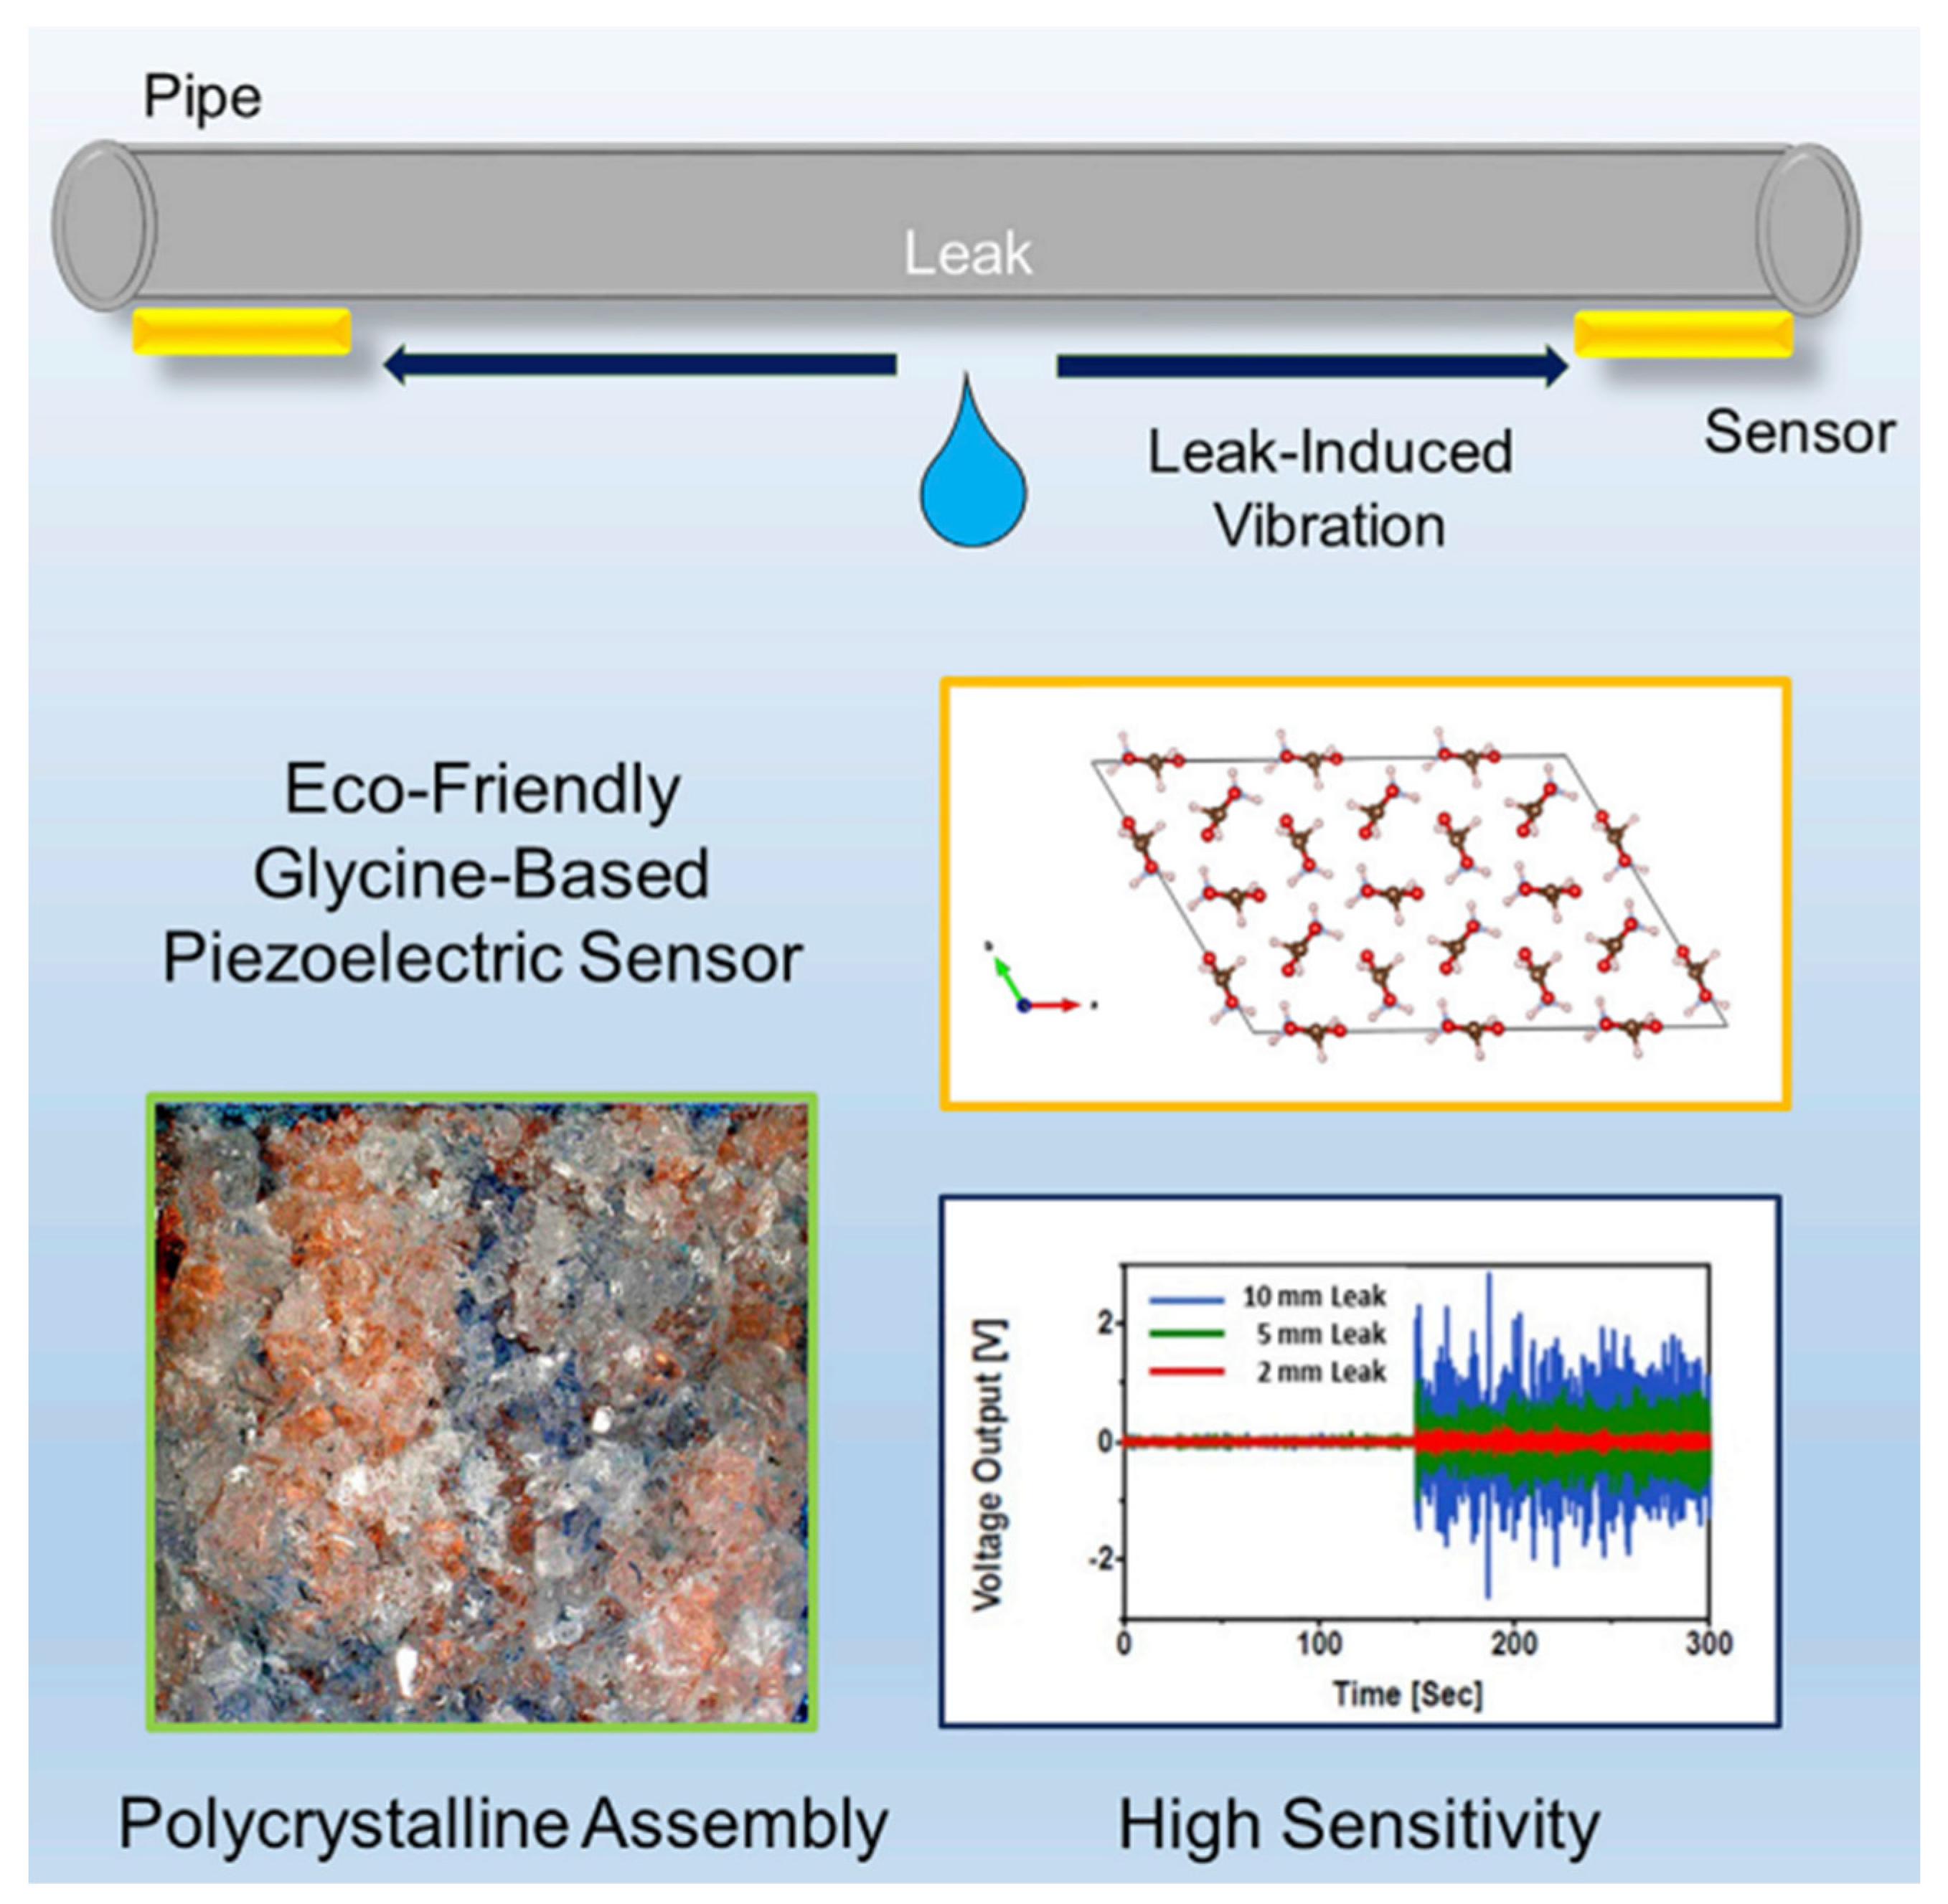
- Okosun, F.; Guerin, S.; Celikin, M.; Pakrashi, V. Flexible amino acid-based energy harvesting for structural health monitoring of water pipes. Cell Rep. Phys. Sci. 2021, 2, 100434. [Google Scholar] [CrossRef]
- Karasek, F.; Tiernay, J. Analytical performance of the piezoelectric crystal detector. J. Chromatogr. A 1974, 89, 31–38. [Google Scholar] [CrossRef]
- Karasek, F.; Guy, P.; Hill, H.; Tiernay, J. Chromatographic design and temperature-related characteristics of the piezoelectric detector. J. Chromatogr. A 1976, 124, 179–186. [Google Scholar] [CrossRef]
- Drake, P. The Development of Quartz Crystal Microbalance Based Chemical Sensors. Ph.D. Dissertation, University of Bath, Bath, UK, 2000. [Google Scholar]
- Edmonds, T.; West, T. A quartz crystal piezoelectric device for monitoring organic gaseous pollutants. Anal. Chim. Acta 1980, 117, 147–157. [Google Scholar] [CrossRef]
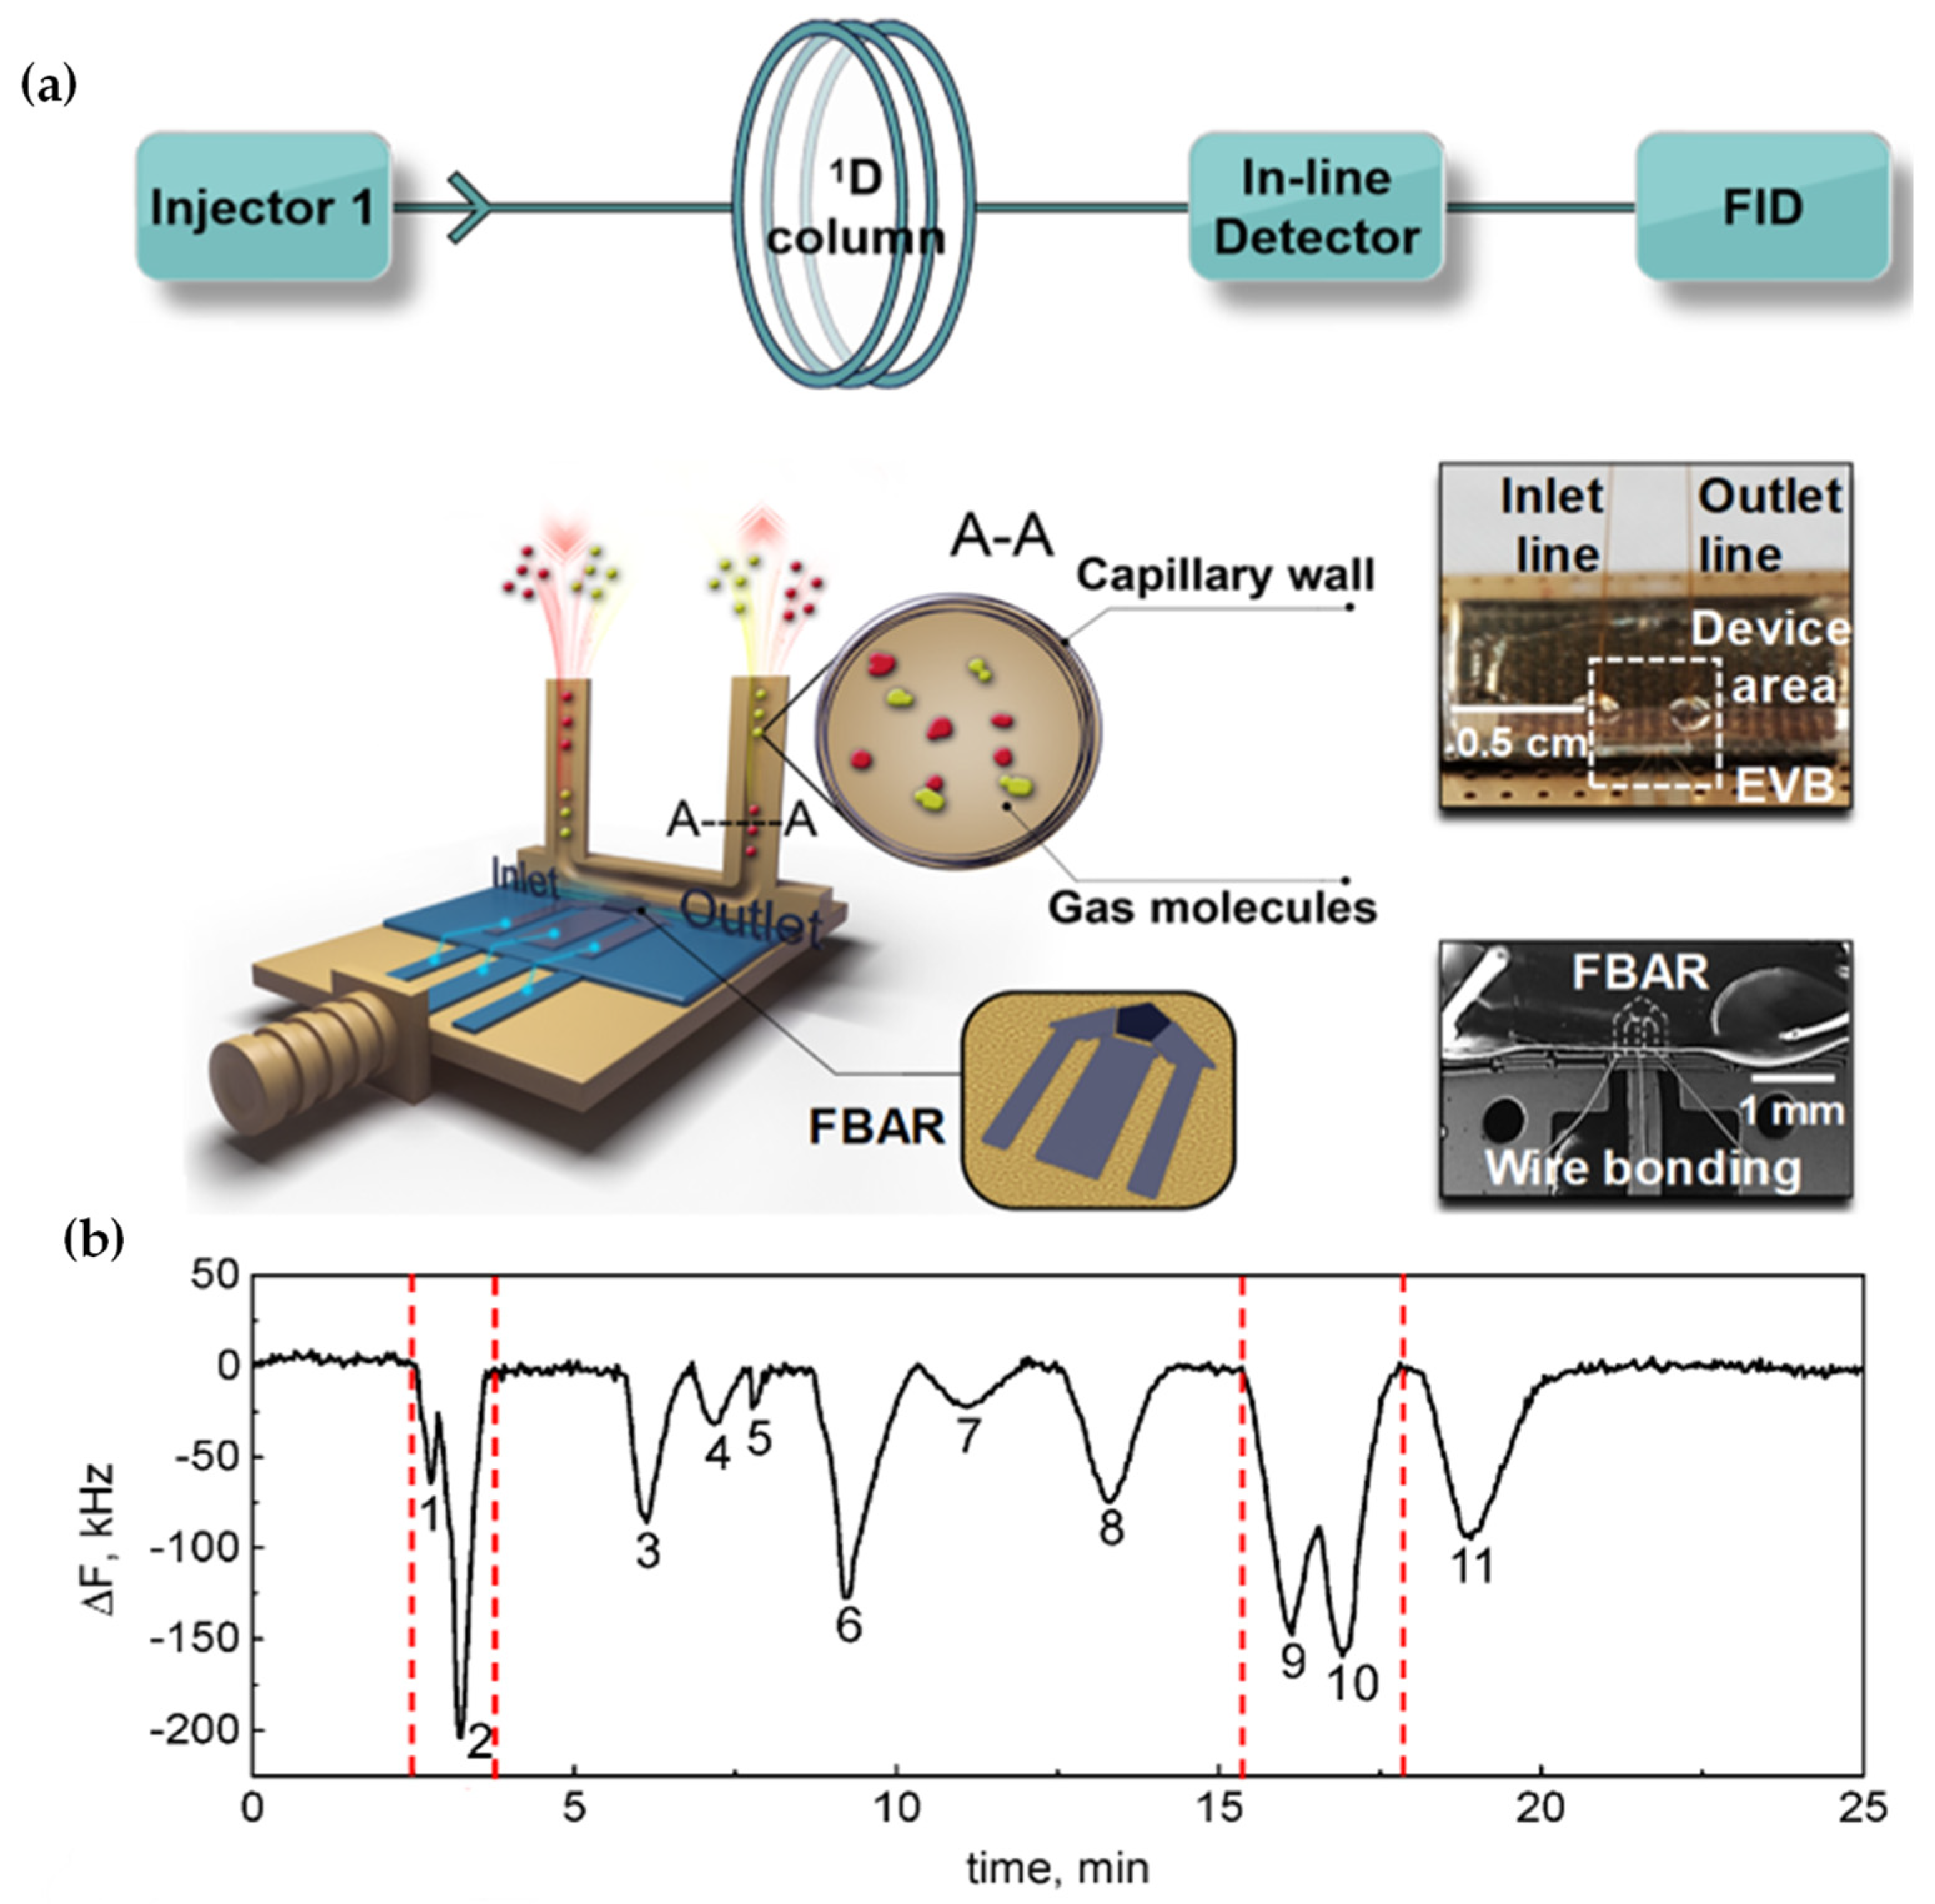
- Hu, J.; Qu, H.; Pang, W.; Duan, X. In-Line Detection with Microfluidic Bulk Acoustic Wave Resonator Gas Sensor for Gas Chromatography. Sensors 2021, 21, 6800. [Google Scholar] [CrossRef] [PubMed]
- Yen, T.-Y.; Yao, D.-J. Detection of the Freshness of Kiwifruit With a TD-GC-MS and a Gas-Sensing Array Based on the Surface-Acoustic-Wave Technique. IEEE Trans. NanoBiosci. 2021, 21, 363–369. [Google Scholar] [CrossRef] [PubMed]
- Christofides, C.; Mandelis, A. Solid-state sensors for trace hydrogen gas detection. J. Appl. Phys. 1990, 68, R1–R30. [Google Scholar] [CrossRef]
- Thomas, J.H.; Sharma, S.P.; Iii, J.H.T. Adsorption and desorption of water on Au by the quartz-crystal-oscillator method. J. Vac. Sci. Technol. 1976, 13, 549–551. [Google Scholar] [CrossRef]
- Smith, J.R.; Phelps, P. Septic arthritis, gout, pseudogout and osteoarthritis in the knee of a patient with multiple myeloma. Arthritis Rheum. 1972, 15, 89–96. [Google Scholar] [CrossRef]
- Konash, P.L.; Bastiaans, G.J. Piezoelectric crystals as detectors in liquid chromatography. Anal. Chem. 1980, 52, 1929–1931. [Google Scholar] [CrossRef]
- Oda, S.; Sawada, T. Laser-induced photoacoustic detector for high-performance liquid chromatography. Anal. Chem. 1981, 53, 471–474. [Google Scholar] [CrossRef]
- Kartanas, T.; Levin, A.; Toprakcioglu, Z.; Scheidt, T.; Hakala, T.A.; Charmet, J.; Knowles, T.P. Label-free protein analysis using liquid chromatography with gravimetric detection. Anal. Chem. 2021, 93, 2848–2853. [Google Scholar] [CrossRef]
- Jones, J.L.; Mieure, J.P. Piezoelectric transducer for determination of metals at the micromolar level. Anal. Chem. 1969, 41, 484–490. [Google Scholar] [CrossRef]
- Nomura, T.; Mimatsu, T. Electrolytic determination of traces of iodide in solution with a piezoelectric quartz crystal. Anal. Chim. Acta 1982, 143, 237–241. [Google Scholar] [CrossRef]
- Nomura, T.; Maruyama, M. Effect of metal ions on a piezoelectric quartz crystal in aqueous solution and the adsorptive determination of iron(III) as phosphate. Anal. Chim. Acta 1983, 147, 365–369. [Google Scholar] [CrossRef]
- Ekrami, E.; Pouresmaieli, M.; Shariati, P.; Mahmoudifard, M. A review on designing biosensors for the detection of trace metals. Appl. Geochem. 2021, 127, 104902. [Google Scholar] [CrossRef]
- Eddaif, L.; Shaban, A.; Telegdi, J. Sensitive detection of heavy metals ions based on the calixarene derivatives-modified piezoelectric resonators: A review. Int. J. Environ. Anal. Chem. 2019, 99, 824–853. [Google Scholar] [CrossRef] [Green Version]
- Sartore, L.; Barbaglio, M.; Borgese, L.; Bontempi, E. Polymer-grafted QCM chemical sensor and application to heavy metal ions real time detection. Sens. Actuators B Chem. 2011, 155, 538–544. [Google Scholar] [CrossRef] [PubMed] [Green Version]
- Hüseynli, S.; Çimen, D.; Bereli, N.; Denizli, A. Molecular Imprinted Based Quartz Crystal Microbalance Nanosensors for Mercury Detection. Glob. Chall. 2018, 3, 1800071. [Google Scholar] [CrossRef]
- Narita, F.; Wang, Z.; Kurita, H.; Li, Z.; Shi, Y.; Jia, Y.; Soutis, C. A Review of Piezoelectric and Magnetostrictive Biosensor Materials for Detection of COVID-19 and Other Viruses. Adv. Mater. 2020, 33, e2005448. [Google Scholar] [CrossRef]
- Huang, J.; Chen, B.; Fu, W.; Huang, Q.; Wang, J.; Liu, M. Detection of Human Papilloma Virus with Piezoelectric Quartz Crystal Genesensors Superconductivity and Quantum Phase Transition View project Ras localization and its relative function View project Detection of Human Papilloma Virus with Piezoelectric Quartz Crystal Genesensors. Sens. Transducers Mag. (S&T e-Dig.) 2004, 42, 214–219. Available online: http://www.sensorsportal.com (accessed on 25 October 2022).
- Kleo, K.; Kapp, A.; Ascher, L.; Lisdat, F. Detection of vaccinia virus DNA by quartz crystal microbalance. Anal. Biochem. 2011, 418, 260–266. [Google Scholar] [CrossRef]
- Wu, T.-Z.; Su, C.-C.; Chen, L.-K.; Yang, H.-H.; Tai, D.-F.; Peng, K.-C. Piezoelectric immunochip for the detection of dengue fever in viremia phase. Biosens. Bioelectron. 2005, 21, 689–695. [Google Scholar] [CrossRef] [PubMed]
- Baca, J.T.; Severns, V.; Lovato, D.; Branch, D.W.; Larson, R.S. Rapid Detection of Ebola Virus with a Reagent-Free, Point-of-Care Biosensor. Sensors 2015, 15, 8605–8614. [Google Scholar] [CrossRef] [Green Version]
- Jiang, Y.; Tan, C.Y.; Tan, S.Y.; Wong, M.S.F.; Chen, Y.F.; Zhang, L.; Yao, K.; Gan, S.K.E.; Verma, C.; Tan, Y.-J. SAW sensor for Influenza A virus detection enabled with efficient surface functionalization. Sens. Actuators B Chem. 2014, 209, 78–84. [Google Scholar] [CrossRef]
- Xu, T.; Miao, J.; Wang, Z.; Yu, L.; Li, C.M. Micro-piezoelectric immunoassay chip for simultaneous detection of Hepatitis B virus and α-fetoprotein. Sens. Actuators B Chem. 2011, 151, 370–376. [Google Scholar] [CrossRef]
- Giri, B.; Pandey, S.; Shrestha, R.; Pokharel, K.; Ligler, F.S.; Neupane, B.B. Review of analytical performance of COVID-19 detection methods. Anal. Bioanal. Chem. 2020, 413, 35–48. [Google Scholar] [CrossRef] [PubMed]
- Zuo, B.; Li, S.; Guo, Z.; Zhang, J.; Chen, C. Piezoelectric Immunosensor for SARS-Associated Coronavirus in Sputum. Anal. Chem. 2004, 76, 3536–3540. [Google Scholar] [CrossRef]
- Pandey, L.M. Design of engineered surfaces for prospective detection of SARS-CoV-2 using quartz crystal microbalance-based techniques. Expert Rev. Proteom. 2020, 17, 425–432. [Google Scholar] [CrossRef]
- Cheney, J.; Norwood, T.; Homolya, J. The Detection of Sulfur Dioxide Utilizing a Piezo-Electric Crystal Coated with Ethylenedinitrilotetraethanol. Anal. Lett. 1976, 9, 361–377. [Google Scholar] [CrossRef]
- Guilbault, G.G.; Lopez-Roman, A. Use of Sodium Tetrachloromercuriate as a Substrate for the Determination of So2 on the Piezocrystal Detector. Environ. Lett. 1971, 2, 35–45. [Google Scholar] [CrossRef]
- Cheney, J.L.; Homolya, J.B. The development of a sulfur dioxide continuous monitor incorporating a piezo-electric sorption detector. Sci. Total Environ. 1976, 5, 69–77. [Google Scholar] [CrossRef]
- Wade, W.H.; Slutsky, L.J. Adsorption on Quartz Single Crystals. In Vacuum Microbalance Techniques; Springer: Boston, MA, USA, 1962; pp. 115–128. [Google Scholar] [CrossRef]
- Guilbault, G.G.; Lopez-Roman, A.; Billedeau, S. Gas-phase reactions of mono-, di-, and trimethylamine with various metal salts: The use of piezoelectric crystals in a vacuum system. Anal. Chim. Acta 1972, 58, 421–427. [Google Scholar] [CrossRef]
- Karmarkar, K.H.; Webber, L.M.; Guilbault, G.G. Measurement of SO 2 in Air Using Coated Piezoelectric Crystal Detectors. Environ. Lett. 1975, 8, 345–352. [Google Scholar] [CrossRef]
- Karmarkar, K.; Guilbault, G. A new design and coatings for piezoelectric crystals in measurement of trace amounts of sulfur dioxide. Anal. Chim. Acta 1974, 71, 419–424. [Google Scholar] [CrossRef]
- Frechette, M.W.; Fasching, J.L.; Rosie, D.M. Evaluation of substrates for use on a piezoelectric detector for sulfur dioxide. Anal. Chem. 1973, 45, 1765–1766. [Google Scholar] [CrossRef]
- Frechette, M.W.; Fasching, J.L. Simple Piezoelectric Probe for Detection and Measurement of SO2. Environ. Sci. Technol. 1973, 7, 1135–1137. [Google Scholar] [CrossRef]
- Webber, L.; Karmarkar, K.; Guilbault, G. A coated piezoelectric crystal detector for the selective detection and determination of hydrogen sulfide in the atmosphere. Anal. Chim. Acta 1978, 97, 29–35. [Google Scholar] [CrossRef]
- Hlavay, J.; Guilbault, G.G. Applications of the piezoelectric crystal detector in analytical chemistry. Anal. Chem. 1977, 49, 1890–1898. [Google Scholar] [CrossRef]
- Webber, L.M.; Guilbault, G.G. Coated piezoelectric crystal detector for selective detection of ammonia in the atmosphere. Anal. Chem. 1976, 48, 2244–2247. [Google Scholar] [CrossRef]
- Tomita, Y.; Guilbault, G.G. Coating for a piezoelectric crystal sensitive to organophosphorus pesticides. Anal. Chem. 1980, 52, 1484–1489. [Google Scholar] [CrossRef]
- Suleiman, A.; Guilbault, G. Piezoelectric Crystal Detectors for Environmental Pollutants. Stud. Environ. Sci. 1994, 59, 273–303. [Google Scholar] [CrossRef]
- Shackelford, W.M.; Guilbault, G.G. A piezoelectric detector for organophosphorus pesticides in the air. Anal. Chim. Acta 1974, 73, 383–389. [Google Scholar] [CrossRef] [PubMed]
- Scheide, E.P.; Guilbault, G.G. Piezoelectric detectors for organophosphorus compounds and pesticides. Anal. Chem. 1972, 44, 1764–1768. [Google Scholar] [CrossRef]
- Nomura, T.; Hattori, O. Determination of micromolar concentrations of cyanide in solution with a piezoelectric detector. Anal. Chim. Acta 1980, 115, 323–326. [Google Scholar] [CrossRef]
- Nomura, T. Single-drop method for determination of cyanide in solution with a piezoelectric quartz crystal. Anal. Chim. Acta 1981, 124, 81–84. [Google Scholar] [CrossRef]
- Morris, R.G.; Downes, J.J.; Sahakian, B.J.; Evenden, J.L.; Heald, A.; Robbins, T.W. Planning and spatial working memory in Parkinson’s disease. J. Neurol. Neurosurg. Psychiatry 1988, 51, 757–766. [Google Scholar] [CrossRef] [Green Version]
- Nomura, T.; Okuhara, M. Frequency shifts of piezoelectric quartz crystals immersed in organic liquids. Anal. Chim. Acta 1982, 142, 281–284. [Google Scholar] [CrossRef]
- Nomura, T.; Tsuge, K. Determination of silver in solution with a piezoelectric detector after electrodeposition. Anal. Chim. Acta 1985, 169, 257–262. [Google Scholar] [CrossRef]
- Nomura, T.; Watanabe, M.; West, T. Behaviour of piezoelectric quartz crystals in solutions with application to the determination of iodide. Anal. Chim. Acta 1985, 175, 107–116. [Google Scholar] [CrossRef]
- Daley, P.S.; Lundgren, D.A. The Performance of Piezoelectric Crystal Sensors Used to Determine Aerosol Mass Concentrations. Am. Ind. Hyg. Assoc. J. 1975, 36, 518–532. [Google Scholar] [CrossRef]
- Olin, J.G.; Sem, G.J. Piezoelectric microbalance for monitoring the mass concentration of suspended particles. Atmos. Environ. (1967) 1971, 5, 653–668. [Google Scholar] [CrossRef]
- Liu, B.Y. Fine Particles: Aerosol Generation, Measurement, Sampling and Analysis; Academic Press: New York, NY, USA, 1976. [Google Scholar]
- Karmarkar, K.; Webber, L.; Guilbault, G. Measurement of sulfur dioxide in automobile exhausts and industrial stack gases with a coated piezoelectric crystal detector. Anal. Chim. Acta 1976, 81, 265–271. [Google Scholar] [CrossRef] [PubMed]
- Tomita, Y.; Ho, M.H.; Guilbault, G.G. Detection of explosives with a coated piezoelectric quartz crystal. Anal. Chem. 1979, 51, 1475–1478. [Google Scholar] [CrossRef]
- Behrndt, K.; Love, R. Automatic control of film-deposition rate with the crystal oscillator for preparation of alloy films. Vacuum 1962, 12, 1–9. [Google Scholar] [CrossRef]
- Oberg, P.; Lingensjo, J. Crystal Film Thickness Monitor. Rev. Sci. Instrum. 1959, 30, 1053. [Google Scholar] [CrossRef]
- Richardson, P.D. Discussion of paper by W. H. King., Jr.: The use of resonating devices to make small mass measurements. Bull. N. Y. Acad. Med. 1972, 48, 465–467. [Google Scholar]
- Hammond, D.L.; Benjaminson, A. The crystal resonator- a digital transducer. IEEE Spectr. 1969, 6, 53–58. [Google Scholar] [CrossRef]
- King, W.H.; Camilli, C.T.; Findeis, A.F. Thin Film Thermocouples for Differential Thermal Analysis. Anal. Chem. 1968, 40, 1330–1335. [Google Scholar] [CrossRef]


| Author | Accomplishments | Piezoelectric Materials | Highlights | Conclusion | References |
|---|---|---|---|---|---|
| Li et al. | Considering the range of piezo-electric coefficients, manufacturability, coupling factors, material selection, output power, quality factor, energy density | PVDF, Pu, Cellular PP, PVDF-TrFE, Piezoelectric ceramics, Piezoelectric composite, Quartz | Learn about the techniques created to increase the output performance of PEH devices as well as the current status of research on PEH devices for low-frequency applications. Find out ways to optimize your piezoelectric energy collector designs and how to select the ideal piezoelectric material for your specific application | Life extension, size reduction, durability, energy density, manufacturability, and biocompatibility | [60] |
| Narita and Fox | Considering the range of piezo-electric coefficients, mechanical strength, manufacturability, energy density, output power | Piezoelectric micro/macrofibres, PVDF-TrFE, PVDF, Pu, Cellular PP, Quartz, Piezoelectric ceramics, Piezoelectric composites | Effectiveness of PZT-based PEH with various structural variations has been observed. By contrasting the results of various piezoelectric environmental harvesters, recent developments in the area of PVDF-PEH and polymer-based piezoelectric composite have been described | Longer life, reduced size, durability, energy density, manufacturability, and biocompatibility | [61] |
| Lefeuvre | Considering the range of coupling coefficients, energy density, output power | PVDF, Pu, cellular PP, PVDF-TrFE, Quartz | Efficiency rating for energy transformation. For piezoelectric materials, a merit Figure. Explain a comparison of power interfaces with one, two, and three stages | Piezoelectric material selection strategy | [62] |
| Safaei et al. | Considering the range of piezoelectric coefficient, stiffness, manufacturability, energy density, output power | Piezoelectric micro/macrofibres, Ceramic nanofiber, Polymer nanofiber, Piezoelectric nanowire, Micro/nanofiber, Wire composite material, Piezoelectric ceramic, Piezoelectric Foam, Quartz, Piezoelectric composite | There have been reports of recent developments in the area of piezoelectric materials. An analysis of certain recent piezo materials, i.e., piezo foams and the hot materials | Piezoelectric material selection strategy | [63] |
| Liu et al. | Consideration of piezoelectric coefficients, material selection guidelines, manufacturability, energy density, power range | Ceramic nanofibers, Polymer nanofibers, PVDF, Pu, Cellular PP, PVDF-TrFE, Piezoelectric ceramics, Piezoelectric foam, Quartz | A discussion of recent developments in the study of piezoelectric materials. Description of various production processes for piezoelectric materials used in energy-harvesting applications. A discussion of the main frequency bandwidth expansion methods. Discover the types of piezoelectric materials, how they are made, and how to expand their frequency range | Increased lifespan, size reduction, durability, energy density, manufacturability, and biocompatibility | [64] |
| Zaarour et al. | Consideration of manufacturability, mechanical strength, material selection guidelines, power spectrum or energy density | Piezoelectric micro/macrofibre, Ceramic nanofiber, Polymer nanofiber, Micro/nanofiber, Wire composite material, Piezoelectric nanowire | Manufacturing of nanofiber and wire. References to output current and voltage in nano- and micromaterials. Discover how to compare nano- and micromaterials according to their active area, maximum voltage, and current | Increased lifespan, size reduction, durability, energy density, manufacturability, and biocompatibility | [65] |
| Yuan et al. | Considering the range of piezoelectric coefficient, quality coefficient, mechanical strength, energy density, output power, stiffness | PVDF, Pu, Cellular-PP, PVDF-TrFE, Piezoelectric ceramics | Introduction of dielectric electroactive polymers and electro strain. Comparison of PZT, PVDF, and electrostrictive polymers in terms of their performance. Describes the difficulties in using dielectrically electroactive polymers in industry | Cost of piezoelectric materials | [66] |
| Mishra et al. | Piezoelectric coefficient, coupling coefficient, manufacturability | PVDF, Pu, Cellular PP, PVDF-TrFE, Piezoelectric ceramics, Piezoelectric composite, Quartz | This article primarily aims to compare significant forms of piezoelectric composites and polymers and explore the fundamental theories underlying the piezoelectric behavior of composite and polymer systems. The piezoelectric characteristics of numerous piezoelectric polymers and polymer composites are discussed in this article | Piezoelectric material selection strategy | [67] |
| Bowen et al. | Piezoelectric coefficients, coupling factors | PVDF, Pu, Cellular PP, PVDF-TrFE, Quartz, Piezoelectric ceramic | Discover some trending topics like nanoscale pyroelectric systems, piezoelectric focusing, and pyroelectric-based harvesting | Selection strategies for piezoelectric materials | [68] |
| Mukherjee and Datta | Piezoelectric coefficient, coupling coefficient, material selection guideline, quality coefficient | Piezoelectric ceramics | Discussion on the impact of the load resistance on PEHs’ output power. Discussion regarding piezoelectric ceramic selection criteria | Cost of piezoelectric materials | [69] |
| Coating Material | Coating Method | Sampling Method | Detection Limit ppm | Interference | Results | References |
|---|---|---|---|---|---|---|
| Ethylenedinitrillo-tetraethanol | Smearing with cotton swabs | Flow System in N2 | 1 ppm | NO2 | Investigated the position of the coating material | [144] |
| Triethanolamine | - | Gas handling apparatus, EPA method | 25 ppm | NO2 | Investigation of the response time and the nature of the absorption | [146] |
| Carbowax 400, 20 M; polyphenyl ether; DNP; β, β-oxidipropio-nitrite; triethanolamine; SAIB (sucrose acetate isobutyrate); squalane; amine 220 | Dropping | Gas handling apparatus | 5 ppm | - | Response time was investigated | [147] |
| Quadrol | Smearing with a tiny brush | Syringe dilution | 20 ppm -50 ppm in the auto exhausts and up to 300 ppm in the stack gases | NO2 | Portable design | [148] |
| Quadrol | Smearing with a tiny brush | Syringe dilution | 1 ppb | NO2 | Hydrophobic membrane used to eliminate interference | [149] |
| Apiezon; sodium tetra chloro-mercurate; silicone SE-30; carbowax 20 M; silicon QF-1; versamid 900 | Spraying | Gas-tight syringe | 5 ppm | - | Effect of change of voltage was investigated | [145] |
| Amine 220; ρ-toluidine; triethanolamine; armeen 2S; quadrol | Smearing with a tiny brush | Syringe dilution | 1.0 ppb | NO2, moisture | New cells design | [150] |
| Styrene-dimethyl-aminopropyl-maleimide (1:1 copolymer) | Dropping with syringe | Gas-tight syringe | 0.1 ppm | NO2, moisture | Portable device | [152] |
| Igepal CO-880; tridodecylamine; diallylamine; SDM polymer; tripropylamine; phenyldiethanolamine PP-2040 | - | Gas-tight syringe or gas sampling valve | 5 ppm | NO2 | - | [151] |
Disclaimer/Publisher’s Note: The statements, opinions and data contained in all publications are solely those of the individual author(s) and contributor(s) and not of MDPI and/or the editor(s). MDPI and/or the editor(s) disclaim responsibility for any injury to people or property resulting from any ideas, methods, instructions or products referred to in the content. |
© 2023 by the authors. Licensee MDPI, Basel, Switzerland. This article is an open access article distributed under the terms and conditions of the Creative Commons Attribution (CC BY) license (https://creativecommons.org/licenses/by/4.0/).
Share and Cite
Shaukat, H.; Ali, A.; Bibi, S.; Altabey, W.A.; Noori, M.; Kouritem, S.A. A Review of the Recent Advances in Piezoelectric Materials, Energy Harvester Structures, and Their Applications in Analytical Chemistry. Appl. Sci. 2023, 13, 1300. https://doi.org/10.3390/app13031300
Shaukat H, Ali A, Bibi S, Altabey WA, Noori M, Kouritem SA. A Review of the Recent Advances in Piezoelectric Materials, Energy Harvester Structures, and Their Applications in Analytical Chemistry. Applied Sciences. 2023; 13(3):1300. https://doi.org/10.3390/app13031300
Chicago/Turabian StyleShaukat, Hamna, Ahsan Ali, Saira Bibi, Wael A. Altabey, Mohammad Noori, and Sallam A. Kouritem. 2023. "A Review of the Recent Advances in Piezoelectric Materials, Energy Harvester Structures, and Their Applications in Analytical Chemistry" Applied Sciences 13, no. 3: 1300. https://doi.org/10.3390/app13031300
APA StyleShaukat, H., Ali, A., Bibi, S., Altabey, W. A., Noori, M., & Kouritem, S. A. (2023). A Review of the Recent Advances in Piezoelectric Materials, Energy Harvester Structures, and Their Applications in Analytical Chemistry. Applied Sciences, 13(3), 1300. https://doi.org/10.3390/app13031300