
Micro-Computed Tomography Beamline of the Australian Synchrotron: Micron-Size Spatial Resolution X-ray Imaging
 ,
,  ,
,  , ,
, ,
Abstract
:1. Introduction
2. Early Development in MCT Beamline
2.1. The First Light
2.2. X-ray Detector
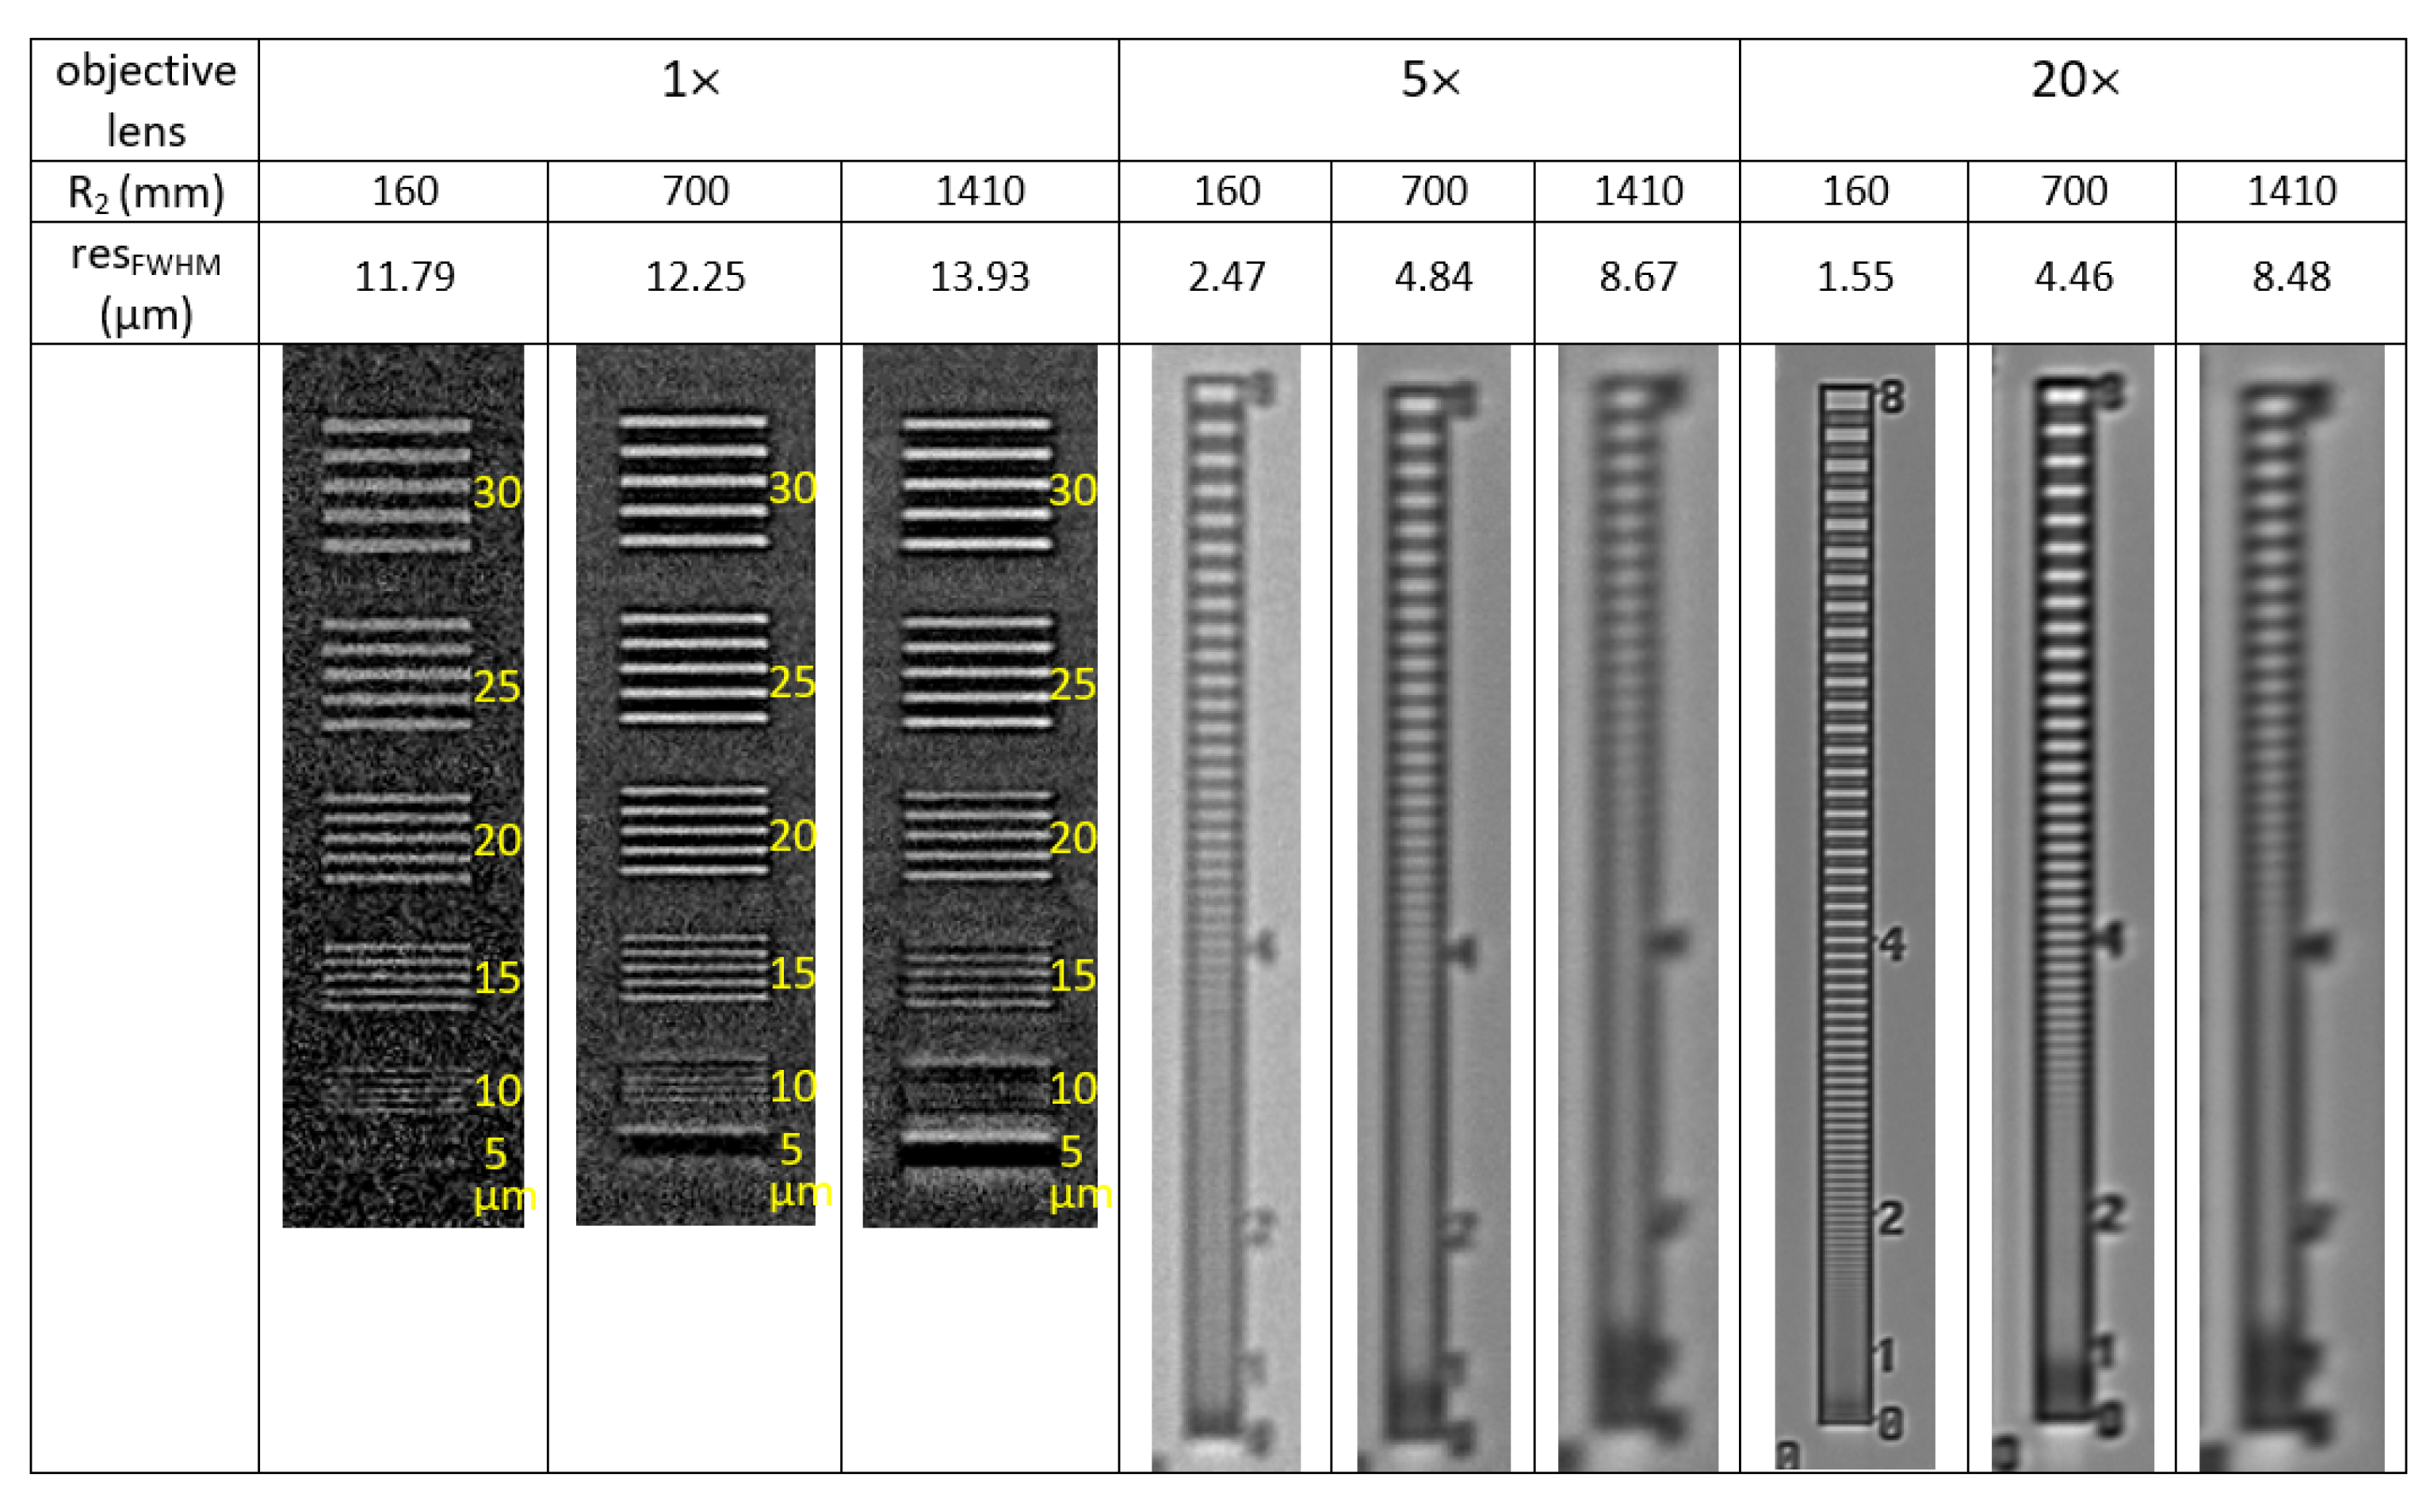
2.3. Spatial Resolution of the White-Beam Detector
3. Imaging Results from Hot Commissioning Stage
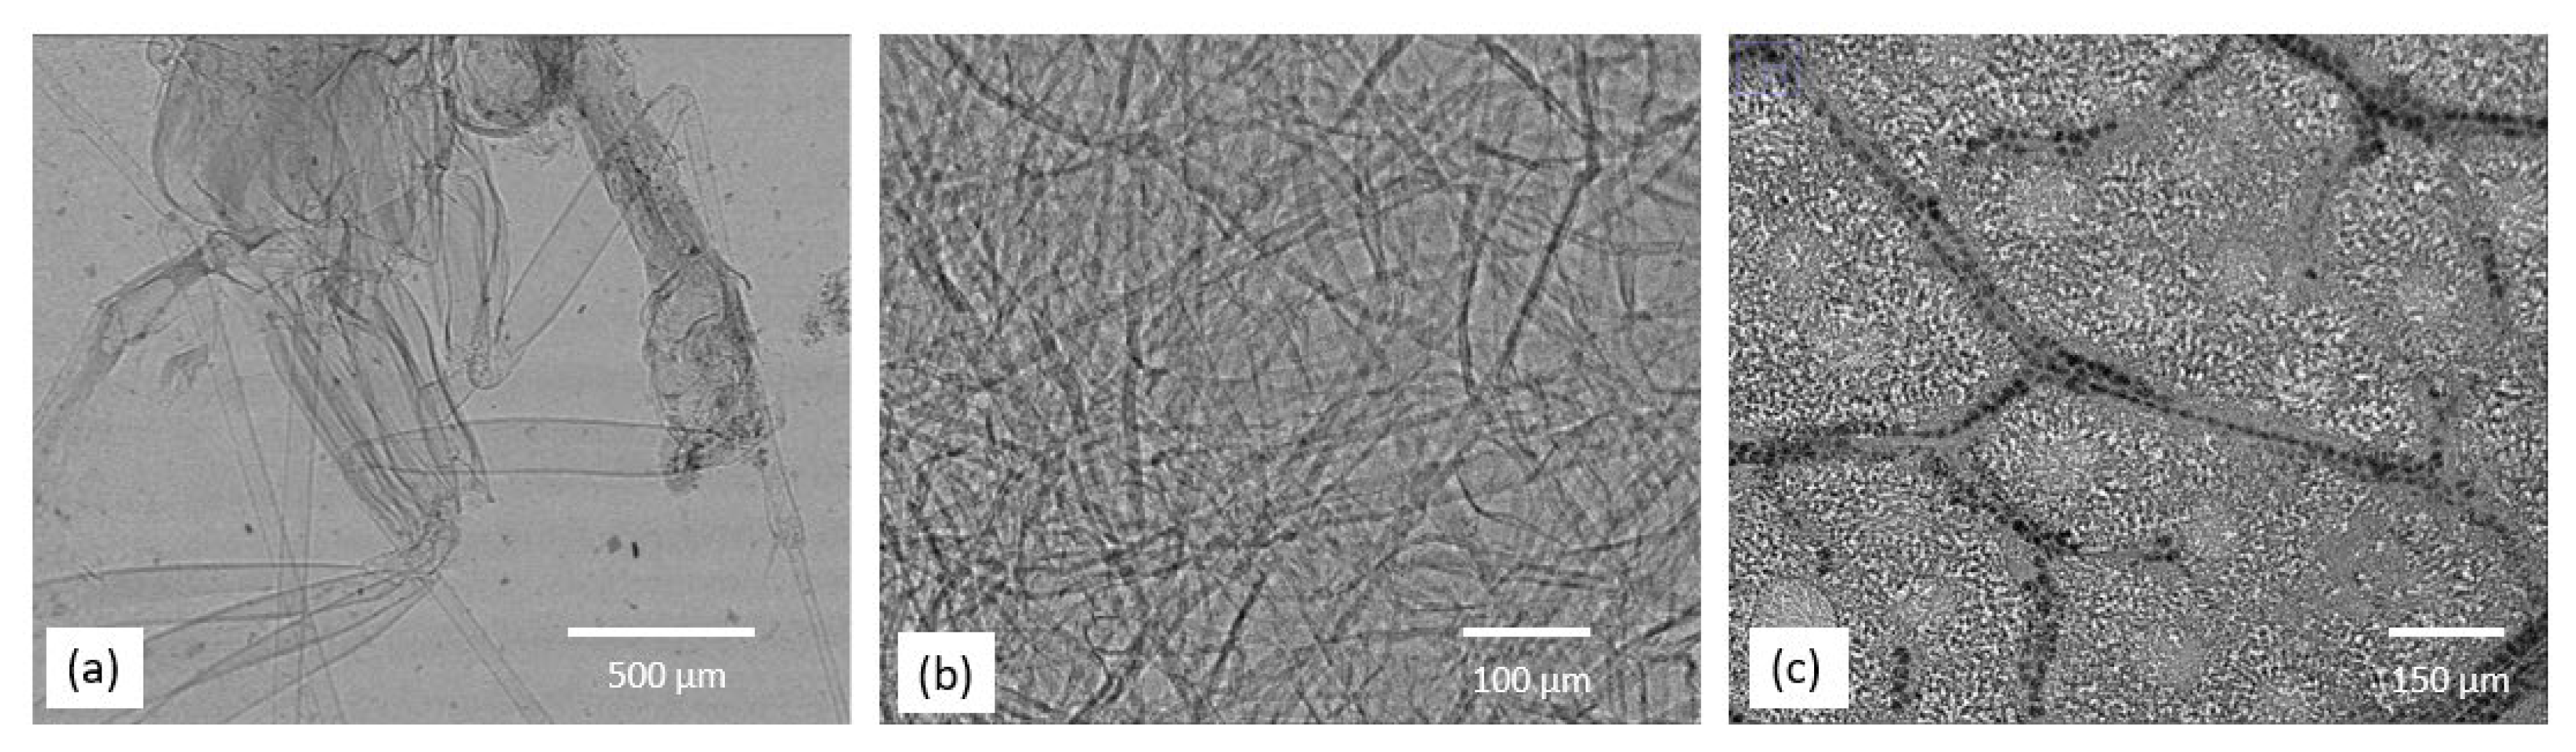
3.1. X-ray Phase Contrast Result
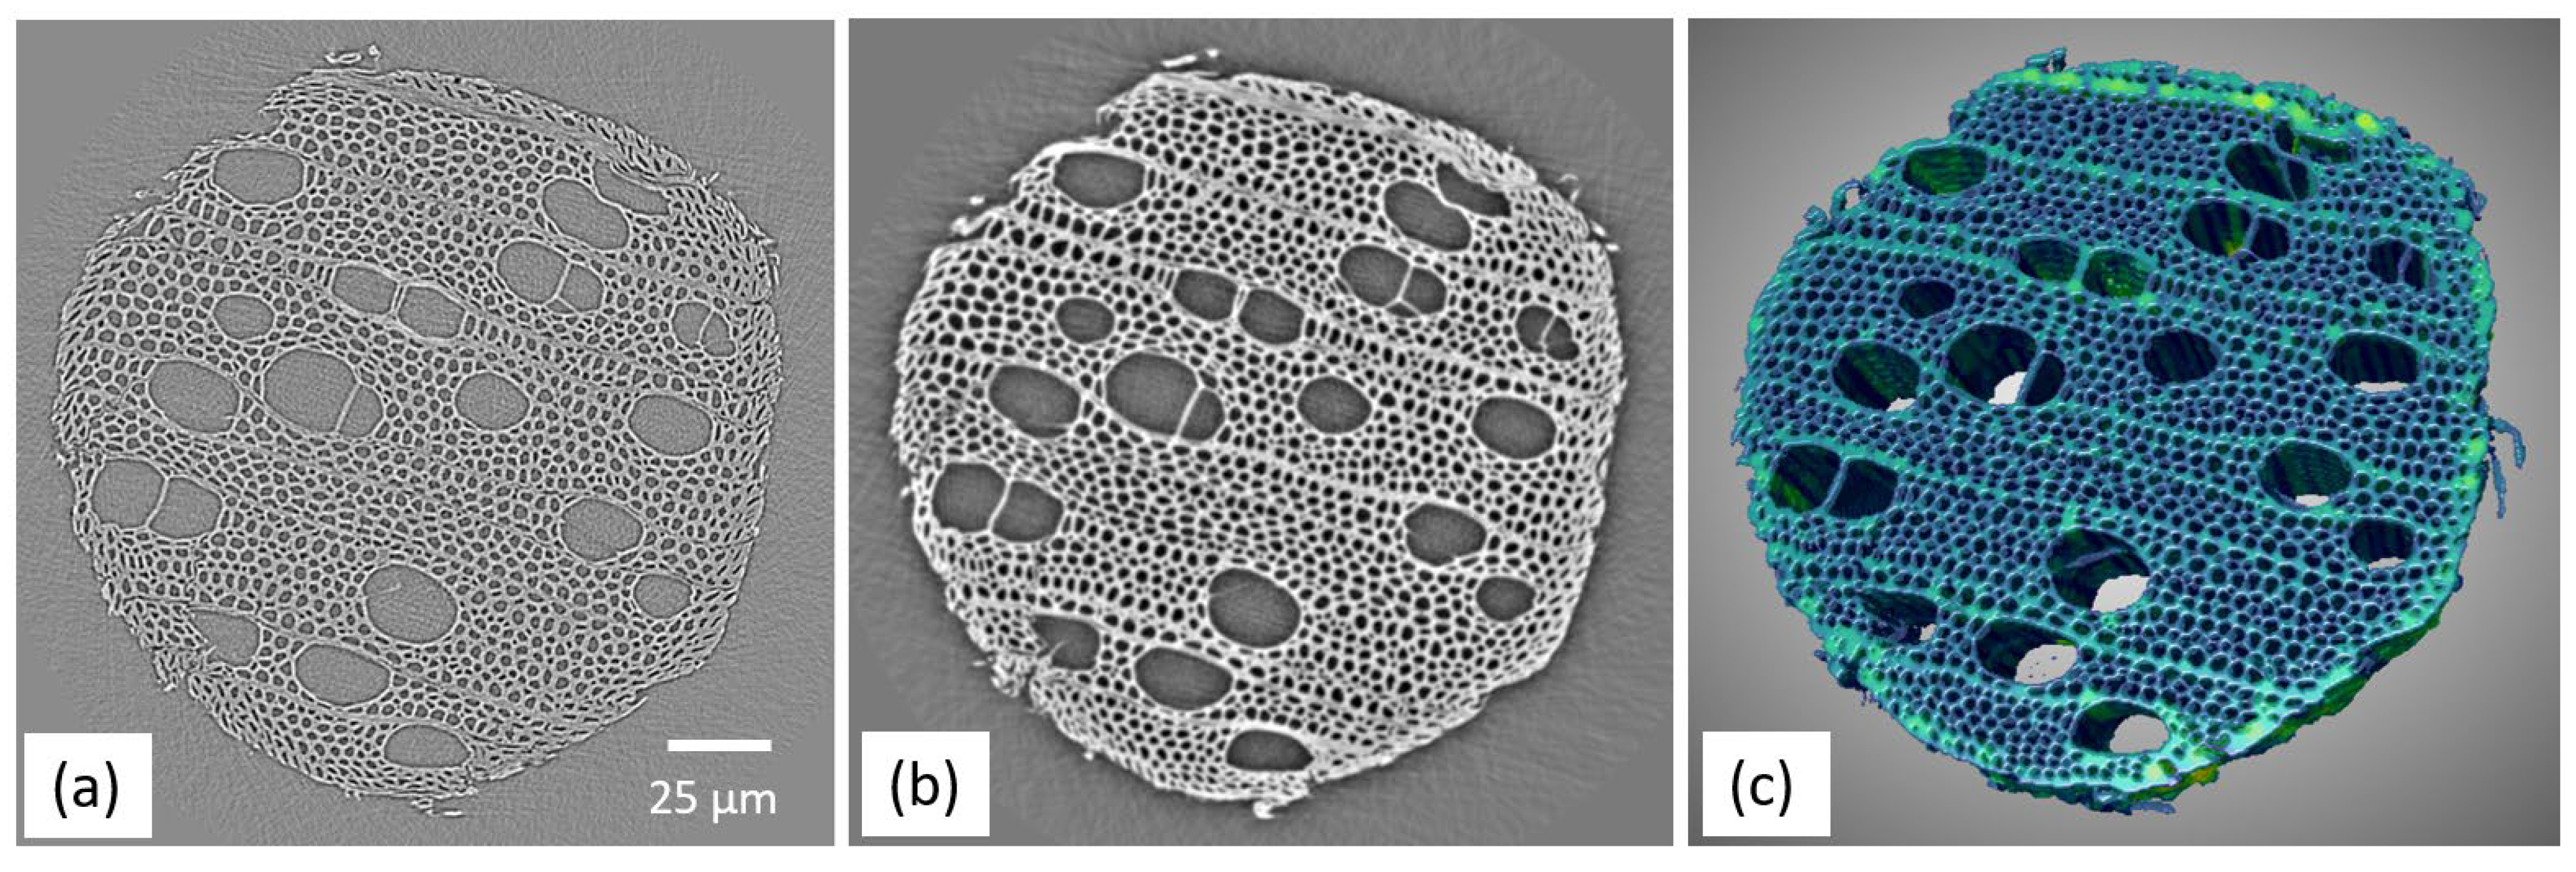
3.2. X-ray Phase Contrast CT Result
4. Conclusions
Author Contributions
Funding
Institutional Review Board Statement
Informed Consent Statement
Data Availability Statement
Acknowledgments
Conflicts of Interest
References
- Gureyev, T.E.; Paganin, D.M.; Myers, G.R.; Nesterets, Y.I.; Wilkins, S.W. Phase-and-amplitude computer tomography. Appl. Phys. Lett. 2006, 89, 034102. [Google Scholar] [CrossRef]
- Stevenson, A.W.; Hall, C.J.; Mayo, S.C.; Häusermann, D.; Maksimenko, A.; Gureyev, T.E.; Nesterets, Y.I.; Wilkins, S.W.; Lewis, R.A. Analysis and interpretation of the first monochromatic X-ray tomography data collected at the Australian Synchrotron Imaging and Medical beamline. J. Synchrotron Radiat. 2012, 19, 728–750. [Google Scholar] [CrossRef]
- Snigirev, A.; Snigireva, I.; Kohn, V.; Kuznetsov, S.; Schelokov, I. On the possibilities of x-ray phase contrast microimaging by coherent high-energy synchrotron radiation. Rev. Sci. Instrum. 1995, 66, 5486–5492. [Google Scholar] [CrossRef]
- Wilkins, S.W.; Gureyev, T.E.; Gao, D.; Pogany, A.; Stevenson, A.W. Phase-contrast imaging using polychromatic hard X-rays. Nature 1996, 384, 335–338. [Google Scholar] [CrossRef]
- Morgan, K.S.; Paganin, D.M.; Siu, K.K.W. Quantitative single-exposure x-ray phase contrast imaging using a single attenuation grid. Opt. Express 2011, 19, 19781–19789. [Google Scholar] [CrossRef]
- Weitkamp, T.; Diaz, A.; David, C.; Pfeiffer, F.; Stampanoni, M.; Cloetens, P.; Ziegler, E. X-ray phase imaging with a grating interferometer. Opt. Express 2005, 13, 6296–6304. [Google Scholar] [CrossRef]
- Pavlov, K.M.; Li, H.; Paganin, D.M.; Berujon, S.; Rougé-Labriet, H.; Brun, E. Single-Shot X-Ray Speckle-Based Imaging of a Single-Material Object. Phys. Rev. Appl. 2020, 13, 054023. [Google Scholar] [CrossRef]
- Morgan, K.S.; Paganin, D.M.; Siu, K.K.W. X-ray phase imaging with a paper analyzer. Appl. Phys. Lett. 2012, 100, 124102. [Google Scholar] [CrossRef]
- Bérujon, S.; Ziegler, E.; Cerbino, R.; Peverini, L. Two-Dimensional X-Ray Beam Phase Sensing. Phys. Rev. Lett. 2012, 108, 158102. [Google Scholar] [CrossRef] [Green Version]
- Gureyev, T.E.; Paganin, D.M.; Arhatari, B.; Taba, S.T.; Lewis, S.; Brennan, P.C.; Quiney, H.M. Dark-field signal extraction in propagation-based phase-contrast imaging. Phys. Med. Biol. 2020, 65, 215029. [Google Scholar] [CrossRef]
- Stampanoni, M.; Mokso, R.; Marone, F.; Vila-Comamala, J.; Gorelick, S.; Trtik, P.; Jefimovs, K.; David, C. Phase-contrast tomography at the nanoscale using hard x rays. Phys. Rev. B 2010, 81, 140105. [Google Scholar] [CrossRef] [Green Version]
- Donnelley, M.; Morgan, K.S.; Gradl, R.; Klein, M.; Hausermann, D.; Hall, C.; Maksimenko, A.; Parsons, D.W. Live-pig-airway surface imaging and whole-pig CT at the Australian Synchrotron Imaging and Medical Beamline. J. Synchrotron Radiat. 2019, 26, 175–183. [Google Scholar] [CrossRef] [PubMed]
- Morgan, K.S.; Parsons, D.; Cmielewski, P.; McCarron, A.; Gradl, R.; Farrow, N.; Siu, K.; Takeuchi, A.; Suzuki, Y.; Uesugi, K.; et al. Methods for dynamic synchrotron X-ray respiratory imaging in live animals. J. Synchrotron Radiat. 2020, 27, 164–175. [Google Scholar] [CrossRef] [PubMed]
- Mayo, S.C.; McCann, T.; Day, L.; Favaro, J.; Tuhumury, H.; Thompson, D.; Maksimenko, A. Rising dough and baking bread at the Australian synchrotron. AIP Conf. Proc. 2016, 1696, 020006. [Google Scholar] [CrossRef] [Green Version]
- Khosravani, M.R.; Reinicke, T. On the Use of X-ray Computed Tomography in Assessment of 3D-Printed Components. J. Nondestruct. Eval. 2020, 39, 75. [Google Scholar] [CrossRef]
- Sakellariou, A.; Arns, C.H.; Sheppard, A.P.; Sok, R.M.; Averdunk, H.; Limaye, A.; Jones, A.C.; Senden, T.J.; Knackstedt, M.A. Developing a virtual materials laboratory. Mater. Today 2007, 10, 44–51. [Google Scholar] [CrossRef]
- Beltran, M.A.; Paganin, D.M.; Siu, K.K.W.; Fouras, A.; Hooper, S.B.; Reser, D.H.; Kitchen, M.J. Interface-specific x-ray phase retrieval tomography of complex biological organs. Phys. Med. Biol. 2011, 56, 7353. [Google Scholar] [CrossRef]
- Arhatari, B.D.; De Carlo, F.; Peele, A.G. Direct quantitative tomographic reconstruction for weakly absorbing homogeneous phase objects. Rev. Sci. Instrum. 2007, 78, 053701. [Google Scholar] [CrossRef]
- Gureyev, T.E.; Stevenson, A.W.; Paganin, D.; Mayo, S.C.; Pogany, A.; Gao, D.; Wilkins, S.W. Quantitative methods in phase-contrast X-ray imaging. J. Digit. Imaging 2000, 13, 121–126. [Google Scholar] [CrossRef] [Green Version]
- Nesterets, Y.I.; Gureyev, T.E.; Mayo, S.C.; Stevenson, A.W.; Thompson, D.; Brown, J.M.; Kitchen, M.J.; Pavlov, K.M.; Lockie, D.; Brun, F.; et al. A feasibility study of X-ray phase-contrast mammographic tomography at the Imaging and Medical beamline of the Australian Synchrotron. J. Synchrotron Radiat. 2015, 22, 1509–1523. [Google Scholar] [CrossRef]
- Radon, J. On the determination of functions from their integral values along certain manifolds. IEEE Trans. Med. Imaging 1986, 5, 170–176. [Google Scholar] [CrossRef]
- Yokhana, V.S.K.; Arhatari, B.D.; Gureyev, T.E.; Abbey, B. Soft-tissue differentiation and bone densitometry via energy-discriminating X-ray microCT. Opt. Express 2017, 25, 29328–29341. [Google Scholar] [CrossRef]
- Ingal, V.N.; Beliaevskaya, E.A.; Brianskaya, A.P.; Merkurieva, R.D. Phase mammography—A new technique for breast investigation. Phys. Med. Biol. 1998, 43, 2555–2567. [Google Scholar] [CrossRef]
- Paganin, D.; Mayo, S.; Gureyev, T.E.; Miller, P.R.; Wilkins, S.W. Simultaneous phase and amplitude extraction from a single defocused image of a homogeneous object. J. Microsc. 2002, 206, 33–40. [Google Scholar] [CrossRef]
- Nugent, K.A.; Gureyev, T.E.; Cookson, D.F.; Paganin, D.; Barnea, Z. Quantitative phase imaging using hard X rays. Phys. Rev. Lett. 1996, 77, 2961–2964. [Google Scholar] [CrossRef]
- Koch, A.; Raven, C.; Spanne, P.; Snigirev, A. X-ray imaging with submicrometer resolution employing transparent luminescent screens. J. Opt. Soc. Am. A 1998, 15, 1940–1951. [Google Scholar] [CrossRef] [Green Version]
- Insight Toolkit (ITK). Available online: https://itk.org/ (accessed on 5 December 2021).
- McCormick, M.; Liu, X.; Ibanez, L.; Jomier, J.; Marion, C. ITK: Enabling reproducible research and open science. Front. Neuroinform. 2014, 13, 1–11. [Google Scholar] [CrossRef] [Green Version]
- van Aarle, W.; Palenstijn, W.J.; Cant, J.; Janssens, E.; Bleichrodt, F.; Dabravolski, A.; De Beenhouwer, J.; Joost Batenburg, K.; Sijbers, J. Fast and flexible X-ray tomography using the ASTRA toolbox. Opt. Express 2016, 24, 25129–25147. [Google Scholar] [CrossRef] [Green Version]
- Kak, A.C.; Slaney, M. Principles of Computerized Tomographic Imaging; IEEE Press: New York, NY, USA, 1988. [Google Scholar]
- Marcou, J.; Bosworth, R.; Clarken, R.; Martin, P.; Moll, A. ASCI: A Compute platform for researchers at the Australian Synchrotron. In Proceedings of the 16th International Conference on Accelerator and Large Experimental Physics Control Systems (ICALEPCS 2017), Barcelona, Spain, 8–13 October 2017. [Google Scholar]
- Nesterets, Y.I.; Gureyev, T.E. Noise propagation in x-ray phase-contrast imaging and computed tomography. J. Phys. D Appl. Phys. 2014, 47, 105402. [Google Scholar] [CrossRef]
- Kitchen, M.J.; Buckley, G.A.; Gureyev, T.E.; Wallace, M.J.; Andres-Thio, N.; Uesugi, K.; Yagi, N.; Hooper, S.B. CT dose reduction factors in the thousands using X-ray phase contrast. Sci. Rep. 2017, 7, 15953. [Google Scholar] [CrossRef]


| Objective Lens | NA | Scintillator Thickness (µm) | FOV (mm2) | Effective Pixel Size (µm) | σd (µm) |
|---|---|---|---|---|---|
| 1× | 0.035 | 500 | 16.6 × 14.0 | 6.5 | 5.03 |
| 5× | 0.21 | 35 | 3.3 × 2.8 | 1.3 | 0.97 |
| 20× | 0.42 | 10 | 0.8 × 0.7 | 0.33 | 0.50 |
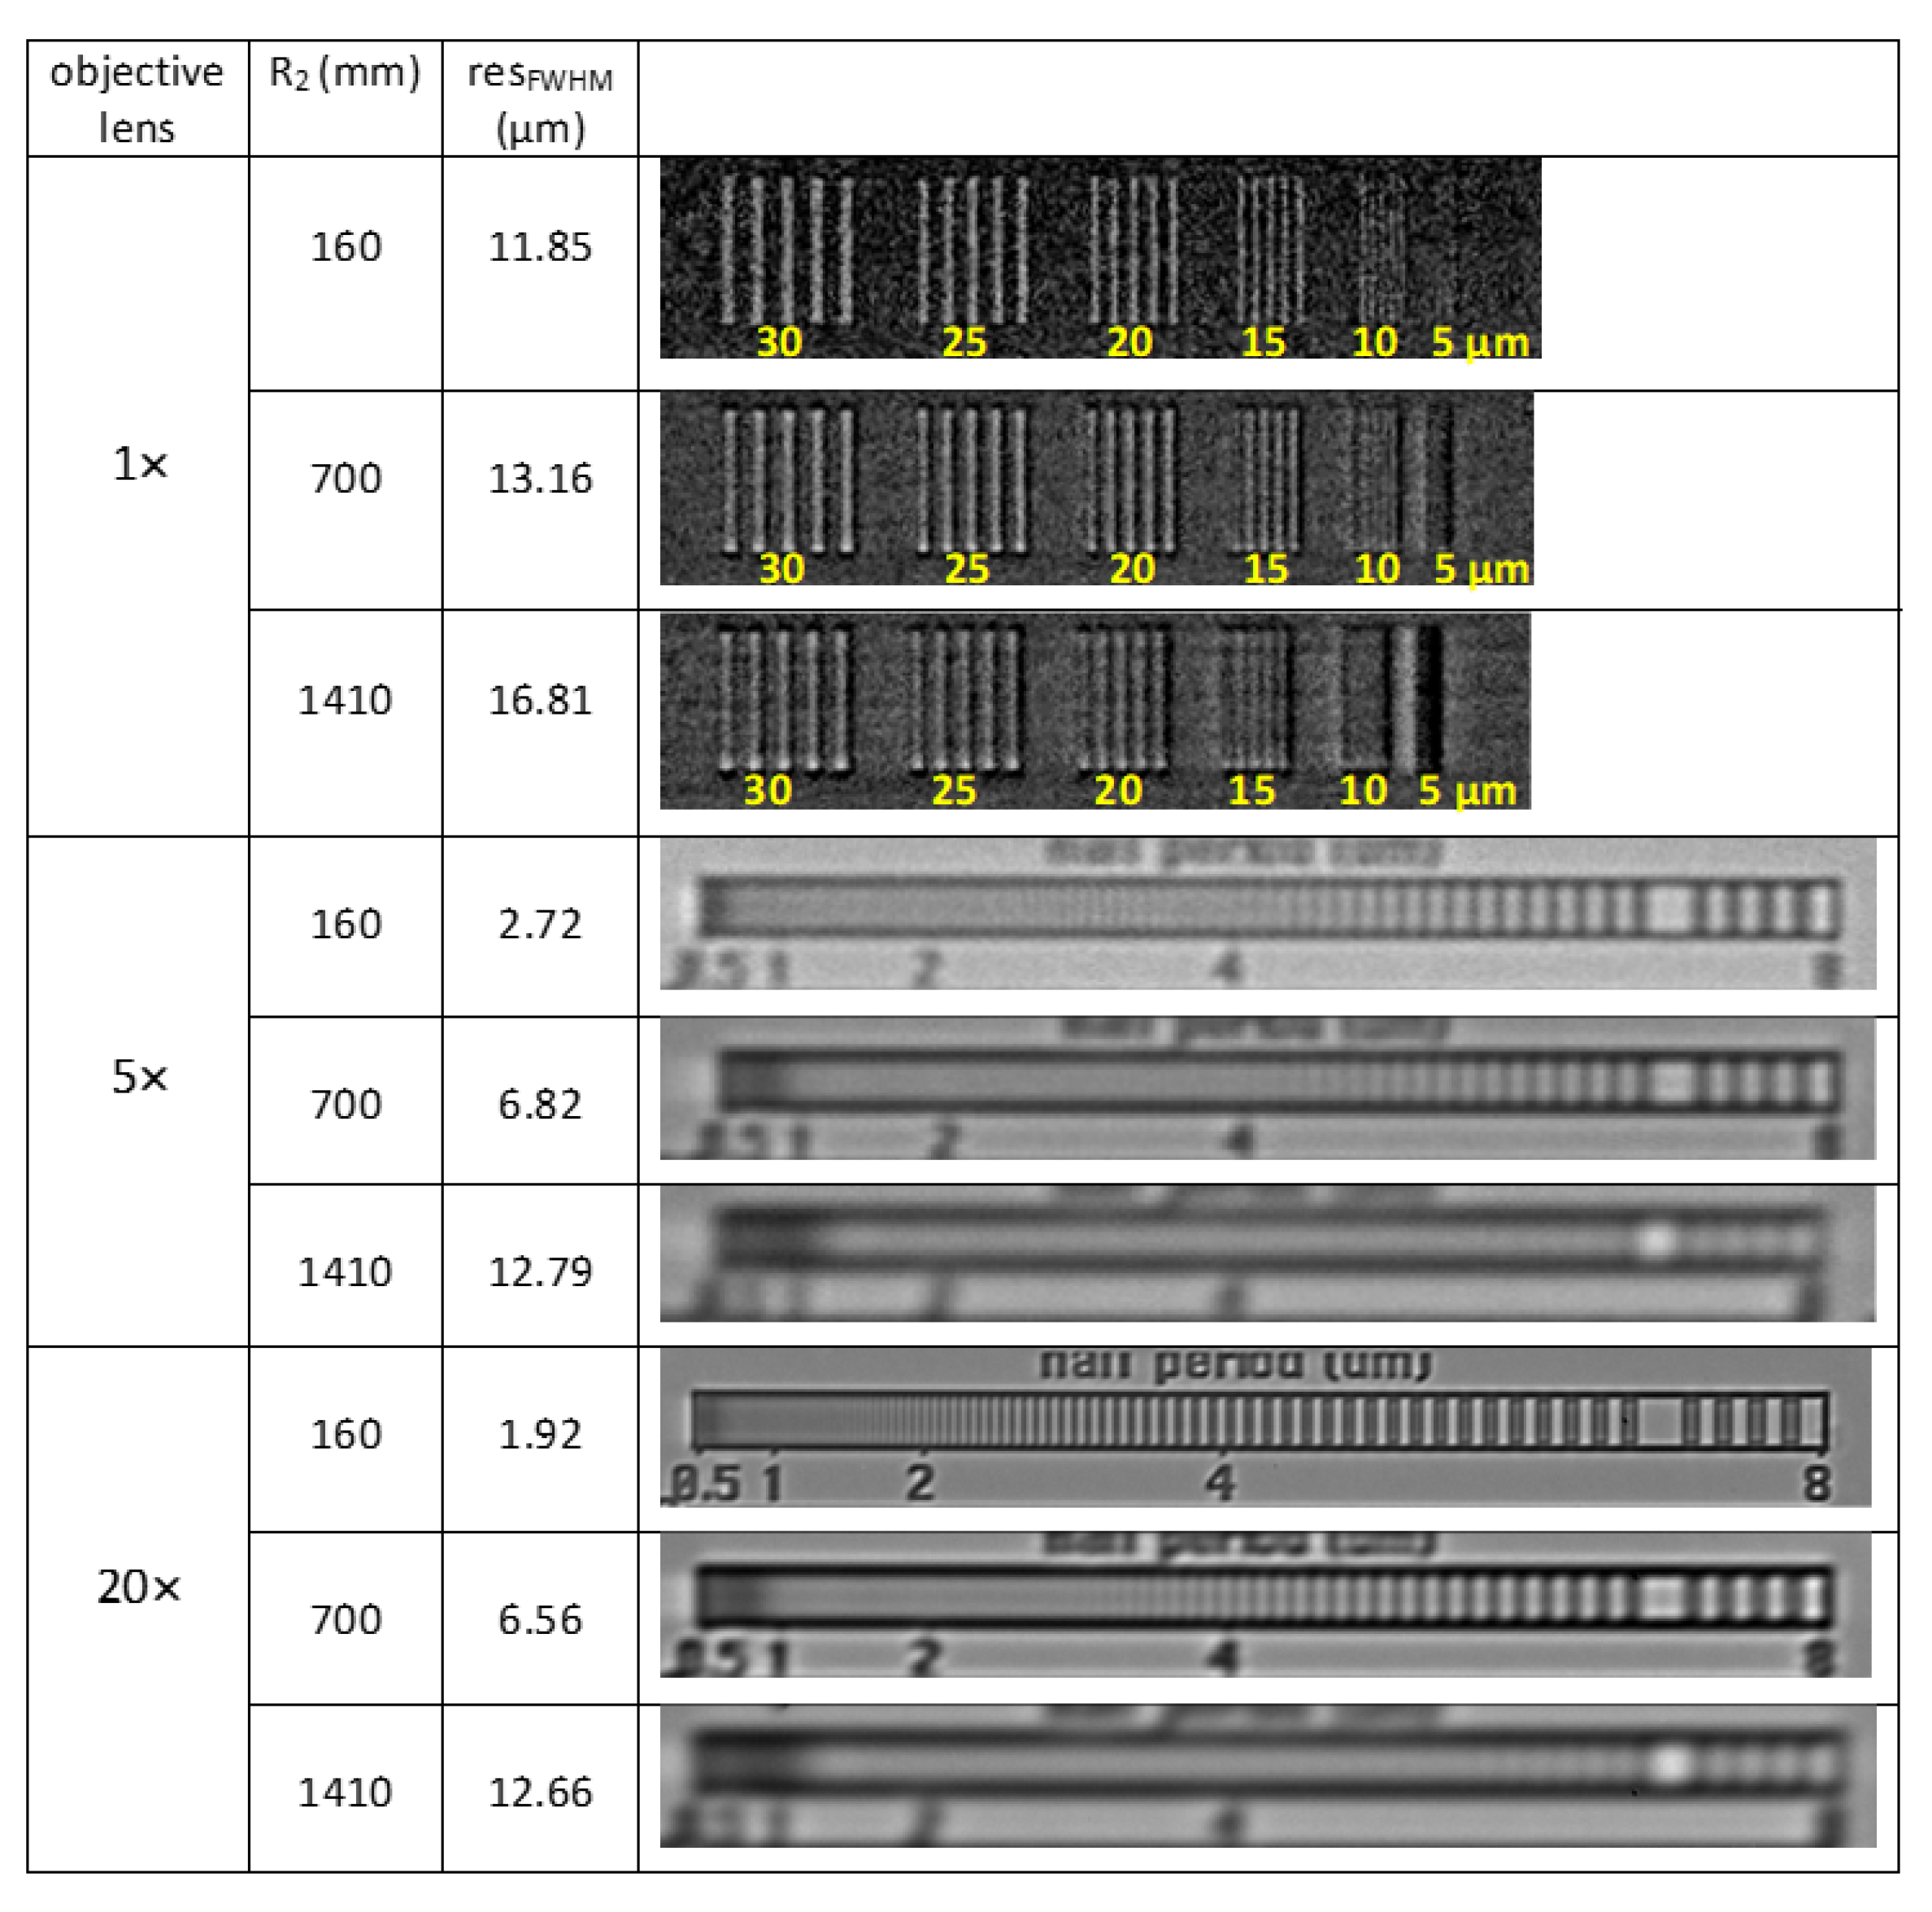
| Objective Lens | Sample Detector Distance (mm) | M | Horizontal Source Blurring (µm) | σsys (Horizontally) (µm) | resFWHM (Horizontally) (µm) |
|---|---|---|---|---|---|
| 160 | 1.01 | 0.64 | 5.03 | 11.85 | |
| 1× | 700 | 1.03 | 2.7 | 5.59 | 13.16 |
| 1410 | 1.07 | 5.4 | 7.14 | 16.81 | |
| 160 | 1.01 | 0.64 | 1.15 | 2.72 | |
| 5× | 700 | 1.03 | 2.7 | 2.90 | 6.82 |
| 1410 | 1.07 | 5.4 | 5.43 | 12.79 | |
| 160 | 1.01 | 0.64 | 0.81 | 1.92 | |
| 20× | 700 | 1.03 | 2.7 | 2.79 | 6.56 |
| 1410 | 1.07 | 5.4 | 5.38 | 12.66 |
Disclaimer/Publisher’s Note: The statements, opinions and data contained in all publications are solely those of the individual author(s) and contributor(s) and not of MDPI and/or the editor(s). MDPI and/or the editor(s) disclaim responsibility for any injury to people or property resulting from any ideas, methods, instructions or products referred to in the content. |
© 2023 by the authors. Licensee MDPI, Basel, Switzerland. This article is an open access article distributed under the terms and conditions of the Creative Commons Attribution (CC BY) license (https://creativecommons.org/licenses/by/4.0/).
Share and Cite
Arhatari, B.D.; Stevenson, A.W.; Thompson, D.; Walsh, A.; Fiala, T.; Ruben, G.; Afshar, N.; Ozbilgen, S.; Feng, T.; Mudie, S.; et al. Micro-Computed Tomography Beamline of the Australian Synchrotron: Micron-Size Spatial Resolution X-ray Imaging. Appl. Sci. 2023, 13, 1317. https://doi.org/10.3390/app13031317
Arhatari BD, Stevenson AW, Thompson D, Walsh A, Fiala T, Ruben G, Afshar N, Ozbilgen S, Feng T, Mudie S, et al. Micro-Computed Tomography Beamline of the Australian Synchrotron: Micron-Size Spatial Resolution X-ray Imaging. Applied Sciences. 2023; 13(3):1317. https://doi.org/10.3390/app13031317
Chicago/Turabian StyleArhatari, Benedicta D., Andrew W. Stevenson, Darren Thompson, Adam Walsh, Tom Fiala, Gary Ruben, Nader Afshar, Sinem Ozbilgen, Tingting Feng, Stephen Mudie, and et al. 2023. "Micro-Computed Tomography Beamline of the Australian Synchrotron: Micron-Size Spatial Resolution X-ray Imaging" Applied Sciences 13, no. 3: 1317. https://doi.org/10.3390/app13031317