1. Introduction
Most urban areas have developed organically over time. Originally, cities developed so that the population could satisfy their basic needs for sleep and food. Later, as society evolved, the population grew due to migration flows from the countryside to the cities, resulting in urbanization that was largely a response to these economic changes. The needs of the urban population also increased, and urban infrastructure was created to meet other immediate needs: water, sewage, recreational facilities, accessibility, etc., illustrating the close relationship between urbanization and economic success. Today, urban development is the result of urban planning that requires new techniques based on transdisciplinary approaches.
Urban redevelopment is the way to upgrade, redesign and plan an urban area for sustainable development [
1]. A basic principle for sustainable planning and sustainable development is that short-term decisions should reflect long-term goals by integrating economic, social, and environmental aspects. Although sustainability planning focuses mainly on environmental goals such as reducing emissions or protecting biodiversity, local governments generally rely on economic goals such as saving infrastructure costs and economic development to formulate sustainability policies [
2].
The transportation of people and goods is essential for developing regions and municipalities, for economic success and improving the quality of life in urban, periurban and rural areas. On the other hand, economic development and urbanization have a significant impact on the increase of traffic and related problems: overcrowding, traffic congestion, an increasing number of accidents and increasing pollution. As a result, traffic congestion in urban areas is now a common phenomenon not only during rush hours but also during various events, such as traffic accidents and roadwork, which slows down traffic on certain road sections. These types of incidents increase the road users’ stress, pose a pollution factor, and can disrupt emergency response efforts. In addition, such traffic incidents lead to a reduction in the quality of life and an additional burden on urban infrastructure. Therefore, traffic safety is an important concern for a sustainable transportation system [
3]. A sustainable transportation system must be affordable, efficient, accessible, safe, and environmentally friendly [
2,
4].
The main cause for traffic problems is an issue of supply and demand, but this is not the only reason, because frequently the location of the traffic source or destination or the different levels of socioeconomic development within the city can influence traffic congestion more than the capacity of the streets [
5]. To ensure an optimal traffic system, it is necessary to monitor traffic conditions to determine the causes of traffic accidents and to analyze the aspects that lead to traffic congestion. Many studies analyzed traffic congestion not only by investigating its causes but also the extent of congestion [
6], congestion intensity, duration, speed, and also propagation mechanisms. Traffic accidents and other traffic-related hazards can cause congestion, but also have a strong socio-economic impact due to the social and economic costs of traffic accidents: injuries, deaths and property damage. With the increasing number of accidents, identifying dangerous spots and solving safety issues by optimizing traffic at problematic intersections is a priority.
Some researchers have shown that combining statistical data analysis with spatial and network analysis based on GIS is an effective road traffic mapping method that analyzes traffic accessibility or identifies vulnerabilities [
3,
7,
8,
9]. Analysis based on GIS has allowed researchers to identify blackspots [
10] and better understand traffic patterns in cities. Therefore, GIS has proven useful not only in traffic assessment but also in roadway design [
11]. Due to the numerous advantages of GIS in traffic issues, the method has been used in many countries [
3,
8,
12].
Other studies investigated the impact of traffic congestion on the environmental and socio-economic development. Time spent due to congestion and the cost of traffic accidents are not the only economic losses caused by traffic [
13]. Congestion can also cause people and goods to arrive late, which affects productivity and competitiveness [
14]. Because of the time spent in traffic, people feel tired, which affects their ability to work and reduces their productivity. They also feel stressed and frustrated, which indirectly affects their health and social skills [
15]. However, air pollution from urban traffic has one of the greatest impacts on health. Therefore, many studies have investigated how urban traffic affects the urban environment through air pollution caused by the imperfect combustion of fuels (CO and CO
2), combustion-related emissions (NO and NO
2), unburned or converted hydrocarbons (benzene, toluene, etc.) and condensation substances (PM2.5, PM10) emitted by vehicles [
16]. Roadside concentrations of traffic-related pollutants vary significantly due to local emissions, urban meteorological patterns, pollutant release or accumulation patterns.
The COVID-19 pandemic fundamentally changed the behavior of the population. The situation, enforced by the quarantine, led to a massive decrease in urban mobility and tourism, public transport was abandoned, and the population pursued safer alternatives such as walking or cycling [
7,
17]. Many researchers have attempted to analyze the dynamics during the pandemic in urban areas in order to understand the impact of COVID-19 on cities [
17], including the improvement in air quality due to the decrease in traffic [
18,
19,
20]. In order to assess mobility change in the period of COVID-19, global data from Google or ESRI on user mobility reports were used to describe changes in mobility [
21], while for analysis of the air-quality data from EPA or satellite data from NASA were used to estimate pollution levels [
17,
20].
This paper investigates how redesigning a significant intersection affects traffic in the target area and in adjacent areas. The study was conducted for a hotspot intersection that was proposed to be redesigned due to a high number of accidents. The preinvestment traffic analysis showed that the main traffic direction was north–south, followed by east–south and west–north. During the redesign, an east–west underpass was proposed, but with the restrictions of left-turns, from both directions would not have been possible. Because the preferred traffic direction was using left-turns from east and west, we hypothesized that the impact of the proposed underpass would be less than assumed by the government and the design team.
To test this hypothesis, we proposed to analyze the impact of this investment on transportation infrastructure over traffic congestion and to assess the socioeconomic impact of the new investment on this particular area.
The research objective of this article is to evaluate the impact of abovementioned investments and answer the following questions:
Does the construction of the underpass have a significant impact on traffic improvement?
What are the effects of the works and rehabilitation of the studied blackspot intersection on air pollution?
What tools can be used to analyze traffic and its impact on the urban environment?
What further development directions for optimizing traffic can be taken?
Therefore, in order to achieve the above research goals, we conducted a study to examine the spatial and temporal impact of traffic on this intersection and the surrounding areas before, during, and after the investment. Works on the infrastructure began in November 2019 and ended in October 2020. Traffic volumes during and after the infrastructure works were also heavily impacted by the Covid pandemics and by the driving bans imposed during that time. In the current study, traffic data for the period from November 2019 to May 2021 was analyzed by using crowdsourcing survey methods and by using GIS spatial and network analysis methods. In addition to traffic data, air pollutants concentrations were analyzed by using freely available open-source data from NASA by comparing them to prepandemic data. We also sought to propose an integrated methodological framework based on GIS and real-time traffic data for urban traffic modelling to support decision making in traffic optimization and road infrastructure investment planning.
2. Geographic Information Systems
In the current context, the future belongs to smart cities that are capable of reinventing themselves, harnessing all socioeconomic and cultural resources and providing a sustainable and resilient environment for residents. Sustainable urban development and resilience are only possible through flexible and creative multidisciplinary approaches to urban problems.
A multidisciplinary approach to sustainable urban development can be achieved by using geographic information systems, as they allow researchers and professionals to use various methods and advanced computer tools for the simultaneous processing of statistical and geospatial data to determine the spatial characteristics of the urban area. Therefore, geographic information systems have become indispensable for sustainable urban planning as they provide the ability to better understand the current needs of a city and then plan to meet those needs.
As urban populations grow and expand, the importance of GIS lies in its ability to collect a large amount of geospatial data necessary to understand the complexity of the city, set priorities, and solve complicated planning problems.
Scientific literature emphasizes that GIS is useful to create a comprehensive spatial database with all street cadastral data and traffic information. Therefore, geographic information systems allow the integration of a wide range of spatial information such as road type, width, pavement, number of lanes, road and intersection capacity, speed limits, restrictions and limitations, periodic or semipermanent congestion, incidents, vehicles, etc. [
8,
22,
23,
24].
The applicability of geographic information systems in transportation stems not only from the distributed nature of transportation and traffic data but also from the need for various types of analysis. There is a need to organize the vast amount of transportation infrastructure information into a spatial database that can be integrated into GIS for the most efficient use in planning, design, construction, maintenance, and management of the transportation system.
By using technology from GIS, urban planners can perform a variety of spatial studies that show not only the feasibility of the proposed investment but also how the proposed structure fits into the existing infrastructure and meets the requirements of a sustainable city. The usage of GIS also makes it easier for planners to visualize and spatially represent the relationships between various graphical and nongraphical data.
In addition to the ability to perform spatial analysis and interact with specific decision support applications, another advantage of using GIS is the fact that the models and analysis results can be presented in the form of an easy-to-understand digital map. Spatial features can be highlighted, leading to a better perception of the problem and implicitly to optimal decision making.
3. Materials and Methods
3.1. Crowdsourcing
In recent years, citizen participation has been increasingly used in various software applications such as advertising and marketing, disaster response, transportation and management, taking advantage of new universal and ubiquitous technologies. In 2007, M. Goodchild introduced the name “voluntary geographic information” (VGI), a term used for geospatial data collected by citizens [
25].
Nowadays, in the age of information abundance, traditional methods of traffic monitoring and control are facing great challenges. Therefore, several studies on traffic monitoring using wireless sensor networks have been conducted in the last decade. Most of them focused on tracking and detecting mobile vehicles equipped with sensors and mobile sensing devices [
26].
In 2008, the University of California at Berkeley launched a pilot traffic monitoring project called Mobile Century. The follow-up project is known as Mobile Millennium and was designed to collect traffic data based on GPS embedded in mobile phones. They found that only 2–5% of the points provided by sensors in mobile devices are sufficient to provide the data needed for traffic monitoring and control [
26,
27].
With the increasing need for real-time, up-to-date, location-based data, a new method of real-time data collection has emerged: “crowdsourcing” [
28]. Crowdsourcing a map means collecting information and geospatial data from a large group of people in order to visualize relationships through their spatial representation. The collection of geospatial data can be done by users voluntarily answering a series of questions or by receiving real-time data from digital devices such as mobile phones [
29]. Unlike traditional data collection methods, which often require experts in various fields, crowdsourcing data collection provides real-time results at low cost. That is why crowdsourcing has become a common condition for leveraging GIS and improving data resources [
28]. One of the advantages of using crowdsourcing technology on a GIS platform is that the user’s geolocation is recorded at the same time as the information is collected. Because smartphones are equipped with global positioning systems, the data sent is geographically located, which increases the value of the information, especially in the case of natural disasters and subsequent crisis management [
30].
In this context, an increasing number of studies have analyzed the usage of crowdsourcing technologies to provide the geospatial data needed for traffic monitoring. It should be noted that most of the platforms have been classified as open-source applications, with a focus on providing voluntary geospatial data, mobile crowdsourcing and participatory discovery. Thus, crowdsourcing methods provide voluntary geospatial information for traffic prevention and planning and have the potential to enable a multitude of citizens to build and store asynchronously knowledge of many issues and actively participate in decision making by engaging in the collection of digital data [
21,
22,
23,
24,
25,
26,
27,
28,
29,
30,
31,
32,
33].
If in the past, traffic assessment required sensors to detect and count vehicles, today we have information on human mobility patterns from mobile phones. Therefore, crowdsourcing in GIS-based applications allows any user to represent a vehicle or pedestrian and voluntarily contribute to traffic analysis [
34].
All crowdsourcing applications rely on the friendliness of participants. Routing apps like Waze or Google Maps provide real-time maps, routing solutions, and traffic updates but are also attractive for sharing any traffic event, accident, construction, or other situations that may cause traffic problems. In addition to the information voluntarily shared by users, the application collects the location of all users/traffic participants.
These types of crowdsourcing applications are capable of collecting historical and real-time data from millions of GPS mobile phones simultaneously, interpreting and updating vehicle data in real time and predicting the average speed for each lane [
34].
3.2. Estimation of Air Pollutants by Remote Sensing
Air pollution is one of the most important environmental problems, concentrated mainly in cities. Aerosols are liquid and solid particles suspended in the air that originate from natural sources or are produced by pollution, including pollution caused by traffic. Air pollution is measured by a network of sensors established at the European level to monitor the main pollutants and the European Environment Agency (EEA) provides official data for European countries. To assess air pollution, the European Air Quality Index (EAQI) is used, which consists of a combination of five different air pollutants and indicates the current state of air quality in Europe (SO
2, NO
2, O
3, PM2.5, PM10) [
35,
36]. The EEA uses only data for NO
2 and PM (either PM2.5, PM10, or both) to calculate the index for traffic stations because SO
2 can distort the picture of local air quality, while ozone levels at traffic stations are usually very low. EPA and the EEA carry out measurements of air pollution, but this information is not accessible for the areas investigated in this study, only average values for the city or country are available. Therefore, to understand trends in air quality only open-source data were used for all analyses.
Monitoring the Earth from satellites can provide remote sensing information by using infrared or ultraviolet light to detect pollutants or by calculating indicators of air pollution, such as atmospheric opacity measured by the optical thickness of atmospheric aerosol. Satellites have the advantage of providing global coverage and long-term observations. However, it should be noted that the usage of satellite observations is associated with a high degree of uncertainty due to cloud contamination, uncertainties in the determination of AOD, lack of sensor-specific data, etc. [
37].
For air-quality assessment, we propose two methods: a holistic analysis of the imagery provided by the Sentinel-2 monitoring tools and the use of modern era retrospective analysis for research and applications aerosol reanalysis (MERRAero) data to estimate surface PM2.5 levels
To estimate surface PM2.5 pollution from satellite measurements, we use aerosol optical depth (AOD) from MERRAero. MERRAero provides aerosol grid data from Merra, starting in 2002 and continuing to the present, over platforms from NASA EOS.
We have chosen the band combinations for atmospheric penetration and atmospheric removal for the image analysis. Atmospheric penetration is a band combination that provides similar results to conventional false-color infrared photography, but with greater clarity. It contains no visible bands, but penetrates atmospheric particles, smoke, and haze, reducing the atmospheric influence on the image. Water attenuates NIR and SWIR wavelengths and ice and snow provide well-defined coastlines and highlighted water sources in the image. Vegetation in the band combination, which appears in blue, indicates the vitality of the vegetation. Healthy vegetation is shown in light blue, whereas stressed, sparse or/and dry vegetation appears in a dull blue. Urban structures are white, grey, cyan, or purple. The band combination can be used to determine moisture, texture, and soil properties. Each band in the combination plays a significant role in representing different features and gives them different characteristics in the appearance of the image.
Atmospheric effect removal is the result of the combination of SWIR 2, NIV and green bands used to correct for atmospheric effects. Each band combination plays a critical role in the appearance of the image. The shortwave infrared (SWIR2) is strongly absorbed by water. Because different types of clouds contain different amounts of water, the spectrum is useful for distinguishing between clouds.
3.3. Methodology
The proposed case study was conducted for an intersection in the city of Oradea (Romania) and will try to prove the hypothesis that infrastructure planning must be based on traffic service assessment by combining the applicability of GIS with crowdsourcing-based applications in traffic analysis and transportation planning [
38].
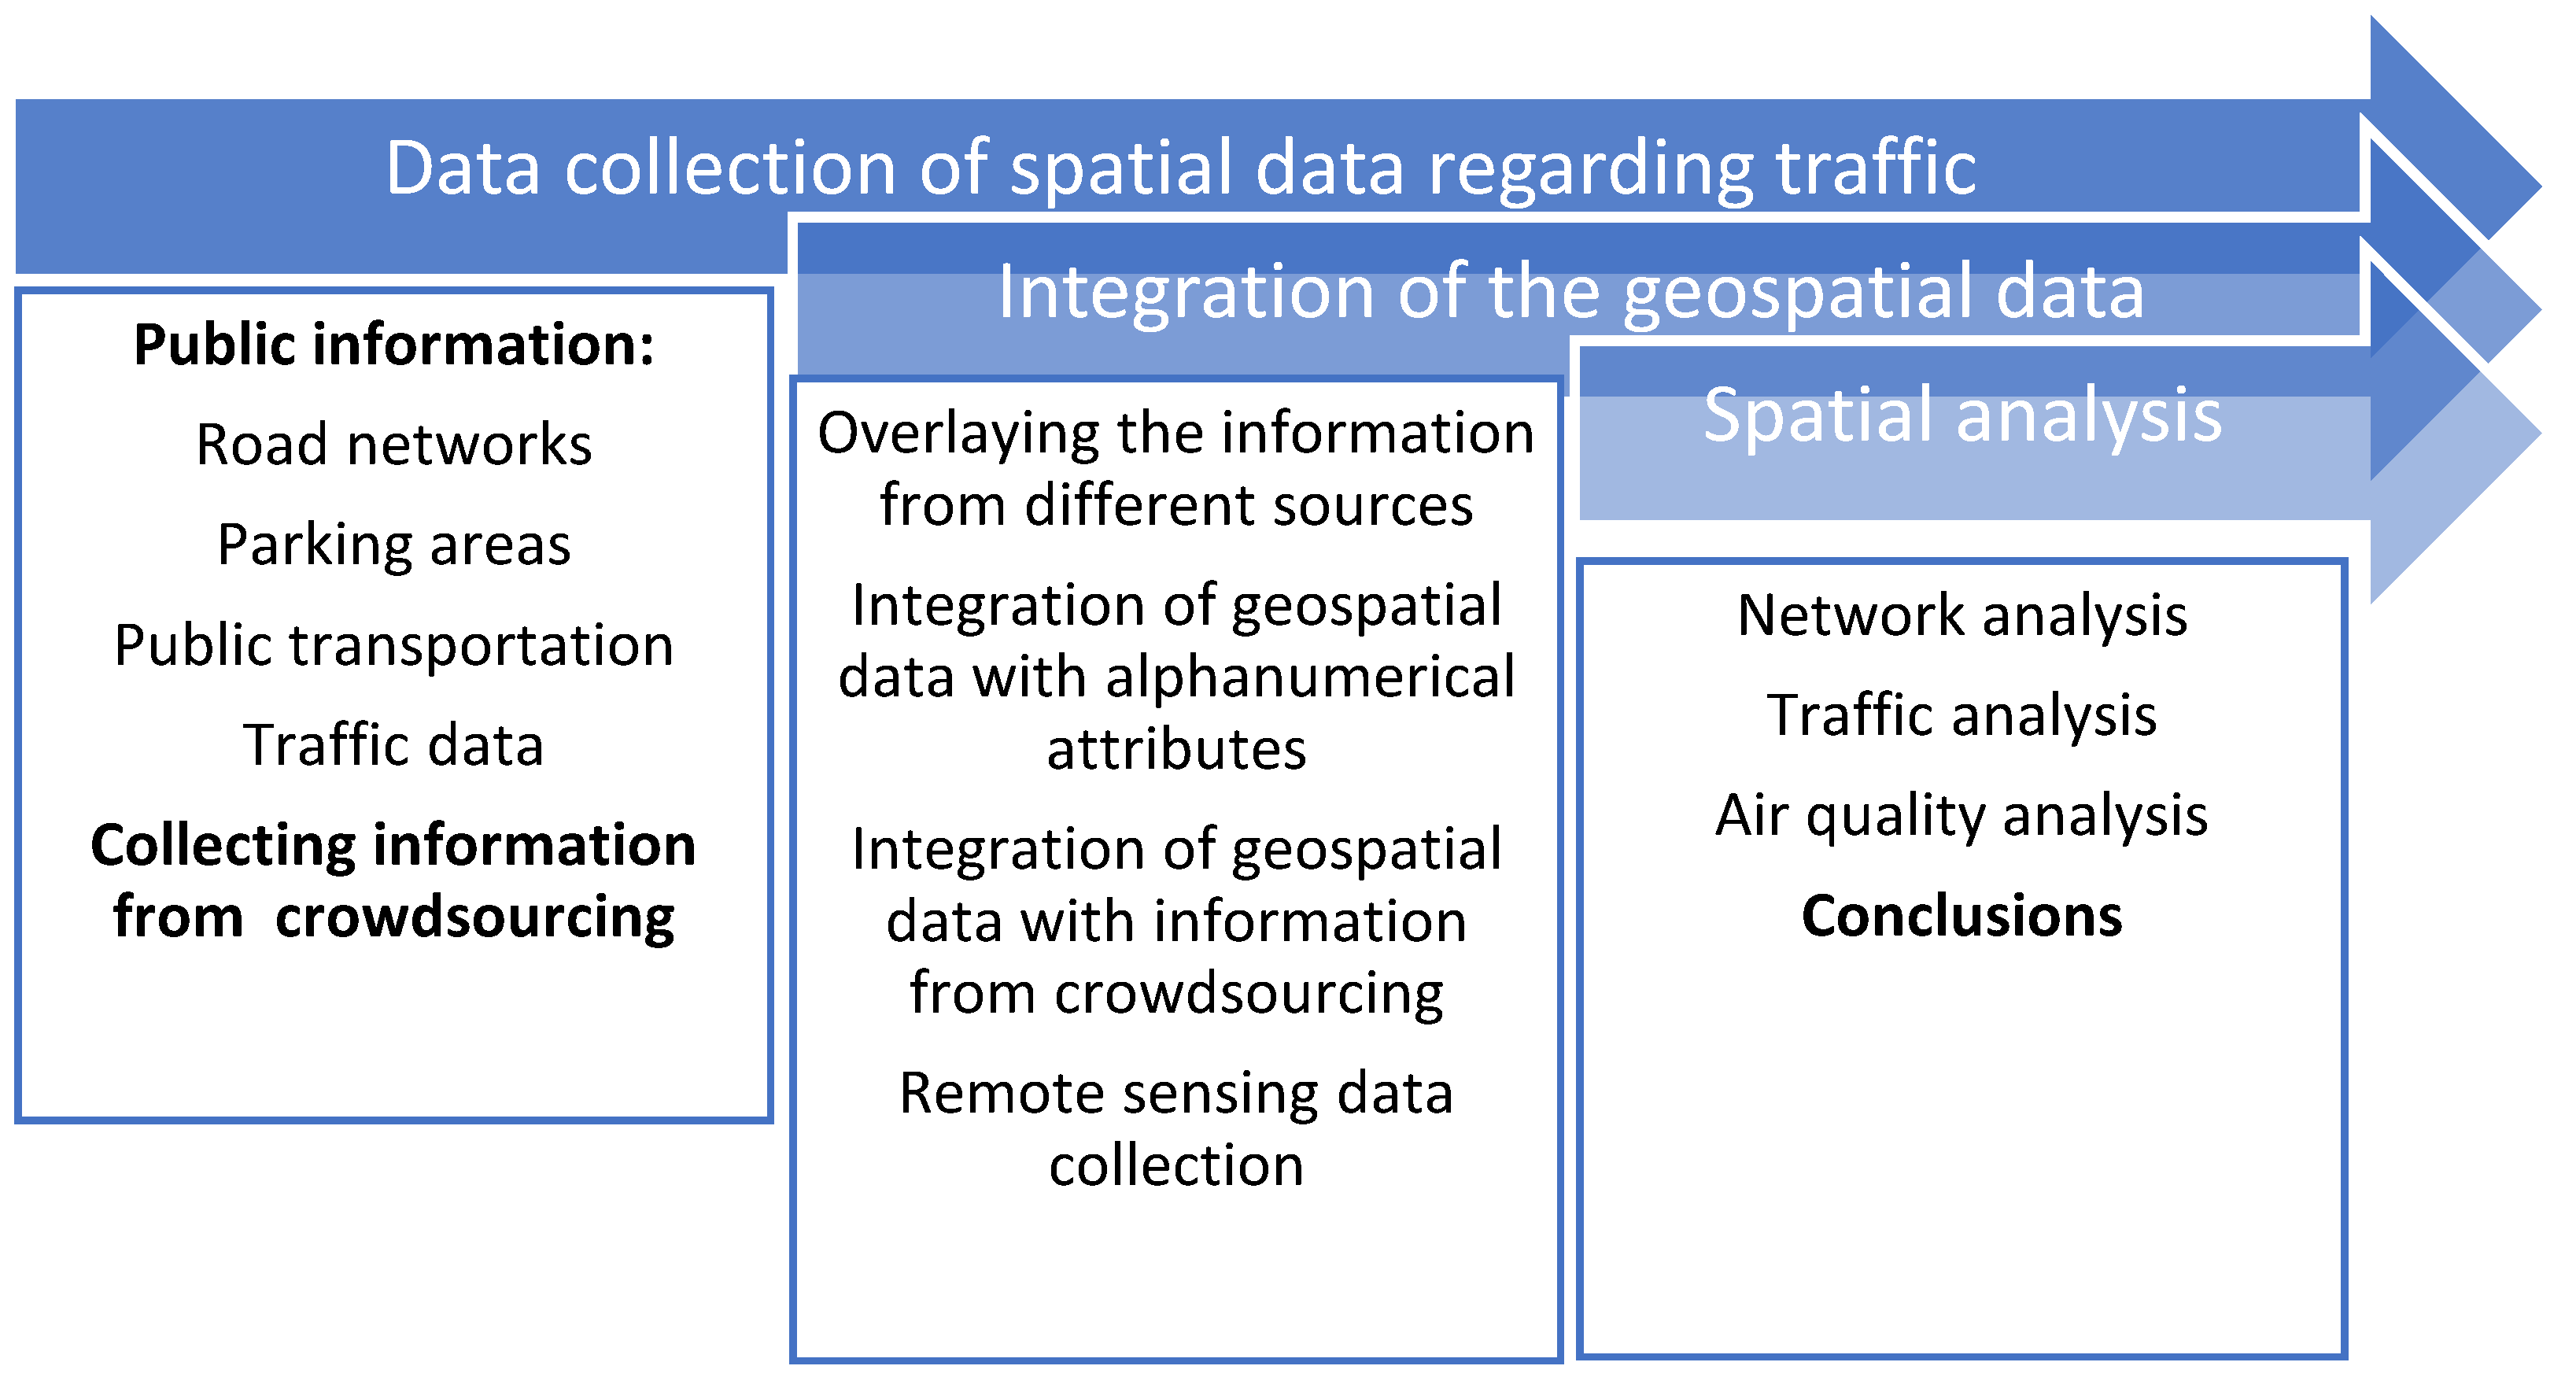
The following
Figure 1 shows schematically the phases of the methodology used in this study.
To analyze the relationship between urban development and transportation systems, we identified four aspects of urban planning that affect the transportation system in this research: traffic-generating sources, traffic distribution, mode choice and travel time. Therefore, to conduct the study, we identified the important elements of the road network from the perspective of traffic and redesign of intersection:
the road network was defined as a diagram for traffic control;
the urban infrastructure was identified, highlighting the traffic generating areas; and
the traffic data from the Oradea Master Plan were also integrated into the spatial database.
To realize the case study, a repeated traffic analysis was performed by overlaying information on real-time traffic data collected through crowdsourcing and provided by Esri through Living Atlas World Traffic Services or by Google Maps with orthophotos of Oradea. This way, we were able to identify extensive traffic congestion in the city center. This also demonstrates the applicability of traffic data collected by Esri’s World Traffic Services through Living Atlas and Google Maps in real time [
39,
40].
4. Results
Cities around the world are growing, affecting the increasing mobility of the population, leading to the aggravation of traffic problems: traffic congestion, accidents, and indirect effects such as pollution. Over time, many studies have been conducted on the impact of road investments or redesigns of traffic flows [
1,
41].
The COVID-19 pandemic caused significant disruption to several sectors of the economy, of which the transportation sector was one of the hardest hit. Due to the Covid pandemic and the restrictions imposed, the transportation habits of citizens around the world have changed, and road traffic has also decreased [
21]. Therefore, several researchers are trying to understand the impact of COVID-19 on traffic by studying the dynamics of the pandemic in numerous countries [
42].
In addition, many studies have analyzed the impact of the Covid pandemic on traffic and congestion reduction based on GIS technology or by combining GIS with TomTom index data [
9,
33,
43]. According to the TomTom Traffic Index, traffic congestion in about 400 cities worldwide had been reduced by 21% on average by 2020 [
44]. Unfortunately, Bucharest is the only Romanian city analyzed and included in the TomTom index data. Therefore, in Oradea, we have to compensate for the lack of TomTom data though the analysis performed by the authors based on Google Map and Waze crowdsourcing traffic information.
4.1. Oradea Road Network
The municipality of Oradea is located in northwestern Romania and is home to more than 220,000 inhabitants. Together with the metropolitan area, the population exceeds 350,000. Moreover, more than 20,000 students are studying in the city, increasing the traffic during the university year, beginning in September and ending in July. The road network of Oradea includes a total of 879 roads with a total length of 432 km and an area of 8346 km2, which represents 10% of the urban area. The road network is very dense and most roads have reduced traffic capacity, especially in historical neighborhoods and residential areas with social housing, so the road network has an excessive regulation of one-way traffic. Due to the need for parking, many major streets have reduced capacity because portions of the street are designated as parking areas. Another weakness of the road network is the insufficient number of bridges over the Crișul Repede River or rail lines. International and national transit traffic has a great impact on Oradea municipality and its urban area, as the city is located at the crossroads of national and European roads. The city is located at 9 km from the Borș national border crossing and at the intersection of the European roads E60, E671, and E79, which are crossing Europe from west to east (E60, E79) and north to south (E671). The Transylvania Highway, once built and connected to the Hungarian highway network, will accommodate a large part of transit traffic (mainly freight). Currently, truck transit traffic from four of the five main transit directions (toward Arad, Deva, Cluj, and Borș—Hungarian border) is fully handled by the bypass, but passenger transit traffic is only partially handled. In the fifth direction, to Satu Mare, all transit vehicles have to cross the residential and service area of Episcopia Bihor district. On the E60, freight traffic toward Satu Mare has increased due to the new border crossing Borș II to the Transylvania Highway. Moreover, part of the transit traffic of passenger cars on the east–west (Cluj-Bors) and north–south–west (Deva-Satu Mare) axes passes through the internal road network of the municipality, with the greatest impact in the area of Piața Independenței and Gheorghe Magheru Street.
The following
Figure 2 shows the main road network of Oradea according to the Oradea Master Plan.
Among the main causes of traffic congestion in Oradea, we include
the natural barrier created by the Crişul Repede River, which divides the city into two parts;
narrow streets, mostly one-way, in the historical center;
the overlapping of the tram line with the roadway; and
transit traffic, especially small vehicles on the east–west (Cluj-Borș—E60 road) and north–south–west (Deva-Satu Mare), which pass through the internal road network of the city and represent a great burden for the Independence Square and Gheorghe Magheru Street area.
All the above elements confirm that the most critical area for traffic in Oradea is and was the area next to Dacia Bridge, Independence Square in the south and Gheorghe Magheru Street in the north. Considering the high number of accidents that occurred at the Traian Park—Dacia-Gheorghe Magheru traffic light intersection, Oradea City Hall proposed in the fall of 2019 the construction of a new underground passage under Gh. Magheru Street and the elimination of the traffic lights. Gh. Magheru Street has two lanes in each direction, one overlapping with the streetcar lines and the starting point of the street is the busiest bridge in Oradea.
With this study, we proposed to analyze the impact of this investment on the transport infrastructure and the socioeconomic impact of the new investment on this particular area.
4.2. Traffic Analysis of the Gh. Magheru-Traian Park Intersection before the Road Construction Works
The proposed investment was made to solve one of the most problematic intersections in the city, but without an analysis of how the diverted traffic would be distributed due to the inability to turn left. In the image below (
Figure 3), the traffic flow and the traffic lights at the intersection of Gheorghe Magheru Street with Traian Park Street at the end of Dacia Bridge in the current configuration in November 2019 can be seen.
The same display and symbolization mode were used to perform the proposed study and compare traffic volumes over time. They were similar to the display mode submitted by Arcgis Online. The following
Figure 4 shows the legend for the following traffic analysis based on traffic speed.
The following figure shows the result of the traffic analysis conducted in Oradea at 2 p.m. on 7 November 2019, one day before the start of the traffic restrictions in Magheru Street due to the initiation of construction works for the underpass (which started on 15 November 2019). The legend corresponds to the
Figure 4.
As seen in
Figure 5, the closed and red-marked sections are only on the important traffic arteries, usually caused by traffic lights, on the section of the road before the traffic light crossing. In general, in the city center, we can identify roads with all types of traffic situations, which is reflected in the colors: red—the slowest traffic, orange—slow traffic, and yellow—medium traffic and green for normal traffic.
4.3. Tracking Traffic and Congestion during Construction Works
As mentioned above, repeated traffic assessments were conducted to monitor traffic during the construction works. For this purpose, real-time traffic data provided by ESRI through Living Atlas World Traffic Services or Google Maps were overlaid with orthophoto images of Oradea.
The real-time data used in the study, provided by Living Atlas World Traffic Services, Google Maps and Waze, were collected through crowdsourcing [
39,
46]. Thus, road users provided data about their actual location along with the voluntarily shared traffic information. As mentioned earlier, these applications collect the location of all users/traffic participants to identify congestion, average speeds, excess road capacity, and information for simulations, traffic analysis, and route planning.
So, if we regularly analyze the traffic situation in Oradea, we can see that after 15 November 2019, due to the start of construction works and the related traffic restrictions on most of the city’s roads the speed has significantly decreased and many road sections have turned orange. We can also notice an increase in traffic problems on the city ring road and other secondary roads, where the average speed was previously high and marked in green most of the time.
Figure 6a shows the typical traffic volume on a weekday in February 2020 around 2 p.m. (created by the author by using Google Maps).
Due to the COVID-19 pandemic outbreak, drastic restrictions were imposed nationwide starting 16 March 2020, and lasted approximately two months. The quarantine imposed had a significant impact on traffic. As in all major European cities, road traffic in Oradea came to a standstill during the quarantine. Despite the implementation of the abovementioned infrastructure works and the related restrictions, the city became “green” in terms of traffic [
34].
Traffic analyses conducted in the period after the quarantine was declared underscore these aspects.
Figure 6b shows the traffic volume in Oradea on 29 April 2020, at 2:00 p.m.
During the closure caused by the COVID-19, traffic in Oradea, similar to other European cities, dissipated, with congestion only on the road sections affected by the construction work.
With the end of the quarantine and the resumption of the school year, traffic returned to the streets of Oradea, even in mixed traffic. Due to the state of emergency and the large number of students who continued school online, the number of road users was much lower than before the COVID-19 pandemic, but due to the construction work, traffic in Oradea was very busy, as shown in
Figure 6c.
Magheru Passage was opened to the public on 26 October 2020. The problematic crossing has received a new configuration: the direction of the Dacia—Gh. Magheru bridge allows fast passage without traffic jams regardless of the time of day; therefore crossing Magheru Boulevard is easy, but turning left has become impossible. Thus, the congestion problems have “shifted” to the adjacent intersections.
Figure 6d shows the traffic situation on 26 October 2020 at 2 p.m. after the reopening of the passage. The maps were created by the authors using Google Maps and the legend of the maps is the same as that of
Figure 4.
4.4. Tracking Traffic and Congestion after the Underpassage Inauguration
The reopening of all schools and high schools in May 2021, although the state of emergency was not lifted, even if university students did not physically return to classes and some companies continued to allow online work, nullified the positive effects of Gh Magheru-Passage. The Dacia Bridge—Magheru Street direction of travel is much laxer than before the passage, but traffic backs up at the adjacent intersections. The road users who turned left, before the investment, have changed their route. Most of them have chosen the Gh Magheru—G. Enescu intersection, and the congestion caused by this intersection extends to the Dacia Bridge for the south–north direction or to Traian Park for the east–west direction. As
Figure 7 displays, the traffic situation on 17 May 2021 at 2 p.m. shows a traffic jam on the entire section of Gh. Magheru Street.
4.5. Air-Quality Analyses
To test the hypothesis that the positive impact of the proposed underpass will be less than assumed by the government and the planning team, we examined spatial and temporal trends in air quality before and during construction, a period that overlapped with the Covid pandemic. If the hypothesis is correct, air quality in the city should not change significantly. In order to understand and analyze the evolution of air quality in the city of Oradea before the investment, during and after the construction works of the underpass, we used data of the extended aerosol measurements from NASA’s EOS platforms, MERRAero, images collected by the monitoring instrument from Sentinel-2 [
37] and data provided by the EPA and EEA air-quality sensor network.
As mentioned earlier, the National Environmental Protection Agency conducts air-quality measurements through a network of sensors. At the Oradea Municipality level, there are three monitoring stations BH-1 (Dacia Boulevard) for measuring urban air quality, BH-2 (Matei Corvin Street) for measuring industrial pollution, and BH-3 (Nufarul Street) for assessing traffic-related pollution. All of these are unfortunately marked as “station for which no data have been reported” on the EEA website [
35]. However, the annual average values of NO
2 pollution are available and are presented in
Table 1.
Analysis of data provided by the EEA for NO
2, one of the main traffic-related pollutants, shown in the table above, indicates that the average annual values in Oradea for two of the sensors in 2020, the year of the COVID-19 pandemic, were significantly lower than in 2019 and 2021. In accordance with the Air Quality Health Risk Assessments in 2020, an index of health risk from NO
2 pollution in urban areas of Bihor County was calculated, which was also lower than in 2019 due to the lower traffic volume [
35].
The following figures show the images acquired by Sentinel 2 and visualized with EOSDA Land Viewer for the monitoring period proposed in this study.
Figure 8 shows atmospheric penetration as a combination of SWIR2, SWIR1, and NIR bands during the four periods of February 2020, (b) April 2020, (c) September 2020, and (d) October 2020. A visual comparison of these four images shows a clearer image for April 2020 that could be assimilated with a clear atmosphere.
Figure 9 presents the atmospheric removal of a band combination of SWIR2, NIV, and green for (a) February 2020, (b) April 2020, (c) September2020, and (d) October 2020. Similar to the previous case, the visual comparison of these four images shows a clearer picture for April 2020, which can be equated with less pollution in the atmosphere.
The second study is based on the calculation of the atmospheric particulate matter, or particulate matter (PM), with diameter of 2.5 μm (1.0 μm) or less called PM2.5. This type of particulate matter is generated by all types of pollution, including traffic pollution and dust brought by the wind. The PM2.5 is calculated in MERRA-2 by using the formula which was adapted from [
20] as the following:
where
BCSMASS, OCSMASS, SO4SMASS, DUSMASS25, and SSSMASS25 are the surface mass concentrations of black carbon, organic carbon, sulfate ion, dust, and sea salt with diameters less than 2.5 μm, respectively. Sulfate aerosol is obtained by multiplying a factor (i.e., 132.14/96.06) to the sulfate ion in MERRA-2 [
37].
Figure 10 shows the time series of surface mass concentration of PM 2.5 for Oradea, calculated with Giovanni [
47].
5. Discussion
The development of sustainable urban transport aims to shape the development of urban transport networks to support efficient and safe mobility in the urban environment. The transformation of urban transport networks is an important stage in the development of a city that can have a positive impact on transport, but sometimes not all impacts are positive.
In this paper, we have studied how the redesign of an important intersection affects the traffic in this area and in the adjacent areas in Oradea. In doing so, we hypothesized that the impact of the proposed underpass would be less than assumed by the government and the planning team because the preinvestment traffic studies had shown that the important traffic direction before the investment would not be possible in the future.
The studies covered a period of two years and included both traffic monitoring in the area affected by the investment, adjacent areas, and also air quality monitoring in the municipality of Oradea. The research began in November 2019, prior to the start of construction, and was originally scheduled to be completed in November 2020. However, due to COVID-19 pandemic restrictions still in place at that time, the study was extended until the pandemic-related restrictions were fully lifted. Traffic analysis using crowdsourced data proved that the study’s hypothesis was correct and that planning without an accurate model to predict traffic volumes and without an effective traffic evaluation system would result in traffic congestion, even if additional access infrastructure was built. The research conducted on this particular investment shows that urban planning was done without correlating and coordinating the proposed changes with mobility issues. Consequently, traffic demand after construction exceeded traffic capacity and changed motorist behavior. Road users who turned left prior to the construction of the new underpass, changed their route, thus increasing traffic capacity request at the entrance of the intersection compared to traffic capacity permitted at the exit of the intersection. Because left turns were no longer possible, traffic problems shifted to adjacent intersections and during peak periods, the congestion created at these crossings extended beyond the reconstructed intersections. In this case, one of the most common paradoxes of transportation planning occurred: the more roads built, the worse the congestion gets because there is a mismatch between traffic supply and demand.
Therefore, the solution for the design of the Traian Park—Dacia Bridge—Gheorghe Magheru intersection can be considered flawed from a traffic engineering point of view, because incomplete and insufficiently justified hypotheses were used in the traffic modeling and the real situation on the ground was not known. This traffic analysis once again underlines the need for urban planners and decision makers to base their studies on traffic analysis in order to improve road infrastructure and rationalize traffic.
An analysis of air quality focusing on pollution caused by traffic in the city of Oradea was carried out in the same time period. There are three sensors measuring air quality, but because the data is not accessible, remote sensing data was used to estimate pollution. Despite the limitations of remote sensing data, which can be altered by weather conditions, this method was chosen because this information was available throughout the study period. Similar to the traffic analysis, the air-quality assessment was also affected by the overlap of the time period with the Covid pandemic, so it is important to highlight the time period that is subject to limitations so as not to alter the purpose of the study.
By analyzing spatial and temporal trends in air quality before, during and after construction, in a period that overlapped with the Covid pandemic, using both visual analyses and mathematical methods we can easily notice that the impact of the proposed underpass is less than assumed by the government and the planning team. The analysis of the COVID-19 pandemic and its impact has again highlighted the need for spatial information and technologies that provide governments and citizens with a perspective for modeling and supporting decision-making processes.
6. Conclusions
This study illustrates once again the complexity of urban planning and the importance of a detailed analysis not only for urban planning and transportation concepts but also of the complex socioeconomic aspects as a result of the transformation of the urban mobility network. The determination of mobility patterns and scenarios is not possible without the usage of a complex information system that can integrate all spatial aspects in order to identify an optimal urban solution already in the planning phase.
The research objective of this article is focused on the evaluation of an investment in the optimization of traffic by the construction of an underpass and to analyze the impact of this investment on traffic-related air pollution.
The first conclusion is that the construction of the underpass reduces the number of accidents in the intersection but has no effect on traffic improvement, because the analysis shows that all traffic problems at the intersection were shifted to the adjacent intersections after the construction works. The second conclusion is that the above investment has no significant impact on air pollution, except during the COVID-19 pandemic restrictions.
The main conclusion from this study is that geographic information systems, due to their many advantages, are optimal tools not only for analyzing traffic and its impact on the urban environment, but also for modeling and solving traffic problems, especially because of their ability to combine traditional geospatial data with remote sensing data and data collected through crowdsourcing. The emphasis on the interaction between the transportation system and its environment makes the methodology proposed in this article, based on the GIS technology, applicable not only for route planning and risk analysis, but also for planning new access roads and decision making for urban traffic optimization and congestion relief. Another important conclusion that can be drawn from the analysis is the usefulness and applicability of transportation data collected through crowdsourcing to analyze the transportation system in all phases of an urban redevelopment project: planning, design, implementation, and monitoring. The method of data collection through crowdsourcing of road users can replace the method of counting vehicles in traffic as it is less costly to implement. By using geographic information systems in combination with open-source, real-time traffic monitoring systems, we can optimize urban transportation planning projects and, in this way, contribute to sustainable urban development.
Rehabilitation and redesign of problematic intersections as well as access roads can have an impact on reducing traffic congestion, which has a multiplier effect on pollution reduction and sustainable urban development. Smooth, congestion-free traffic drastically reduces the time that commuters spend in traffic and therefore has many positive impacts on people and the environment. Road transport is a major source of air pollution, directly through the emission of exhaust gases, but also indirectly through the consumption of fossil fuels. The main advantages of the methodology proposed in this study, based on the analysis of geospatial data, crowdsourcing data and remote sensing, are
- −
the possibility of applying it anywhere in any urban agglomeration or region,
- −
the versatility of its application, including the preliminary planning of urban development projects to reduce traffic congestion,
- −
that it can be a reliable source of information for the environmental and ecological impact analysis of infrastructure investments, and
- −
its applicability in carrying out socioeconomic analyses.
The study has some potential limitations, such as the lack of air-quality data from ground sensors with more reliable information than remote sensing data, which can be modified by atmospheric conditions. However, the use of remote sensing data provides a basis for qualitative analysis and has the advantage of also providing data from the initial launch of the satellite to the present day, thus covering a longer time period.
Further research can be conducted to develop a broader conceptual framework for assessing the environmental, economic, and sustainable urban development impact of traffic congestion. Based on the traffic impact study, future research could address issues related to the usage of GIS in the actual planning process to address traffic problems.


