Communication

Investigation of Intermetallics Formation and Joint Performance of Laser Welded Ni to Al

1
Institute of Intelligent Manufacturing, Guangdong Academy of Sciences, Guangzhou 510070, China
2
Beijing Engineering Research Center of Monitoring for Construction Safety, Beijing University of Civil Engineering and Architecture, Beijing 100044, China
3
Singapore Institute of Manufacturing Technology, 73 Nanyang Drive, Singapore 637662, Singapore
4
IPG Photonics (Canada) Inc., Kingston, ON K7K 2L9, Canada
5
Guangdong CAS DoFortune Laser Technology Co., Ltd., Foshan 528000, China
6
School of Humanities, Beijing University of Civil Engineering and Architecture, Beijing 100044, China
*
Authors to whom correspondence should be addressed.
Appl. Sci. 2023, 13(3), 1356; https://doi.org/10.3390/app13031356
Submission received: 8 December 2022 / Revised: 3 January 2023 / Accepted: 11 January 2023 / Published: 19 January 2023
(This article belongs to the Section Applied Physics General)

Abstract

:
In this paper, laser welding Ni to Al using pulsed wave (PW) and continuous wave (CW) lasers was investigated. Weld quality and strength were evaluated in terms of cross-section examination, intermetallic compounds formation, microhardness, shear test and 90-degree peel test. The results show that deep penetration welding Ni to Al causes high melting pool temperature and severe material mixing, which could result in dominant AlNi3 and AlNi intermetallics (IMCs) in the weld. These IMCs could significantly increase the hardness of the welding zone, but could also lead to the formation of defects, as well as reducing the ability to withstand the shear force and peel force applied to the weld. In comparison, using process optimization to maintain a shallow penetration or form a weld-braze joint, low melting pool temperature and minimum material mixing can be achieved. Hence, low-hardness Al3Ni IMCs are prevalent in the weld. This helps generate a defect-free dissimilar weld joint to withstand higher shear force and peel force. The findings show promising applications, such as the battery management system of electric vehicles, in which joining a Ni adaptor to an Al bus bar is required.

1. Introduction

With the development of electric vehicles, the battery management system plays a vital role in the safety, practicability and durability of power batteries [1,2,3]. In electric vehicles, the battery management system comprises different components, such as a bus bar, a metal adaptor and a PCB/FPC board, where dissimilar material joining is necessary [4,5]. The bus bar is usually made of aluminum alloy, and the metal adapter is usually made of nickel or copper. In order to connect the adapter to the bus bar, a laser can be used to realize the joining of dissimilar materials [6,7,8,9]. However, there are critical issues (i.e., cracks and voids) in both continuous wave (CW) and pulsed wave (PW) laser welding of dissimilar materials [10,11,12,13].
In the process of laser welding of aluminum to other metals, plasma is easily generated, which causes the attenuation of laser energy, thereby causing the generation of pores. Furthermore, intermetallics formation causes cracks, and a sound weld is difficult to form [14,15]. Chen et al. [16] studied the interfacial microstructure and formation mechanism of the Ni/Al butt joint by controlling the offset of the laser beam to the Al side. The results of the study indicated that two modes of Ni dissolution and melting were discovered during the laser welding. When the offset was relatively high, the Ni dissolved into the weld first and then the intermetallic compounds (IMCs) formed during the welding. IMCs were the main factors which affected the properties of Ni/Al dissimilar butt joints. Kumar et al. [17] investigated laser lap welding for producing similar and dissimilar material tab-to-busbar interconnects for Li-ion battery assembly. It was reported that it is feasible to weld dissimilar material tab-to-busbar interconnects using laser. They also studied laser welding Al to Ni by wobbling the laser beam. a circular weld seam with 5 mm diameter was formed. Based on their testing results, maximum shear-force of 930 N of the weld joint was obtained [17]. Trinh et al. [18] studied the characteristics of laser welding of a thin aluminum tab and steel battery case. The results verified that the laser power significantly affects the morphology of the weld, and formation of explosive holes significantly reduces the joint strength. Dimatteo et al. [19] reported laser welding of dissimilar copper and aluminum alloys in multilayer configuration for joining battery tabs. In their study, galvanometric scanner optics was used to obtain a spatial beam oscillation (circular wobbling) of the beam. The results confirmed that the presence of harder and brittle IMCs was reduced using the circular wobbling beam. All these studies tried to overcome the joint strength reduction resultant from the formation of IMCs for different types of dissimilar materials joining. However, there were few reports of laser welding of Ni to Al sheets for battery applications, in-depth study of the IMC formation mechanisms or examination of the relationship to with weld performance.
In this paper, laser welding pure Ni to pure Al sheets was studied and compared using pulsed-wave (PW) and continuous-wave (CW) lasers. The novelty of this study is the proposed concept for regulating the laser welding process to achieve a weld-brazed joint. Micro-structure, hardness, phase formation and weld performance were investigated and tested. Mechanisms of defects formation and IMCs evolution were analyzed and discussed. This study is helpful for understanding the relationships among the laser welding process, weld quality and IMCs formation, as well as joint performance, to establish the welding strategy to achieve a sound Ni-Al joint.

2. Materials and Methods

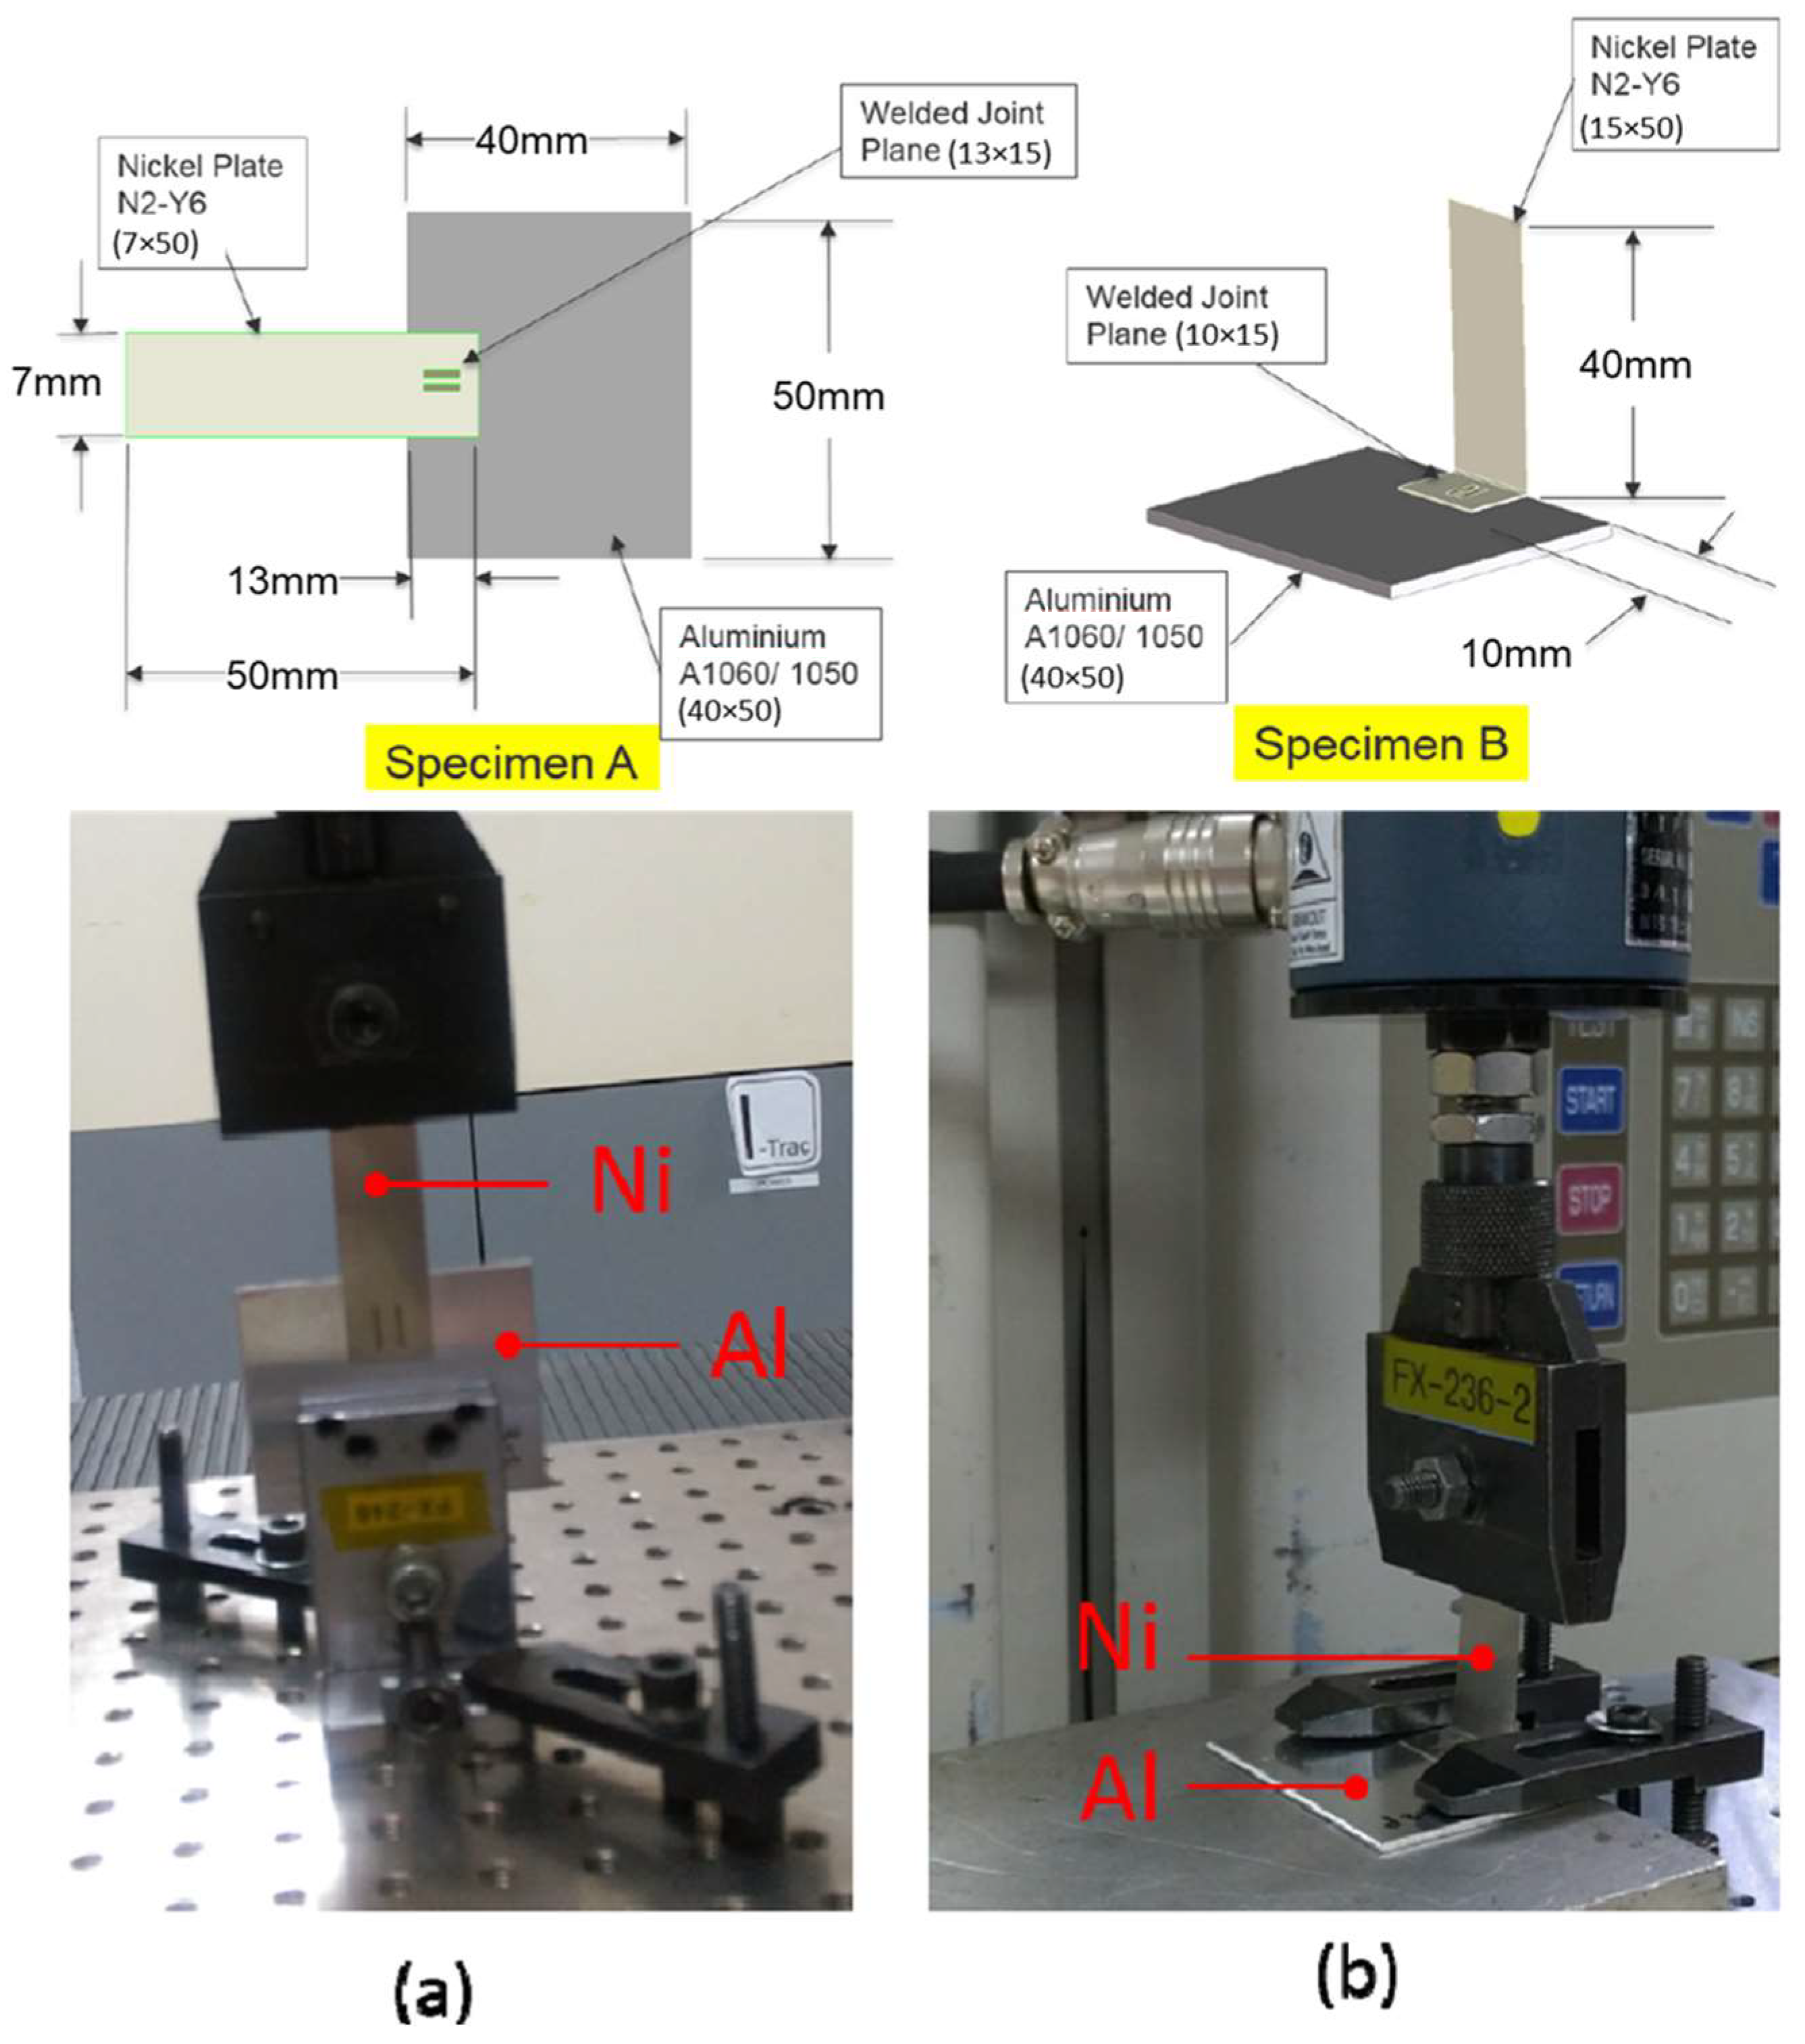
In this study, 0.3 mm thick pure Ni sheets (50 mm × 7 mm) and 1.5 mm thick pure Al sheets (50 mm × 40 mm) were used with a lap-joint configuration, as shown in Figure 1. The dimensions of the samples were determined according to the real system of the adaptor busbar. Before laser welding, the materials were cleaned using IPA to remove any grease that remained on the surface. A set of mechanical clamps were applied to minimize the gap between two welding materials. During welding, argon gas was supplied to protect melting pools from avoiding external atmospheric contamination. The chemical compositions and physical properties of both materials are listed in Table 1 and Table 2, respectively. The Ni sheet was placed on top of the Al sheet in order to minimize the melting of the Al material, as Al has a much lower melting point than Ni, as shown in Table 2.
The abovementioned materials were welded using a continuous wave (CW) and a pulsed wave (PW) laser source, respectively. The CW laser source from IPG (model: YLS −6000) has a nominal wavelength of 1070 nm and a focused circular beam size of 0.2 mm in diameter, while the PW laser source from the LASAG (model: FLS 542CL-307HP) has a nominal wavelength of 1064 nm and a focused circular beam size of 0.5 mm in diameter. The process parameters were studied and optimized based on our previous study [20] and preliminary investigations. When using the PW laser, the experiments were performed at different levels of laser power whilst welding speed, pulse duration time and pulse frequency were kept fixed. For the experiments performed using the CW laser, the laser power and the welding speed were fixed, whereas the focal point position was varied. The process parameters are presented in Table 3.
Multiple samples were welded for process optimization and to guarantee reproducibility. After laser welding, the surface appearance, macrostructure and microstructure of the welds were observed using an optical microscope (OM, Olympus, Japan). Hardness distribution was evaluated by using a MMT-X3 digital micro-Vickers hardness tester (MATSUZAWA, Japan) with a 25 g loading force and a testing duration of 10 s. Chemical composition across welds was analyzed using a scanning electron microscope (SEM, Carl Zeiss, German) equipped with energy-dispersive X-ray spectroscopy (EDS) (X-Max, Oxford Instruments) to determine the intermetallics formed. Both a shear test and 90-degree peel test were performed to evaluate weld strength. As shown in Figure 2, the universal testing machine Instron 3367 and a fixture were used to conduct the shear test and 90-degree peel test. For each set of process parameters, 8 pieces of samples were welded: 4 pieces for the shear test and 4 pieces for the 90-degree peel test. A crosshead speed of 0.5 mm/min was set. The testing was conducted continuously until the Ni sheet was completely detached from the Al sheet and the maximum force was recorded. The average force was adopted to evaluate the properties of the welded samples.

3. Results

3.1. Evaluation of Weld Quality

Figure 3a–d show cross-sections of welds prepared by using the CW and PW laser sources, respectively. Comparing Figure 3a,b, it can be seen that the Ni sheet was completely melted and a deep weld was formed due to the high laser power, whether using a continuous laser or a pulsed laser. The severely dynamic melting pool during welding was unable to fill the weld crater during solidification. Therefore, high porosity and voids were formed in these welds. By comparing Figure 3a,c, it is very obvious that by controlling the power of the PW laser, the porosity in the weld can be significantly reduced, but the pores generated by the PW laser during the welding process could not be completely eliminated. In comparison of Figure 3b,d, it can be observed that when the CW laser was properly defocused, a Ni-Al weld-braze joint without any defect could be obtained. These results suggested that both laser power and focus position have significant effect on the occurrence of weld defects, as well as controlling the penetration depth and weld width when welding thin Al-Ni sheets. Using the CW laser and defocused beam, the penetration depth is easier to control to avoid the boiling of the melted Al and mixing with Ni, so that a clear weld interface without obvious defects can be achieved, as shown in Figure 3d. The widths of the weld joint shown in Figure 3c,d are 600 μm and 1700 μm, respectively. The penetration depth into the Al side shown in Figure 3c is 140 μm, whereas a much shallower penetration depth into the Al can be seen in Figure 3d. It is difficult to identify the weld joint interface in Figure 3a,b, due to the large pores formed. Thus, the dimensions of these two joints were not analyzed.
In addition, it can be seen that almost all obvious voids concentrate near the fusion boundaries at the Al side. This is because the aluminum alloy very easily generates plasma during the high-energy laser welding process. On the one hand, these plasmas reduced the penetration depth of the weld, and on the other hand, the generated plasma was concentrated on the aluminum alloy side of the fusion line boundary, resulting in the formation of voids.

3.2. IMCs Formation

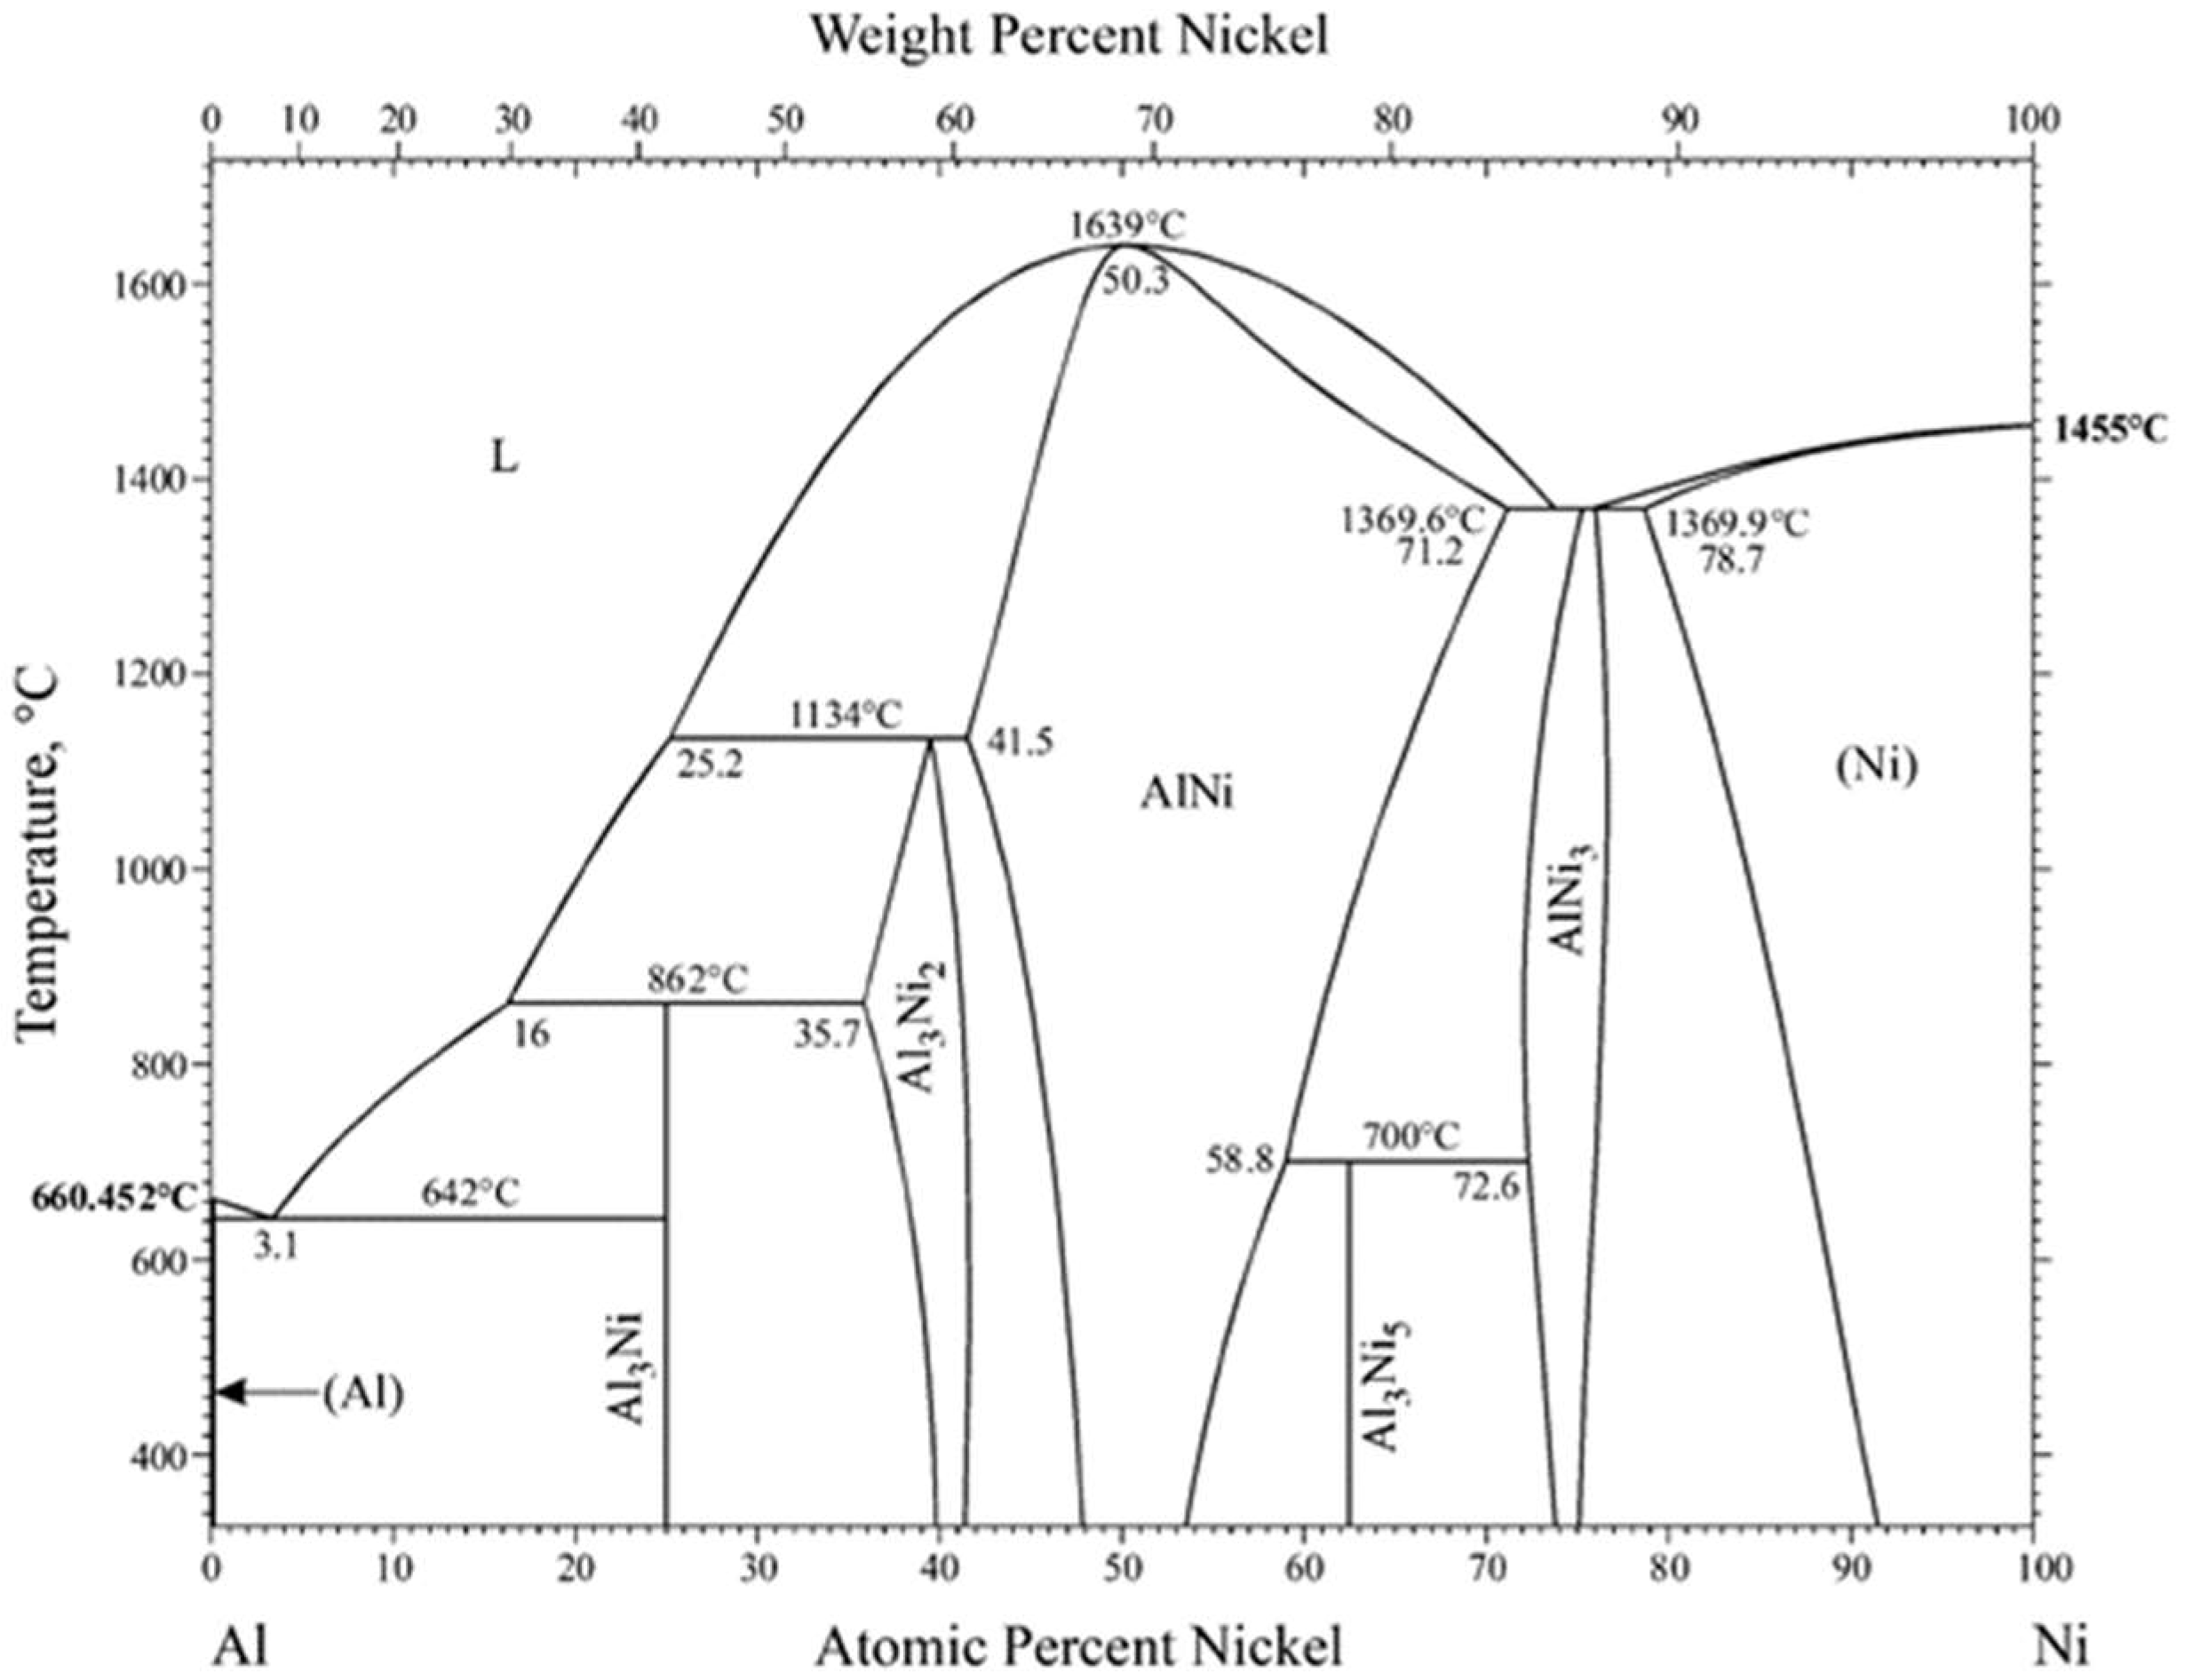
In this section, the phases formed in the laser welded samples were studied. During the laser welding process, Ni and Al were melted in a short time and then mixed in the melting pool. After rapid cooling, IMCs formed in the weld. According to Al-Ni phase diagram as shown in Figure 4 [21], a variety of IMCs are possibly produced during the laser welding of Ni and Al, including Al3Ni, Al3Ni2, AlNi, Al3Ni5 and AlNi3, etc., depending on the temperature and element constitution. IMCs formation could be qualitatively identified using the energy-dispersive X-ray spectroscopy (EDS) in the case of dissimilar metal welding. Hence, the EDS of the scanning electron microscope (SEM) was used to determine the composition of the compounds formed in a different weld, as shown in Figure 5, Figure 6, Figure 7 and Figure 8.
Figure 4. Al-Ni phase diagram. Reprinted/adapted with permission from Ref. [21]. 2019, Springer.
Applsci 13 01356 g004
The SEM images with higher magnification in Figure 5, Figure 6, Figure 7 and Figure 8 are enlarged from the marked areas of the inserted images. The cross represents the areas used to perform the EDS analysis. It can be seen from the EDS measurement value in Figure 5 that Ni remains the major element near the fusion zone with a content of about 89 wt.%, while the Al element is always lower than 10 wt.%. Based on the EDS measurement results and the Al-Ni phase diagram in Figure 4, AlNi3 would be formed near the fusion zone when the PW laser was used to weld Ni and Al with 150 W laser power.
Figure 5. SEM image with high magnification, EDS results in areas A-D of the Al-Ni joint welded using PW laser with 150 W laser power.
Applsci 13 01356 g005
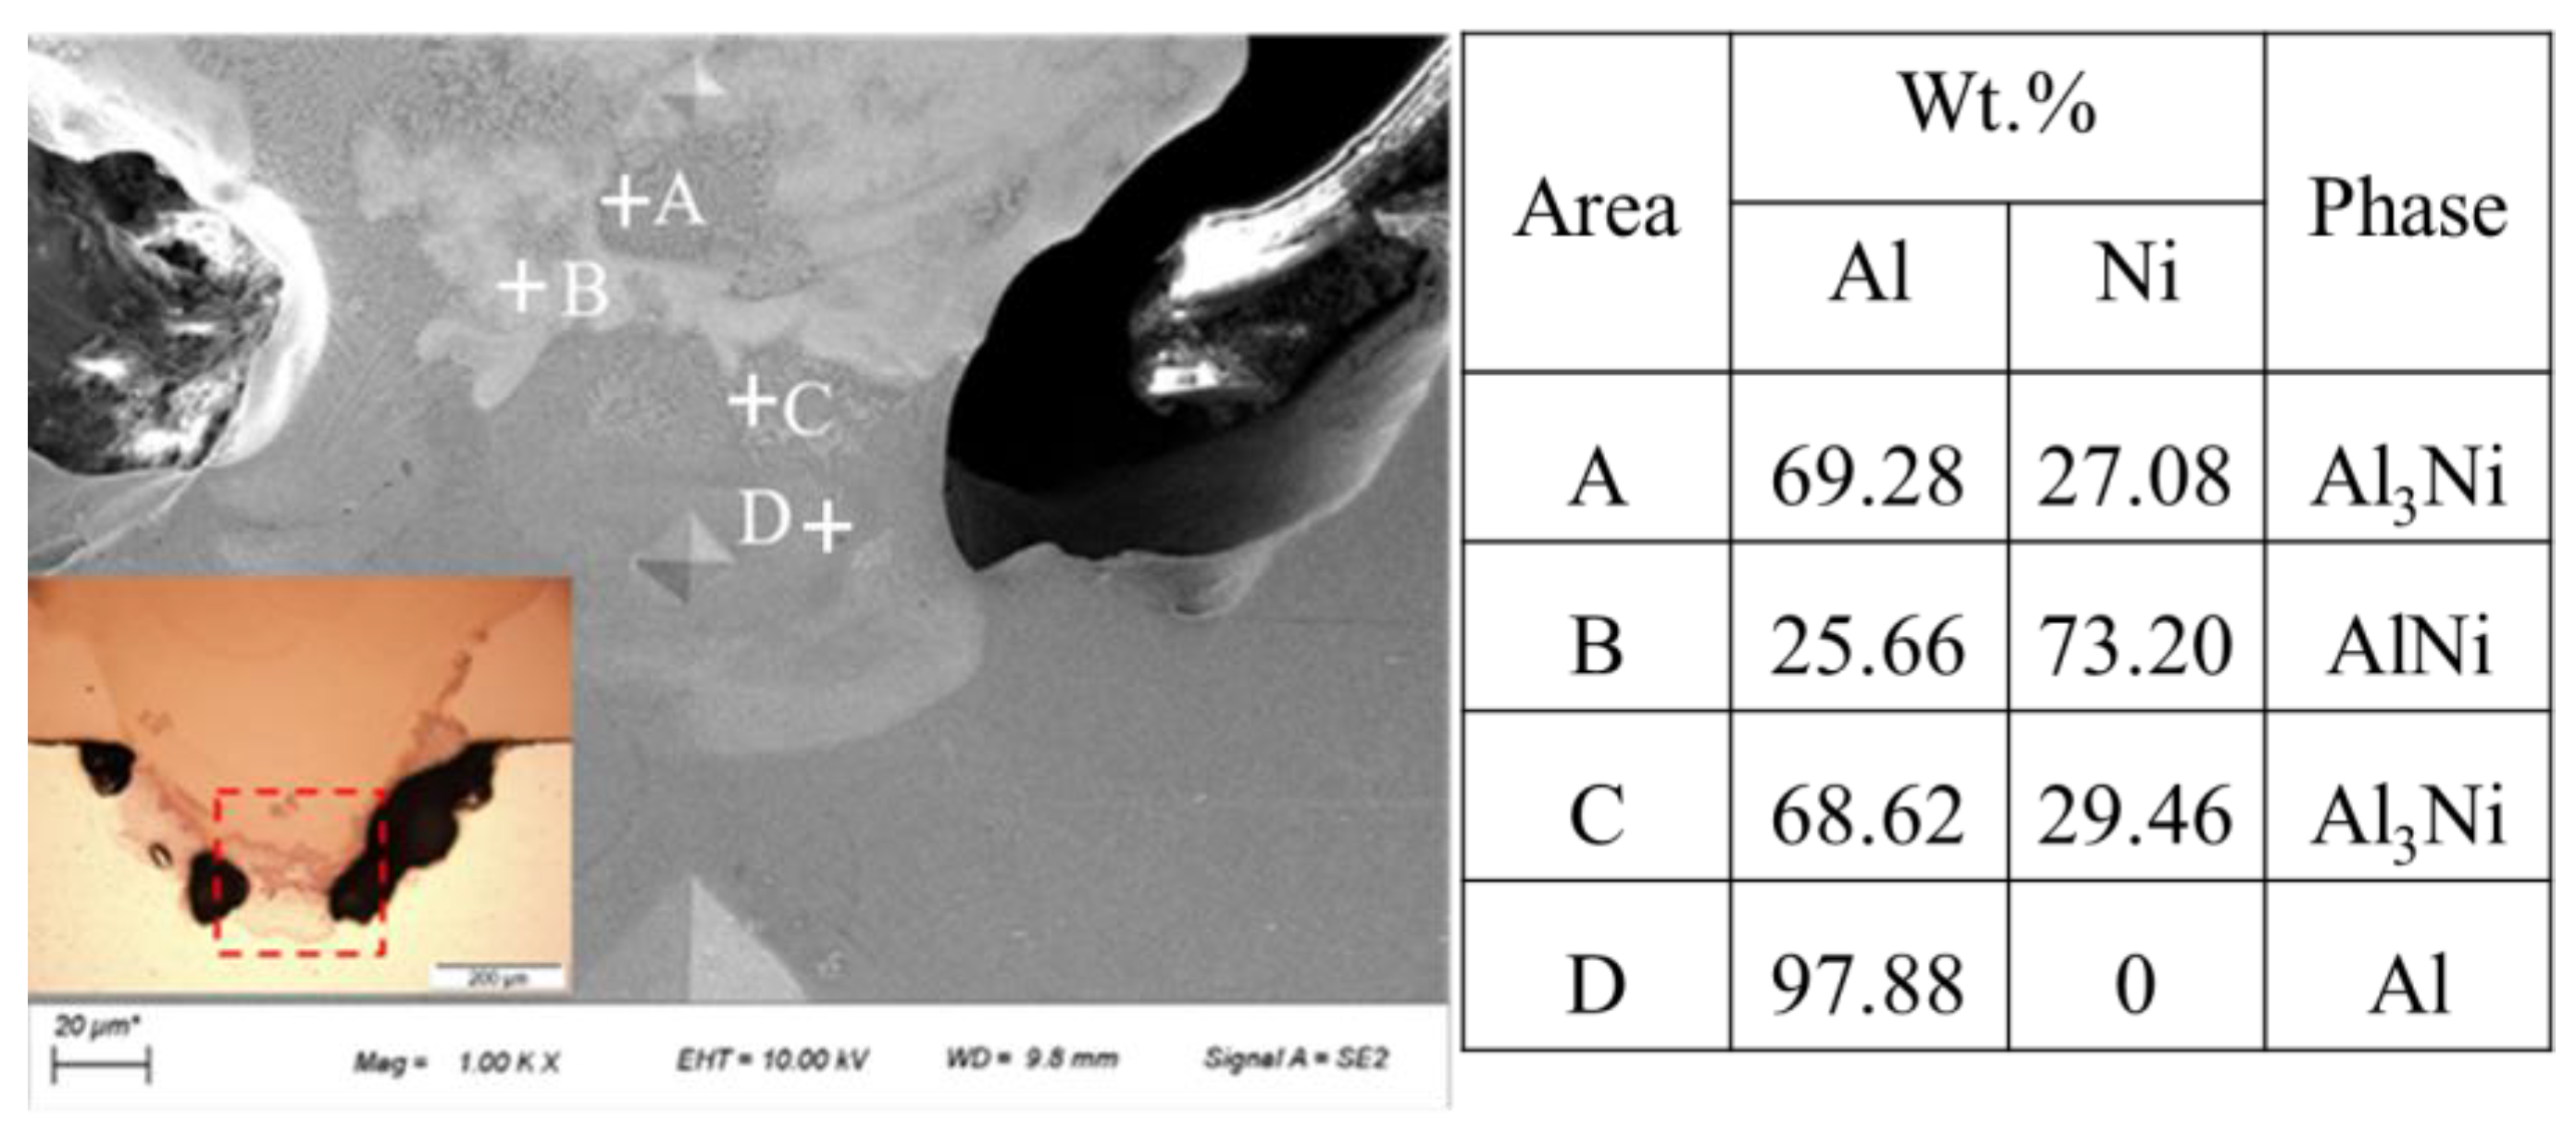
When Ni and Al were welded using a focused CW laser beam with 1800 W laser power, various IMCs could be formed near the fusion zone, as shown in Figure 6. Areas A and C with similar microstructure were recognized as Al3Ni IMC. Area B was identified as AlNi IMC, while area D was considered the rich-Al phase. It can also be seen from Figure 6 that the area C near the bottom layer of the weld mainly generated Al3Ni due to the lower temperature, while the area B near the upper layer of the weld generated AlNi due to the higher temperature. In addition, the melted Al flowed and mixed with Ni due to the dynamics of the melting pool and then formed the soft Al3Ni during the solidification process, which can be identified by the measured hardness, as shown in Figure 9.
Figure 6. SEM image with high magnification, EDS results in areas A–D of the Al-Ni joint welded using a focused CW laser with 1800 W laser power.
Applsci 13 01356 g006
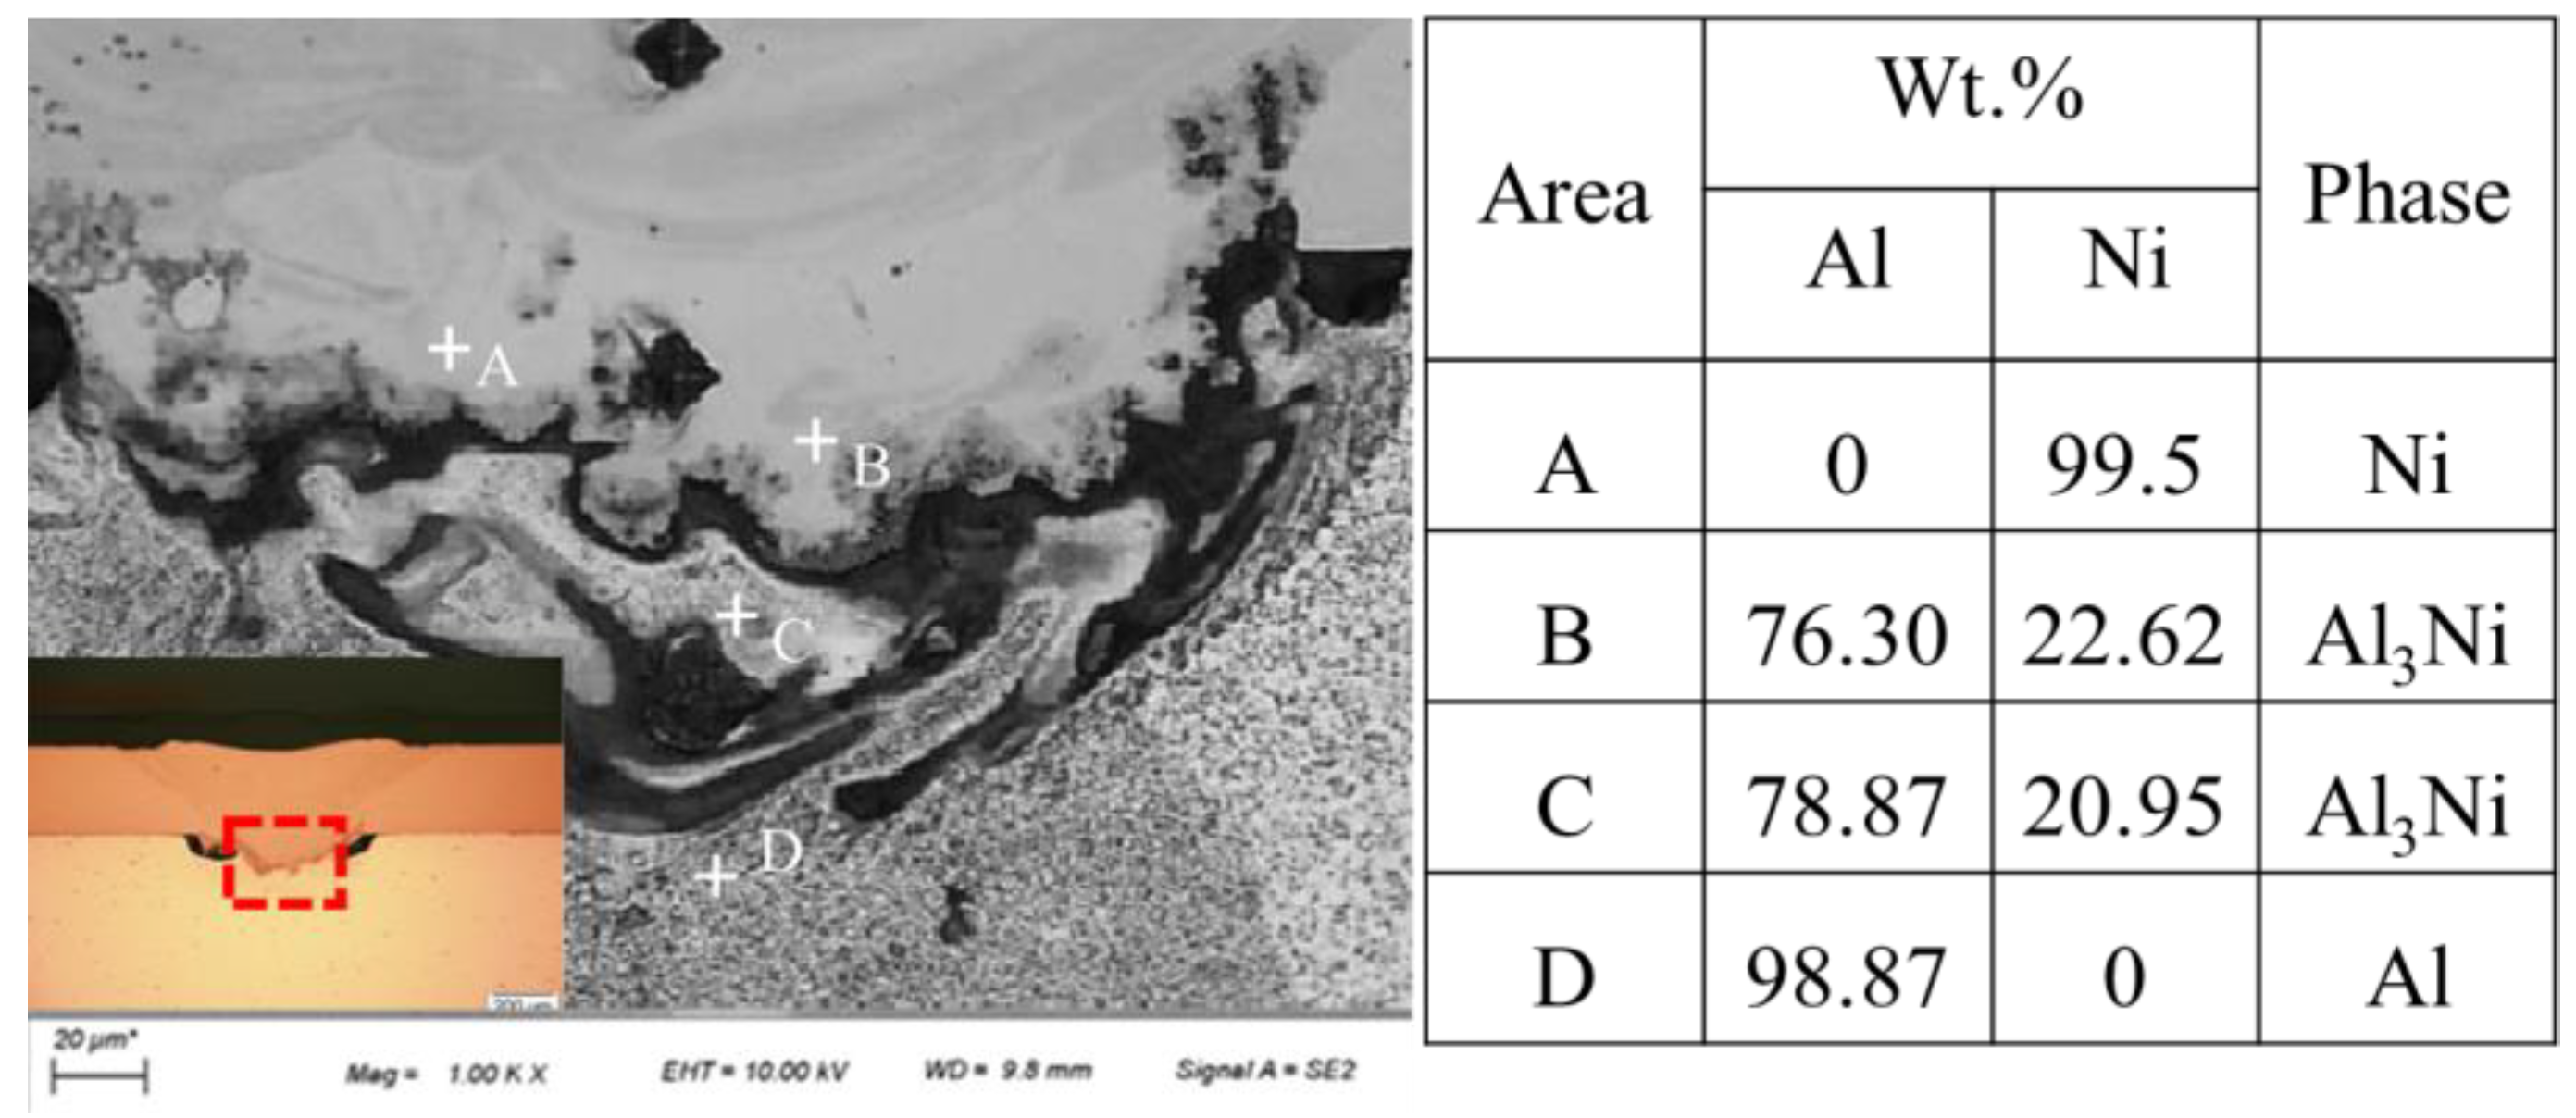
As shown in Figure 7, when Ni and Al was welded with 120 W PW laser power, a significant reduction in material mixing and reduction of defects was observed. The weld penetration and the melting of the Al sheet were limited and the Ni content in the melting pool was significantly lower than that produced using 150 W PW laser power.
Figure 7. SEM image with high magnification, EDS results in areas A–D of the Al-Ni joint welded using PW laser with 120 W laser power.
Applsci 13 01356 g007
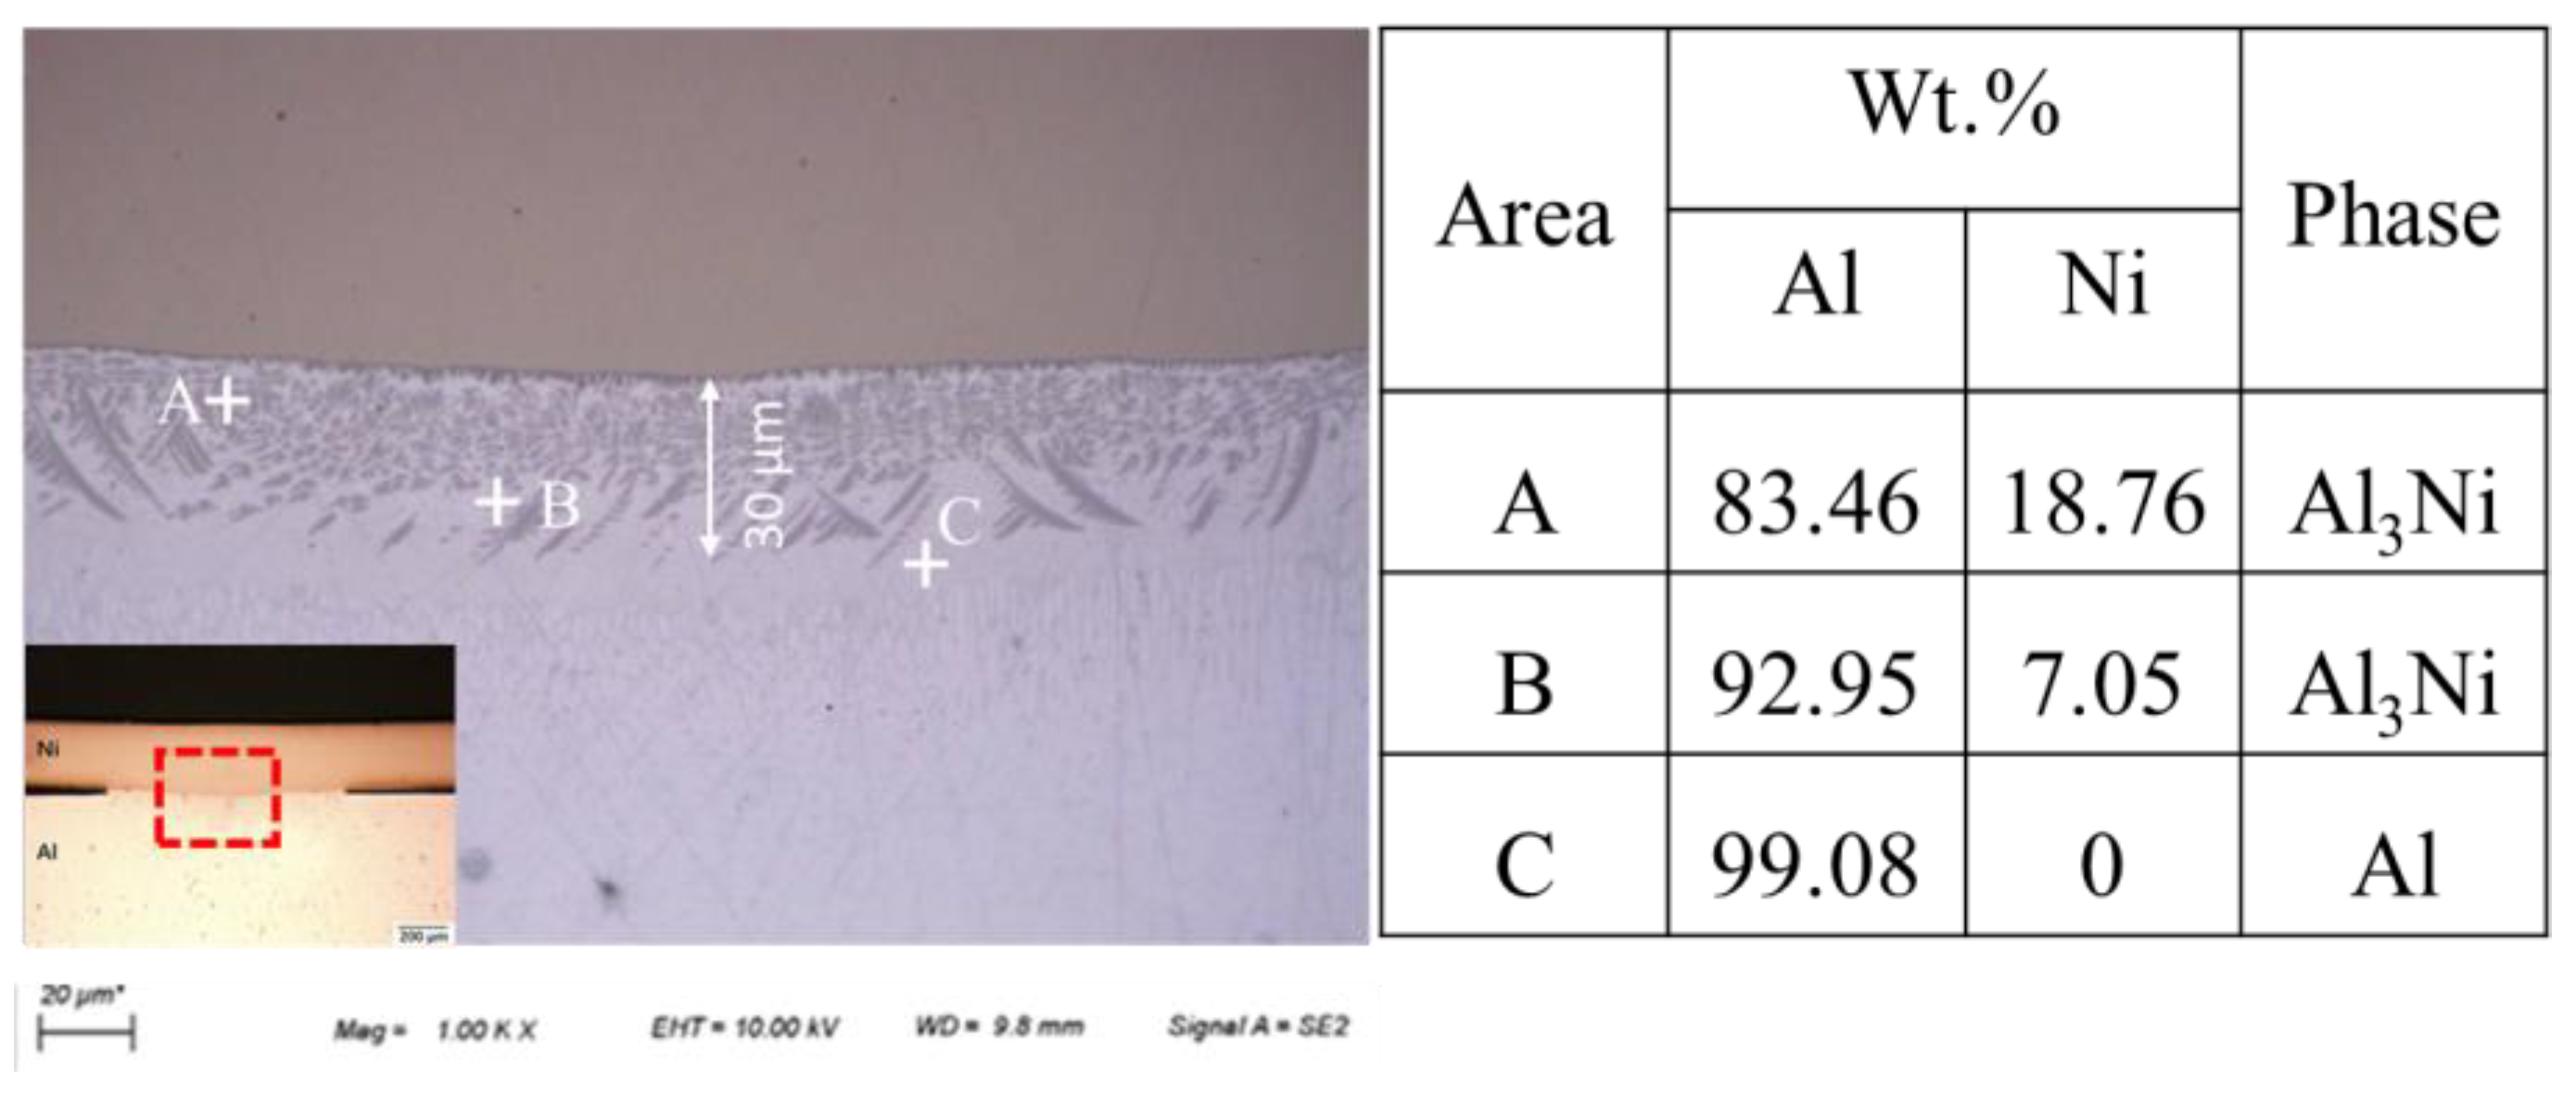
Further improvement in the weld quality can be observed in Figure 8 using 1800 W CW laser power at focal point position of +5 mm. The melting of Al is further reduced to form a weld- braze joint with an intermetallic layer thickness of less than 30 µm. Based on the EDS results and in accordance with the Al-Ni phase diagram analysis, it could be seen that the Al3Ni generated in the fusion zone should be dominant. This is beneficial to the improvement of weld strength.
Figure 8. SEM image with high magnification, EDS results in areas A–D of the Al–Ni joint welded using CW laser with 1800 W laser power at focal point position of +5 mm.
Applsci 13 01356 g008

3.3. Microhardness

Formation of IMCs has a direct relationship with the hardness and strength of the weld. In this study, we performed the hardness testing along with the lines shown in the inserted images in Figure 9. The hardness distributions across the base material and the welds are presented in Figure 9a–d.
Figure 9. The hardness distribution of laser weld: (a) PW (150 W), (b) CW (1800 W, focal point position 0), (c) PW (120 W) and (d) CW (1800 W, focal point position +5).
Applsci 13 01356 g009
As shown in Figure 9a, most hardness values measured along the top line in the fusion zone of the sample with 150 W PW laser are in the range of 250 Hv to 350 Hv, whereas the measured hardness at the bottom line is about 450 Hv, which correlates well to the formation of the AlNi3. In addition, due to the appearance of a large number of pores along the bottom of the fusion zone, only limited measurement points can be taken. Figure 9b shows the hardness results of the sample welded using a CW laser with 1800 W laser power at focal point position zero. Due to the mixing of possible low-hardness Al3Ni and high-hardness AlNi in the fusion zone, the hardness value of the fusion zone along the bottom line of the weld ranges from 150 Hv to 450 Hv. The hardness along the top line of the weld varies between 220 V and 350 V, as shown in Figure 9b. When the PW laser power is reduced to 120 W, the hardness in the fusion zone is lower, in the range of 100 Hv to 200 Hv, as shown in Figure 9c. This results from the fact that the material mixing in the fusion zone is very minimal and the formation of the soft Al3Ni should be dominant. Figure 9d shows the hardness profiles along the top line and bottom line of the sample welded using a defocused CW laser with 1800 W laser power. As observed in Figure 8, the fusion zone is very narrow, performing the hardness measurement along the joint interface. Hence, the measurement was conducted vertical to the joint interface. Hardness distributions along three different vertical lines were presented in Figure 9d. The hardness distributions are quite identical among the three measured lines. Hardness values from the Ni side are similar to the value of as-received Ni sheet. Similarly, hardness values in the Al side are close to the value of as-received Al sheet. The hardness of the fusion zone indicates that the Al3Ni IMCs are dominant. Some hardness values are relatively low, due to the fact that the indentations may partially cover the soft Al.
By comparing the distribution of weld hardness values obtained via laser welding of Al-Ni using different process conditions, it can be seen that the hardness value of the fusion zone depends on the type of intermetallic compounds produced during welding. Deep penetration and severe mixing of the two materials will lead to the formation of IMCs with high hardness, as well as obvious defects.

3.4. Joint Strength Analysis

As discussed in the previous sections, the samples welded using a PW laser with 150 W power and a focused CW laser with 1800 W power have obvious defects and brittle IMCs. These include AlNi3 and AlNi. The samples are easily broken by hands, and it is difficult to analyze the weld performance quantitively. Thus, both shear test and 90-degree peel test were only conducted for the samples welded using the PW laser with 120 W power and the defocused CW laser with 1800 W power.
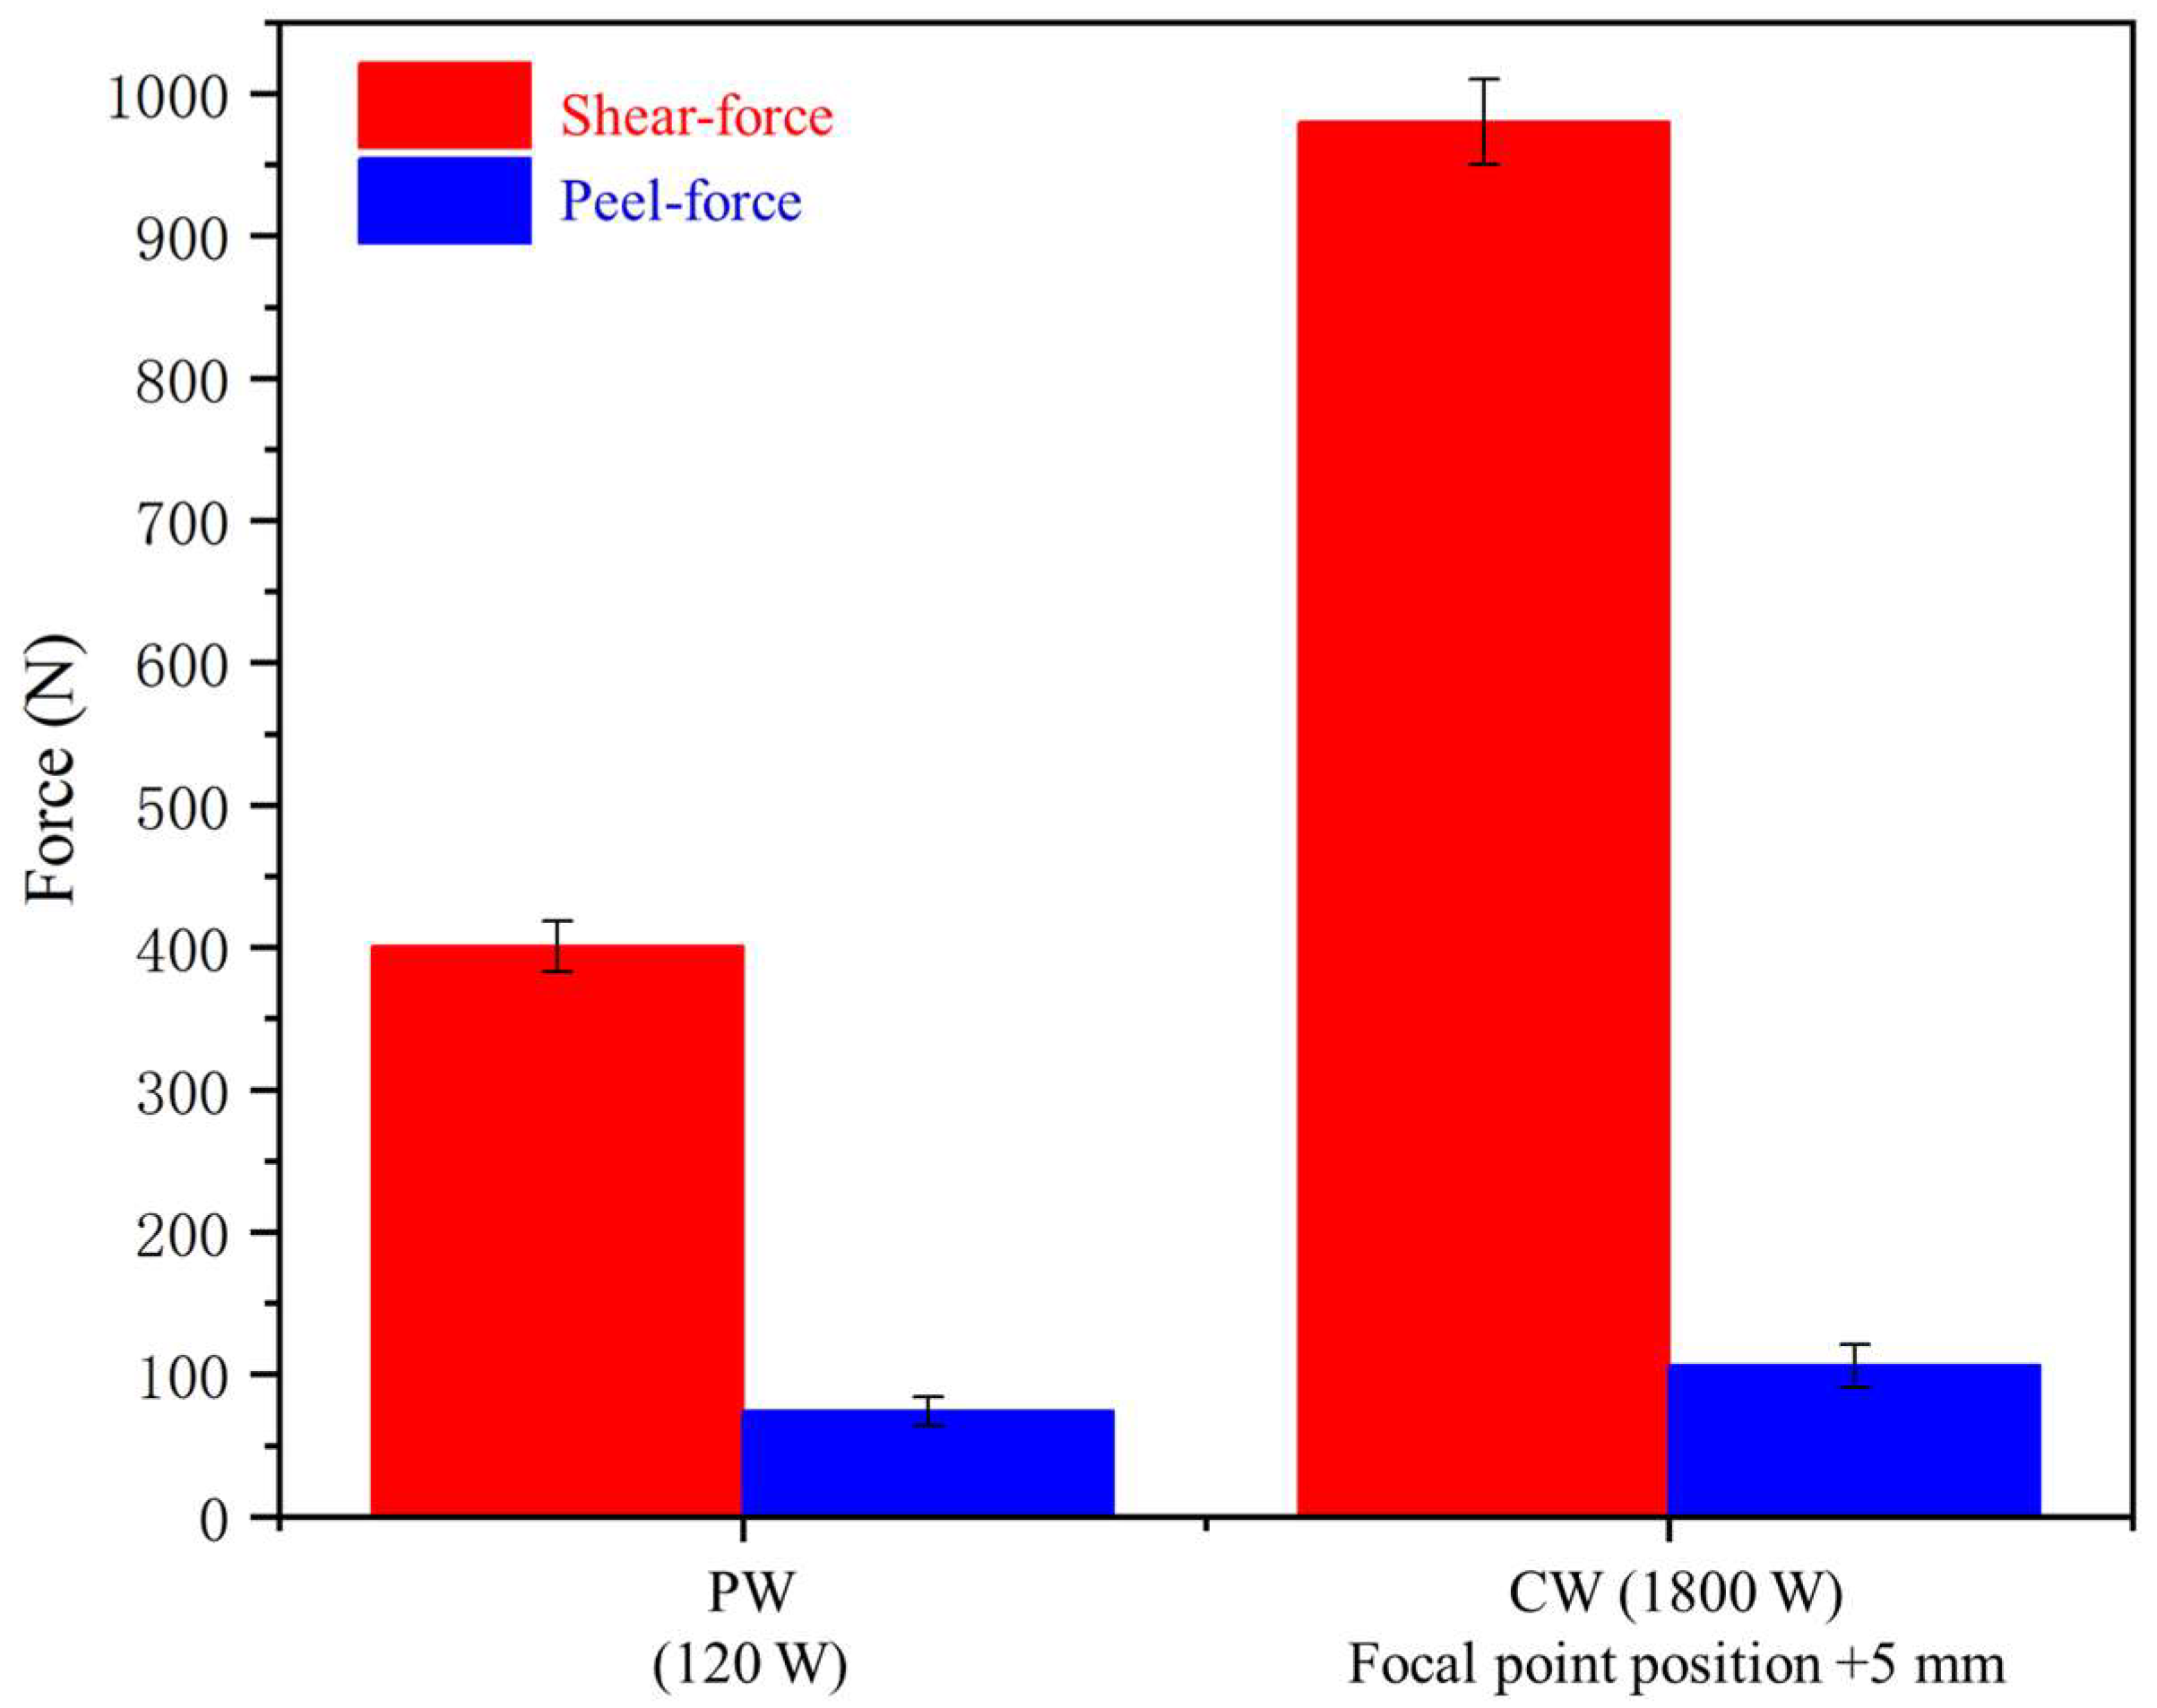
The testing results are presented in Figure 10. A good reproducibility of the weld joint can be reflected by the error bars shown in Figure 10. It shows that the samples welded using a defocused CW laser with 1800 W laser power can withstand an average shear-force of 980 N, which is much higher than that of the samples welded using the PW laser. Similarly, it also shows a better performance under the 90-degree peel test with an average peel force of 110 N. The ability of the welds against the force applied shows close relationships with the weld quality and IMCs formation. According to the cross-section view and EDS analysis of the welded samples, the CW laser welding with defocused beam can achieve defect-free welds, and form Al3Ni with low hardness. As discussed previously, under this process condition, a weld–braze joint can be obtained, which means the melting of the Al sheet beneath the Ni sheet can be minimized. On one hand, the plasma at the Ni-Al interface can be suppressed to avoid the formation of pores; on the other hand, the melt temperature can be lowered to restrain material mixing, as well as to fulfil the conditions for formation of a thin layer of Al3Ni IMC. These beneficial conditions are difficult to manipulate when using a pulsed laser, as high peak power of the laser tends to increase the melting pool temperature and form a deep penetration weld with severe material mixing, leading to the formation of obvious defects, as well as brittle intermetallics, as verified by the results shown in this study.

4. Conclusions

In this study, experiments of laser welding of Ni to Al were conducted using PW and CW lasers. The formation of IMCs and the resultant weld performance were analyzed and discussed. Based on the results and discussions, the following conclusions can be drawn:
  • Deep penetration and overheating low-melting-point Al is the main reason causing the formation of pores at the Ni-Al interface and severe mixing of the Ni and Al in the melting pool.
  • It is critical to control the penetration depth through the selection of the operation mode of the laser, as well as the optimization of process parameters, so that the formation of defects and undesired IMCs (AlNi3 and AlNi) could be avoided.
  • The IMCs show a significant effect on the hardness of the weld, whereas the defects and brittle IMCs jointly degrade the weld to withstand the shear force and peel force.
  • It is feasible to achieve a weld-braze joining condition using a defocused CW laser beam, through which defects-free and strong Ni-Al joint can be obtained. Due to the nature of high peak power resulting in deep penetration, it is difficult to obtain comparable joint quality using a pulsed laser.

Author Contributions

L.C.: Validation, investigation, formal analysis, writing—original draft; Y.L.: Formal analysis, writing—original draft, funding acquisition; H.-C.C.: Conceptualization, methodology, investigation, writing—review and editing; L.Z.: Validation, investigation, formal analysis, writing—review and editing; H.S.: Writing—review and editing; G.B.: Conceptualization, methodology, investigation, writing—review and editing. All authors have read and agreed to the published version of the manuscript.

Funding

This research was funded by GDAS’ Project of Science and Technology Development (No. 2022GDASZH-2022010108), the National Natural Science Foundation of China (No. 51976007), and Science and Technology Innovation Project of Foshan (No. FS0AA-KJ919-4402-0101-07).

Institutional Review Board Statement

Not applicable.

Informed Consent Statement

Not applicable.

Data Availability Statement

The data presented in this study are available on request.

Conflicts of Interest

The authors declare no conflict of interest.

References

  1. Kumar, N.; Das, A.; Dale, T.; Masters, I. Laser wobble welding of fluid-based cooling channel joining for battery thermal management. J. Manuf. Process. 2021, 67, 151–169. [Google Scholar] [CrossRef]
  2. Zhao, J.Z.; Li, H.; Choi, H.; Cai, W.; Abell, J.A.; Li, X.C. Insertable thin film thermocouples for in situ transient temperature monitoring in ultrasonic metal welding of battery tabs. J. Manuf. Process. 2013, 15, 136–140. [Google Scholar] [CrossRef]
  3. Chen, W.H.; Che, Y.B. Design of Lead-acid Battery Management System. Sci. Net 2014, 533, 331–334. [Google Scholar]
  4. Das, A.; Li, D.; Williams, D.; Greenwood, D. Joining technology for automotive battery systems manufacturing. World Electr. Veh. J. 2018, 9, 22. [Google Scholar] [CrossRef] [Green Version]
  5. Brand, M.J.; Schmidt, P.A.; Zaeh, M.F.; Jossen, A. Welding techniques for battery cells and resulting electrical contact resistances. J. Energy Storage 2015, 1, 7–14. [Google Scholar] [CrossRef]
  6. Schweier, M.; Heins, J.F.; Haubold, M.W.; Zaeh, M.F. Spatter formation in laser welding with beam oscillation. Phys. Procedia 2013, 41, 20–30. [Google Scholar] [CrossRef] [Green Version]
  7. Wang, Y.; Qin, W.Z.; Li, Y.; Tang, D.; Wang, L. Al/Ni reactive multilayer films enhancing the properties of plasma induced by nanosecond pulsed laser. Energetic Mater. Front. 2021, 2, 147–153. [Google Scholar] [CrossRef]
  8. Solchenbach, T.; Plapper, P.; Cai, W. Electrical performance of laser braze-welded aluminum–copper interconnects. J. Manuf. Process. 2014, 16, 183–189. [Google Scholar] [CrossRef]
  9. Kraetzsch, M.; Standfuss, J.; Klotzbach, A.; Kaspar, J.; Brenner, B.; Beyer, E. Laser beam welding with high-frequency beam oscillation: Welding of dissimilar materials with brilliant fiber lasers. Phys. Procedia 2011, 12, 142–149. [Google Scholar] [CrossRef]
  10. Das, A.; Butterworth, I.; Masters, I.; Williams, D. Evaluation of key geometrical and mechanical properties for remote laser welded AC-170PX Aluminium joints. J. Manuf. Process. 2019, 14, 1–7. [Google Scholar]
  11. Ishak, M.; Yamasaki, K.; Maekawa, K. Lap fillet welding of thin sheet AZ31 magnesium alloy with pulsed Nd: YAG laser. J. Solid Mech. Mater. Eng. 2009, 3, 1045–1056. [Google Scholar] [CrossRef] [Green Version]
  12. Schmalen, P.; Plapper, P. Evaluation of laser braze-welded dissimilar Al-Cu joints. Phys. Procedia 2016, 83, 506–514. [Google Scholar] [CrossRef]
  13. Zhao, X.H.; Shi, Z.F.; Deng, C.; Liu, Y.; Li, X. The effect of laser offset welding on microstructure and mechanical properties of 301L to TA2 with and without Cu intermediate layer. Metals 2020, 10, 1138. [Google Scholar] [CrossRef]
  14. Lei, Z.; Zhang, X.; Liu, J.; Li, P. Interfacial microstructure and reaction mechanism with various weld fillers on laser welding-brazing of Al/Cu lap joint. J. Manuf. Process. 2021, 67, 226–240. [Google Scholar] [CrossRef]
  15. Meco, S.; Ganguly, S.; Williams, S.; McPherson, N. Design of laser welding applied to T joints between steel and aluminium. J. Mater. Process. Technol. 2019, 268, 132–139. [Google Scholar] [CrossRef]
  16. Chen, S.H.; Yu, G.Y.; Li, S.Q.; Yang, J.; Huang, J.H.; Chen, S.J. Interfacial microstructures and mechanical property of Ni/Al dissimilar butt joint made by laser welding. J. Manuf. Process. 2020, 50, 17–23. [Google Scholar] [CrossRef]
  17. Kumar, N.; Masters, I.; Das, A. In-depth evaluation of laser-welded similar and dissimilar material tab-to-busbar electrical interconnects for electric vehicle battery pack. J. Manuf. Process. 2021, 70, 78–96. [Google Scholar] [CrossRef]
  18. Trinh, L.N.; Lee, D. The Characteristics of Laser Welding of a Thin Aluminum Tab and Steel Battery Case for Lithium-Ion Battery. Metals 2020, 10, 842. [Google Scholar] [CrossRef]
  19. Dimatteo, V.; Ascari, A.; Fortunato, A. Dissimilar laser welding of copper and aluminum alloys in multilayer configuration for battery applications. J. Laser Appl. 2021, 33, 042028. [Google Scholar] [CrossRef]
  20. Chua, S.F.; Chen, H.C.; Bi, G. Influence of pulse energy density in micro laser weld of crack sensitive Al alloy sheets. J. Manuf. Process. 2019, 38, 1–8. [Google Scholar] [CrossRef]
  21. Okamoto, H. Supplemental Literature Review of Binary Phase Diagrams: Al-Ni, B-Hf, Ca-Sc, Cr-Sc, Fe-Rh, Hf-Mn, La-Sb, Ni-Re, Ni-Sm, Ni-Zr, Sb-Tb, and Ti-Zr. J. Phase Equilib. Diffus. 2019, 40, 830–841. [Google Scholar] [CrossRef]
Figure 1. Test specimen size.
Applsci 13 01356 g001
Figure 2. Weld strength testing set-ups: (a) shear test; (b) 90-degree peel test.
Applsci 13 01356 g002
Figure 3. Macro view of the laser welded Ni to Al: (a) PW (150 W), (b) CW (1800 W, focal point position 0), (c) PW (120 W) and (d) CW (1800 W, focal point position +5 mm).
Applsci 13 01356 g003
Figure 10. Results of shear test and 90-degree peel test.
Applsci 13 01356 g010
Table 1. Chemical composition of two welding materials.
MaterialChemical Composition (wt. %)
SiFeCuMnMgNiZnTiAl
1060Al0.250.350.050.030.03 0.050.03Bal.
Ni200 0.02Bal.
Table 2. Physical properties of two welding materials.
MaterialMelting Point (°C)Thermal Conductivity
(W/m k)
Density (g/cm3)Hardness (Hv)
1060Al660247.02.7020
Ni200145382.98.90140
Table 3. The laser welding process parameters.
No.Laser SourceAverage Laser Power (W)Welding Speed (mm/min)Pulse Duration (ms)Pulse
Frequency (Hz)
Focal Point Position
tp the Top Surface (mm)
(a)PW1508002.5150
(b)CW18003600--0
(c)PW1208002.5150
(d)CW18003600--+5
Disclaimer/Publisher’s Note: The statements, opinions and data contained in all publications are solely those of the individual author(s) and contributor(s) and not of MDPI and/or the editor(s). MDPI and/or the editor(s) disclaim responsibility for any injury to people or property resulting from any ideas, methods, instructions or products referred to in the content.