1. Introduction
In recent decades there has been a renaissance in renewable energies due to the proximity of the exhaustion of fossil energy sources, the progressive increase in their cost, the environmental problems derived from their exploitation, transport and consumption, and, of course, due to the great external dependence of many countries on this type of energy sources, which also implies that energy supply and the economy are directly linked to the geopolitical instabilities that may exist between different countries.
Renewable energies, through their different technologies, are playing a fundamental role in achieving sustainable development from the energy point of view and in meeting objectives against climate change and environmental degradation, objectives expressed by different international organisations and institutions in recent years, such as the United Nations and its Sustainable Development Goals [
1], specifically Goal 7, which aims to ensure access to affordable, reliable, sustainable and modern energy for all. The International Renewable Energy Agency (IRENA) has set a target of 57% of the world’s energy to be produced from renewable energy sources by 2030, compared to 26% at present [
2]. This increase in the share of renewable generation, which the European Union, through the European Green Deal and Green Recovery, is taking to an even greater extreme with the proposal for zero greenhouse gas emissions by 2050, means that this decade will be seen as the one in which a major global energy transformation will take place [
3]. A pathway to net zero emissions (PNZ) is therefore proposed, which requires the electrification of systems that are currently based on fossil fuels, such as air conditioning, the transport sector, and the mechanisation and activities of the secondary and primary sectors.
Thus, the challenge at the energy level is not only to generate the electricity currently required in a cleaner way, eliminating polluting energy sources from the generation mix, but also to further increase electricity generation capacity in order to accommodate within the electricity system sectors that require a high demand for energy and which are currently based on other polluting energy sources. Renewable energies will therefore have to provide the energy supply required for all current activity.
These renewable energies experienced an increase of 9.1% in installed capacity in 2021, which grew by 257 GW according to IRENA, a growth trend that was also experienced in 2020, which has shown its resilience in an adverse context such as the pandemic experienced due to Covid-19 [
4,
5]. Solar energy is, within the framework of renewable energies, one of those that can stand out for having greater technological development and greater possibilities of competing in the market. Specifically, in 2021, solar PV energy was the leading renewable energy technology and the most installed worldwide. New PV capacity in 2021 was 175 GW, an increase of 21% compared to 2020, exceeding 100 GW for the fourth consecutive year and reaching a cumulative 942 GW [
4,
5,
6]. This technology is driving the largest increase in renewable energy, overtaking wind in absolute terms [
2,
4]. It is an inexhaustible source of energy, it is distributed all over the world and it is one of the main technologies on which users are focused in order to meet the objectives of reducing polluting emissions [
7,
8]. In recent years, the technological development of this type of installation, together with the reduction in prices that has taken place (although the current crisis has reversed this trend in recent months), has meant that its use has become increasingly widespread [
4,
7,
9,
10,
11,
12,
13]. The growth of this technology is explained by the significant increase in the market on all continents, led by countries such as China, which held 31% of the global market, the United States, which installed 26.9 GW in 2021, India, with an estimated annual installed capacity of 13 GW in 2021, Japan with 6.5 GW, Brazil with 5.5 GW, Germany with 5.3 GW, Spain with 4.9 GW, Australia with 4.6 GW, South Korea with 4.2 GW and France with 3.4 GW [
5].
The opportunities for improvement in this sector are based on development at the level of installed capacity. However, there are also a series of challenges that must be addressed, among which the achievement of technological improvements must be highlighted, which undoubtedly seek to increase generation capacity, cost reduction and better integration into the grid. Improving the competitiveness of PV installations compared to other electricity generation technologies must be a priority for this sector, and to this end, it is essential to improve the efficiency and production of its elements and to have the least possible impact on the electricity grid.
In terms of increasing efficiency, research is focused on improving both the production processes and the long-term stability of cells and modules.
On the one hand, the aim is to increase the theoretical performance of the PV plant’s generation components by improving both the semiconductor materials currently used to manufacture PV modules, such as silicon or thin-film panels, and by making use of emerging panel technologies based on organic cells [
13,
14,
15]. It is also possible to improve the configuration and internal structure of the panels, as well as to make progress in the encapsulating or coating materials of the modules [
16,
17,
18,
19]. Work is also being done to optimise the mode of operation of the inverters in order to extract as much power as possible from the generator panels [
20,
21,
22]. It is also important, especially considering the increasing growth of this sector, to optimise the lifetime of the panels by analysing the causes of their degradation [
23,
24,
25], and, once this lifetime is over, to ensure that their impact is reduced as much as possible [
26,
27,
28,
29].
Regarding the operation of PV plants, once a certain technology has been installed, two important aspects to consider are the optimisation of their operation and the optimal integration of their production into the grid, if they are connected to it.
PV systems may have significant fluctuations in operation due to cloud cover, unplanned outages, dust, soiling, or temporary events such as failures and damages, or operation and maintenance (O&M) issues [
30]. Therefore, the implementation of means to assist in the diagnosis, monitoring and detection of these variations in production will allow easier performance of maintenance of the plant. The characterisation of the real margins in which a given PV installation operates allows preventive and predictive maintenance to be carried out, enabling a more active action instead of reactive fixes [
31]. This will result in a higher number of operating hours and, therefore, an increase in profitability. In this sense, an efficient O&M service is essential to achieve the best technical and economic performance of any PV system during its entire life cycle [
27,
32,
33,
34]. To improve this service, which can be extremely complex and time-consuming [
27], further innovations and developments are needed to provide a range of technological solutions or advanced services such as tools for automated fault or deviation detection [
35,
36,
37,
38], including even the use of digital twins [
27,
39], intelligent monitoring of modules by drones [
40,
41], proposed anti-dirt solutions [
41,
42] or systems to provide cooling [
43,
44,
45,
46] to optimise production [
47,
48].
Numerous authors have conducted various studies related to the analysis of the performance of components of grid-connected PV plants in different geographical locations, with different climatic conditions, studying the different factors that can influence it [
49]. To name a few, Roumpakias et al. analysed the performance of a plant in Greece for six years, studying the effects of degradation [
50], while Murat-Ates et al. analysed the performance of a rooftop plant in Turkey [
51]. Gopi et al. carried out a performance analysis at a utility-scale located in a rainy tropical monsoon climate [
52], Bansal et al. in a hot and dry climate [
53], Ihaddadene et al. in a dry arid climate in Algeria [
54] and Daher et al. in a maritime desert climate [
55]. Kumar et al. analysed the performance of PV installations located in water channels in India [
56]. Srivastava et al. analysed the performance of plants located in various parts of the world [
57] and found that their performance has improved over the years due to improved technologies. Adar et al. also compared the performance of panels of different technologies, such as monocrystalline, polycrystalline and amorphous Si, analysing their dependence on weather conditions [
58]. The performance of technologies was also compared in the work of Rasheedi et al., in this case at a plant in Kuwait [
59]. This type of performance analysis is usually based on the IEC 61724 PV system performance—Part 1: Monitoring standard, which regulates the parameters that must be measured and calculated to carry out this performance analysis depending on the type of PV installation [
60].
With regard to the integration of this type of renewable generation system into the electricity grid, it is also important to have production forecasting systems that make it possible to anticipate the amount of energy that will be produced, and the fluctuations and ramps in this production, which will help in the sizing of storage systems to support the management and participation in the electricity market of the production of this type of energy sources [
30,
48,
61,
62,
63]. Artificial intelligence techniques such as machine learning or deep learning are making it possible to address this type of question, and numerous tools are already available [
64,
65,
66,
67].
On the other hand, the aim is to minimise the impact of this production on the deviation of the parameters of the electricity network signal, so that these are within the supply quality intervals imposed by the regulations (standard EN-50160 Voltage characteristics of electricity supplied by public electricity networks [
68]) for the electricity signal that reaches consumers and, thus, prevent the operation of these plants from exceeding the limits that could cause damage to the elements of the network [
69,
70,
71,
72].
For all these issues, it is essential to first have monitoring systems in these plants that make it possible to know their operating parameters, as well as to obtain information on what is happening at their point of common coupling (PCC) and to have access to all the parameters that are recorded in them. Numerous studies have addressed the development of monitoring systems that make this information available [
31,
73,
74,
75,
76,
77]. However, the cost and complexity of existing PV monitoring systems restrict their use to large-scale PV plants [
78], and, most of the time, private PV systems are not being checked or supervised [
75]. A PV monitoring system should be low-cost to be broadly accepted [
75]. Although the increasing number of smaller-scale plants currently in operation do not usually have such monitoring systems in place, many of them do have the data recorded by the plants’ own inverters, which can be used to analyse the plant’s performance without the need for additional measuring equipment with an extra cost [
69,
79,
80].
In general, whether there is a monitoring system or not, the parameters and magnitudes that are measured must be processed and analysed in order to obtain useful information to extract knowledge to help carry out intelligent supervision of the different elements of the plants and to make decisions in the shortest possible time regarding their operation and integration in the electricity grid or information that helps to improve the design and installation of future plants.
Even in the absence of additional measurement sensors, PV plants generally produce a considerable amount of data [
75], which creates a complex analysis and performance calculation process [
27], so tools are needed to help manage this large volume of data, which, in addition to being acquired, must be processed, stored and analysed easily and effectively [
30,
48,
81]. Some authors propose solutions and tools based on Big Data for the analysis of data from PV plants [
27,
82,
83], highlighting among other aspects the importance of the correct organisation and storage of the data [
78].
A system of this type is inherently complex due to the wide variety of systems and elements that must be integrated [
83]. Different PV installations usually have different monitoring elements, with equipment of various models, which can record different types of parameters related to the production of the modules, the operation of the inverter itself, or some parameters of the grid signal, with different notations and/or units of measurement; and all this recorded information can be found in files with different types of formats. Even when monitoring is carried out by the plant’s own inverters, all this information does not necessarily have to be homogeneous but usually may vary from one inverter model to another, even within the same company.
Some leading companies in system technologies for PV applications, along with their inverter models and monitoring systems, provide Internet portals for the visualisation of the data recorded by their own equipment. These Internet portals provide access to display the data of numerous plants that owners have registered, and even have the option to display them in a shared way so that any user registered in the system can have access to them. However, on such platforms, the parameters that can be displayed and their graphical representations are often pre-configured or the configuration options are often very limited. These applications do allow the downloading of data in formats such as CSV. However, the files that can be downloaded are often highly disaggregated and have an organisation that may vary from one equipment model to another. Therefore, even with the use of these platforms, if you want to carry out a deeper and more personalised analysis of the data contained in these files, it is necessary to be able to manage them in an organised way in order to process all the information they contain.
In this context, the aim of this work is the development and implementation of an application to store, in an orderly and automated way, all the data files from the monitoring of the inverters of a set of PV plants, and to have access to them in a flexible and versatile way, in order to be able to process the data and analyse them in a much more detailed and in-depth way. The need arises from the agreement between the authors’ research group and the company called Solar del Valle S.L., whose activity consists of the installation and O&M of PV plants, in order to be able to make use of the data recorded in these plants and to be able to take advantage of all the information hidden in them.
The work has resulted in a tool, called
S·lar 2, which has allowed us to analyse the data recorded by the inverters and additional sensors in a group of PV plants. An earlier version of this tool is available in some previous publications [
79,
80].
The presented solution has several advantages, such as its capacity for the simultaneous processing of data from multiple plants, integrating all the plant’s measurement sensors, adapting to a variety of typologies and structures of measured data, calculating element performance parameters and aggregating and averaging data at different time intervals. The system is scalable to increase the number of plants to be analysed and allows the data to be homogenised. This facilitates the joint processing of their data for their possible aggregation and joint management, with a view to their integration into the grid, within the concept of the Virtual Power Plant (VPP) [
31,
84,
85,
86].
Although the current version of the tool is not prepared for real-time analysis, it is possible to store within it monitoring data, for example on a daily and/or weekly basis, and to conveniently carry out data processing, close to the concept of Edge Computing [
84], in order to supervise the operation of the plants under analysis.
After this introduction, which has described the context and objectives of the work to be established,
Section 2 describes the methodology, which shows how this tool has been developed,
Section 3 shows the developed databases, the application that allows access to the information, and an example of the analysis of the data stored in the management system. Finally,
Section 4 includes the conclusions of the work.
2. Methodology
The tool developed in this work has consisted of a storage system for the information monitored in a set of PV plants, together with a system that allows us to automatically load in it the monitored data and the information corresponding to the plants, and an application that enables to easily access the information. This system is characterised by the fact that it adapts to a variety of PV plant configurations, different equipment models, recording of different types of parameters and even using different nomenclature or units of measurement. In addition, all the information measured in the plants was generated and/or organised in different ways and with files in different formats, such that the tool developed for its analysis allows information to be stored from files in different formats, both CSV, which was already done in previous versions, and XML, which is one of the improvements compared to previous versions of the system [
79,
80]. Furthermore, it has been designed in such a way that it is scalable so that the study of new installations can be incorporated into the system or elements can be modified in those already being studied, such as the incorporation or replacement of inverters or sensors. The tool, therefore, allows the data collected in different plants to be unified, which facilitates the joint processing of their data for their possible aggregation and joint management, with a view to their integration into the grid and to analyse their behaviour at different time intervals, both in terms of recording time and determining accumulated data or hourly, daily, monthly, or annual averages.
2.1. Characterisation and Modelling of the System Whose Information Is to Be Managed
In this paper, the tool developed to carry out the management of the data monitored in the PV plants will consist first in a Relational Database Management System (RDBMS) that allows storage in an orderly, accessible, fast way and without space limitations of all the information corresponding to the real PV systems to be studied, including the specifications of each and every one of its components or equipment, its configuration, and all the data that are recorded by the different measurement elements.
The transcription of a real system to an RDBMS first needs to be modelled by defining a logical and conceptual model of all the elements that compose it, for which it is essential to have correctly characterised the complete real system. Subsequently, an RDBMS must be designed to allow the model of the real system to be transferred to it and to represent the real system as faithfully as possible. This will allow the efficient management of all the information.
The conceptual model in this case corresponds to the description of the configuration of the different elements that constitute the various PV facilities to be analysed, and of the existing relationships between these elements, some of which will be involved in the generation of the information to be organised and analysed in the data storage system that has been developed. This conceptual model must be independent of the RDBMS to be used. In this case, the RDBMS must include the real entities shown in
Table 1.
It is also necessary to consider the inverters in each of the plants, their technical specifications, and how this equipment is associated with the set of modules from which they receive the generated energy. If there are measurement sensors in the PV plant that record additional parameters to those measured by the inverters, such as meteorological parameters that affect the production of the plant, or the current generated in each string of PV modules (Igrid), the configuration of these sensors must also be considered in the RDBMS.
In addition to the different pieces of equipment that are part of the PV installations, it is necessary to characterise the data that are measured by the inverters or additional sensors in each one of them, the notation they use and their units. It is also necessary to consider how the measured data are configured and organised after monitoring, as their structure will condition how the automated migration of their content to the information storage system can be carried out. If we focus on the data measured by the inverters of the plants, these depend on the specific inverter model.
An example of the parameters that can be measured by these devices is shown in
Table 2, which corresponds to some inverter models from the SMA company, which are the ones analysed in this work. However, not all inverters measure the same parameters, nor do they use the same notation or measurement units, and there may even exist differences between the different models of the same manufacturer.
With respect to the monitored meteorological data, these may include horizontal and/or in-plane solar irradiance, ambient and module temperatures and, in some cases, wind velocity and relative humidity. The values of these parameters may be usually recorded at the same frequency as the data logged by inverters and saved in the same or different files. In the case of the PV plants analysed in this work, the data from meteorological sensors are sent, as well as the data from inverters, to a communication centre, such that all the information is collected and stored together in daily files or data files every 5 min. However, in the case of PV installations with a larger number of inverters, data from all inverters may not be collected in the same file but may be divided into different files corresponding to data from different groups of inverters. In this case, if there is only a single meteorological data record in the PV plant, these weather data will be stored in the files corresponding to the data register by one group of inverters, and in the data files corresponding to the rest of the inverters in the plant these weather measurements will not appear. However, once stored in the databases, the meteorological data measured in each installation must be available in such a way that, for example, if calculating the yields of PV modules associated with all the inverters of the plant is desired, it is necessary to have access to both the power production data of each inverter and the irradiance data. It is important to take these issues into account in order to be able to organise the information correctly.
Returning to
Table 1, the last item listed refers to the parameters to be determined by calculation from the monitored data, which allows characterisation of the behaviour of the PV plant elements. These are those recommended by the standard IEC 61724, Photovoltaic system performance—Part 1: Monitoring, which indicates a series of parameters that must be calculated in order to perform an adequate analysis of the performance of the plant elements according to the type of PV installation [
60]. All of these parameters are listed in a previous publication [
80]. To calculate these parameters, in addition to the monitored data, it is necessary to know the specifications of the modules and their configuration in the plant, information which, as mentioned above, must be stored in the database system, and which would have to be accessed to proceed with the calculation.
In order to create a complete model of the real system that allows its transcription to the databases that comprise the RDBMS, it is necessary, in addition to knowing the entities that compose and configure the system, to establish the existing relationships between them, which, in the case of the PV plants analysed in this work, are those shown in
Table 3.
2.2. Database Management System Used
Once an RDBMS is chosen, all the entities and their relationships collected in
Table 1,
Table 2 and
Table 3 need to be transformed into real and related tables. The fields of each of the tables are the characteristics of the different entities they represent. In these tables, it is necessary to establish which data will be their primary keys, that is the major and unique identifiers for each table, as well as their foreign keys, that is a column or group of columns in a dependent table that refer to a column or group of columns in another table, known as the master table. The relationships between them must also be established. This allows the real configuration of the elements to be studied to be properly reflected in the RDBMS.
In this work, MariaDB [
87] has been chosen for the developed system as a database management system because it has General Public Licence (GPL) and therefore it is a free management system and open source. It comes directly from MySQL and is widely used by important companies such as Google, Mozilla and the Wikimedia Foundation, and is supported by a large community of users. It stands out for being flexible and scalable, high performance and high availability, robust and with very complete support for most development environments, such as. NET, Java, Python, or PHP. Another important point to highlight about MariaDB is the variety of tools available for its administration, which are also free, such as MySQL WorkBench [
88] or HeidiSQL [
89]. Although this database manager allows the storage of data recorded with a higher sampling frequency, in this work data collected with a period of 5 min have been analysed, which is the period at which the inverters are configured by the company that operates them.
The structure that has been adopted for the RDBMS developed in this work has, on the one hand, a common database, in which the technical specifications of the elements and the configuration of all the PV installations to be studied are stored, and, on the other, it has been decided to have as many individual databases as installations to be studied, in which the data recorded in them will be stored. In the case of plants with many inverters and with multiple data sources, it is possible to divide them into several databases, and these databases, although independent, must share information corresponding, for example, to the measurement of meteorological parameters, given that, as previously indicated, in each PV installation studied they are usually recorded in a unique way.
The need to divide the RDBMS into several databases is due to the large volume of information that is recorded from the different PV installations and that needs to be stored, with the objective of reducing memory and processing time compared to what would be necessary if all the information were available in a single database, taking advantage of the flexibility feature of MariaDB that allows establishing relationships between tables and queries from different databases.
2.3. Procedure for Loading the Monitoring Data into the Database
Once the structure of the RDBMS system was designed, the next step was its development and the subsequent loading of information into the databases that constitute it. First, a common database must be created. The table structure of this database was done manually, directly working within the MariaDB administrator, adapting it to the needs that were found in the different PV installations to be analysed. Conversely, the structure of the individual databases was created following the procedure shown below.
When a new PV plant is going to be analysed, the first step is to enter manually in the common database only the name of this new plant and its location, so that there is a record in the database of a new plant for which no information previously existed. The next step is to create an individual database for this new plant. The process was implemented in such a way that the creation of this individual database is automated, and its structure is generated according to the characteristics of the new plant. For this purpose, a script was generated to carry out the migration process of the files containing the data monitored in this plant.
In this process, information about the set of elements that monitor information in the plant, inverters, string current metering devices and possible environmental sensors, is initially extracted from these files and, based on them, code in SQL language is automatically generated to create the physical model or table structure of the individual database, suitable for the data monitored by these elements to be stored in them. In addition, this process automatically transfers to the common database the identification codes of all the inverters and sensors that record information, and the set of parameters that are measured. Then, the migration process is interrupted, so that all the information corresponding to the elements of this installation is completed manually in the common database, making use of the manufacturers’ specifications and the configuration of the plant modules associated with each inverter or string metering device, provided by the company that operates and maintains the plant. Once all this information is completed, the migration process continues, and now all the monitored data is automatically saved in the corresponding tables of the individual database that has been created. As indicated, free software resources were used for these developments, programming a series of Python scripts and using SQL language to work with the databases.
The entire structure of tables, views and procedures of the individual databases was prepared by a Python function named create_db_structure during the execution of the data migration process, where SQL files are created with everything necessary for its creation. To facilitate the migration process, a pure-Python MySQL client library named pymysql was used with which an auxiliary class was created with a series of functions and properties that facilitate the interaction with the database implemented with MariaDB. In this way, functions were developed to check if a certain record is already included in the tables in order to avoid data duplication.
In the case of migrating data of an installation from which monitored data is already stored in the individual database, the process is simplified, and only the last step is carried out, in which the new data is transferred to the tables of the individual database that had to be created previously.
In order to carry out the data migration process described above, it is important to analyse the structure of the files generated in the monitoring of PV plants, which may vary from one inverter model to another. These files can have different formats, specifically, in this paper, both CSV and XML format files have been worked with. For each type, their structure is usually standardised, so it was possible to automate the reading and migration process.
Figure 1 shows an example of how the information from a set of inverters and string current metering devices of one of the PV installations analysed in this work is organised. In this case, the files are stored in a directory and they are identified by means of a code (wb150014229 in
Figure 1), which identifies the plant and the inverter group to which the data refer, together with the year, month and day (yyyymmdd, 20220704 in
Figure 1), and separated by a hyphen, the time at which the storage of such data took place (hhmmss). These files are zipped, and within them, there are other files, as can be seen in
Figure 1. Some are log files, which are not used except in case of problems, and other files are called Mean, which in this case only have in the name allusion to the date and time at which the data they store were recorded. These files are also compressed, and if they are decompressed, an XML format file is obtained containing the information of interest recorded by the inverters and string current sensors. Depending on the group of inverters, it may also contain the measurements of the irradiance and temperature sensors that were recorded in the plant.
Figure 1 shows that the Mean files corresponding to 14:45:39 and 14:50:39 were unzipped.
Each of these XML files corresponds to the record, in a set of inverters and string current sensors, of all the parameters they monitor in each sampling period, i.e., each XML file saves the data that were recorded in 5 min (the system was configured in such a way that the metering devices are recording information and save a value of each parameter recorded every 5 min). A fragment of the information stored in one of these XML files is shown in
Figure 2, which shows, for the inverter model SCC100N7, with identification code 139028664, the recording of the parameters
E-total,
fac and
fehler, at the time instant 14:45:39. The rest of the XML file contains the rest of the parameters recorded by this inverter, as well as by other inverters located in the same sector of the PV plant, and by string current sensors on the same sector, whose data are stored together in the same file.
In these XML files the data are enclosed in MeanPublic tags, where Key includes the inverter and parameter information, separated by a colon. In addition, the file itself also includes the time at which the data were recorded, in the TimeStamp tag, which is very important when storing and processing the data.
Since this file corresponds to a PV plant with 17 inverters, similar files with data from other inverters and string current sensors in the plant will be found in another directory. However, as already mentioned, only in some of these files is the information corresponding to the meteorological parameter records stored. In the case of a small PV plant with few inverters, all the plant’s inverter data are grouped in a single directory and will generate only one XML file every 5 min.
In general, it can be said that, for each day, 288 useful files will be available for each plant or set of inverters, in which information is recorded every 5 min throughout the day. Such disaggregation of the information makes it very difficult to process, so the tool developed in this work allows the automated loading of all this information and to have access to it in a much more orderly, selective and practical way.
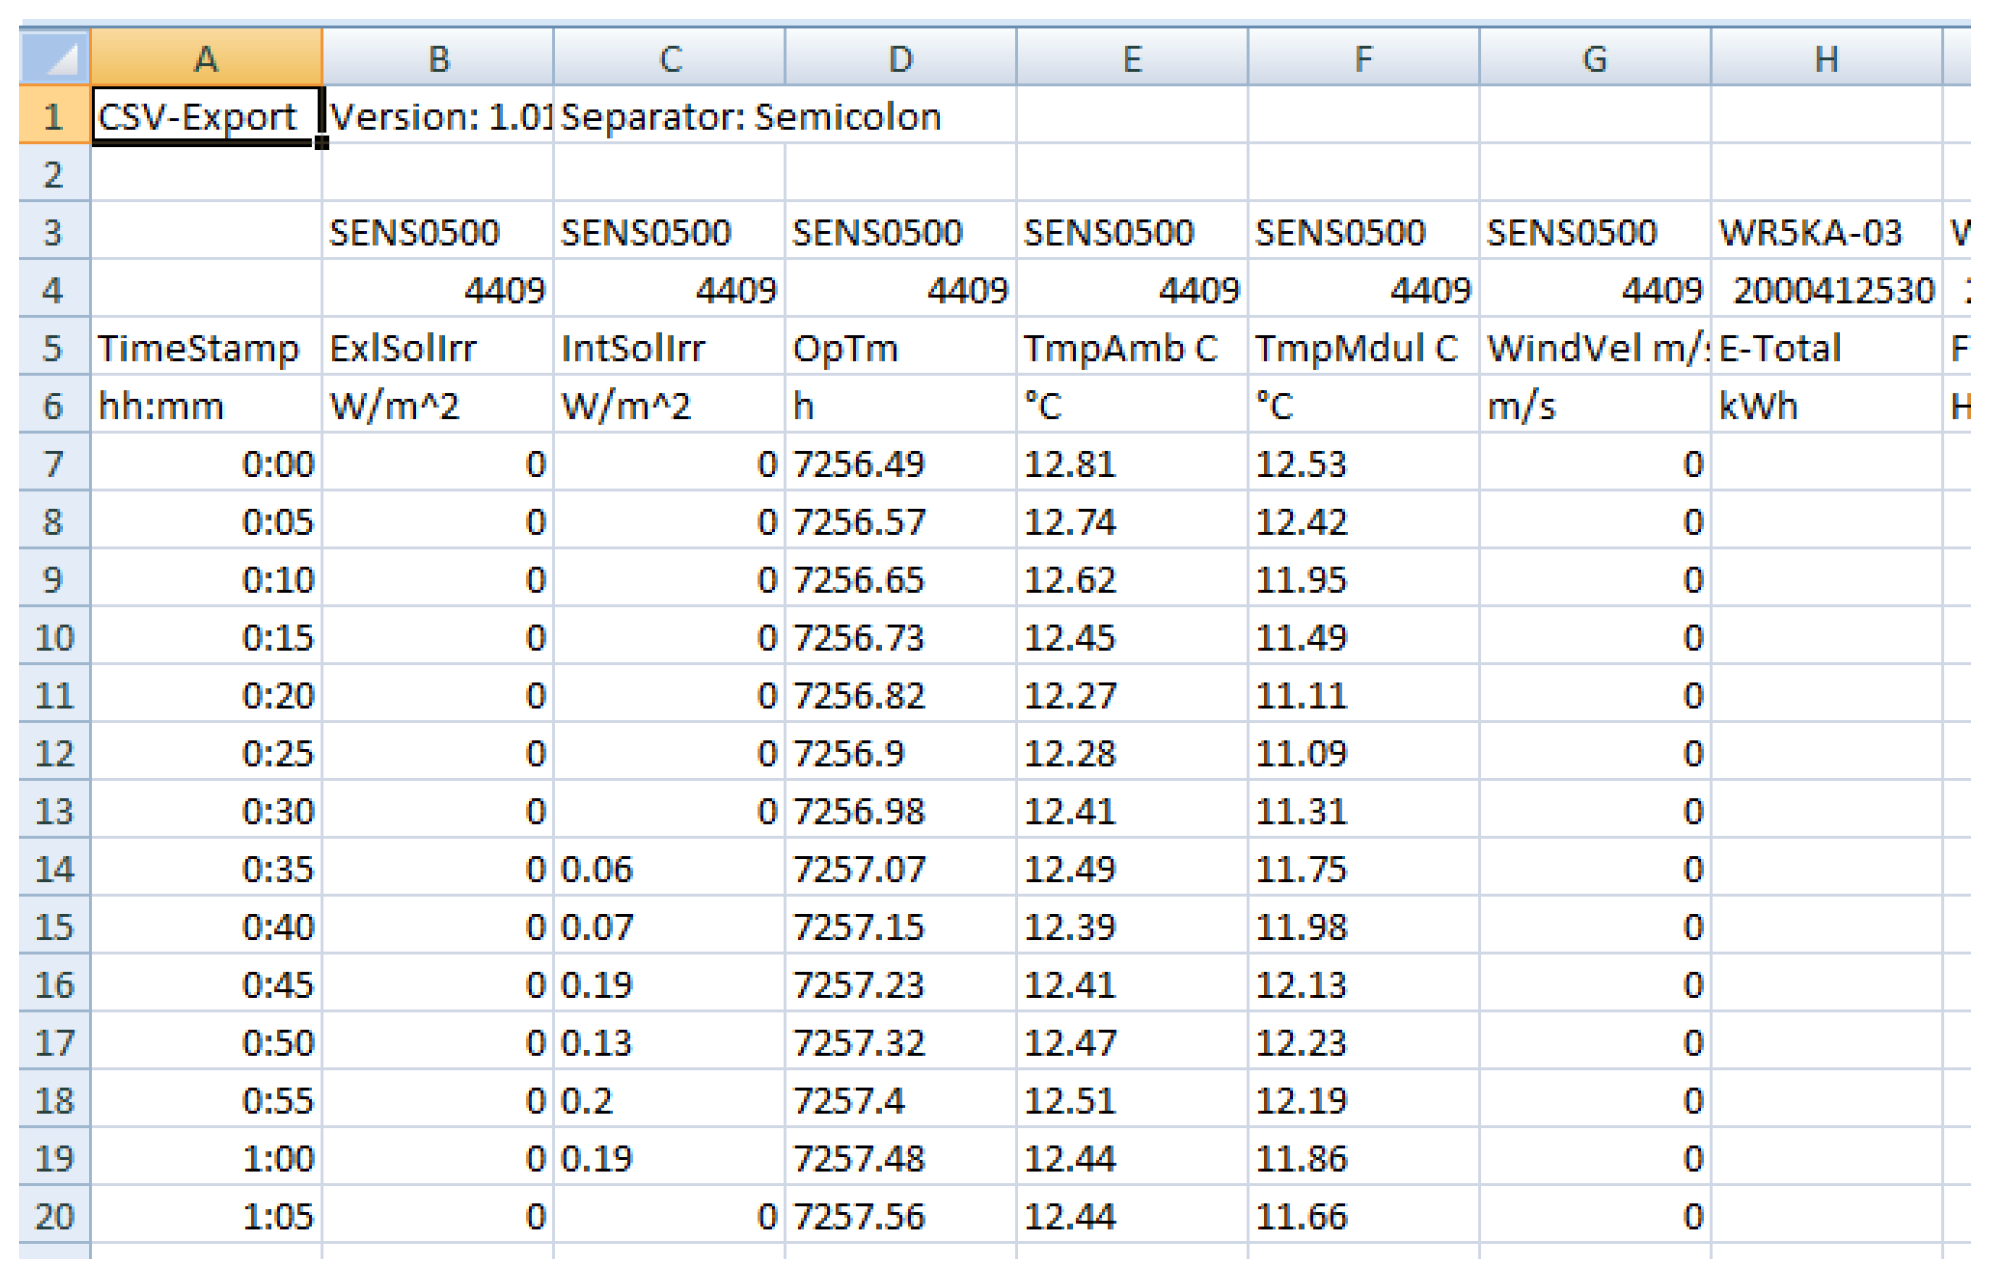
However, not all inverters generate the information with this structure. There are cases of PV plants in which the metering devices directly generate the measured data in CSV format files. Moreover, in this case, the CSV files are not compressed and the structure of the directories that contain them is different, as is the structure inside the file (
Figure 3 and
Figure 4). In this case, a single daily CSV file is generated, with all the records of each day, with the particularity that, inside the files, there is no reference to the day to which the data correspond; the date only appearing in the name of the file (
Figure 3). Therefore, the script programmed to migrate the data from these files to the databases must be different from the one developed for the XML files.
In both formats, the migration scripts were coded in such a way that each piece of data must be assigned to the parameter to which it corresponds, the inverter or sensor that records it, as well as the day and time to which the data corresponds. As already indicated, how this process was carried out will depend on the internal structure of the file (
Figure 2 and
Figure 4).
In general, to process the data, a series of steps will be required in the migration script in order to have access to read the directories where the data are located, decompress the files if necessary, read the files where the data are located (for example, in the case of XML files, only those beginning with Mean), extracting information from the headers or first lines of the file, which are usually standardised, to know which parameters are being measured and to which inverters or sensors they correspond, in the case of CSV files, or extracting this information through the structure of the XML format files. It is also essential, for each piece of data, to extract the date and time to which it corresponds, which, as has been seen, can be both in the name of the file and in the information stored in its internal structure, depending on the file format. It should be noted that one of the fields that are stored in the common database referring to the characteristics of each PV installation is the coordinates corresponding to the geographical location of the plant. This allows the date and time of the data to be associated with the local time of that geographical location; and when the measured data are stored in the individual databases of each installation, they are obviously stored with the local time. Once all this information is located, all the parameters of each inverter and sensor are distributed and entered in the corresponding databases, and specifically, in the fields of the tables assigned to them.
Since each PV plant to be studied has its own particularities, it is important to adapt the migration script to each one so that it corresponds to the file format they have and adapts to the characteristics of each so that there are no errors in the data migration. For example, whether or not they have weather data, and if not, from where to read these values. This avoids mixing configurations and minimises errors.
2.4. Tools for the Development of a Web Application for Accessing Information Stored in the Databases
Once all the data is stored in the common and individual databases, it will be necessary to be able to selectively access those data that are of interest depending on the analysis to be performed with them. To facilitate this task, a web application was developed in this work in order to be able to access all the information required. In a previous version, a desktop application was developed for this purpose [
80]. However, it subsequently became necessary to develop a web application to be able to access the information in a much more versatile way. In this application, which was called
S·lar 2, there are a series of fields in a form, which allows the user to include the parameters they want to select and the corresponding time period, and from there the information that is demanded will be generated. This information will be displayed both graphically and in tabular form.
This application was divided into the creation of a RESTful REST API as a back-end and a web client that makes use of this service. It was developed using Python on the server side, and HTML, CSS and Javascript on the client side.
The development of the RESTful API REST Web service was developed in Python using the micro framework named
Flask [
89], which is a tool prepared for the development of web applications using the MVC (model-view-controller) pattern, or for the design of REST APIs in a fast way, which is the reason why it was used. The MVC pattern presents a way of working that allows the differentiation and separation of the data model (the data that the application will have, which are usually stored in DB), the view (HTML page) and the controller (where the web application requests are managed).
The recipient of the REST API is a web client or front-end, developed with HTML, CSS and Javascript. VueJS [
90] was used for this client part, which is a progressive Javascript framework for building user interfaces. It is implemented as a component architecture, which allows applications to be divided into blocks with independent functionalities. VueJS was the chosen option because it allows the development of projects of any size, is quite free in terms of organisation, and has a fast-learning curve, supported by its excellent documentation. The community behind the project, and the fact that it is open source, make it very attractive, along with its performance and low memory requirements.
2.5. Procedure for Data Processing
Once stored in their corresponding tables of the individual database of the installation to be analysed, there is also the option of calculating, from the monitored data, a series of parameters such as the efficiency of the plant’s elements [
80]. For this, since the data from the meteorological sensors are required, the procedure must consider the possible particularities that may exist in each plant to access this information. The values obtained from all these newly calculated parameters will also be stored in their corresponding tables in the individual databases of each plant.
In addition, all the parameters, both measured and calculated, recorded with the sampling period that was already indicated as 5 min, can be calculated at an hourly or daily level, determining, depending on the parameter, average or aggregate values, as appropriate. Again, this information will also be stored in the individual database of each plant.
The web application referred to in the previous section was developed to show, in the form of both graphs and tables, all this information, both the information recorded on a punctual basis and the average or aggregate values. However, if a more complex analysis of the data is required, it is possible, once the application gives us access to the data, to download them in the form of CSV files. The use of these, by means of a series of scripts also developed in Python, allows us to treat them and obtain from them information that can be useful for the management of the plant. Although dealing with this subject in detail is beyond the scope of this paper and only a few examples will be shown, it should be noted that, for the analysis of the data, small scripts were also developed in which the numerous libraries that this programming language requires were used, such as Numpy [
91] or Pandas [
92] to process the selected data, Seaborn [
93] or Matplotlib [
94] for their graphical representation, or Scikit-Learn [
95] to carry out modelling or classification processes [
96].
3. Results
A schematic diagram representing the structure of the system developed in this work is shown in
Figure 5.
3.1. Structure of the Developed Databases
As indicated in the previous section, the RDBMS has a common database and a series of individual databases corresponding to each PV installation analysed or each sector of them in the case of plants with a larger number of inverters. A schematic diagram of this RDBMS is shown in
Figure 6.
The main tables included in the developed common database are shown in
Table 4. As previously mentioned, the information in some of these tables, such as the
Installations,
Modules and
Inverters tables, must be filled in manually, and the information corresponding to some of them, such as the
Parameters and
Installation_Inverters tables, is filled in automatically when the data file migration process takes place.
Several queries have been included in this common database, some of which are specifically prepared for the operation of the developed web application. One of them is called Active_Installations, which shows the list of PV installations for which data is stored in the databases and which will be accessible from the web application. Another important query is Installation_Properties, which shows a complete summary of the specifications of active installations. Another query worth mentioning is InstallationMetering_Devices, which generates a list of all the measuring devices that record the data in the different PV installations, with their identification codes, together with their characterisation, such as the associated modules, their nominal PV power, or the useful surface in m2 of PV cells that modules connected to each monitoring device have. This is a query used by the web application to display all the information corresponding to the installation that has been selected by the user. It is also used to calculate parameters from the monitored data such as module or inverter efficiencies.
The common database also includes a procedure called Date_List in which, starting from two dates, you have the list of all the days between them.
The individual databases dedicated to storing the monitoring data of each PV plant or one of its sections are composed of the tables shown in
Table 5. The
Installation_Parameters table contains the list of parameters that are measured by each inverter. Its information facilitates the extraction of data from the database once they are already stored, since it allows the verification of whether a parameter is measured by an inverter, in order to proceed or not to export it. This is because not all inverters monitor the same parameters. The
ListofDays table contains the list of all the days for which data are available for that installation, from a minimum date or the oldest date for which data are available, to a maximum or most recent date. This table makes it easy to extract the values of each parameter, once stored, in the form of arrays. These arrays will have, in one dimension, the days corresponding to the entire time period for which data are available and are to be analysed, and in the other dimension the hours of the records throughout each day. This type of array facilitates access to the entire set of values of each parameter in a given time period and makes it easier to perform daily or hourly statistics, as well as to perform a graphical representation of each parameter in the form of colour maps or heatmaps, representations that allow, in a practical way, the visualisation of the recorded value of a parameter at each instant of time throughout a given time interval. In case of any error in the data recording, the missing days and hours will appear in the data array, although with empty data, so that the entire time period is complete in the array, regardless of whether there is data measured or not. This also facilitates that, if the value of two different parameters is to be compared or related, the time period of both parameters can be the same. The tables named
heatmaps_tmp and
heatmaps are in charge of storing the data in these arrays.
The data structures of the tables named Data, Hourly_Data and Daily_Data are variable and unique for each installation, since they depend on the parameters measured in each one. However, they all include the date (year, month, day) and hour and the identifier code of each inverter or sensor. These structures are defined exactly in the initial stages of data verification during the data migration process, according to the characteristics of each installation and the process by which two SQL scripts are generated to create all the tables, views and functions, thus completing the physical model of the databases.
The individual database may or may not have a table called Meteorological_Data, which is a table with a variable structure whose columns are the weather parameters that are recorded in the plant. Its usefulness is the weather data is made available to the rest of the inverters to make it possible to calculate some parameters such as the efficiency of the PV panels, for which the values of the irradiance received need to be known. When these parameters have not been measured in an installation, it is possible to share the meteorological data of another nearby installation (for example, through a query).
Each individual database of each PV plant or a section of it is completed with a series of queries or views involving tables and queries from other databases. These queries are listed in
Table 6.
The individual databases are completed with a series of procedures, which are listed in
Table 7.
Lastly, two triggers have been incorporated (Data_Before_Insert y Data_Before_Update) used during data insertion in the migration that perform the same function: fill in the time from the date data.
Regarding the functions, only the one called DaysBetween2Dates has been included. Its purpose is to generate a list of all the days between two dates, and it is used in the procedures called Date_List of each installation, where the dates needed are the oldest and most recent dates for which there are data, which are stored in the query called Dates.
3.2. Web Application for Accessing Information
As mentioned above, in order to have more convenient access to all the data stored in the different databases of the various PV installations, an application has been developed to facilitate the process of visualisation and extraction of information.
To open the web application, it is necessary to have the database server running and to run the web server. Both are local servers and can be accessed from any browser, preferably Chrome or Firefox.
The application has a start menu. In this menu, there are some pop-ups or scrolling lists that allow the user to choose the information to be extracted from the databases. First, at the top of the start menu, there is a list that enables the selection of the PV installation for which the analysis of some of its parameters is to be carried out. This selection will be made among those PV plants that are active in the application, which are those for which data are available in the common and individual databases.
Once the PV plant has been selected, the screen will display information about its characteristics, such as its nominal power, its location, the date the plant was created, and the minimum and maximum dates between which data for this plant is available in the database.
For the consultation of a specific parameter, the time period for which the information is to be consulted must be selected, and for this purpose, there are buttons to select the start date and the end date of the time period. In
Figure 7, the time period chosen is from 1 Novemeber 2020 to 4 July 2022. In addition, there is a
Clear button to clear the data form of the information previously selected.
The available inverters in the selected plant are also displayed on the screen. The user has the option of selecting one, several, or all the inverters of the plant (
Figure 7). The selection is carried out by means of the inverter identification codes, which are shown in the scrolling menu. In the PV plant selected in
Figure 7, there are two inverters, but three are shown because, during the period for which data are available for this plant, one of the inverters was replaced by another, and the identification code of the new one was different from the identification code of the inverter that was replaced.
Once one or several inverters have been selected, another list or menu can be scrolled down, showing all the parameters that have been measured by the selected inverters (
Figure 8). In this menu, it is possible to select the measured parameters in which the user is interested. In this selection, it is possible to choose one, several, or all the parameters displayed. However, the system is configured to be able to select either the same parameter measured by several inverters or different parameters from the same inverter. Since only those parameters that have been actually measured are shown in the pop-up menu, it is not possible to request from the database parameters for which no record is available, thus avoiding errors.
With the PV plant, inverter and parameter already selected, the different possibilities for displaying the information are shown, which can be the punctual values measured every 5 min (
Get Data button in
Figure 7), the hourly aggregated or averaged values (
Get Hour button) or the daily aggregated or averaged values (
Get Day button).
Once the data are received by the back-end of the application, the data can be displayed graphically, as shown in
Figure 9. The
Get More Data button allows more data to be displayed than is shown on the screen.
The selected data can also be displayed on the application screen in table format (
Figure 10). The application also gives the user the option to download the selected data set displayed on the screen in a CSV format file in order to perform a more in-depth analysis of the data than just displaying the monitored or averaged data on the screen of the application. This is possible using the button named
Export CSV that appears when the selected data is shown in Table form (
Figure 10). In this case, a CSV file will be generated for each parameter of each inverter that has been selected in the application, in which the data will be in the form of an array, with the days of the selected period in one dimension and in the other the 288 records of the parameter that is performed each day if it is punctual data. In the following section of the paper, some examples of analysis of the data downloaded through the application for some of the parameters measured by the inverters of two PV installations will be shown.
If the user wants to display data for other parameters, another screen or panel must be selected in the application. Then, the selection of the parameter in which the user is also interested is made again in the forms or menus of the application, and the data can also be displayed, as can be seen in
Figure 11. Six screens are available for displaying different parameters.
Although a similar application was available in previous developments of the tool [
80], this version has several improvements, among which the following may be mentioned. In the current version, it is possible to migrate data in XML format, which was not considered in previous versions. The calculation process of the calculated parameters, such as the efficiencies of the elements of the installations, has been optimised, for which it has been necessary to design a new structure for the individual database of each of the installations, and now this calculation is performed in the database itself when previously it was done simultaneously with the migration process, which made this process much slower. The data export routines have also been improved with the introduction of new tables, and, although each database now has a unique data structure, depending exclusively on its physical configuration, this avoids the occurrence of errors in the data migration and extraction process.
3.3. Use of the Developed Application in the Analysis of Some Parameters of Two PV Plants
Although it is beyond the scope of this paper to carry out a detailed analysis of the behaviour of the elements of PV installations, this section includes a brief analysis of some of the parameters recorded in two PV installations and which have been organised using the RDBMS developed in this work. The aim is to show that, once the data are correctly stored, it is easy and convenient to access them selectively and obtain useful information.
The technical characteristics of the PV plants analysed are shown in
Table 8.
The data monitored at these plants were provided by the company that operates and maintains them, in the form of files in XML format organised as previously described in
Section 2.3. In the case of plant 1, the information recorded every 5 min by the two inverters is collected in the same XML file, while for plant 2, the monitored data is separated into two blocks, one containing the XML files with the data from inverters 1 to 8, and the other with the files containing the data from inverters 9 to 17. To organise the information, an individual database for the first PV plant and two databases for plant 2 have been set up to store the data from the two sets of inverters.
The time period from 1 November 2020 to 4 July 2022 has been analysed, which corresponds to a total of 611 days. If, for each set of inverters, 288 XML files with information monitored at the plants are recorded every day, for this period this results in three sets of 175,968 files or a total of 527,904 files. This amount of data becomes unmanageable without a system to manage it optimally and efficiently.
All these files were then loaded into their corresponding databases, saving each parameter in the corresponding tables. The specific parameters to be analysed were then extracted into CSV format files with an array structure using the previously described S·lar2 application.
These arrays were imported, and the information was processed by means of small scripts developed in Python, which allow us to show their behaviour in the chosen period. It is important to remember that, in the arrays, in one dimension there are each of the days of the time interval of more than 600 days mentioned, and in the other, there are the 288 daily data records, from 00:00 to 23:55, with a frequency of 5 min.
Figure 12 shows directly the values of the arrays corresponding to the
Pac power recorded at the output of the inverters, in the case of inverter 1 of plant 1 (a) and inverter 10 of plant 2 (b). It can be seen that it is possible to conveniently observe the behaviour of all the values of this parameter recorded in the chosen time period, observing, in general, the variation of this magnitude, which during the night hours is null, and its value increases from sunset to the zenith, at midday, decreasing its value again until sunset. These graphs in
Figure 12 show the greater number of hours of production in the summer months, and the presence of days with passing clouds, which causes the value of the power produced to fluctuate throughout the day. Although the PV panel power associated with the inverters represented for both plants is the same in this case, it can be observed that the deviation in the orientation of the panels on plant 1, conditioned by the fact that they are located on the roof of a building, with respect to the south orientation of the panels on plant 2, results in lower power production. The periods in which there were failures in the monitoring system were assigned a null value. The graphs obtained for the rest of the inverters on the two plants show very similar behaviour to that of the inverter on the same floor shown in
Figure 12.
Although these graphs show the general behaviour of the Pac production of each inverter, it is not always easy to visualise in them small deviations in the production of any inverter, which could alert us to problems in any of the elements of the plant, especially if the behaviour of numerous inverters must be supervised, as is the case of plant 2. Given that the inverters are close together and receive practically similar irradiance values, if their production is compared with each other, and it is not the same, this would be an indication of a failure or problem in one of the elements. To do this, a simple Python script was developed that asks the user for the date of the day to be analysed, and a graphical representation of a correlation matrix will be available, which, after correlating the production value of each inverter on the chosen day with that of the rest of the inverters in the plant, shows the value of the Pearson correlation index of these correlations. This coefficient measures the linear dependence of the production of each inverter with all the rest. The closer the value is to 1, the better the relationship between the output of pairs of inverters. If the value were 0, it would mean that there is no relationship between the output of any two inverters. The diagonal in these matrices appears by default with the value unity since they correspond to the comparison of the production of each inverter with itself. This type of graphical representation makes it easy to visually detect possible fault situations or small deviations that could lead to faults in the future.
As an example of these types of graphs,
Figure 13 shows those obtained for two different days for inverters 1 and 2 of plant 1. On one of these days, 15 February 2021 (a), it can be seen that the correlation index of the production of the two inverters has the value of 1, which shows that the two inverters are producing power at the same rate. This is not the case on 26 January 2021 (b), where the value of the correlation coefficient is less than 1 (0.53), which indicates that one of the inverters did not produce the same amount as the other, indicating the presence of a fault in one of them. The colour variation in the graph also warns of this possible deviation.
If once the fault has been detected by means of this low value of the correlation index, the
Pac power of the inverters on the days indicated is displayed, as can be seen in
Figure 14, on the day on which the value of the correlation coefficient decreases (26 January 2021) it can be seen that there is a series of hours throughout that day in which there is no electricity production, in this case in inverter 2 (
Figure 14b). In the case of the day on which the correlation indexes are equal to 1 (15 February 2021), it can be seen that there is the same power production in the two inverters of the plant (
Figure 14a).
The correlation index matrix representation is even more useful in the case of installations where the number of inverters is higher, as in the case of plant 2. As an example, the representation of the correlation index matrices for the 17 inverters in the plant for three different days (3 March 2021 (a), 15 February 2021 (b) and 26 January 2021 (c)) is shown in
Figure 15.
In
Figure 15, it can be seen that, for 3 March 2021, the production of the 17 inverters is perfectly correlated, since the correlation indices all have the value of 1. This means that all 17 inverters in the plant are producing at the same rate, as shown in
Figure 16, where the
Pac power produced that day by the 17 inverters is shown (
Figure 16a,b). If we look at the correlation index matrix for the day 15 February 2021 (
Figure 15b), we find that there are small deviations in the production of some inverters, but none of them are very significant. The colour variations of the representation also highlight these small deviations. This behaviour corresponds to the
Pac production of the 17 inverters shown for that day in
Figure 16c,d. There are small deviations in the production, which result in the Pearson correlation index values of some inverters not having the unity value, but these are very occasional variations. Conversely, for 26 January 2021, it can be seen in the correlation matrix (
Figure 15c) that one of the inverters, inverter 1, does not correlate its production with that of the rest of the inverters, given that the value of the Pearson correlation index is equal to 0.24. The colour in this case also warns of this low value. This is a sign of the presence of some kind of fault in this inverter, as it is evident from the graphical representation of the power of the inverters on that day (
Figure 16e,f), in which inverter 1 had practically no power production on that day.
Therefore, the representation of the correlation index matrices allows visual access to a comparison of the operation of all the inverters in a plant, and it can be a very useful tool, especially in plants with a larger number of inverters, detecting possible deviations in production and showing the greater or lesser magnitude of these possible deviations. Thus, just by visualising a series of numbers, it is possible to see whether the inverters are working correctly or whether there is some kind of problem. It would only be necessary to proceed to analyse in more detail the daily power values if these graphs show the presence of some kind of deviation in order to have more information about when the problem occurred.
In addition to the behaviour of the PV plant elements, another very important aspect to take into account during operation is whether their production is having any kind of impact on the electricity grid. In most plants, this is an aspect that is not recorded or analysed, but it is essential in order to be able to correctly integrate the production of this type of plant into the electricity grid without producing disturbances that could affect users [
96]. Although a complete analysis of their impact on the electricity network would require grid analysers at the injection point of the plants (PCC), the inverters themselves can provide information on some parameters of the grid and their relationship with the production of the plants. For example, the inverters record the value of the voltage signal of the electricity grid (
Vac), so it is possible, with the values measured by inverters, and without the need for additional instrumentation, to carry out an analysis of the value of this parameter in the different phases. This parameter can be recorded by the inverters 24 h a day, even when no production is being injected into the grid, as is the case with the inverters analysed in this study. As an example, the graphs in
Figure 17 show the value of this voltage
Vac in phase 1 measured every 5 min by two inverters, one from plant 1 (a) and the other from plant 2 (b), during the entire period analysed (1 November 2020 to 4 July 2022). The values between 225 and 250 V have been represented in order to better observe the behaviour of this parameter with the colour degradation. In both cases, the highest voltage values generally occur in the central hours of the day, and to a greater extent in the spring and summer months, which is when the production of the PV plants is higher in their geographical location. This behaviour is even more evident in the case of plant 2, which has a higher nominal power and therefore a higher total production injected into the grid than plant 1.
For a more complete analysis, in addition to the instantaneous values of the
Vac voltage, it has been possible, using the tool developed, to easily determine statistical values of this magnitude, and in general of all the parameters recorded in the PV plants. The maximum, minimum and average values of the voltage measured from the grid have therefore been determined for each day. The obtained results are shown in
Figure 18. The two graphs in this figure show the average daily values of the
Vac grid voltage measured in phase 1 by an inverter of PV plant 1 (a) and by an inverter of PV plant 2 (b). Also shown here in blue is the range of values corresponding to the difference between the maximum and minimum daily values of the recorded grid voltage. It can be seen that, in the case of plant 1, the value of the grid voltage measured at its PCC is higher than at the second plant. Even though plant 1 is smaller in size or power rating, the value of the
Vac voltage will depend primarily on the state of the grid at that point, which will be conditioned by all the elements connected to it, and not only by the PV installation. It can be also observed that there are days in which lower voltage values were registered, and occasionally, cases of overvoltage values. The variability throughout the year is not very significant, although a slight increase can be observed during the summer months.
The maximum, minimum and average voltage values have also been determined for the entire period analysed, but in this case for one of the 288 moments of the day in which the data is recorded, i.e., every 5 min. The results obtained can be seen in the graphs in
Figure 19, which show the
Vac values in phase 1 measured by inverters 1 (a) and 10 (b) of plants 1 and 2, respectively. It can be seen in this case that the overvoltage values recorded and shown in the graphs in
Figure 16 occur in this case at times of the day when the PV plants are not in operation. If these overvoltage values had occurred during production hours, the inverter would have interrupted the injection of energy until the voltage values had returned to the established ranges.
Furthermore, the graphs in
Figure 19 show very clearly that the grid voltage value shows a slight increase during the hours when the PV plants are in operation. This behaviour is more significant in the case of installation 2 (
Figure 19b), as already shown in
Figure 17, as it has already been indicated that it is larger. Although the
Vac voltage values are within the margins accepted by the standards, the grid at these points will have a hosting capacity, so that if the power values of the installations increase, so would the value of the grid voltage, so that the installed power could never be greater than that which would cause the value of the
Vac voltage to exceed the value recommended by the standards.
These examples show that, once the data values measured by the different elements of the PV plants have been correctly ordered and stored using the database management system developed, it is possible to quickly analyse the measured data to obtain information on both the behaviour of the plant elements and their influence on the electricity grid in order to make decisions regarding their O&M for the benefit of both the plant owners and the grid users.
4. Conclusions
The increasing number of PV installations connected to the grid requires that their operation be perfectly characterised in order to improve their efficiency and control their impact on the electricity grid. For this to be possible, the plants must be monitored and generate data that, after processing, can be converted into useful information to help in the O&M of these renewable sources and the management of their injection into the grid. However, the large amount of data generated in the monitoring of even small plants makes it essential to use tools that help in the management and processing of all this data.
For this purpose, in this work, firstly, an RDBMS was implemented to store in an orderly manner all the information corresponding to the technical specifications of the plants to be analysed, and a process was developed to automatically load all the data measured in them into the database tables created. A web application was also developed, which, when connected to the databases, allows us to have selective access to the stored information.
The system makes it possible to homogenise the data recorded in different plants, which, as mentioned above, have different specifications, recorded parameters, nomenclature, units of measurement, or format of the recorded data. This makes it possible to treat data from different types of plants together and to perform the same type of analysis in order to compare results.
The system was developed with open-source software tools, which avoids the payment of software licenses, making the system much more affordable.
Although the manufacturers of equipment for PV installations have applications to visualise recorded parameters, the system developed in this work allows access to the data in a much more broadly and aggregated form, in order to perform more comprehensive and varied analyses than the limitation presented to users by other applications.
As an example, this work includes the analysis, using the developed tools, of some of the parameters recorded in two PV plants during a period of 20 months. The system allows access to the temporal variation of each parameter in order to obtain information on deviations that allow maintenance actions to be improved, to avoid reaching the point of corrective maintenance. For example, a mechanism is presented that allows us to make a daily comparison of the power generated by the different inverters of the same plant such that a deviation in the production of one or more inverters can be detected. Colour maps with the Pearson correlation indexes corresponding to the linear dependence relationships of the production of all the inverters of the plant, easily generated with the use of Python, allow us to visualise these possible deviations.
As a further example, in the analysis of the grid voltage values measured by the inverters of the plants, the increase in grid voltage that occurs due to the production and injection into the grid of the power generated in the plants was easily seen.
The developed system is flexible and scalable, such that the type and number of PV plants analysed with it can be increased.
Although the system does not work in real-time, it allows the data monitored in the plants to be uploaded daily, so that production can be analysed in the shortest possible time in order to detect possible deviations from correct operation as soon as possible.
There are several aspects in which this line of work could be continued. On the one hand, although the user interface of the application has been designed to be easy to use, it is always possible to improve it in order to make it more attractive to the user. Also, the system has been optimised compared to previous versions in order to make it more flexible and optimal so that the loading time of the data is lower, but this is always an aspect that can be improved, especially for loading data from PV plants with a large number of inverters. On the other hand, the system could also be adapted to new formats of monitored data, as the current version includes CSV and XML file formats, or to include data from additional measuring sensors that could be installed in the plants.


 ,
, 


