Article

Design of Zoom Optical System from Visible to NIR-II for Vivo Fluorescence Imaging Device

1
Key Laboratory of Infrared System Detection and Imaging Technology, Shanghai Institute of Technical Physics, Chinese Academy of Sciences, Shanghai 200083, China
2
University of Chinese Academy of Sciences, Beijing 100049, China
*
Author to whom correspondence should be addressed.
Appl. Sci. 2023, 13(3), 1421; https://doi.org/10.3390/app13031421
Submission received: 16 December 2022 / Revised: 17 January 2023 / Accepted: 17 January 2023 / Published: 20 January 2023
(This article belongs to the Special Issue Optical Camera Communications and Applications)

Abstract

:
Macro vivo fluorescence imaging is becoming more and more important in the medical field. It is also necessary to design the optical design system for the visible light of the NIR-II detector. This paper discusses the design method of the wide spectrum achromatic optical system from visible light to NIR-II. Based on ZEMAX, a wide spectrum zoom system is designed to freely observe experimental targets in the fields of view of 3.1–18.6°. The four components layout was adopted by the wide spectrum zoom system, which is suitable for 8.2 mm (1/2 inch) CCD, with an f-number of 5.0~6.0, zoom range of 25 mm~150 mm, working spectral band of 400 nm~1700 nm, full field MTF ≥ 0.3 at the spatial frequency of 100 lp/mm, and the maximum distortion of ≤±3%. All optical elements adopt the standard spherical, which can correct all kinds of aberrations well and meet each part’s basic processing requirements.

1. Introduction

In vivo imaging techniques play a crucial role in the exploration and development of biology and medicine. Currently, in vivo imaging techniques include computed tomography CT, MRI, ultrasound US, fluorescence imaging FI, etc. In the past decade, short-wave infrared (SWIR) fluorescence imaging has been gradually and widely used in biomedical fields because of its excellent imaging effects [1,2,3,4].
In most biological tissues, light scattering within the tissue is the main factor limiting the depth of imaging penetration. Since scattering becomes weaker at longer wavelengths [5], the use of longer-wavelength light sources should significantly improve the penetration depth. To date, silicon-based CCD (charge-coupled device) or CMOS (complementary metal-oxide-semiconductor) cameras have been used mainly as two-dimensional detector arrays, mainly because reliable silicon (Si) arrays with high-speed imaging capabilities are readily available. However, beyond 1.0 µm, the sensitivity of silicon-based detectors is significantly reduced, making it difficult to use these devices at longer wavelengths. In blood, skin, and fat tissue, the absorption in the 600–1800 nm band is at a low range, which is much better than visible light; the scattering of short-wave infrared by biological tissues is also much smaller than visible light; in the short-wave infrared band, the excited fluorescence of the organism itself is also weaker, making the interfering light less, which is also the advantage of short-wave infrared fluorescence in vivo imaging. Before being limited by the cut-off wavelength of 1100 nm of CCD and CMOS, the mainstream form of an imaging system takes the form of multiple optical systems with multiple detectors. However, the scheme of two cameras in concert makes the whole system bulky and inconvenient for clinical or laboratory use.
The use of multiple wavelengths for fluorescence surgical navigation has been demonstrated, as shown in Figure 1 [2], but the current devices are bulky; three sets of imaging equipment were used to achieve wide-band imaging-visible NIR-I and NIR-II, and their bottlenecks are in the optical system and detectors as mentioned above.
The pre-shot pictures of our previous equipment also point out the necessity of the zoom optical system, such as the mouse in Figure 2a, whose fluorescence luminescence area is only a small part marked by a red rectangle because it is limited by our 16 mm fixed-focus lens and fluorescence timeliness, we can only take experimental pictures with an unsuitable field of view. Figure 2b shows the dilemma of not being able to perform wide-band imaging, and the left and right sides can only be taken at different angles with different equipment-visible and NIR-II cameras. All the above shows the application scenario of a wide-band zoom system.
With the gradual maturation of InGaAs Vis-SWIR detectors with 0.4–1.7 μm wide band detection capability [6], the realization of visible and IR light confocal plane imaging systems has become possible. The question of how to realize a compact multi-mode system is receiving more and more attention. The large variation in dispersion properties of different optical materials in such a band from 400 nm to 1700 nm makes the design of wide-band optical systems difficult [7,8]. With the improvement of the design theory of zoom optical systems and the mechanical processing capability of optical elements, the imaging quality of good zoom optical lenses in the signal spectral band can even be comparable to that of fixed-focus lenses. This enables the implementation of a simple and easy-to-use system of in vivo imaging.
In this paper, we design a wide-band zoom optical system adapted to InGaAs detectors, which makes full use of the system space and avoids the problems of matching multiple cameras and switching the field-of-view.

2. Design Strategy

2.1. Zoom System Principle

At present, zoom systems can be broadly classified into the following four types: the optical zoom system, the mechanical compensation zoom optical system, the dual-group linkage zoom optical system, and the full-motion zoom optical system. Generally speaking, there are difficulties in designing a zoom system, such as the complex calculation of the initial layout, large volume, many inflection points of the zoom curve, and many zoom curves. Generally, to achieve continuous zoom, it has to use the type of mechanical compensation zoom optical system, in which each component, in accordance with different laws and complex movements, can achieve the zoom function and reduce the effect of image surface position movement.
The key to designing a zoom system is how to compensate for the image surface position, which needs to use the principle of image exchange. A component in each position has a corresponding image exchange position; the conjugate of these two states is the same, and the conjugate L, can be expressed by the magnification of the component m:
L = l l = f 1 m f 1 m 1 L = f 2 1 m m
From this principle, a motion curve can be obtained; each component’s m changes according to the state of the constant conjugate distance so that a zoom system with a constant image surface position can be theoretically obtained. However, there is an aberration in spherical lenses, so the image surface position can be allowed to move to a certain extent to obtain a better image quality.
Based on this conclusion, the conjugated distance of each moving component remains the same. The design principal formula of the initial layout can be obtained as follows:
L 2 s + L 3 s = L 2 l + L 3 l f 2 1 m 2 s + m 2 s + f 3 1 m 3 s + m 3 s = f 2 1 m 2 l + m 2 l + f 3 1 m 3 l + m 3 l
where L2s and L3s, respectively, represent the conjugate distance of the second and third components of the optical zoom system in the short focal state. m2s and m3s, respectively, represent the magnification of the second and third components of the optical zoom system in the short focal state. Those with the l corner scale have similar meanings as those with the s corner scale, representing the physical quantity in the long focal state. Satisfying this formula can make the image surface position shift as small as possible.

2.2. Elimination of Wide Band Chromatic Aberration

The achromaticity in the wide band range is mainly achieved by the apochromatic model. Each lens needs to satisfy the optical focal equation and the chromaticity equation, and each element satisfies the following equations [9]:
φ = 1 h 1 h i φ i L = 1 h 1 2 φ 2 h i 2 C φ i
where φ represents the total optical focal power of the optical system, φi represents the optical focal power of the ith len, hi represents the near-axis light object height of the ith len, and C represents the corresponding band dispersion coefficient.
This model can solve the problem of chromatic aberration in each band of the optical system to a certain extent. However, for 0.4–1.7 μm and such a wide band chromatic aberration correction, the dispersion of the optical system in the same image surface position in two or more different bands cannot guarantee good imaging quality.
Therefore, the dispersion equation can be extended to solve the dispersion gap between the bands:
P 12 = n 1 l n 2 r n 1 l n 2 r
In the material library, we can choose several materials between a high and low P12 value. The design example in this paper uses the five kinds of glass materials shown in Table 1.
The chromatic dispersion of different bands in Table 1 is defined by the following equations.
C 0.4 0.7 = n 0.4 n 0.7 n 0.55 1 C 0.7 1.0 = n 0.7 n 1.0 n 0.85 1 C 1.0 1.7 = n 1.0 n 1.7 n 1.35 1 C 0.4 1.7 = n 0.4 n 1.7 n 1.05 1
In the near-infrared and short-wave infrared bands, the optical glass materials in Table 1 have similar dispersion coefficients, indicating that the dispersion characteristics of these two wavelengths are similar, so we can focus on only one band. When considering the dispersion characteristics over a wide wavelength range, we found that N-SF1 had a relatively large dispersion coefficient and could be used as a color correction element. N-LAF2 and N-LAF34 in the visible and short-wave infrared dispersion degree were different and could be used to complement or to replace according to the chromatic aberration.
In the design of fixed-focus optical systems, because the entire optical system components are relatively fixed according to the above-mentioned model approach, through selecting a reasonable structure type, selection of material combinations, initial layout parameters calculation, system optimization, and image quality evaluation, we could usually obtain better design results.
However, for the zoom optical system, there are variable elements in the system, and the incident height of the light on the surface of the element changes in the process of field-of-view (FOV) switching, which may lead to large changes in the system’s chromatic aberration. In order to avoid mixing, the above achromatic chromatic aberration equation with the initial structural parameters of the zoom optical system solution, which makes the design process complicated, provides a better solution to obtain the optical focal length distribution of each mirror group of the system and then combine the achromatic for each mirror group of the variable focal length system to eliminate chromatic aberration separately. The front fixed group usually bears the main optical focal length and carries out a separate achromatic design; the rear fixed group and other fixed mirror groups mainly play a role in compensating for the remaining aberration of the front group while bearing part of the optical focal length; and the zoom group lenses number is usually less so we cannot design for separate achromatic aberration. At this time, we need to try to choose the materials of the weaker inter-band dispersion ability or material combinations to ensure that the chromatic aberration introduced by the zoom group is as small as possible.

2.3. Athermal Design

Regarding the application scenario of the zoom system in this paper, the operating environment of the optical system is room temperature, and the requirement of athermal is not demanding. The refractive index coefficients of glass materials in the visible and near-infrared bands are not large, and the main source of thermal difference in the optical system is the thermal expansion of the lens, the lens barrel, the connecting part, and the zoom part caused by the change in the ambient temperature, so that the spacing, thickness, and other parameters of these parts can change and produce thermal defocusing. Generally, matching the coefficient of the thermal expansion of the lens barrel material and lens material can easily be solved in this case.
Therefore, the athermal of the optical system is less important and can be considered at the end. After the chromatic aberration of the system is corrected, the athermal optical system can be achieved by using the material replacement function in ZEMAX.

3. Optical Design and Optimization

3.1. Initial Structure Selection

The design specifications of the zoom optical system are shown in Table 2; the system uses a 1/2-inch InGaAs sensor, an image element size of 5 μm × 5 μm, a light-sensitive size of 6.4 mm × 5.12 mm, a diagonal length of 8.2 mm, working spectrum of 400–1700 nm, can be fast and provide comprehensive observation of fluorescence characteristics with the help of the filter; and the f-number is variable. However, the amount of incoming light should be as large as possible; distortion should be within 3%, and, by Nyquist sampling law, the system requires the modulation transfer function MTF ≥ 0.3 at 100 lp/mm.
There is a need for a macroscopic in vivo imaging device to determine the parameters of its supporting optical system. The primary parameter of a visible-NIR-II in vivo fluorescence imaging device is the wide-band optical system, which is required to observe different wavelengths without switching the lens system; we need to consider the working distance of the optical system, which needs to leave at least 35 cm of space with the lens for biologists to inject fluorescent dyes or apply anesthetic agents to live animals. The size of the mice and rabbits determines the field of view, and depending on the actual conditions, a square field view of 3 cm–20 cm is required. A simple calculation provides a field of view of 3–28°.
The adaptation of the optical system designed in this paper to the InGaAs detector is also reflected in these parameters. First, the image plane size (Type 1/2) and image element size (5 μm × 5 μm), which determines the image plane size and image quality evaluation of the optical system at half 1/2 the size, means that the image plane size needs >4.1 mm, and there is a certain margin in the design with a 4.2 mm image plane size. Then, the optical system design index is determined by the image element size before the MTF (MTF indicates the modulation variation in an optical system imaging, and the MTF curve can be used to evaluate the imaging performance of an optical system more comprehensively) calculation shows that the corresponding design requirements need to be met at 100 lp/mm. Then, we need to meet the structural assembly requirements of this detector, which requires a back intercept of ≥17.526 mm; then, the detector band weights and the device observation band matching the following figure (Figure 3) is the quantum efficiency.
It can be seen that in the visible band, there is a section of quantum efficiency that is low, but this is the observation band we need; in the design process, the weight of this band needs to be increased to ensure a more balanced imaging effect, and then combined with the nature of the organism to be observed. The absorption coefficient of water compared to visible light did not increase by much, but the water had absorption peaks at 900 nm and 1450 nm in the design of these two bands, which can be skipped without consideration.
The initial layout of the optical system plays a crucial role in the subsequent design, and there are usually two methods for selecting the initial layout. One is the PW calculation method based on the primary aberration theory of the thin lens. However, it needs large and tedious calculations and is not effective for dealing with large aberrations in a wide band [11,12,13,14,15]. The second is the scaling method, so the second method was chosen in this paper.
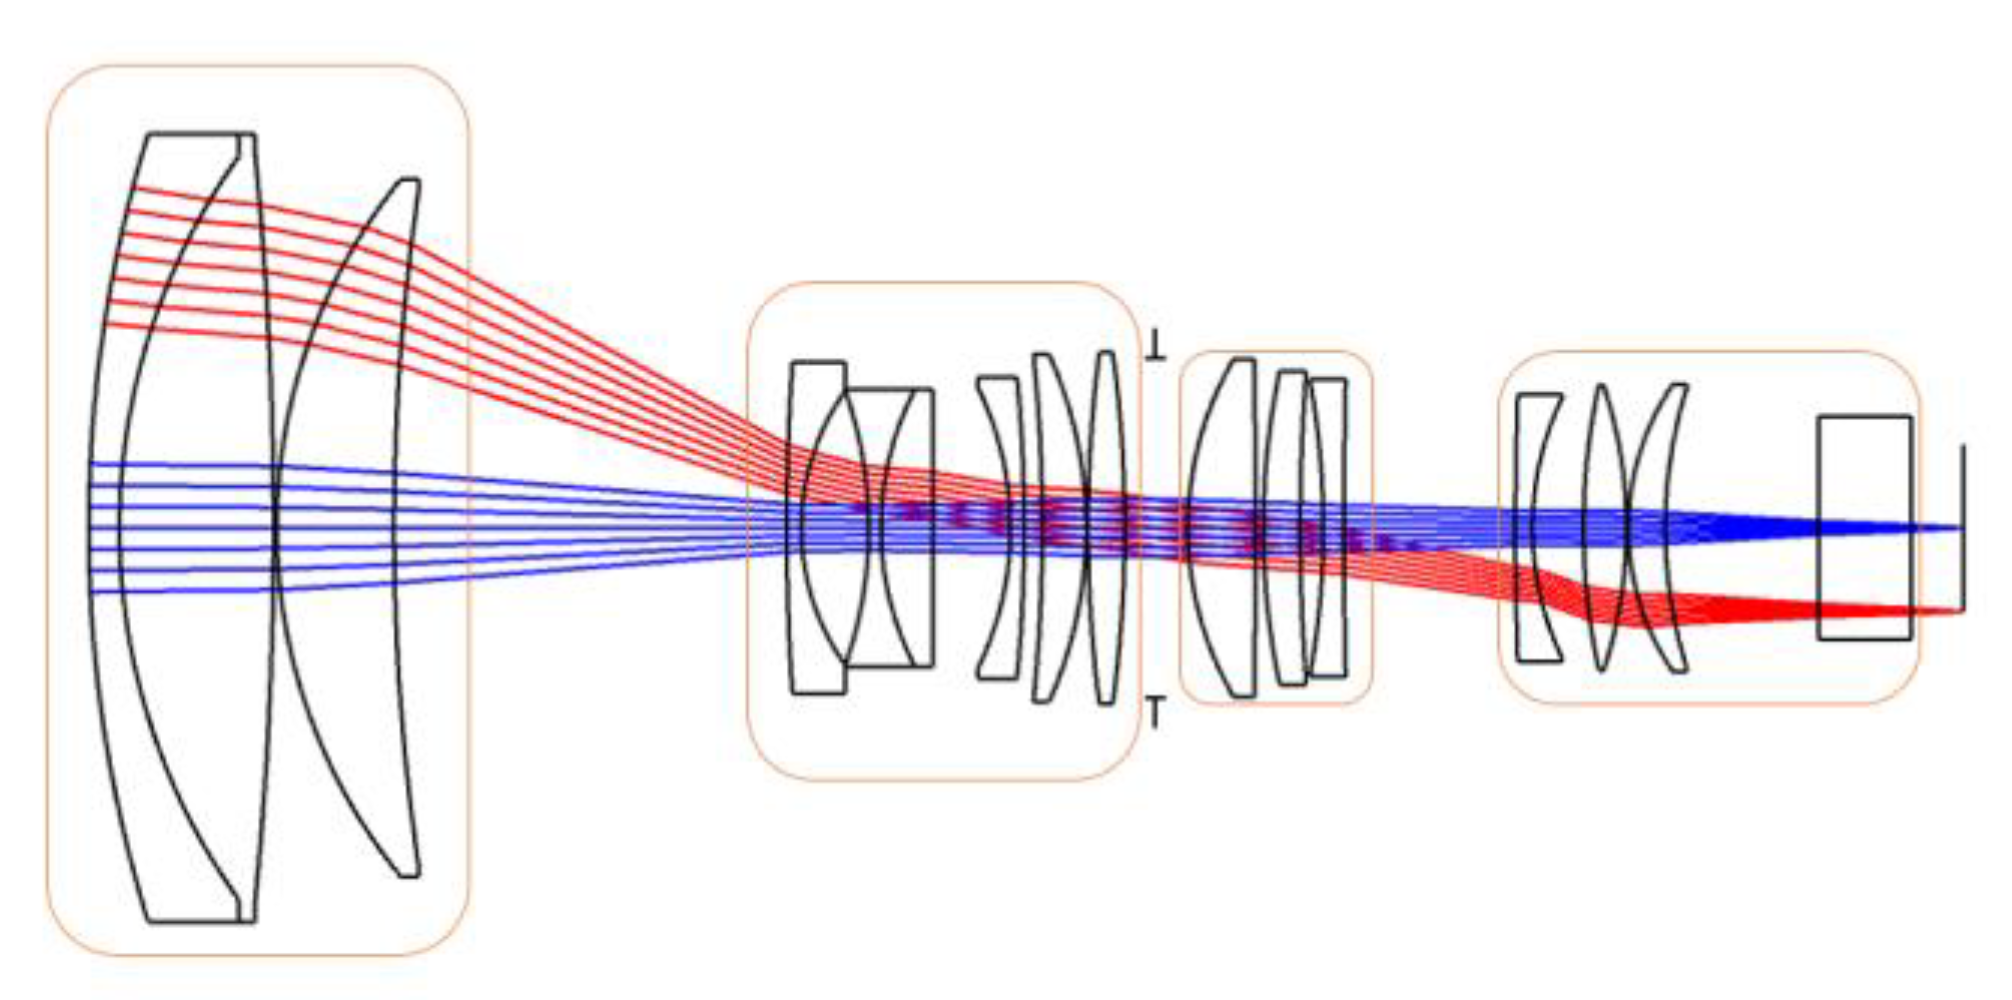
According to the required parameters, a four-group zoom system in the patent library was identified as the initial layout [16]. As shown in the following figure (Figure 4), the initial layout zoom range is 10–60 mm; the F-number is four, the total length is 100 mm, the full field of view angle is 4.2–25°, and the working spectrum is the visible band. The layout of this four-group zoom optical system is shown in Figure 1. From left to right, the front fixed group, the zoom group, the diaphragm, the compensation group, and the fixed group can be observed.
After determining the initial layout of the optical system, the first step is to scale it. This initial layout has a focal length of 10 mm–60 mm and should be enlarged appropriately.
Table 3 is the selected normalized initial structure of each lens parameter table.
In the design process, the aberration is always larger in the mid-focal section, and the reason is found: the too-strict limitation of the rear intercept distance. In this step, the rear fixed group is considered to be transformed into a movable component, and during the zoom movement, the rear three components all move according to a certain trajectory. In this form, each component moves according to the most favorable way, which can achieve the maximum zoom effect. The design of the lens barrel of this form is more complex than other forms of the zoom system, and the total length of the optical system becomes variable, which makes the zoom system have three groups of zoom curves, but with the improvement of processing technology, its complexity and processing difficulty also decreases [17].
According to the imaging principle of the positive group compensated zoom optical system, when the focal lengths distribution pattern is ‘+, −, +, −’, respectively, it is more suitable to reduce the length and size of the system and ensure a longer back intercept [18], because it constitutes a classic anti-telephoto structure. Therefore, the focal power distribution pattern of ‘+, −, +, −’ is adopted in this paper.
d 12 = f 1 l 2 d 23 = l 3 + l 2 d 34 = l 3 l 4 d 4 f = l 4
d 12 s < d 12 m < d 12 l d 23 s > d 23 m > d 23 l d 34 s < d 34 m < d 34 l d 4 f s < d 4 f m < d 4 f l
Assuming that the total length of the final zoom optical system is 190 mm, the short focal length m4s of group 4 is obtained proportionally as 1.3, which can be used as a reference. The initial layout of the wide band zoom optical system is obtained after several calculations and optimization according to the above formula. The focal lengths of each group in the four groups of the zoom optical system are shown in Table 4. The distances of each group in the four groups at long and short focal lengths are shown in Table 5.
According to Table 5, the theoretical configuration of the four-group zoom optical system is shown. The total length of the zoom optical system is flexible at over 200 mm, and the aperture diaphragm is located at 3.6 mm in front of group 4. During the zooming process, the aperture diaphragm and group 4 move at the same path, and the f-number of the optical system keeps changing continuously. When the focal length of the optical system gradually changes from 25 mm to 150 mm, group 2 and group 4 gradually move away from fixed group 1, and group 3 gradually moves closer to fixed group 1. So, all three zoom curves have no inflection point during the zooming process.
Three structures are set up in ZEMAX with focal lengths of 25 mm, 100 mm, and 150 mm, corresponding to the short focal length, medium focal length, and long focal length, respectively. The operands are added in ZEMAX to control the image quality. The image quality weight is reduced in the design process to satisfy the prerequisite of the optical system, such as the parameters of the working spectrum, focal length, the field of view, etc.
After satisfying the basic parameters of the optical system, the zoom curve of the system needs to be ensured so that it does not have an inflection point. The short focal length of each group is used as the basis; the need to ensure the change in each component during the zooming process is monotonic, and here, more multiple group states are set, with focal lengths of 50 mm, 75 mm, 110 mm, 120 mm, 130 mm, and 140 mm, respectively, to control each component monotonic. Because the change in the focal length curve is more drastic from a mid-focus to a long focus, it is necessary to set several more multiple groups.

3.2. Optical System Optimization

Afterward, we checked the Ray fans diagram to determine the aberration, in which we saw that the off-axis aberration was larger, indicating that the design could be as close to the symmetric layout as possible. The initial optimization resulted in a few more stable optical system layouts, and the subsequent design was based on the best of these layouts.
Considering the processing problem, the lens cannot be too thick, as this will make the optical system weight increase, and part of the glass material cannot be too thick; the lens edge cannot be too thin because it is easy to cause a collapsing phenomenon in the assembly. The spacing between the lenses also needs to be controlled. In this paper, the air spacing between the lenses is set greater than 0.2 mm, and the minimum spacing between the components is greater than 1 mm. The system requires a back intercept distance greater than 17.526 mm due to the adaptation of the C-mount. These requirements can be controlled by TTHI, OPGT, MNCA, MENA, etc.
After meeting these requirements, the system aberration needs to be further optimized by analyzing the main aberrations of the optical system through the spot diagram and the Ray fans diagram, viewing the distribution of aberrations by the Seder diagram, and appropriately changing the parameters of the surface with a large contribution to the aberration. In the optimization process, we found that chromatic and spherical aberrations are the most important aberrations. The source of chromatic aberration is generally caused by the different refractive indices of the lens materials in different wavelengths of light. The correction of chromatic aberration can be combined in the ways mentioned above—the combinations of the positive and negative lens, combinations of different dispersion material lenses, double-glued lenses, or even triple-glued lenses. Using several material combinations above, three sets of double-glued lenses were used to decrease the aberration to an acceptable level. The main methods for correcting spherical aberration are glued lenses and the separation of optical focal lengths, both of which were used. We split the lens that bears a larger optical focal length into two lenses. If the image quality does not meet the requirements, you can also add the operand MTFA control center field of view, MTFT; the MTFS control edge field of view can be further optimized, and distortion can be used in the DIMX operand for control. After fine-tuning and multiple optimizations, it was found that the image quality of each focal length could meet the requirements and reach the design index.

4. Results

4.1. The Layout and Aberration Diagrams of Optical System

The layout and aberration diagrams of the optical system with different focal lengths after optimization are shown in Figure 5. Compared with the original patent, the number of lenses decreases, the aperture is reduced, the wavelength is increased, and the total optical length is changed from fixed to floating. The final layout is similar to the initial layout obtained from the calculation above. The first fixed group does not move, taking the first surface as the reference; however, as the focal length increases, groups 2 and 4 move away from the first surface, and group 3 moves closer to the first surface. d23 decreases, while d12, d34, and d4f all become larger.
The modulation transfer function (MTF), spot diagrams, and distortion diagrams are important indicators for evaluating the imaging quality of an optical system.
When the focal length of the zoom optical system is 25 mm, 100 mm, and 150 mm, the MTF of the optical system is greater than 0.3 at the Nyquist frequency, and it can even be greater than 0.4 at the mid-focus position, which meets the design requirements.
The size of the spot in the spot diagrams can accurately determine the diffusion of the imaging rays of the optical system. The smaller the radius of the scattered spot is, the better the imaging quality of the optical system is. The root means square radius RMS is smaller than the CCD image element size of 5 um, which can be clearly imaged.
As for optical system distortion, the short focal length part is close to 3%, the medium focal length part is 1.76%, and the long focal length part is 0.66%.

4.2. Analysis of Tolerance

Tolerance analysis is one of the most important aspects of an optical lens before production. Using the tolerance analysis function in ZEMAX, the manufacturing complexity of the lens can be evaluated. When considering the tolerance sensitivity of each optical element of the zoom optical system at the long focal length, medium focal length, and short focal length, the distribution of MTF in the optical system at 100 lp/mm is given according to Monte Carlo analysis.
The tolerance requirements are a material refractive index tolerance of ±0.0005, an Abbe number tolerance of ±0.005; a radius of curvature tolerance of ±0.02 mm; a thickness eccentricity tolerance of ±0.02 mm; a tilt tolerance of ±6′; an integration between components and components with lens barrel integration tolerance; and eccentricity tolerance of ±0.02 mm and tilt tolerance of ±1′: At the probability of the short focal part above 98%, the MTF is greater than 0.2. From the center of the field of view to the 0.7 fields of view at the long focal length, a 98% field of view can meet the MTF of 0.1, and the edge field of view can reach 0.1 with a 90% probability. The above tolerance analysis shows that the existing processing and mounting level can fully meet the design requirements of the system.

4.3. Zoom Curve

Our zoom system adopts a mechanical compensation method for its design. So, we need to simulate the zoom curve of the system and check whether the zoom layout is easy to process. We wrote the ZPL program with the first lens as the benchmark. In this program, 120 points were selected for curve fitting, as can be seen in Figure 6. The zoom curve of the system is smooth, and there is no inflection point during the zooming process.

5. Conclusions

In this paper, we designed a wide-band zoom optical system with a working spectrum from 400 nm to 1700 nm using ZEMAX. According to the aberration theory, the layout is adjusted by various methods and optimized several times. The MTF of the optical system in each field of view is greater than 0.3 at 100 lp/mm, and RMS is controlled below 5 μm, indicating that the imaging quality is good. The zoom optical system only uses spherical lenses instead of aspheric lenses and diffractive optical elements for design. The results of the tolerance analysis show that the tolerance distribution is reasonable, and the system is easy to process, so there is a good prospect of application in this optical system.

Author Contributions

Conceptualization, F.C.; methodology, F.C.; formal analysis, S.G. and L.F.; investigation, S.G. and L.F.; data curation, S.G.; writing—original draft preparation, S.G.; writing—review and editing, L.F. and F.C.; visualization, S.G.; supervision, F.C.; project administration, F.C.; funding acquisition, F.C. All authors have read and agreed to the published version of the manuscript.

Funding

This research received no external funding.

Institutional Review Board Statement

The animal study protocol was approved by Animal Welfare and Ethics Group, Department of Laboratory Animal Science Fudan University (protocol code 202108005S, 2021.08.8).

Data Availability Statement

Not applicable.

Acknowledgments

We would like to thank Jun Chen ‘s team for their contribution and inspiration on application scenarios and for determining the parameters of the imaging device; we would also like to thank Yingbo Yue for guidance in writing the paper.

Conflicts of Interest

The authors declare no conflict of interest. The funders had no role in the design of the study; in the collection, analyses, or interpretation of data; in the writing of the manuscript; or in the decision to publish the results.

References

  1. Wang, T.; Wang, S.; Liu, Z.; He, Z.; Yu, P.; Zhao, M.; Zhang, H.; Lu, L.; Wang, Z.; Wang, Z.; et al. A hybrid erbium(III)–bacteriochlorin near-infrared probe for multiplexed biomedical imaging. Nat. Mater. 2021, 20, 1571–1578. [Google Scholar] [CrossRef] [PubMed]
  2. Hu, Z.; Fang, C.; Li, B.; Zhang, Z.; Cao, C.; Cai, M.; Su, S.; Sun, X.; Shi, X.; Li, C.; et al. First-in-human liver-tumour surgery guided by multispectral fluorescence imaging in the visible and near-infrared-I/II windows. Nat. Biomed. Eng. 2020, 4, 259–271. [Google Scholar] [CrossRef] [PubMed]
  3. Zhang, B.; Gao, F.; Wang, M.; Cao, X.; Liu, F.; Wang, X.; Luo, J.; Wang, G.; Bai, J. In vivo tomographic imaging of lung colonization of tumour in mouse with simultaneous fluorescence and X-ray CT. J. Biophotonics 2014, 7, 110–116. [Google Scholar] [CrossRef] [PubMed]
  4. Nguyen, Q.T.; Olson, E.S.; Aguilera, T.A.; Jiang, T.; Scadeng, M.; Ellies, L.G.; Tsien, R.Y. Surgery with molecular fluorescence imaging using activatable cell-penetrating peptides decreases residual cancer and improves survival. Proc. Natl. Acad. Sci. USA 2010, 107, 4317–4322. [Google Scholar] [CrossRef] [PubMed] [Green Version]
  5. Anderson, R.R.; Parrish, J.A. The optics of human skin. J. Invest. Dermatol. 1981, 77, 13–19. [Google Scholar] [CrossRef] [PubMed] [Green Version]
  6. Li, X.; Gong, H.-M.; Shao, X.M.; Li, T.; Huang, S.-L.; Ma, Y.-J.; Yang, B.; Zhu, X.-L.; Gu, Y.; Fang, J.-X. Recent advances in short wavelength infrared InGaAs focal plane arrays. J. Infrared Millim. Waves 2022, 41, 009. [Google Scholar]
  7. Ronald, G.D.; Hodgkin, V.; Richard, V. What good is SWIR? Passive day comparison of VIS, NIR, and SWIR. SPIE 2013, 8706, 87060L. [Google Scholar]
  8. Hodgkin, V.A.; Hixson, J.G.; Corbin, T.; Armentrout, W.P. Impact of waveband on target-to-background contrast of camouflage. SPIE 2012, 8355, 835519. [Google Scholar]
  9. Tamagawa, Y.; Tajime, T. Dual-band optical systems with a projective athermal chart: Design. Appl. Opt. 1997, 36, 297–301. [Google Scholar] [CrossRef] [PubMed]
  10. Allied Vision, Goldeye Cl-130-Tec1datasheet [OE/EB]. Available online: https://cdn.alliedvision.com/fileadmin/pdf/en/Goldeye_CL-130_TEC1_DataSheet_en.pdf (accessed on 15 December 2022).
  11. Chunkan, T. Design of Zoom Optical System; National Defense Industry Press: Dublin, OH, USA, 1988. [Google Scholar]
  12. Kingslake, R.; Johnson, R.B. Lens Design Fundamentals; Academic Press: Burlington, VT, USA, 2010; pp. 137–167. [Google Scholar]
  13. Joseph, M.G. Introduction to Lens Design with Practical ZEMAX Examples; Willmann-Bell Inc.: Richmond, VA, USA, 2002; pp. 175–205. [Google Scholar]
  14. Christopher, C.A. Multi spectral infrared imaging optics. SPIE 2003, 5074, 830–838. [Google Scholar]
  15. Wang, Z.; Gu, P. Practical Optical Technology Handbook; Machinery Industry Press: Beijing, China, 2006; pp. 333–415. [Google Scholar]
  16. Ozawa, T. Compact Zoom Lens. U.S. Patent 4699474-A, 13 October 1987. [Google Scholar]
  17. Miks, A.; Novak, J. Paraxial analysis of zoom lens composed of three tunable-focus elements with fixed position of image-space focal point and object-image distance. Opt. Express 2014, 22, 27056–27062. [Google Scholar] [CrossRef] [PubMed]
  18. Zhang, K.; Zhong, X.; Zheng, Q.; Meng, Y.; Su, Z.Q. Design method research of a radiation-resistant zoom lens. Opt. Commun. 2022, 509, 127881. [Google Scholar] [CrossRef]
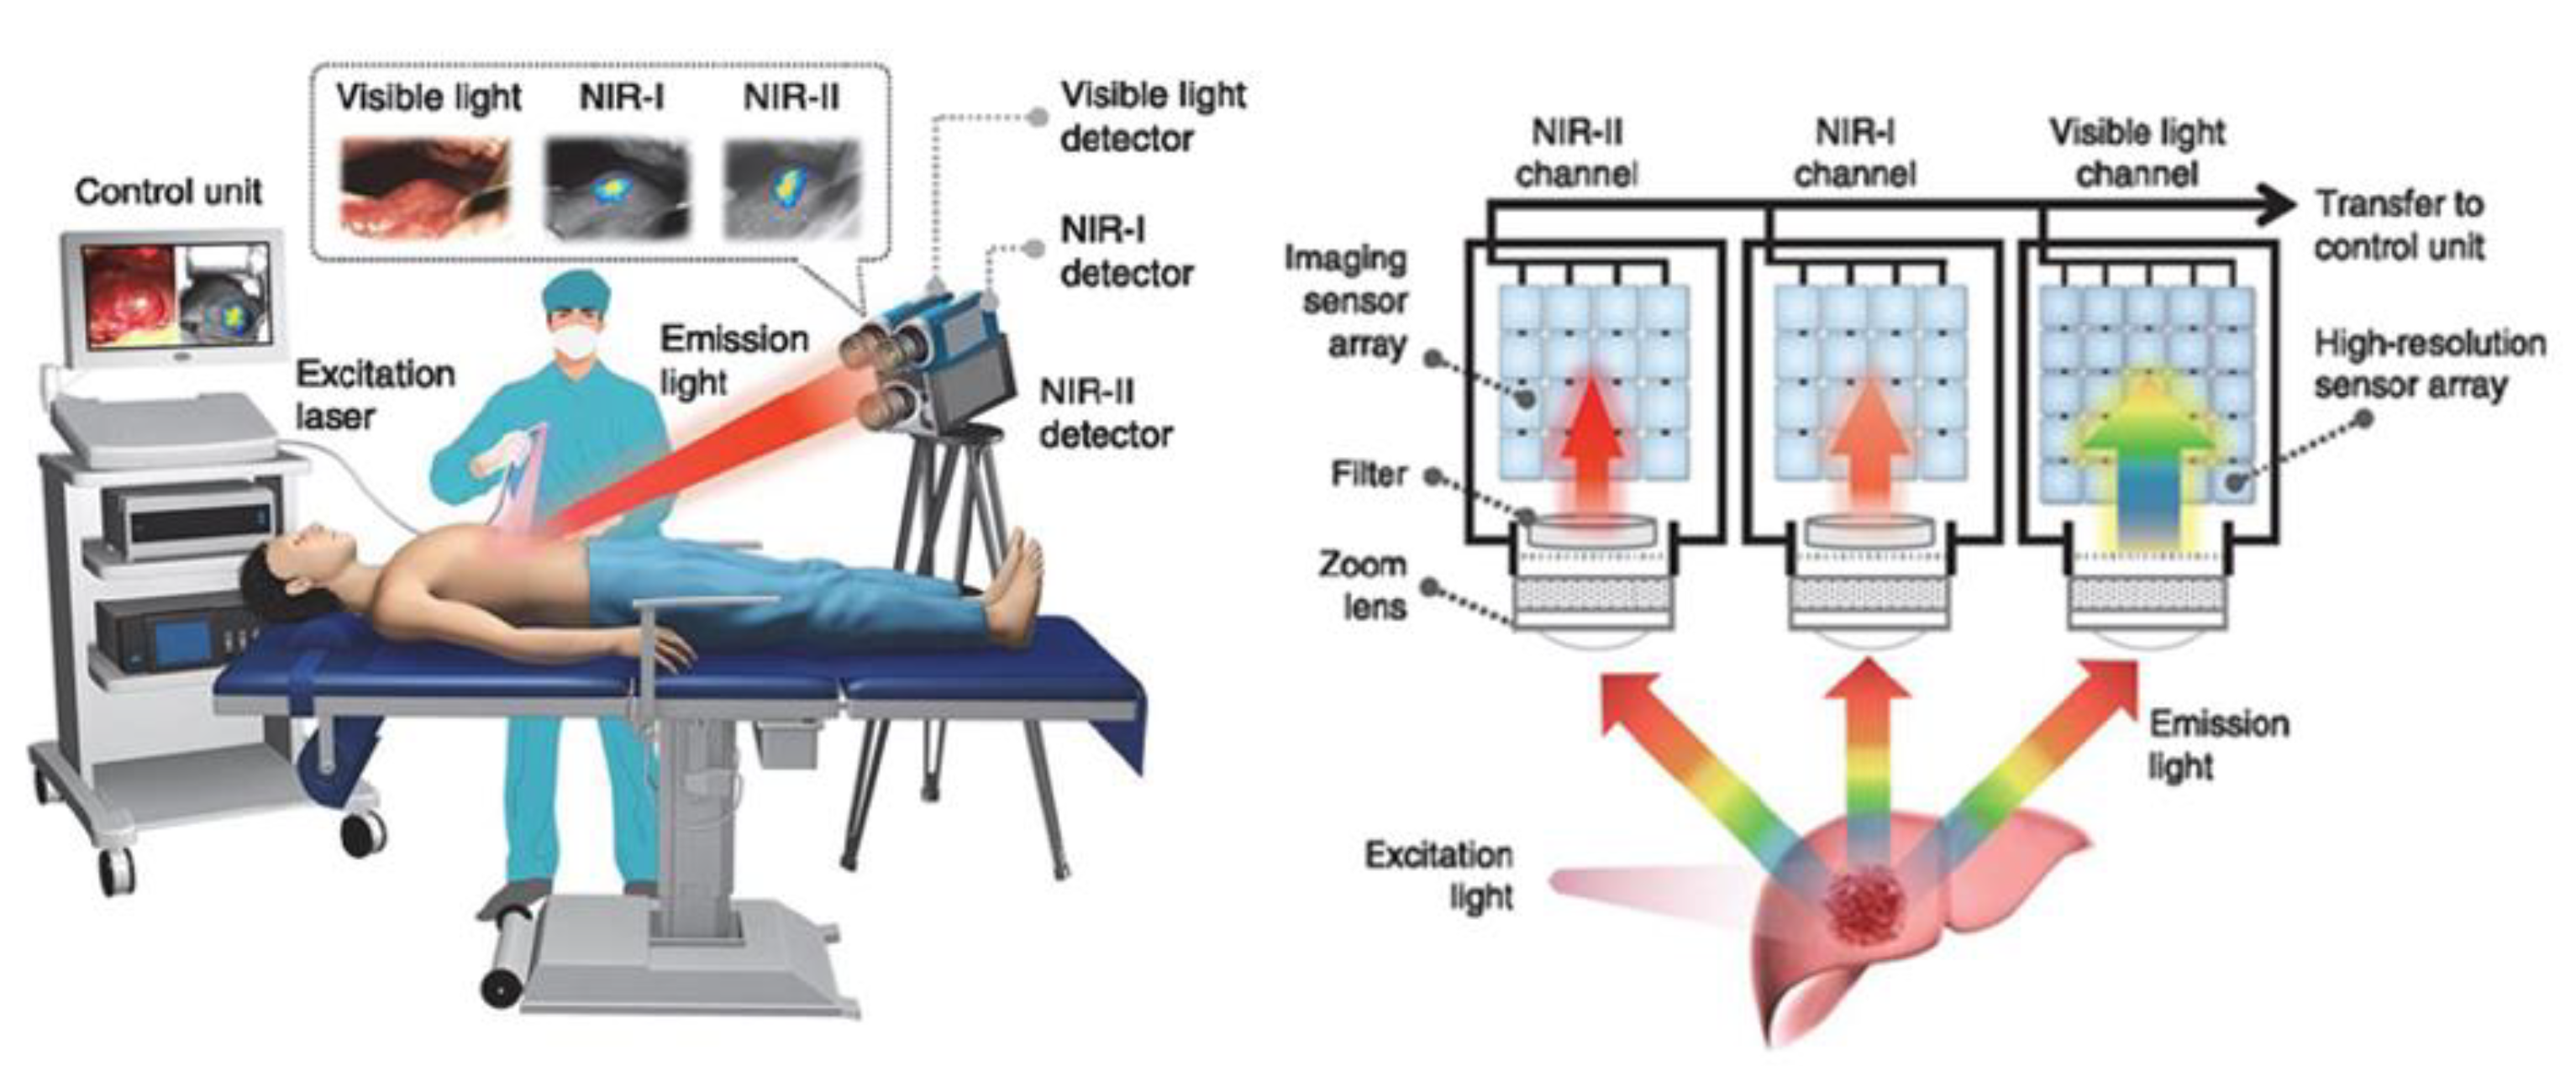
Figure 1. The illustration of multiple wavelengths for fluorescence surgical navigation [2].
Applsci 13 01421 g001
Figure 2. Pre-shot pictures of our previous equipment. (a) Wide-band camera and fixed-focus lens imaging. (b) Camera imaging at different wavelengths and positions.
Applsci 13 01421 g002
Figure 3. Quantum efficiency of InGaAs detectors adapted to this paper [10].
Applsci 13 01421 g003
Figure 4. Light path diagram of initial layout [16].
Applsci 13 01421 g004
Figure 5. (a) Final layout of the zoom optical system; (b) MTF curves of the zoom optical system [f = 25 mm, f = 100 mm, f = 150 mm]; (c) Spot diagrams; (d) Distortion diagrams.
Applsci 13 01421 g005
Figure 6. Zoom curves.
Applsci 13 01421 g006
Table 1. Performance of five optical glasses in 0.4~1.7 μm.
MaterialRefractive IndexChromatic Dispersion
n0.55 μmn0.85 μmn1.35 μmC0.4–0.7 μmC0.7–1.0 μmC1.0–1.7 μmC0.4–1.7 μm
N-BK71.518521.509861.503223.42%1.08%1.70%3.00%
N-PK52A1.498301.491841.487502.70%0.81%1.05%2.20%
N-SF11.723081.698891.689007.70%1.85%2.50%12.30%
N-LAF21.747531.730741.721465.05%1.32%1.32%3.57%
N-LAF341.775821.759651.7492114.50%1.28%1.63%3.50%
Table 2. Design specifications of the zoom optical system.
ParametersValues
Focal length25–150 mm
f-number5.0–6.0
Working spectrum400–1700 nm
Full field of view3.1–18.6°
Distortion≤3%
MTF(100 lp/mm)≥0.3
Table 3. Parameters of each lens in patent short focus state.
ELEM (S1–S2)EFFL/mml/mml’/mmPower/mm−1
(1–2)−838.908988856.928146−830.307019−0.001192
(2–3)509.499515−501.816581463.7929340.001963
(4–5)649.766047−661.913398598.4626670.001539
(6–7)−188.382558193.390036−187.898733−0.005308
(8–9)−134.445631136.704320−136.088199−0.007438
(9–10)203.022051−203.075034187.5088030.004926
(11–12)−369.991328368.785954−375.935497−0.002703
(13–14)517.164067−497.424250522.1493090.001934
(15–16)611.601289−605.083551605.4685280.001635
(18–19)340.996070−340.135662317.6244980.002933
(20–21)1269.725526−1277.6218071248.7742610.000788
(22–23)−479.887421480.615973−485.336322−0.002084
(24–25)−219.869174225.500765−219.419265−0.004548
(26–27)213.582213−205.255629207.9377650.004682
(28–29)403.404418−416.395251379.4000410.002479
(30–31)Infinity0.0000000.0000000.000000
Table 4. Focal length of the four groups.
Group1234
Initial EFL/mm117.64−70.1442.87−140.34
Final EFL/mm124.385−78.78342.717−182.017
Table 5. Spacing between each group in the initial layout.
Distanced12d23d34d4f
Short focal length/mm0.280.154.7117.526
Long focal length/mm65.4715.17512.88327.116
Disclaimer/Publisher’s Note: The statements, opinions and data contained in all publications are solely those of the individual author(s) and contributor(s) and not of MDPI and/or the editor(s). MDPI and/or the editor(s) disclaim responsibility for any injury to people or property resulting from any ideas, methods, instructions or products referred to in the content.