Abstract
The bracing components in steel I-girder bridge systems are essential structural components for the bridges to restrain their rotation due to lateral torsional buckling (LTB). Current design specifications require bracing components to be installed to prevent I-girder sections from unexpectedly twisting due to instability. To estimate the bracing internal forces acting on the bracing elements, we can use approximate design equations that provide considerably conservative design values. Otherwise, it is necessary to conduct a thorough finite element analysis considering initial imperfections to obtain accurate bracing internal forces in the steel I-girder bracing systems. This study aims to provide estimation models based on deep neural network (DNN) algorithms to more accurately estimate the internal forces acting on the bracing element compared with the current design methodology when LTB occurs. This is conducted by constructing structural response data based on the geometrically nonlinear analysis with imperfections to provide accurate bracing internal forces, namely bracing moments () and bracing forces (). To propose prediction models, 16 input and three output variables were selected for training the structural response data. Furthermore, a parametric study on the hyperparameters used in DNN models was analyzed for the number of hidden layers, neurons, and epochs. Based on statistical performance indices (i.e., RMSE, MSE, MAE, and R2), the estimated values using DNN models were evaluated to determine the best prediction models. Finally, DNN models that more accurately estimate internal forces (, ) in bracing elements, and that provide the best prediction results depending on hyperparameters (numbers of hidden layers, neurons, and epochs), are proposed.
1. Introduction
Lateral torsional buckling (LTB) is a major failure mode induced by instability in flexural members that typically control the entire design in steel buildings and bridges. The moment capacity of the flexural members is enhanced by bracing elements to provide lateral and rotational supports to retain LTB in flexural elements. Thus, bracing members must possess sufficient strength and stiffness against internal forces affected by the LTB phenomenon. In general, bracing components in straight steel I-girder bridge systems are secondary structural members because they resist no direct applied forces, but secondary internal forces are induced by displacement changes in the top and bottom flanges of adjacent girders due to twists induced by the LTB. However, it is an essential structural component for the bridges to restrain against rotation with respect to their longitudinal axis at points of support and to prevent relative displacement (i.e., twist) of the top and bottom flanges. Therefore, current design specifications worldwide require the installation of bracing components such as torsional bracing, lateral bracing, or a combination of torsional and lateral bracing to prevent unexpected twists of the I-girder sections caused by the instability of the girders [1]. Furthermore, stiffness and strength requirements for the bracings in flexural members were stipulated to avoid the failure of flexural members and the bracing components due to the LTB.
Since Taylor and Ojalvo [2] proposed an exact solution for the critical LTB strength of a doubly symmetric beam under a uniform moment with continuous torsional bracing, researchers have continued to refine their methods for computing the LTB strength of flexural members with torsional bracing. Milner [3] demonstrated that cross-sectional distortion in beam members could be controlled by adopting an effective bracing stiffness (). Yura [4] expanded the effective bracing stiffness by considering the effect of stiffeners and in-plane girder flexibility in the braced flexural members.
Later, Yura [5] provided a comprehensive view of the beam bracing design. Furthermore, design factors affecting bracing requirements and design examples of the torsional bracing system were introduced. The design methodology developed by Yura [5] was adopted in the third edition of the American Institute of Steel Construction Load and Resistance Factor Design Specification [6].
Based on research by Winter [7] and Yura [5], the ideal stiffness requirements obtained by eigenvalue analysis resulted in poor estimates of LTB behavior in beam bracing systems because the ideal stiffness requirements disregarded the effects of geometric nonlinearity due to initial imperfections. Therefore, Wang and Helwig [8] investigated the effects of various types of imperfections for beam bracing systems based on geometric nonlinear analysis to determine the critical imperfection shapes for simulating the most critical LTB behavior in the beam bracing system. Thus, the stiffness requirements can be determined by numerous finite element analyses (FEAs). Liu and Helwig [9] investigated the torsional brace strength requirements for steel I-girder systems. They conducted numerous parametric studies to evaluate the bracing moments stipulated in the current design specification [1,10]. Han and Helwig [11] investigated the elastic global LTB of straight I-girder bracing systems.
Regarding internal forces created in the torsional bracings because of the LTB behavior, current design specifications provide conservative design values by assuming required rotational displacements of the bracing elements to ensure that the bracing elements possess sufficient strength and stiffness to avoid failure due to LTB. To estimate reasonable bracing internal forces, it is necessary to implement it through FEA analysis because the internal forces are generated by secondary effects due to LTB, which are challenging to solve using traditional mathematical models.
Meanwhile, with the current development of artificial intelligence (AI), various types of artificial neural networks (ANNs) are being adopted to model complex nonlinear relationships that cannot be solved deterministically using traditional mathematical models. ANNs are a type of mathematical model that resembles the biological characteristics of the human brain. Numerous researchers have attempted to apply various types of neural networks to evaluate extremely complex systems and to predict the target values of the systems in various research fields, including structural engineering. Nguyen et al. [12] developed a deep neural network (DNN) with high-order neurons, namely a second-order artificial neural network (SO-ANN), and used it to predict foamed concrete strength. Dung et al. [13] investigated a vision-based method for crack detection in gusset plate welded joints of steel bridges using deep convolutional neural networks. Degtyarev [14] sought to predict the shear strength of CFS channels with slotted webs based on an ANN. Ly et al. [15] developed a DNN model to predict the compressive strength of rubber concrete. Nguyen et al. [16] suggested a machine learning-based formulation for predicting the shear capacity of squat flanged RC walls. Pizarro and Massone [17] developed a structural design method for reinforced concrete buildings based on DNNs. Tan et al. [18] developed a prediction model for the compressive strength of CO2 concrete using regression analysis and ANNs. Tanhadoust et al. [19] investigated the prediction of the stress–strain behavior of normal-weight and lightweight aggregate concrete exposed to high temperatures using an LSTM recurrent neural network. Min et al. [20] developed damage detection models for tethers of submerged floating tunnels based on CNNs.
Based on the literature, it was indicated that applying neural networks can be effective for analyzing complex problems and predicting the target values that cannot be solved using traditional mathematical models. Furthermore, the bracing moments and forces induced by LTB in steel I-girder bracing systems are a type of complex structural system due to the secondary effects. To more accurately predict the bracing forces in the steel I-girder bracing systems, thus, this study aims to evaluate the structural behavior of the torsional bracing systems in steel I-girder bridges and more accurately estimate the internal forces compared with the current design methodology based on DNNs. The internal forces in the beam bracing systems comprise bracing moments and bracing forces, acting on torsional bracing in steel I-girder bridges when the applied loading reaches the LTB limit states. In this study, a comparative study was conducted based on geometric nonlinear FEA to determine the accurate internal forces at strength limit states. Furthermore, it explores the possibility of applying AI to estimate internal forces in the bracing system, which is one of the most complex structural systems due to the secondary effects. From the FEA results, estimates of internal forces in the torsional braced bridge system were implemented based on a DNN with respect to various design parameters to simplify the preliminary design phase. Based on statistical performance indices (i.e., root mean square error (RMSE), mean square error (MSE), mean absolute error (MAE), coefficient of determination (R2)), the estimated values using DNN models were evaluated to determine the best prediction models. Finally, deep neural network (DNN) models, which can be tuned by adjusting hyperparameters such as the hidden layers, neurons, and epochs to accurately estimate internal forces (, ) in bracing elements, have been proposed and have been shown to produce the best prediction results.
2. Summary of Design Specifications for Beam Bracing System with Torsional Bracing
2.1. LTB Strength of Beam Bracing Systems
In the AISC design standard [1], the torsional brace requirements are provided based on the buckling strength of a beam with a continuous torsional brace along its length, as presented in Taylor and Ojalvo [2] and modified for cross-section distortion in Yura [5], and shown in Equation (1).
where denotes the flexural strength of girder bracing system, denotes the buckling strength of a girder with a continuous torsional brace along its length, denotes the moment gradient factor for the entire girder, denotes the moment gradient factor for the beam segment between torsional bracing, denotes the LTB strength of beams without the torsional brace, denotes the modulus of elasticity, and denotes the effective moment of inertia of the beam section; , which is the load height factor of the beam, is 1.2 for top flange loading and 1.0 for centroidal loading, and denotes the continuous torsional brace stiffness per unit length, which is equal to .
The moment gradient factors can be computed by the following expression, which was proposed by Helwig et al. [21].
where is the maximum bending moment, is the magnitude of the moment at the quarter location of the target girders, is the magnitude of the moment at the mid-location of the target girders, is the magnitude of the moment at the three-quarter location of the target girders, and is a factor that considers the reverse curvature bending moment.
Neglecting the unbraced beam buckling term provides a conservative estimate of the torsional brace stiffness requirements. Thus, the required brace stiffness to provide the maximum LTB strength of the braced beams is expressed in Equation (3) as follows:
Yura [5] developed the strength requirement for beam torsional bracing based upon an assumed initial twist imperfection of , where is equal to the depth of the beam. The strength requirement of the beam bracing is simply determined by the required bracing stiffness multiplied by the assumed initial twist imperfection in Equation (4). In Equation (4), the effective bracing stiffness is equal to two times the ideal torsional bracing stiffness, which provides two times the conservative bracing moment.
2.2. LTB Strength of I-Girder Sections for Bridges
In the AASHTO design standard [22], the LTB strength of the prismatic steel I-girder is provided. The LTB strength based on the unbraced length () is provided as below.
If , then
If , then
If , then
where denotes the lateral–torsional buckling resistance of compression flange, denotes the unbraced length, limits the unbraced length to achieve the nominal flexural resistance of under uniform bending, limits the unbraced length to achieve the onset of nominal yielding in either flange under uniform bending with consideration of compression flange residual stress effects, is the moment gradient modifier, is the web load-shedding factor, is a hybrid factor, is the yielding strength of steel girders, is the compression flange stress at the onset of nominal yielding within the cross-section, and is the elastic lateral–torsional buckling stress.
3. Finite Element Analysis (FEA)
3.1. Designing FEA Models
In this study, steel I-girder bracing systems (same as beam bracing systems) were designed based on the provisions of the AASHTO LRFD bridge design specifications [22]. The girder heights () of the bridge models are 1/25 times their span length (L) to satisfy the provisions in AASHTO [22], to ensure that the bridge girder sections considered in this study do not allow excessive flexural deflections under design loads. The flange widths () of the steel I-girder models are 1/2–1/5 times their girder height (). Moreover, all flanges and webs have a compact thickness for structural steels with a yield strength of 345 MPa, which satisfies the provisions of AASHTO [22] to prevent local buckling behavior.
In this study, two different types of cross-sections were designed. One is the W-section stipulated in the AISC design manual [1], with 900 mm height or above, with a flange width of 1/2.5 to 1/3.36 times the girder height, which is intended for designing bridges. Another group is built-up sections having 2 m and 2.8 m heights with a flange width of 1/3 to 1/5 times the girder height for designing bridges. Thus, six steel I-girder sections were selected for each group, as summarized in Table 1. For torsional bracing design, this study considered zero to thirteen z-type torsional bracings with various values of torsional stiffness, in which the torsional bracing stiffness ranged from zero to sufficient torsional bracing to produce LTB within the unbraced length (), so as to ensure that the effects of torsional bracing on the bracing internal forces are considered in this study. Table 2 illustrates the elastic material properties used in the FEA models.

Table 1.
Dimensions of I-girder bracing systems in this study (Unit: SI).
Table 2.
Material properties used in FEA models.
To consider the bracing torsional stiffness () in the FEA models, this study considers 14 different torsional stiffness values for each I-girder section. The bracing torsional stiffness considered in this study is summarized in Table 3.
Table 3.
Torsional stiffness of bracings ( ) used in the FEA model.
3.2. Outlines of FEA
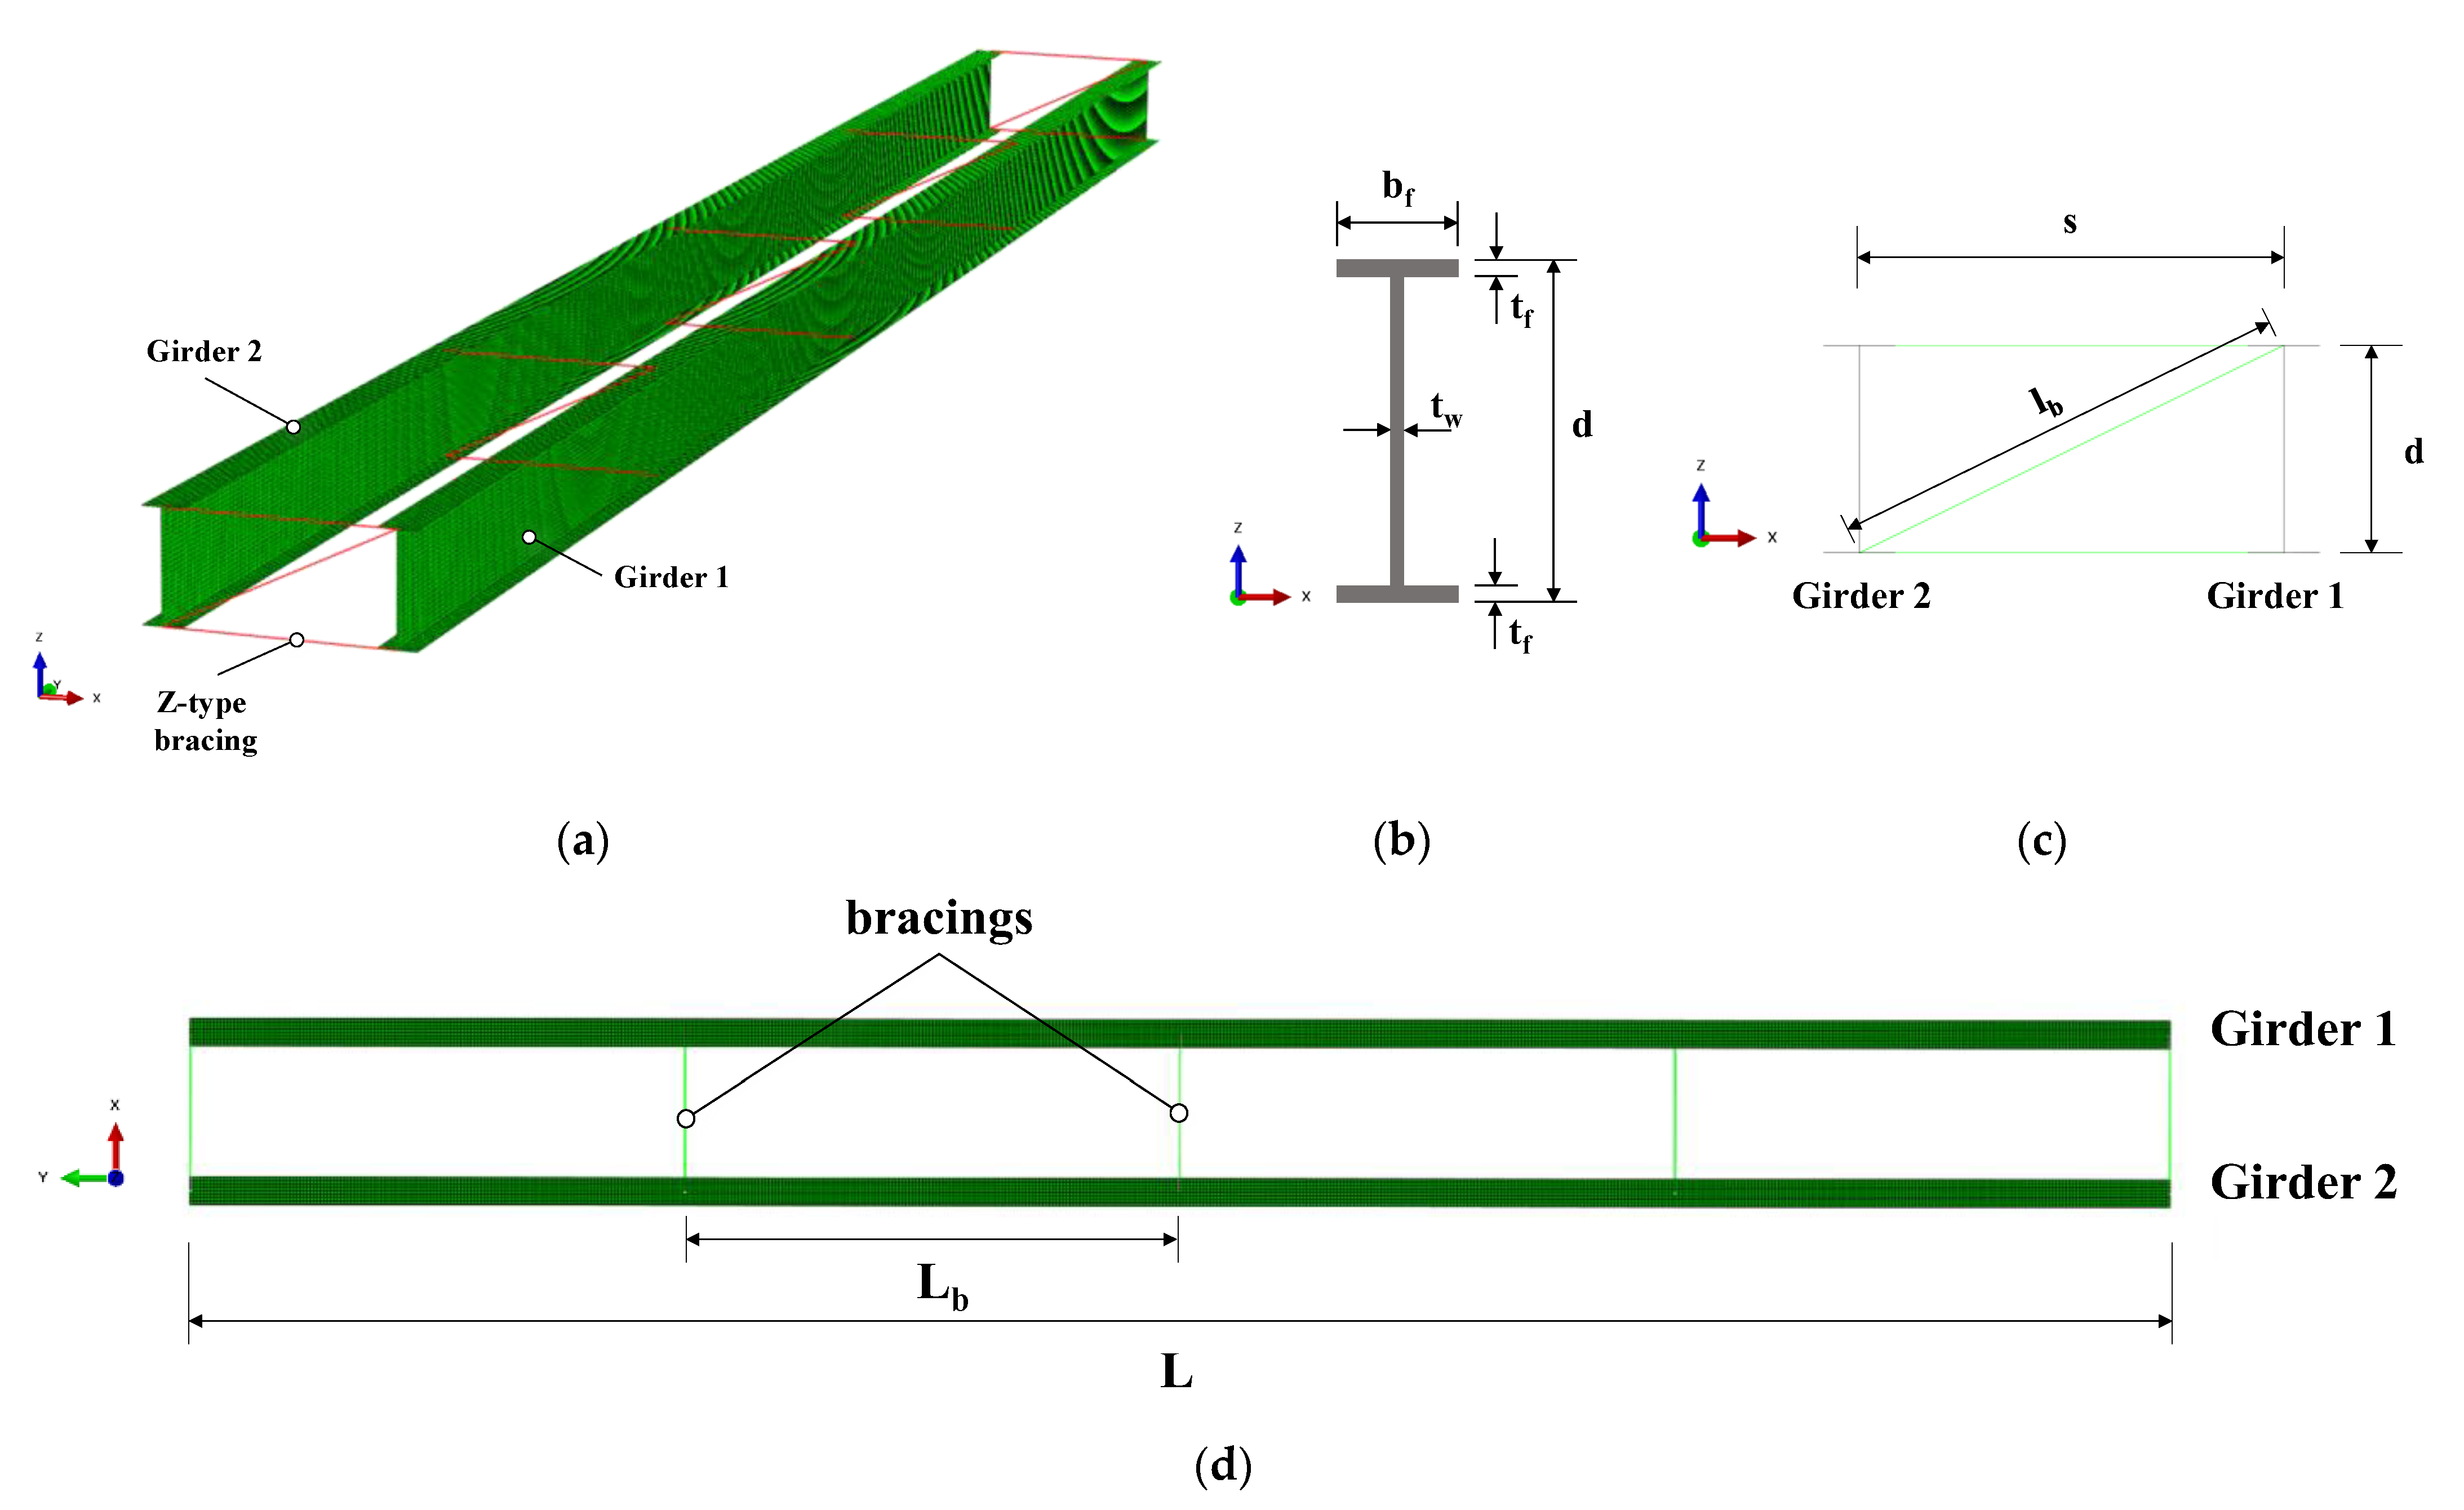
In this study, geometrically and materially nonlinear analysis with imperfection (GMNIA) was conducted using the ABAQUS program [23] with the Riks method. The bridges are modeled with a three-dimensional shell element (S4R) for the I-girders and a three-dimensional truss element (T3D2) for z-type bracing elements, as shown in Figure 1.

Figure 1.
FEA model used in this study: (a) FEA model; (b) cross-section of I-girder; (c) plane view of the bracing system; (d) top view of bracing system.
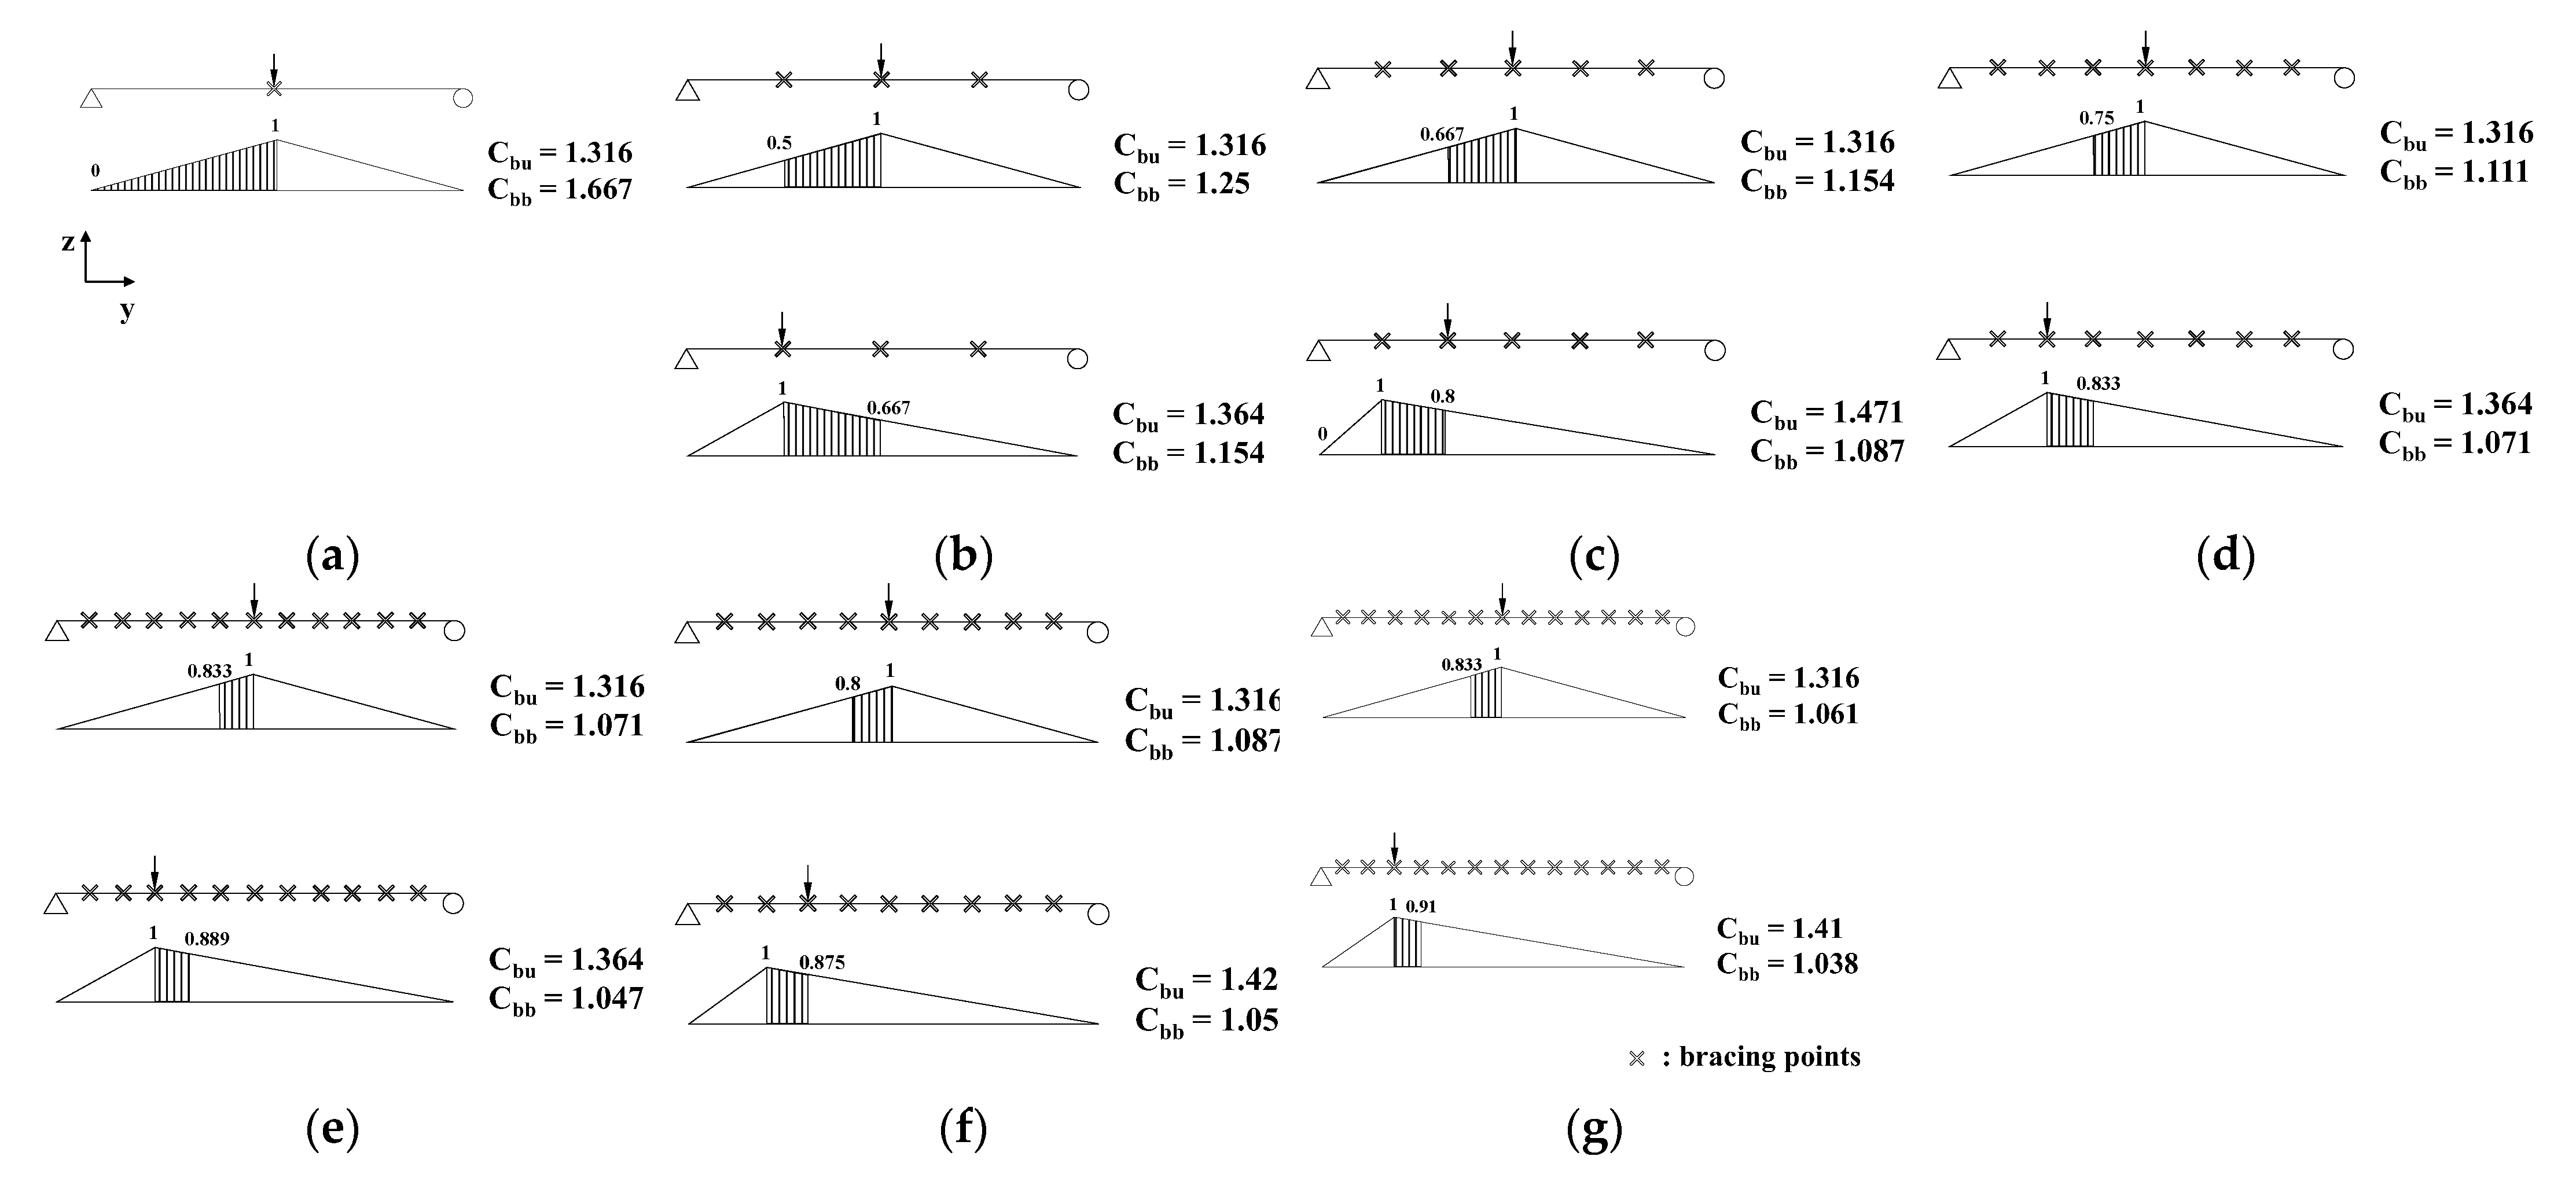
The girder models are supported with a fork-end condition for each end, which means that it is simply supported for flexure, fixed for torsion, and free for warping at each end, as illustrated in Figure 2. For loading conditions, we apply various loading types to estimate internal forces because of the LTB behavior in steel I-girder bracing systems. Hence, various loading conditions with pure bending and moment gradients were considered in the FEA models. For pure bending conditions, equal end moments are applied at each end of the girder to ensure that the same moment is applied in the entire girder section. For the moment gradient condition, two different types of loading conditions are applied in the models, which comprise concentrated loads at the bracing points of the mid-span and bracing points near the quarter span. Therefore, the target segments between brace points, where the maximum bending moments are created, are near the mid-span for pure bending conditions and near the mid-span or the quarter span for moment gradients, as shown in Figure 3. The target segments with the maximum bending moment are critical segments for realistic bridge design. Therefore, in this study, the bracing forces generated due to the LTB are obtained at brace points near the target segments.
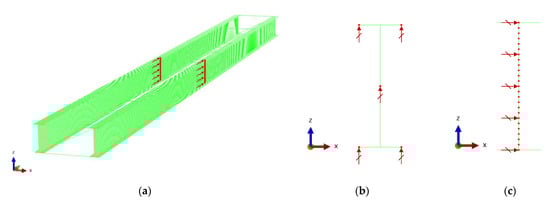
Figure 2.
Boundary conditions adopted in the FEA models: (a) longitudinal (y-axis) constraints at midpoints; (b) vertical (z-axis) constraints at each end; and (c) lateral (x-axis) constraints at each end.

Figure 3.
Applied loading conditions considering various moment gradient effects when the number of bracings is (a) 1; (b) 3; (c) 5; (d) 7; (e) 9; (f) 11; and (g) 13.
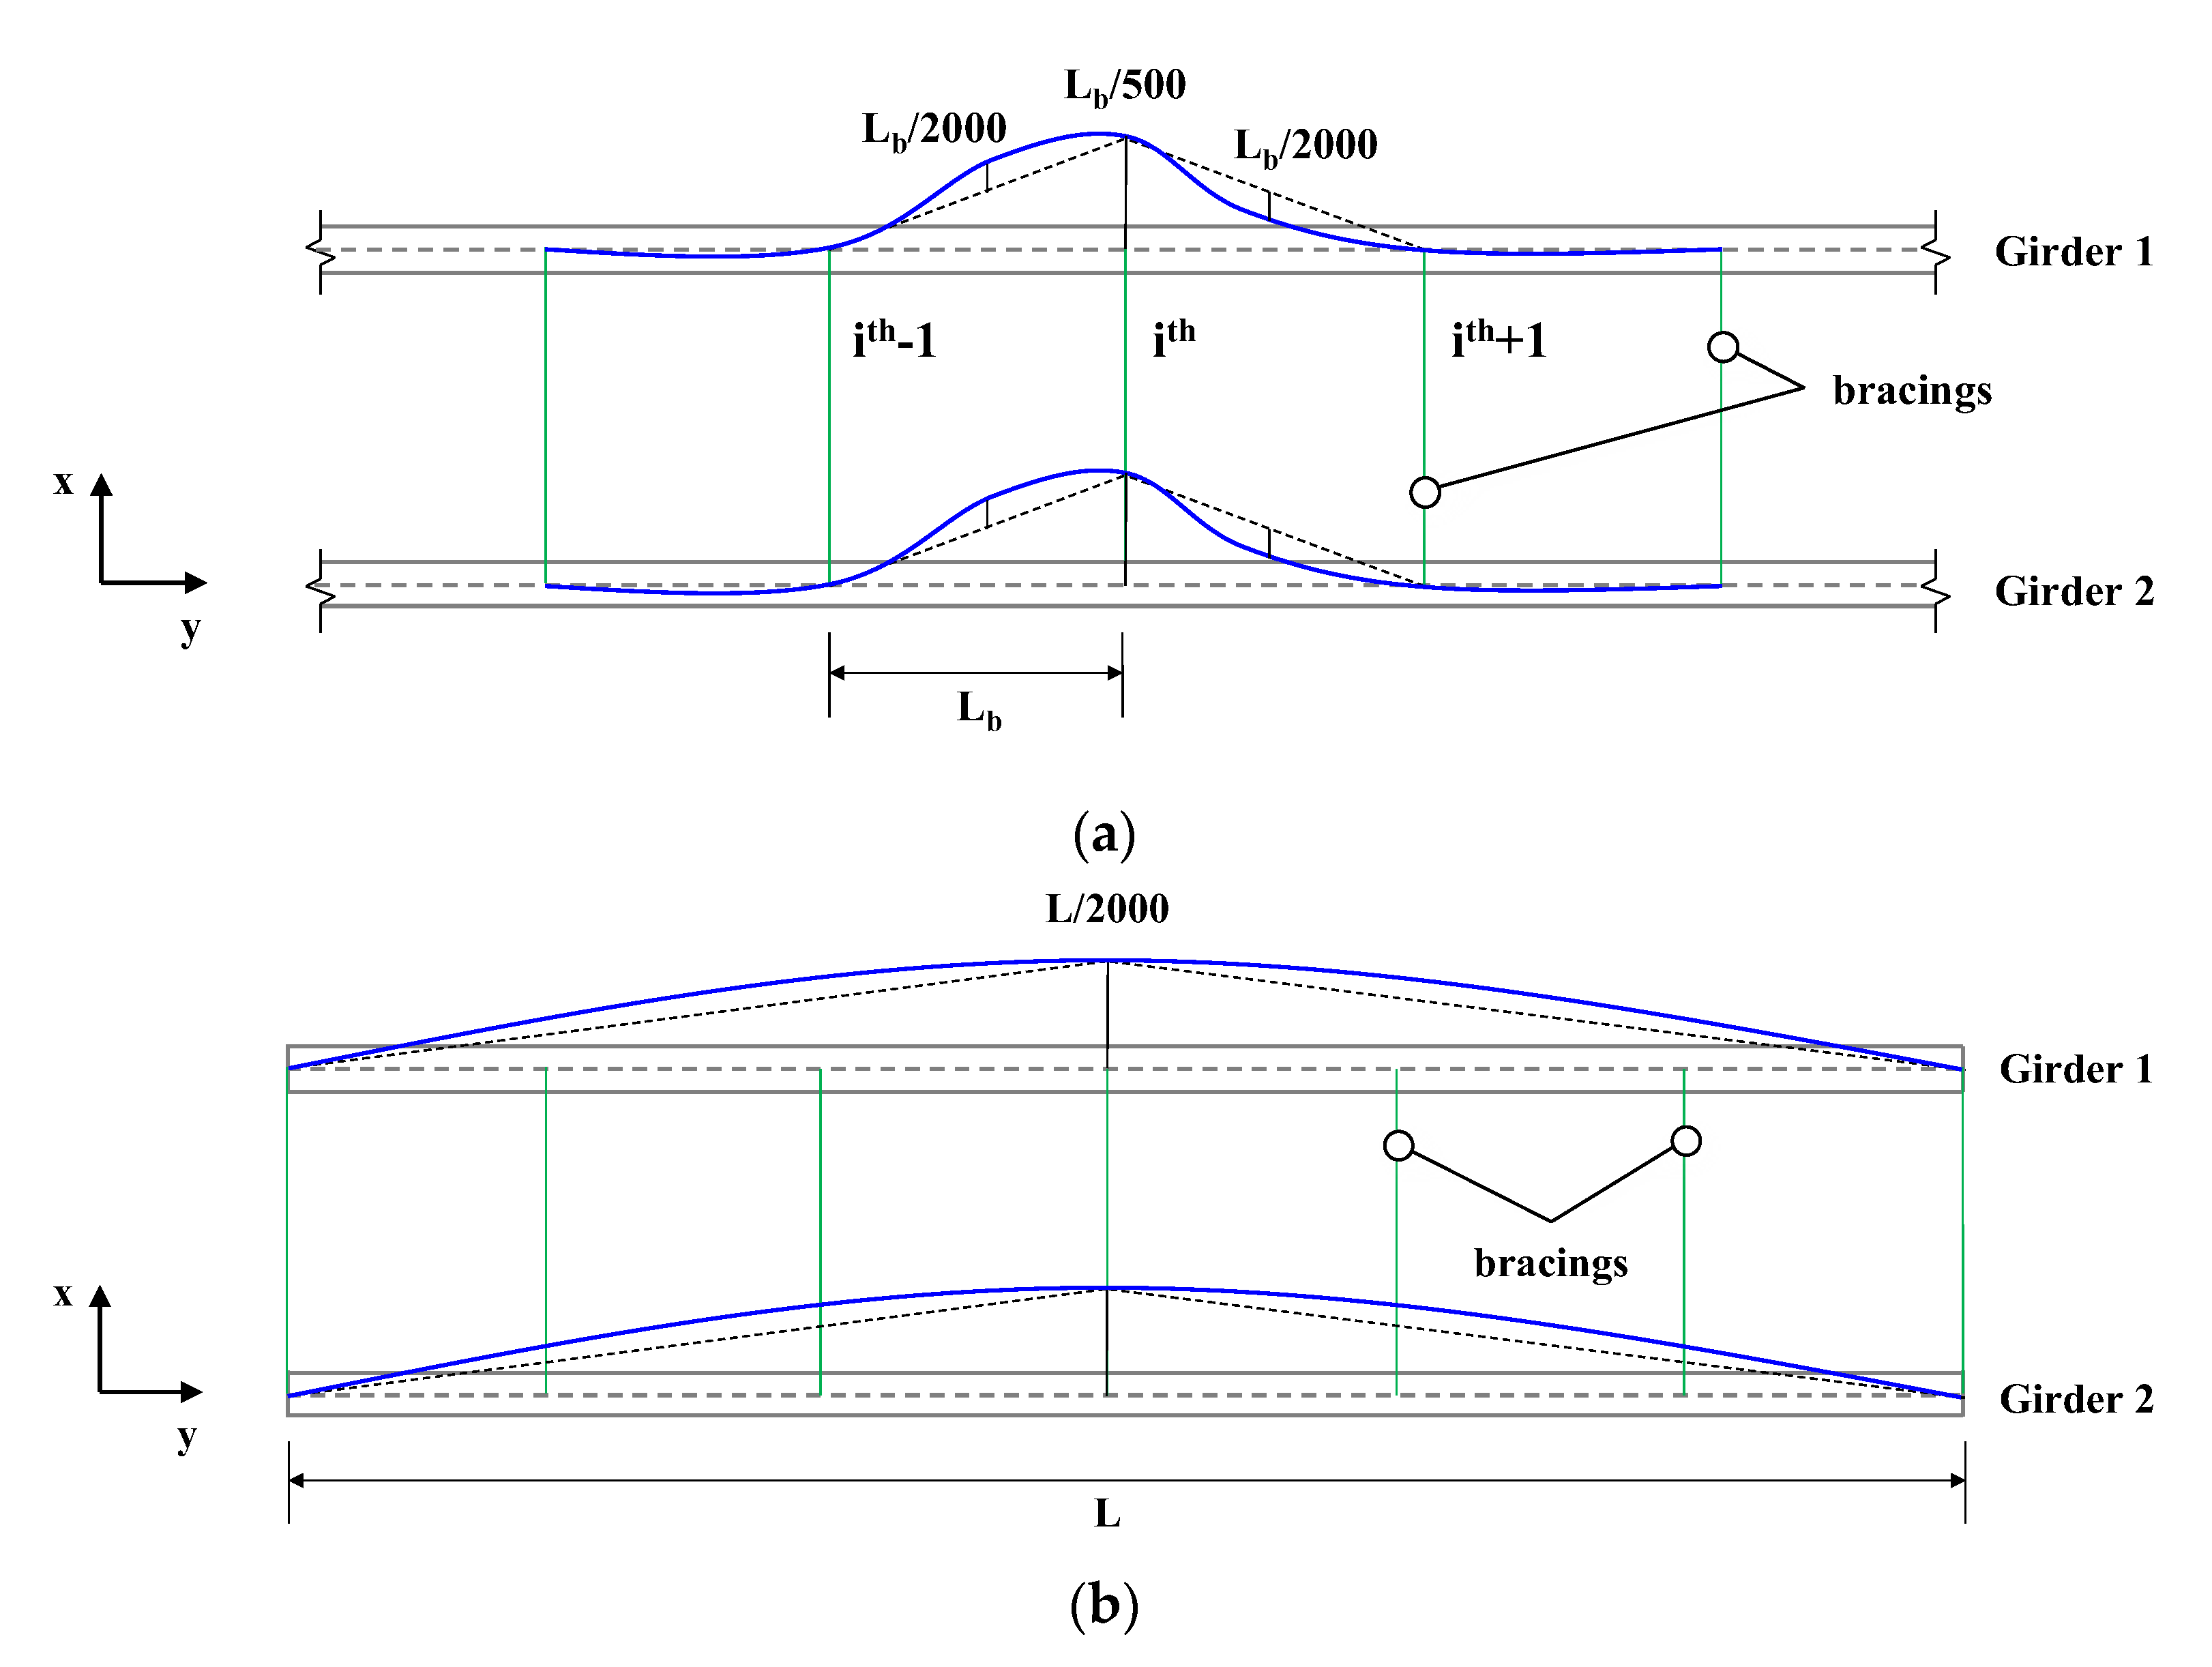
Based on an earlier report [8], the initial imperfection significantly influences the LTB behavior and internal forces produced in the torsional bracing. Furthermore, it was concluded that the critical imperfection acting on the brace locations is essential for estimating accurate bracing forces and realistic lateral torsional behavior in the steel-I girder bracing systems. In this study, initial imperfections of /500 are applied at the bracing locations of target segments of the FEA models that have the maximum bending moments. Furthermore, initial imperfections of /2000 and /2000 are applied at both target segments between the brace points and mid-span, as suggested in the previous study [8]. Thus, the three different imperfections obtained from three different static analyses were adopted in the FEA models for the geometrically nonlinear FEA simultaneously (see Figure 4). Moreover, it was applied at the upper flange locations near the target segments. The verification analysis for this study is provided in Appendix A.
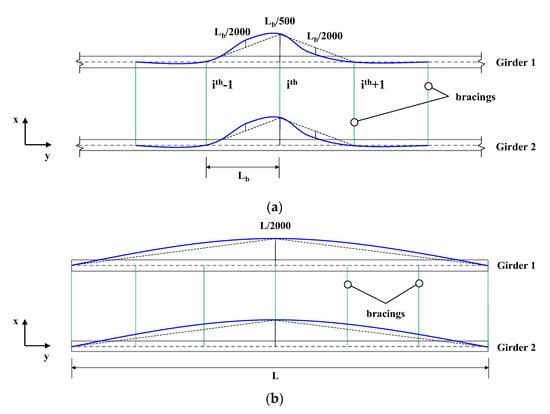
Figure 4.
Initial imperfections for FEA: (a) initial imperfection of target segments and (b) initial imperfection of the girders for global LTB mode.
Meanwhile, Yura [5] investigated total torsional bracings considering various effects produced by bracings, girders, and stiffeners for estimating the effective torsional bracing stiffness. Based on their research, the total bracing stiffness can be expressed as a series connection of each bracing stiffness, as shown in Equation (8).
where is the torsional stiffness of attached bracing members, is the strong axis stiffness of girder systems, and is the cross-section web stiffness.
For tension bracing systems, such as z-type bracing, can be determined using Equation (9) as follows:
Torsional stiffness induced by the contribution of the in-plane girder flexibility to the brace system is shown in Equation (10) as follows:
For special cases, when the torsional bracing is attached near both flanges or a vertical diaphragm element is approximately the same depth as the girder, then web distortion will be insignificant, and may be considered infinite.
3.3. Internal Forces in Bracing Elements
Figure 5 illustrates the internal forces acting on the brace element. As mentioned earlier, the torsional bracing members are secondary members in straight I-girder bracing systems. The internal forces of the bracing elements are totally induced by the LTB behavior of the I-girder bracing systems. Thus, the internal forces due to LTB were obtained from the FEA at the LTB strength limit state, as stipulated in AASHTO [22]. This means that the bracing forces, such as bracing moments and axial forces, were obtained when the applied loadings reached the LTB strength limits. The bracing moments can be obtained from a couple of forces at the locations where the bracings are attached to the girder sections. Because of vertical shear forces at each end of the torsional bracing, maximum and minimum torsional moments are produced. The maximum values are obtained from locations near the buckled girders and the minimum values are obtained at opposite ends, as shown in Figure 5. In addition to the torsional moments, lateral tensile forces also can be created in the torsional bracing. Therefore, the maximum and minimum torsional moments and lateral forces are obtained from the FEA. The internal forces can be obtained based on the calculation shown in Figure 5. Once we obtain each element force of the z-type bracings based on the FEA results, we can simply compute the axial forces () based on the equilibrium condition in the x direction by adding the axial forces at locations that are attached near the top and bottom flange sections of Girder 1 in Figure 5. By eliminating from the total axial forces near the top flanges, which is expressed as in Figure 5, we can compute the moments by multiplying the forces () and girder height () between the centroids of the top and bottom flange sections. Finally, each axial force acting near the bracing installation locations can be assumed, as indicated in Figure 5. The bracing force calculation processes were conducted for all bracing locations when the applied loadings reached the LTB strength. Subsequently, maximum bracing forces among all the bracing elements were obtained.
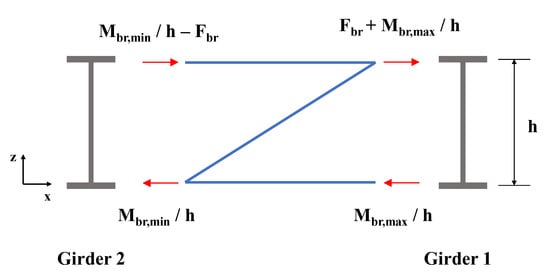
Figure 5.
Bracing moments and internal forces acting on bracing members.
4. FEA Data Construction
4.1. Database Construction
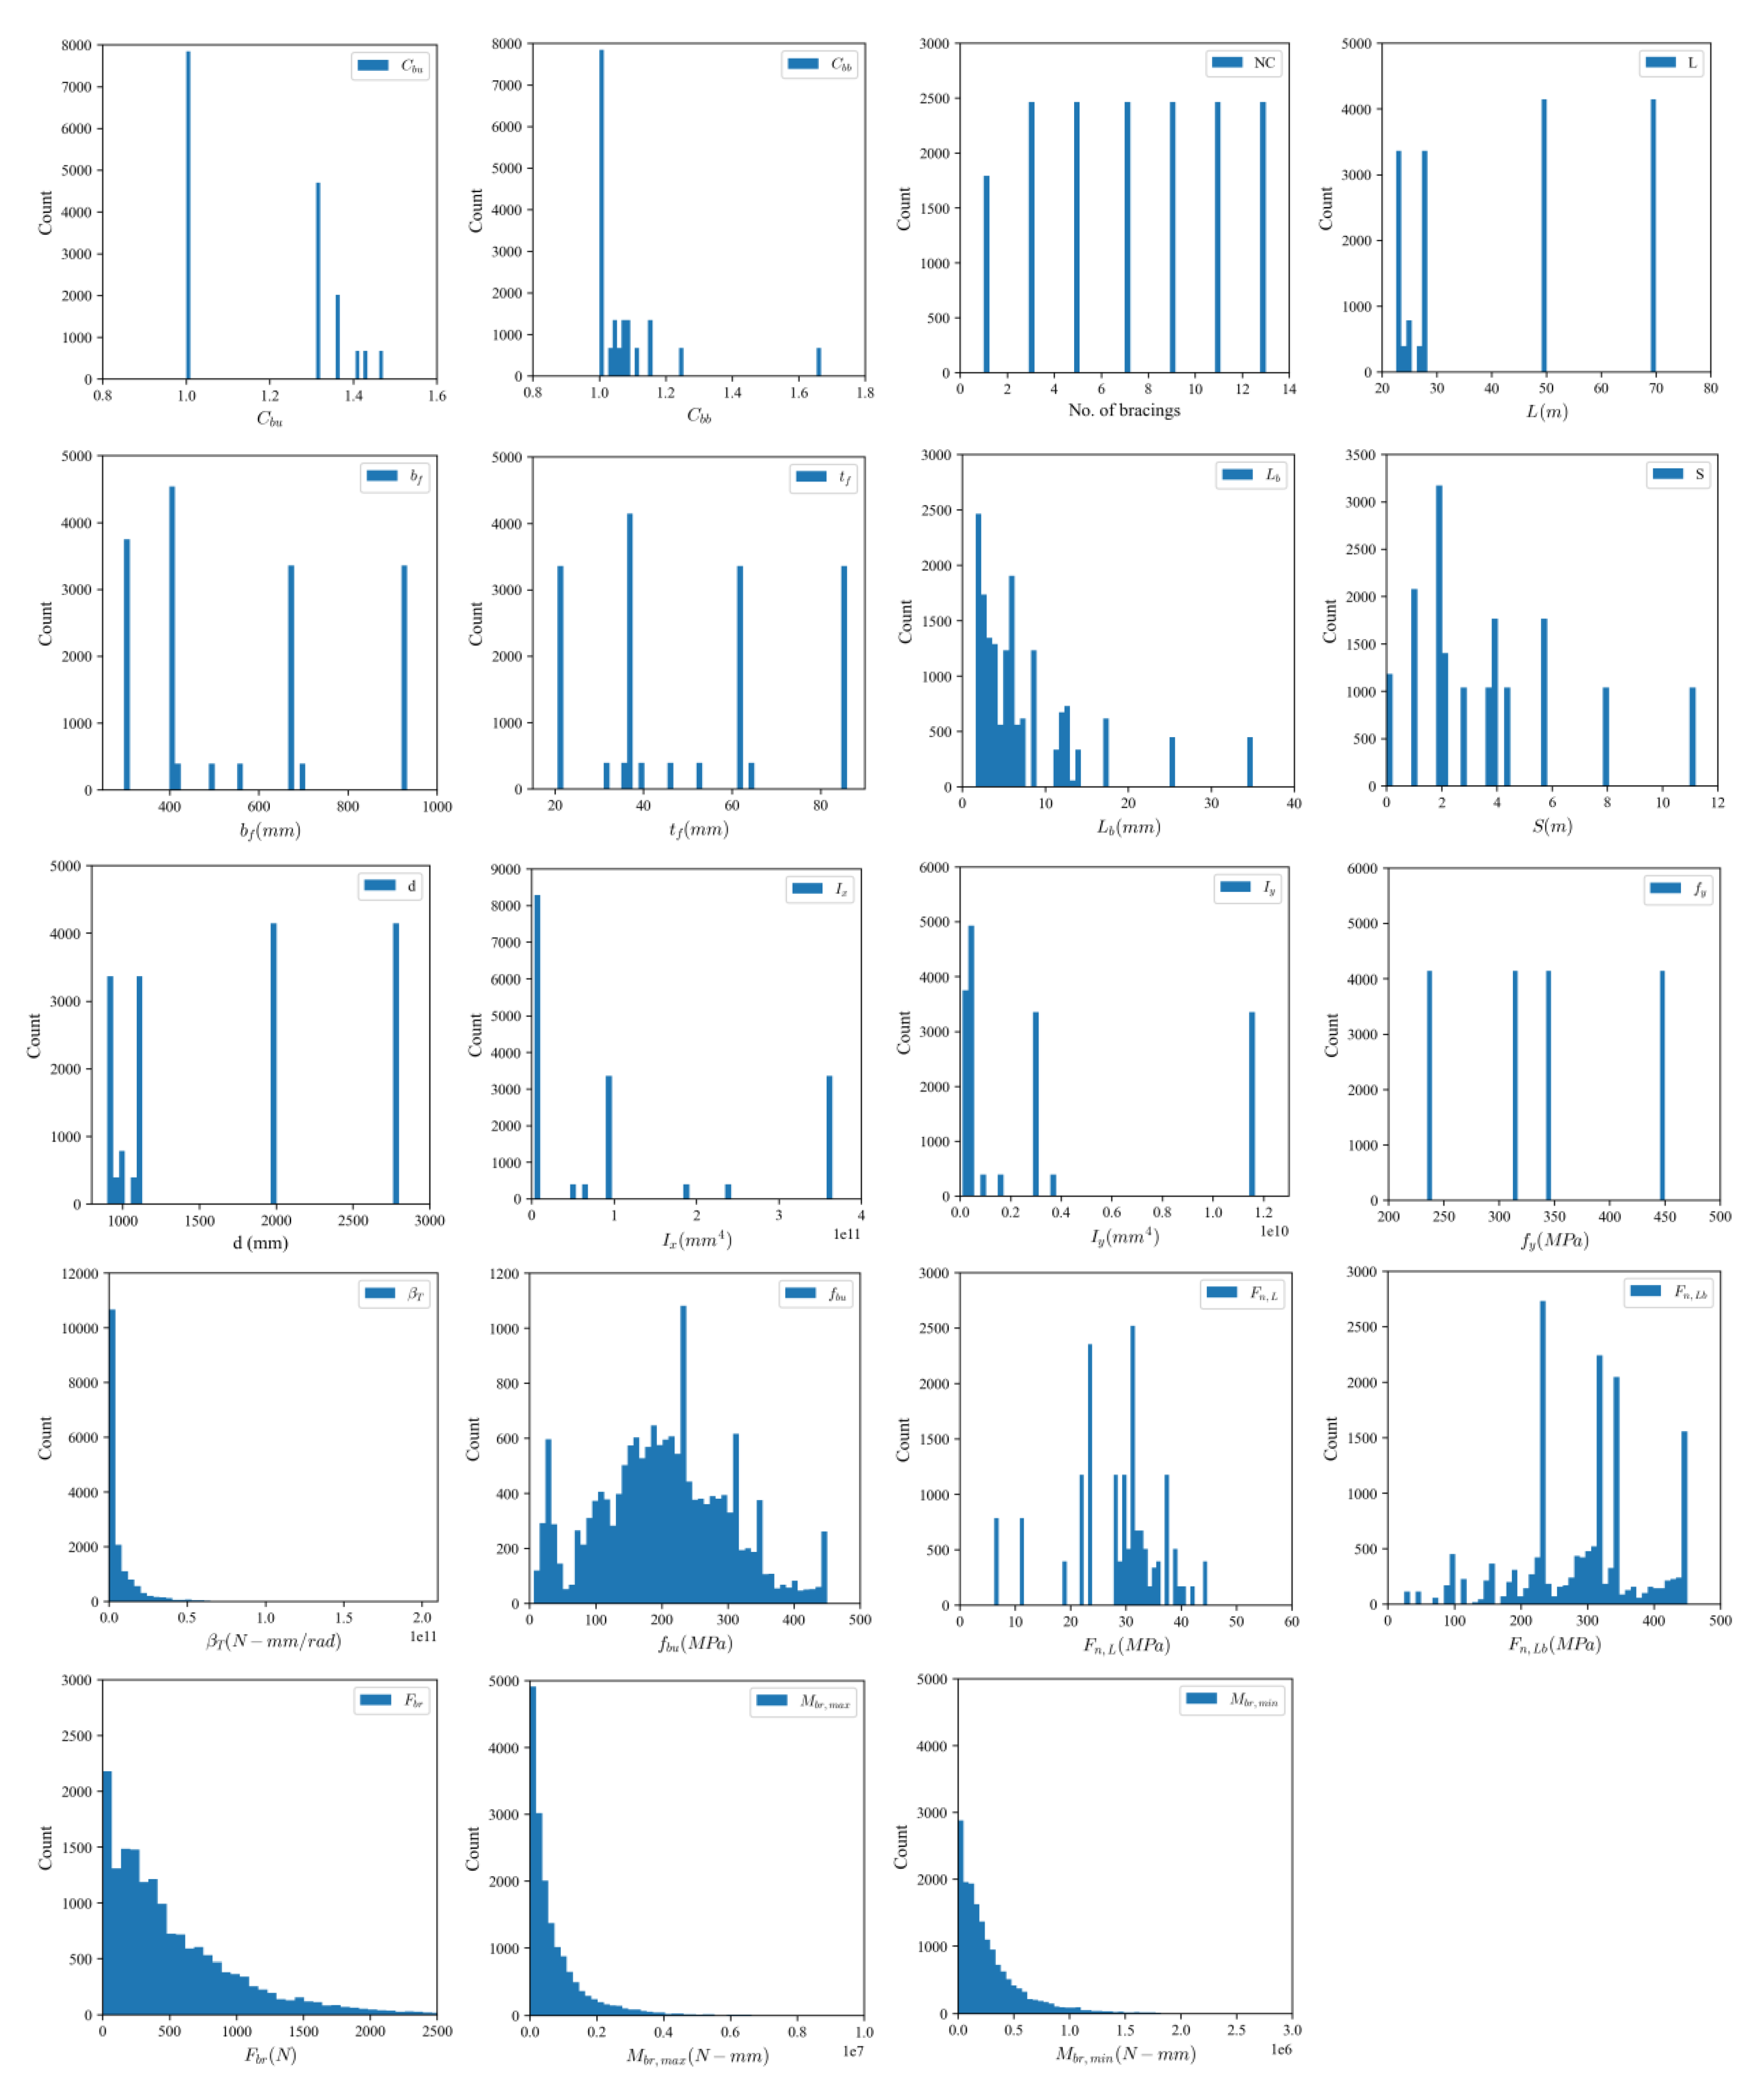
To construct structural response data from the geometrically nonlinear analysis with imperfection (GNIA), several main design parameters were considered in this study, including various cross-sections of the bridges, torsional bracing stiffness (), the number of bracings, the girder spacing to height ratio (), the moment gradient factor () within the brace points at target segments, the moment gradient factor () of the entire span, and the yield strength of structural steels (). Therefore, a total of 16,576 structural response data were constructed, as summarized in Table 4. This study uses 16 input variables, including the flange width (), flange thickness (), the height of the girder (), the moment of inertia about the strong axis (), the moment of inertia about the weak axis (), span length (), unbraced length (), number of bracings, bracing stiffness (), girder spacing (), moment gradient factors (), the flexural strength of the bracing system (), the yielding strength of structural steels (), the LTB strength of braced segments (), and the LTB strength of nonbraced girders (), whereas the maximum and minimum bracing moments () and bracing force () are the target variables. In addition, a detailed statistical analysis of the database, including the min, max, mean, median, variation (var), standard deviation (std), and skewness of variables, is presented in Table 5 for input variables and Table 6 for output variables. Finally, the histograms of the input and output variables used in this study are plotted in Figure 6.
Table 4.
Number of structural response data based on major design parameters.
Table 5.
Ranges of design parameters for input parameters used in this study.
Table 6.
Ranges of design parameters for output parameters used in this study.
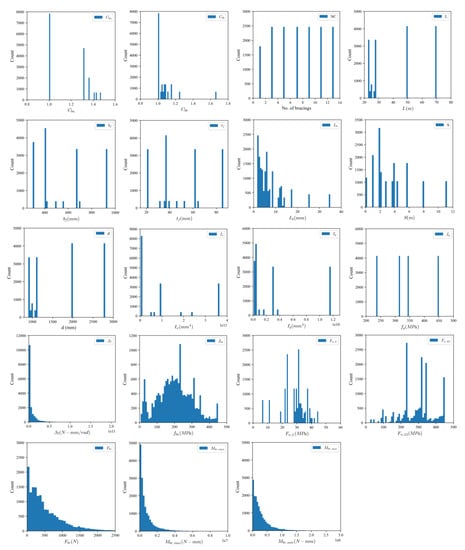
Figure 6.
Histograms of input and output variables used in training.
4.2. Comparisons of Bracing Moments () Using FEA and Design Provision
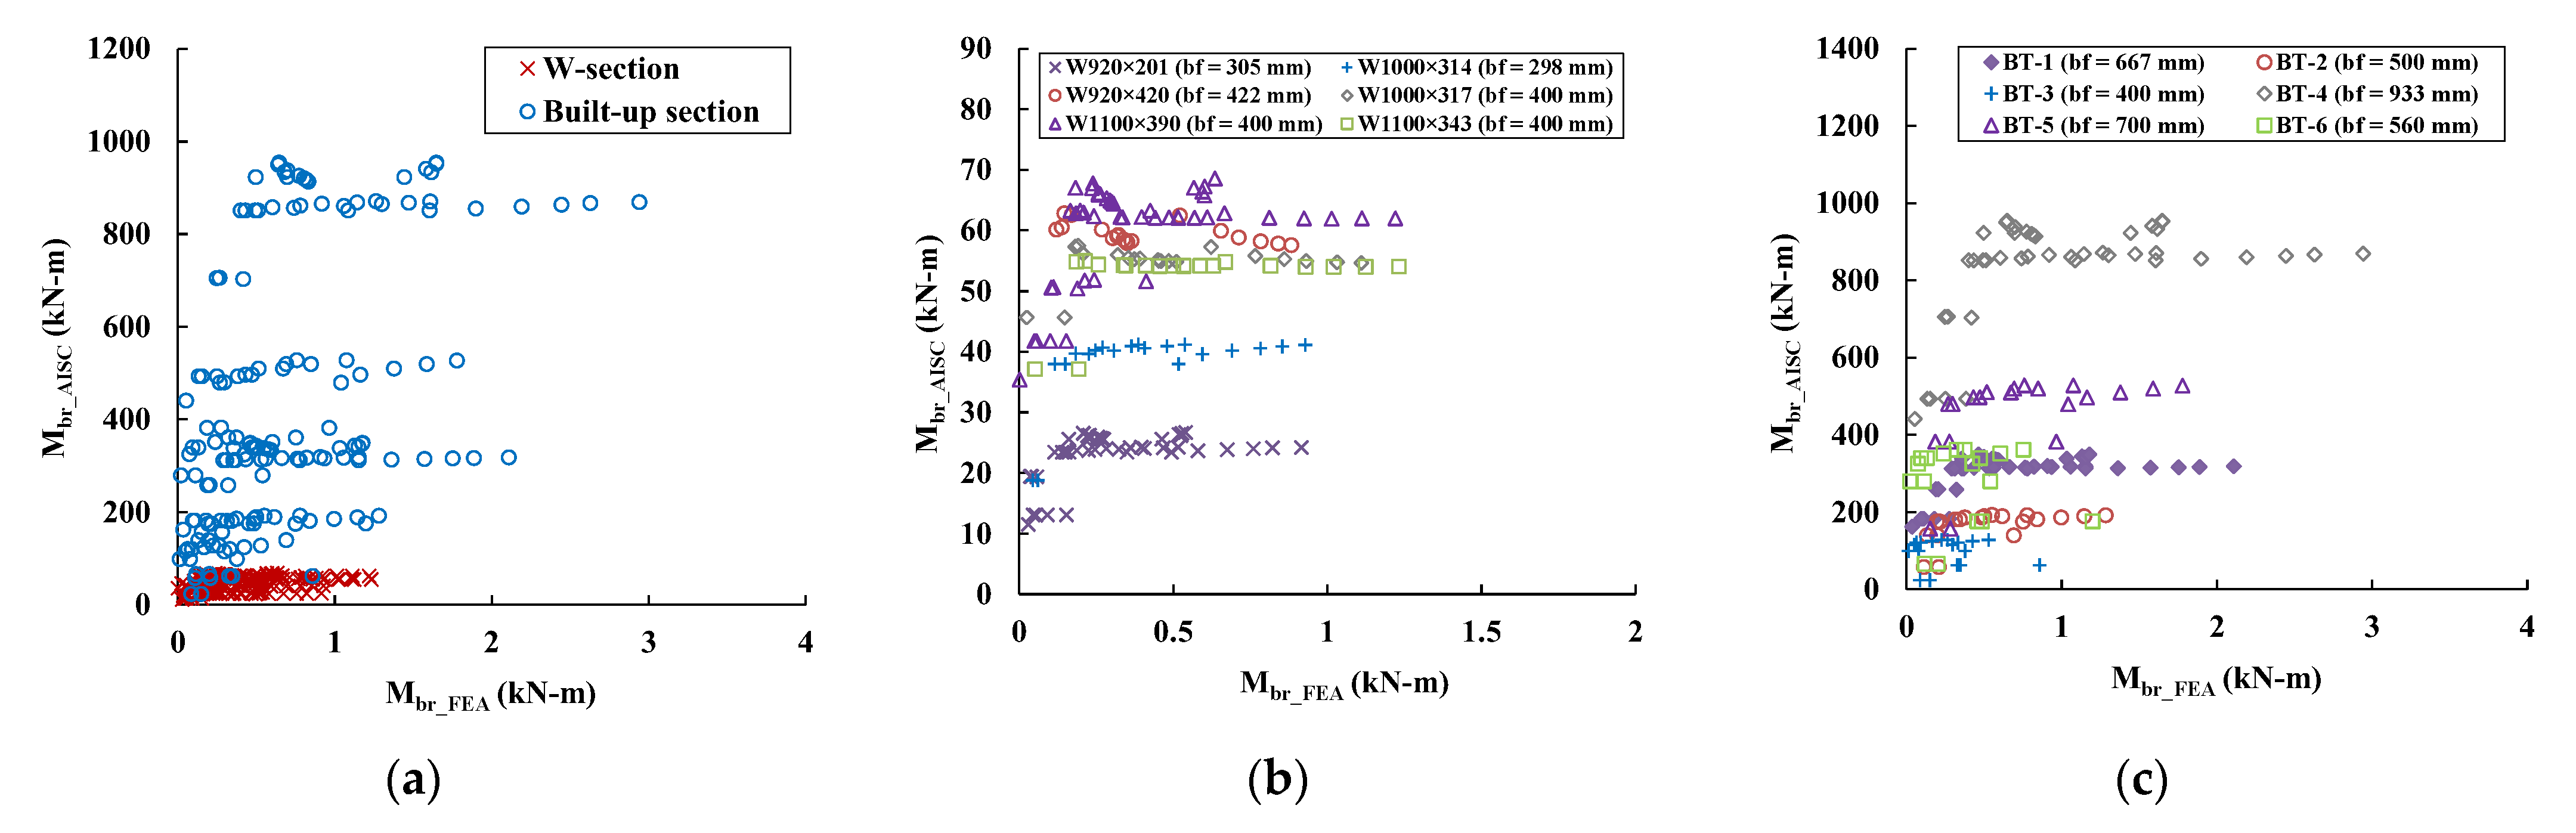
In design, torsional bracing elements are classified as secondary structural components in straight steel I-bridges. This implies that the bracing forces are generated as secondary forces in the bracing elements. The bracing forces are mostly influenced by the LTB behavior that generates lateral and rotational deformation at the compression flange sections. The brace forces acting on the torsional bracing elements are conservatively assumed to be the required torsional stiffness multiplied by the assumed rotational deformation of the torsional bracings, as given by Equation (4). In this study, the maximum bracing moments () obtained from FEA were compared with those of the design equation, as plotted in Figure 7. In Equation (3), the coefficient 2.4 is twice that of the coefficient of load height (), facilitating a conservative design. Therefore, in this study, the coefficient 2.4 is excluded from this comparison, because all FEA models are subjected to concentrated loading on the center of the cross-sections.
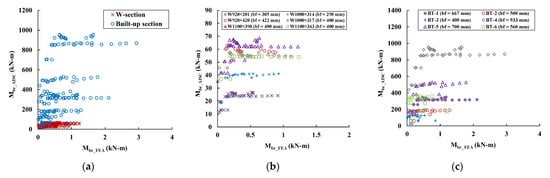
Figure 7.
Comparisons between bracing moments of design provision and FEA: (a) cross-section types; (b) W-sections; and (c) built-up sections.
The comparison revealed that Equation (3) provided conservative design values for both the W-section and the built-up section, as shown in Figure 7a. In particular, the design bracing moment of built-up sections has higher design values than those of the W-sections. Furthermore, for the W-sections, sections with wider flanges, such as W920 420, W1000 317, W1100 390, and W1100 343, have considerably more conservative bracing moments by AISC compared to W920 201 and W1000 314, which have a relatively small flange width compared to other sections. Similar aspects are observed in built-up sections. BT-4 and BT-5 have higher design values than other sections that have smaller flange widths. Thus, it can be concluded that the design bracing moments computed by AISC provide conservative design values when it has wide flange sections, compared to flange sections with a smaller flange width. This assumption, i.e., that the flange width has significant effects on the bracing moment, may explain the reason that the built-up sections (BT-1 to BT-6) of bracing moments are greater than those of the W-sections, which have smaller flange widths.
5. Deep Neural Network Framework
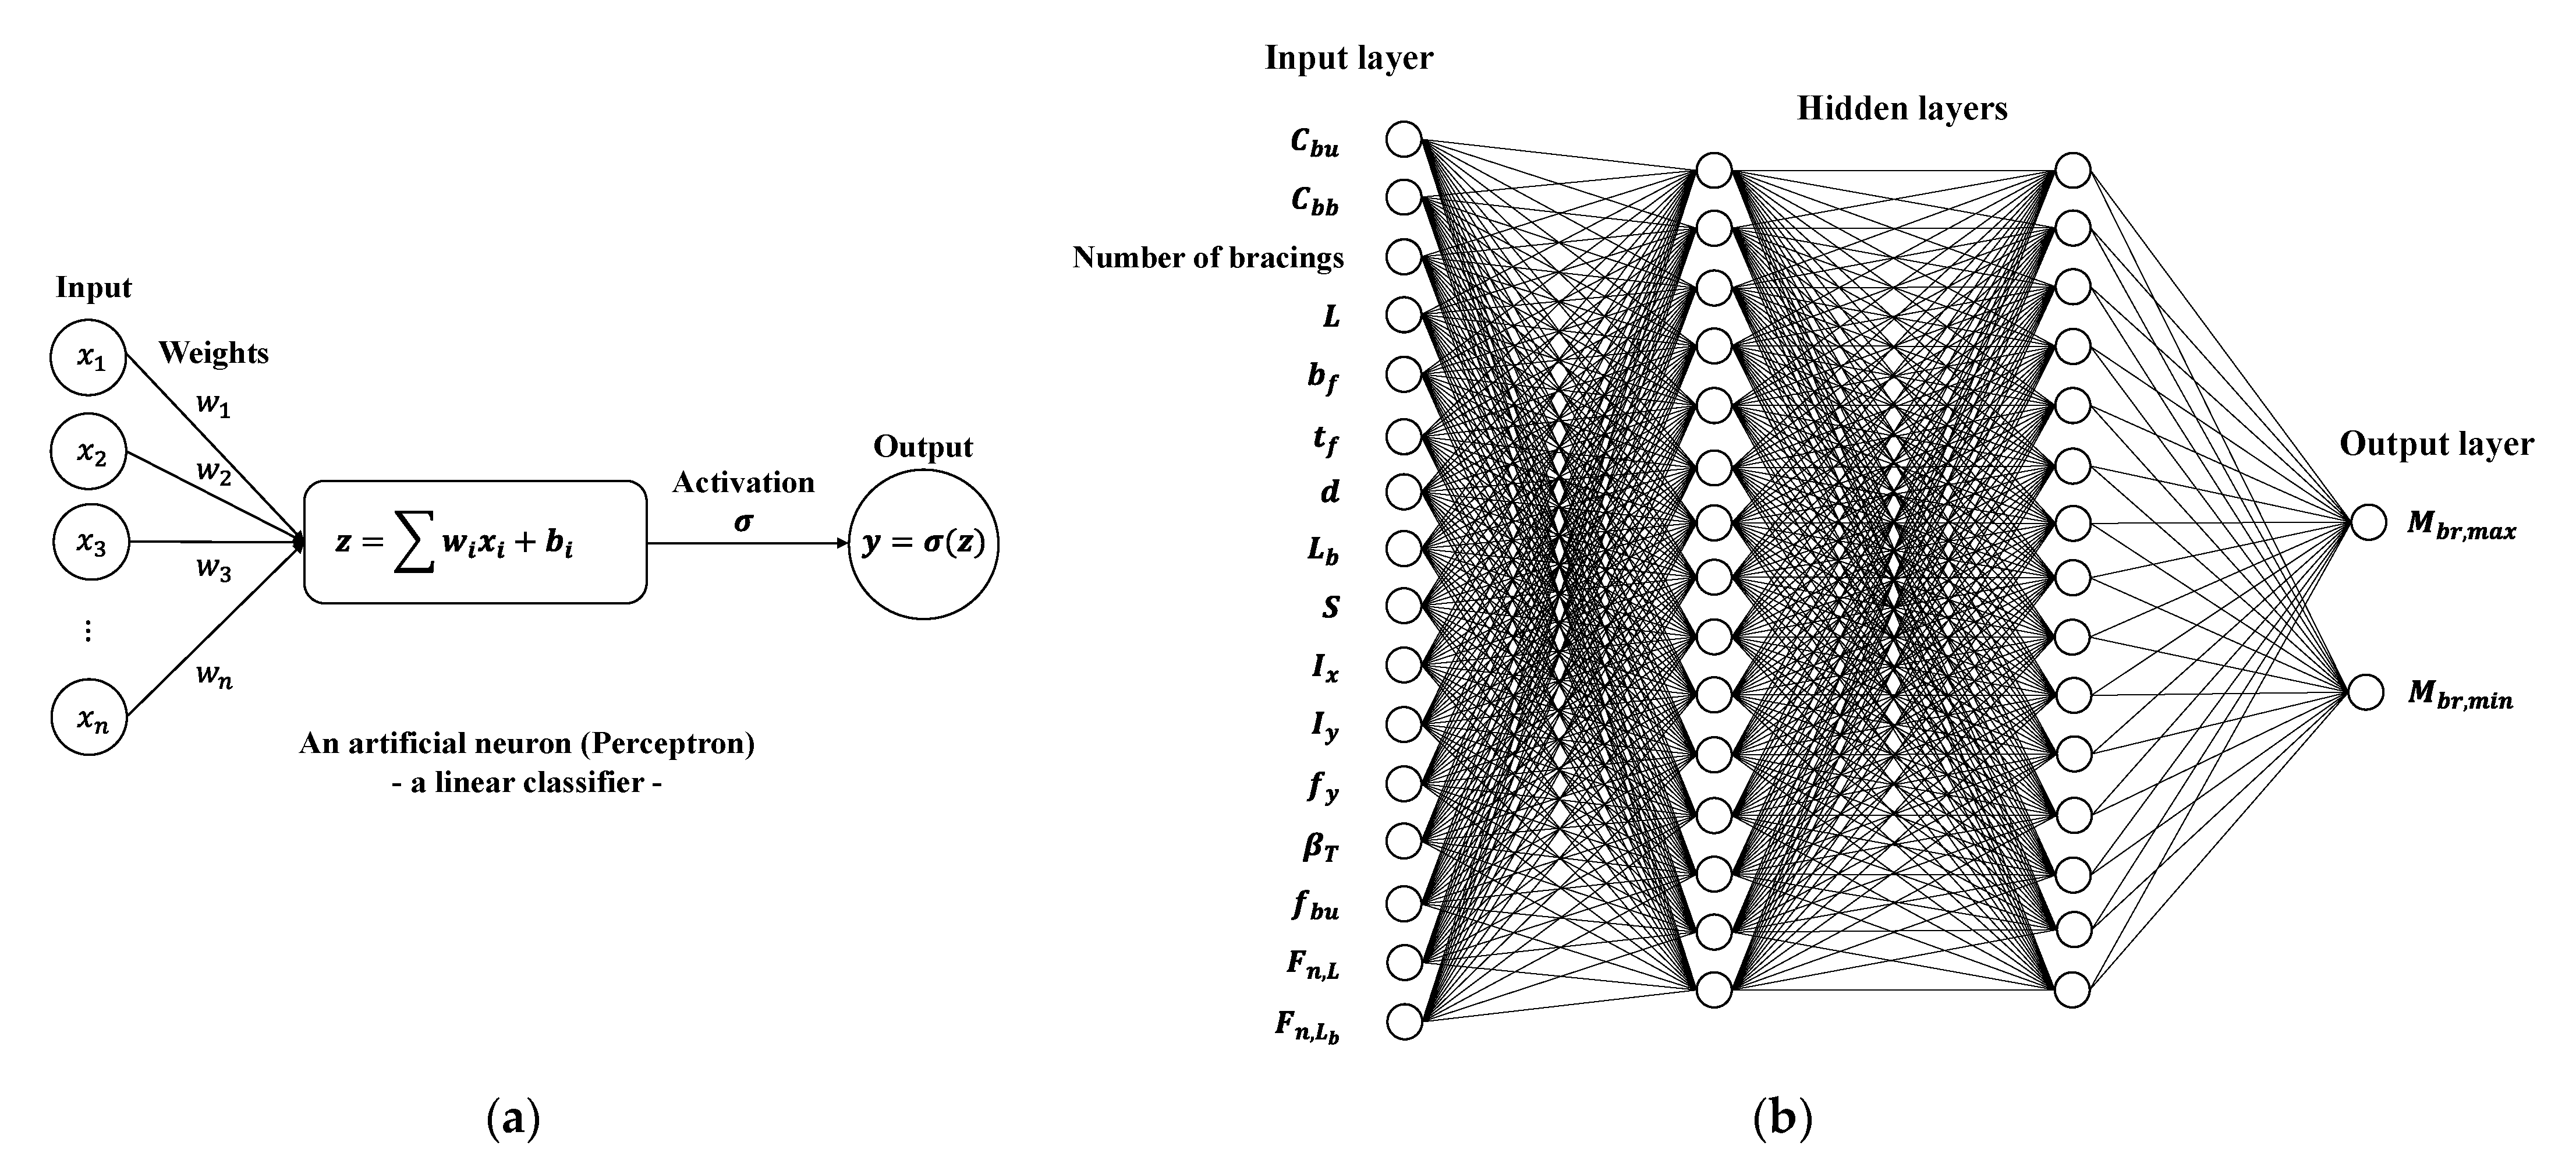
An ANN is a type of mathematical model that resembles the biological characteristics of the human brain. It has numerous artificial neurons in input, output, and hidden layers, which are fully connected. In this study, the DNN algorithm, which has multiple hidden layers (minimum two or above), was employed. The DNN is a type of ANN with several hidden layers between the input and the output layers, whereas the ANN model has one hidden layer. It contains multiple neurons (or nodes) arranged in the input, hidden, and output layers. All the neurons at each layer are fully connected and the information flows in one direction from the input layer to the output layer through the hidden layers. Recently, neural networks have been widely used to model complex nonlinear relationships that cannot be solved deterministically using traditional mathematical models.
In the general structure of an ANN or DNN, the neurons in the layers are linked through weights and bias, as illustrated in Figure 8a,b and in Equation (11). The accuracy of ANN or DNN models depends on the accuracy of the weights and bias, which are updated by a backpropagation process. The input vector of the neuron is and the weighted sum of the input () is expressed as in Equation (11).
where is a weighted sum of the input; is the weight, which is equal to , and is the bias.

Figure 8.
Neural network structures: (a) a typical artificial neural network and (b) an example of the deep neural network structure used in this study.
The weighted sum of the input () is converted into y in Equation (12), in which is an activation value obtained through an activation function.
The activation function is the essential element during training for deep neural networks. In this study, ReLU functions were used, as shown in Equation (13). In the ReLU activation function,
In the neural network algorithms, the weights of each link between neurons at each layer are initially assumed with arbitrary values, and then they are adjusted during the training process, which is called backpropagation. The results of the training are evaluated by loss functions, such as MSE or other error estimation functions, by evaluating actual and predicted values. These evaluation processes are so-called epochs.
To implement the training process using the DNN algorithm and provide accurate prediction models, Python and TensorFlow were used in all process steps. In this study, DNN models are developed for predicting bracing moments and forces in torsional bracing steel I-girder systems, using a database of 16,576 samples, as shown in Table 4. The database is divided into two parts, which comprise 80% for training and 20% for testing. Furthermore, the training sets include 25% for validation to evaluate the accuracy of the prediction models. The best prediction models can be determined by a parametric study of the hyperparameters. The hyperparameters are parameters used in DNN algorithms affecting the accuracy of the prediction models. Table 7 shows the range of the hyperparameters used in the DNN algorithm.
Table 7.
Range of the hyperparameters used in DNN models in this study.
In this study, we use 16 input neurons, and one and two neurons in the output layer for and predictions, respectively. To evaluate the accuracy of the prediction models, this study included a parametric study on the number of hidden layers and the number of neurons at each hidden layer. The number of neurons at each hidden layer ranges from 50 to 200 with three to five hidden layers. The MSE is used as a loss function to evaluate the accuracy of the weights in the neural network. Furthermore, an ADAM optimizer was used for fast training to determine the global minimum of the loss function, and the learning rate was set as 0.001. The hyperparameters used in this study are summarized in Table 7.
The four statistical criteria used to evaluate the accuracy of the prediction models included , RMSE, MSE, and MAE. The is the most frequently used criterion to compare prediction and target values. An close to 1 represents perfectly accurate values. RMSE, MSE, and MAE values close to 0 represent accurate predictions in typical statistical and machine learning models. The statistical criteria used in this study are summarized in Table 8. In Table 8, is the number of samples, is the actual value, is the predicted value, and is the average real value.
Table 8.
Statistical criteria to evaluate the accuracy of DNN models.
5.1. Evaluation of Proposed DNN Models
In this section, DNN models with three, four, and five hidden layers with different numbers of neurons ranging from 50 to 200 are evaluated using 50–200 epochs. In these models, MSE was used as a loss function to evaluate the accuracy of the prediction models. The prediction DNN models were evaluated by the performance criteria mentioned in Table 8.
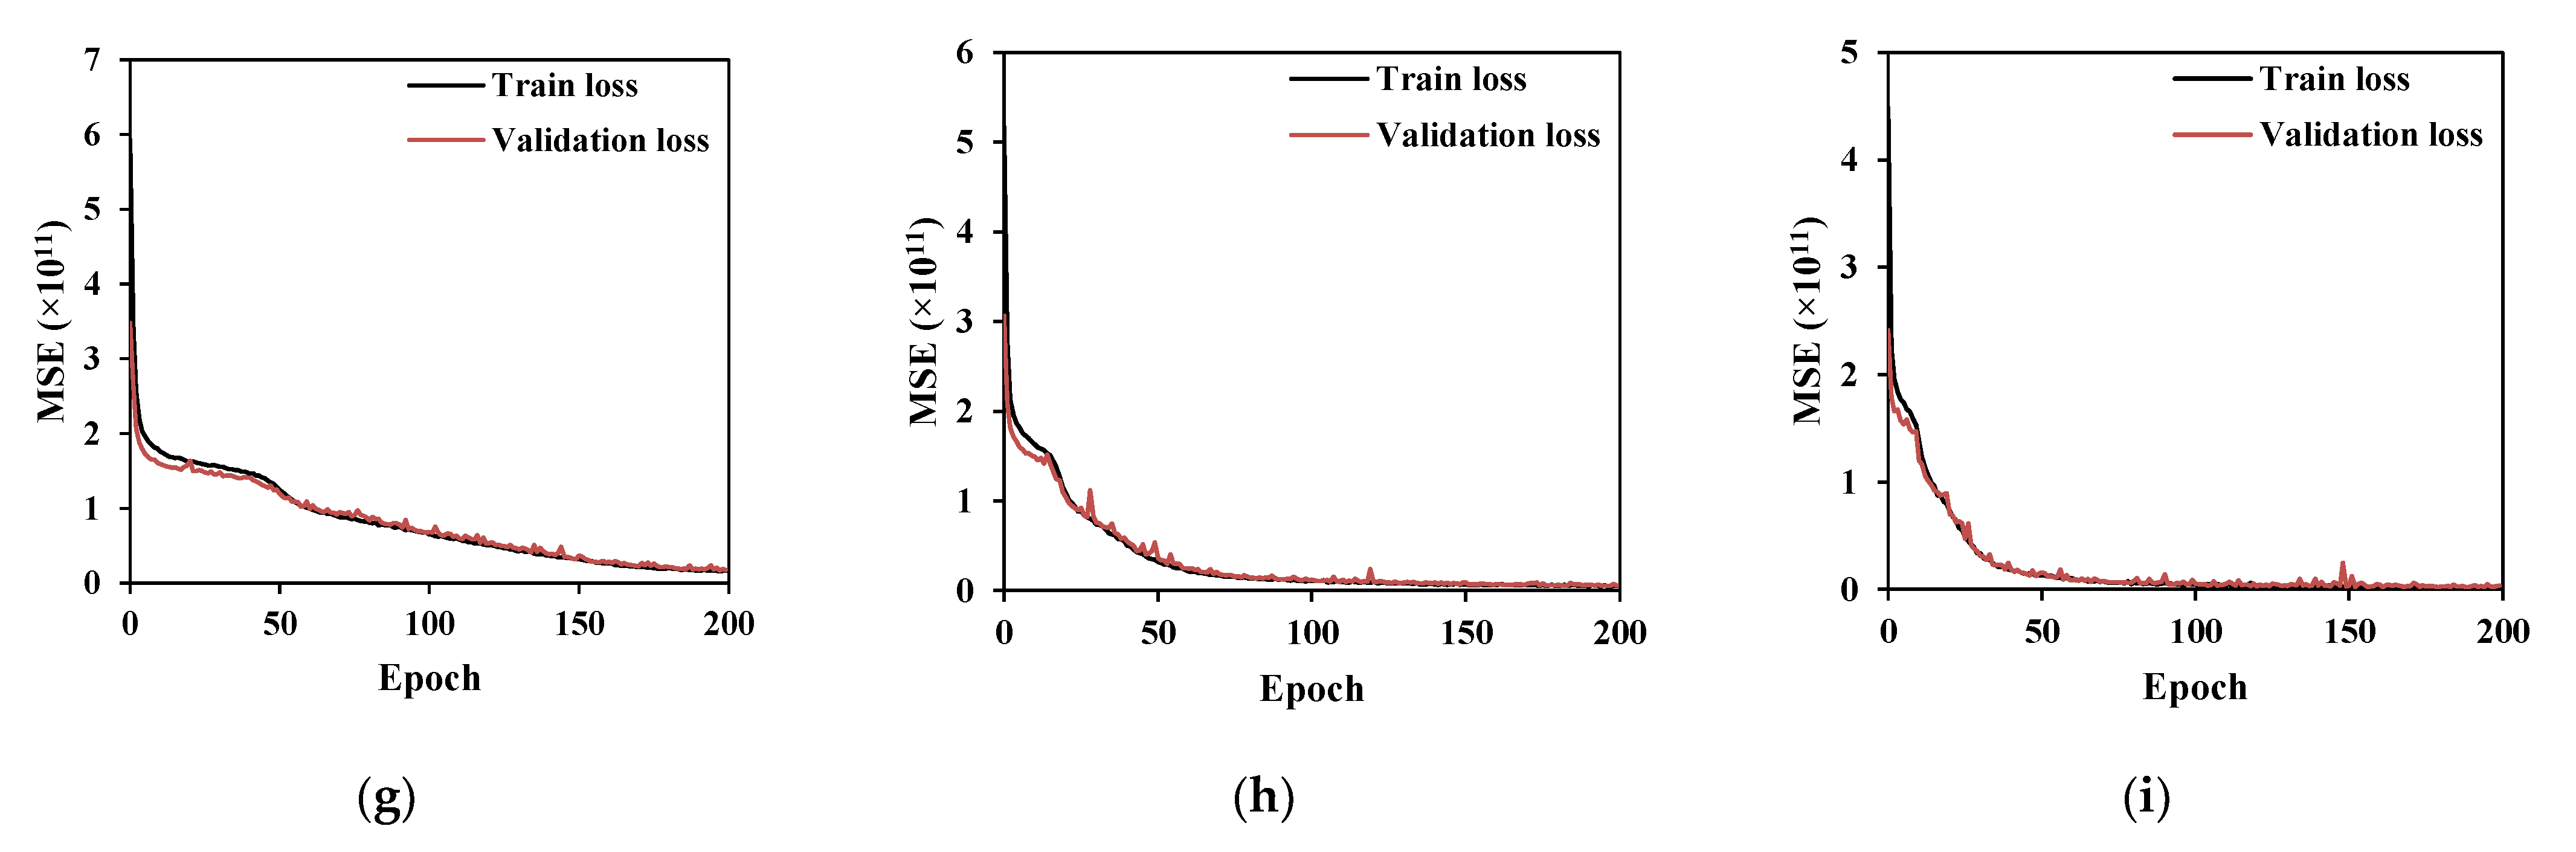
5.1.1. Estimation of Bracing Moment ()
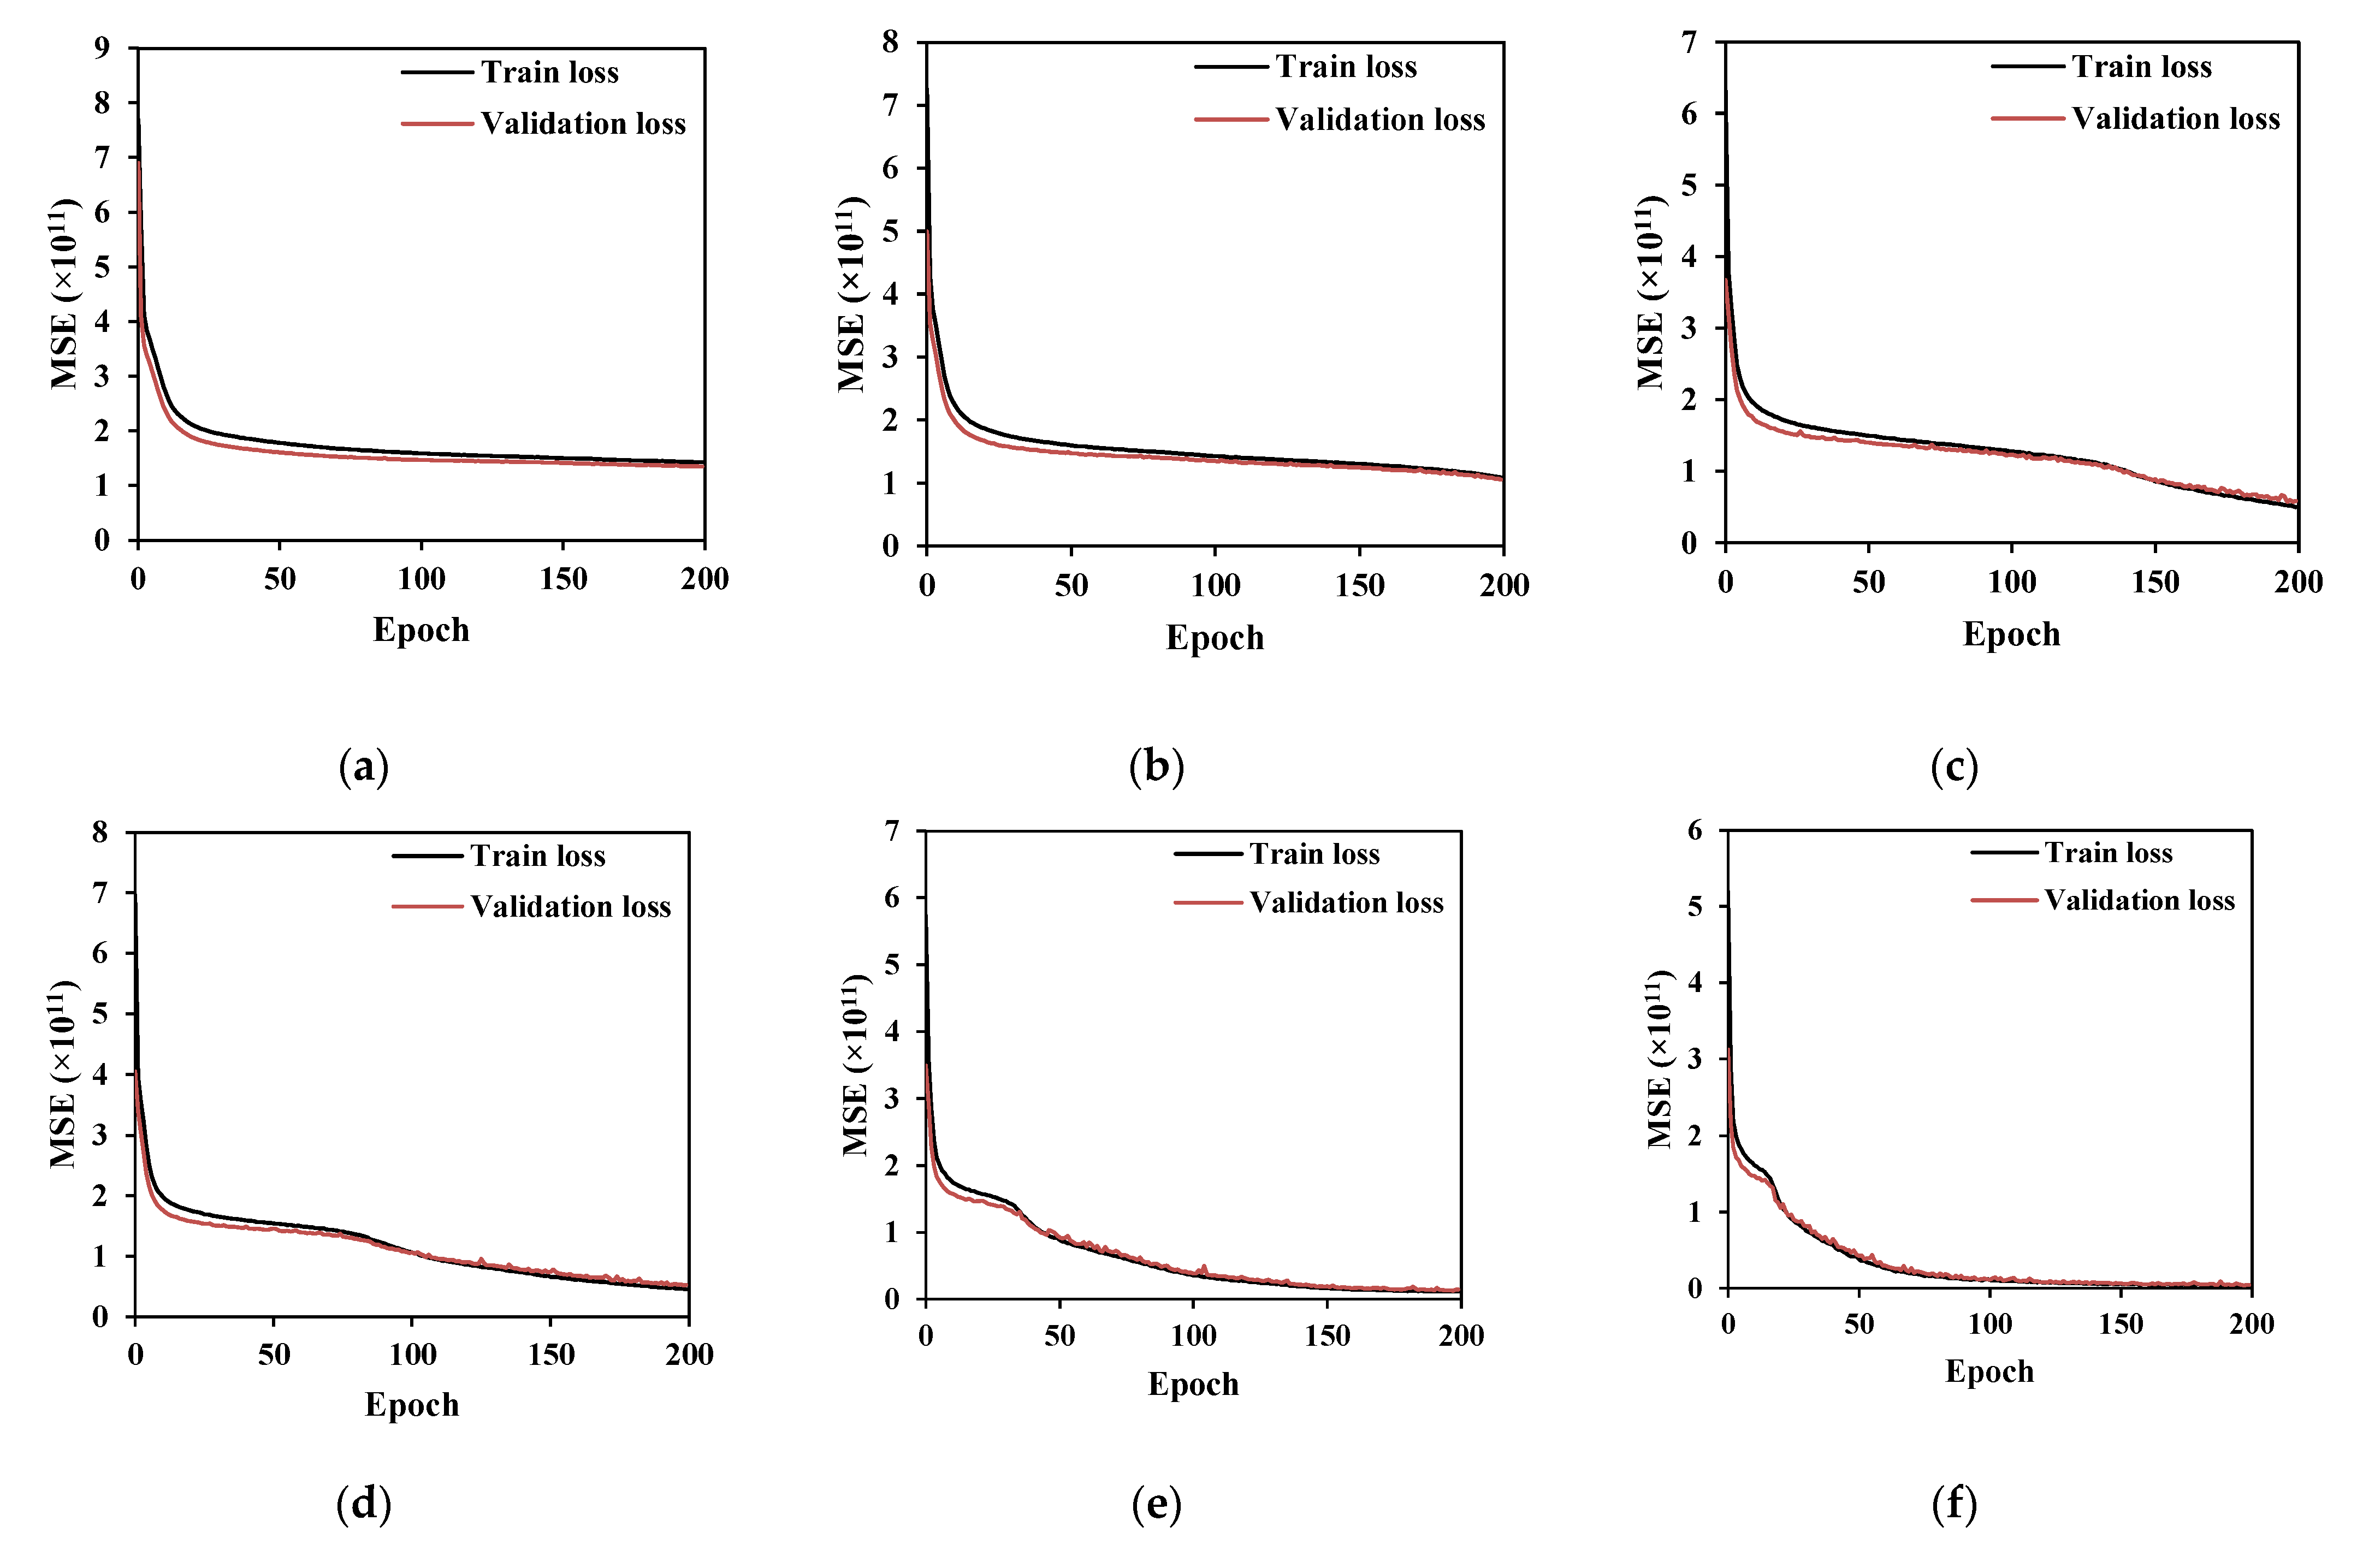
Figure 9 shows comparisons of the training and validation loss with respect to the MSE between predicted and FEA values. As indicated in Figure 9, the accuracy of the DNN models is considerably influenced by the number of hidden layers, neurons, and epochs. The results indicate that DNNs with three hidden layers need at least 150 epochs to achieve reasonable MSE estimations, while those with four and five hidden layers need 100 epochs when the number of neurons in the hidden layers is 100 or 200. In addition, the prediction results of the test sets were also compared using various performance criteria, as summarized in Table 9. Based on the comparisons, H5N200E200, which is a DNN model with five hidden layers, 200 neurons, and 200 epochs, exhibited optimal prediction results. In this model, the performance values in terms of the coefficient of determination are 0.993 for and 0.99 for predictions. It achieved the minimum values for RMSE, MSE, and MAE, respectively.
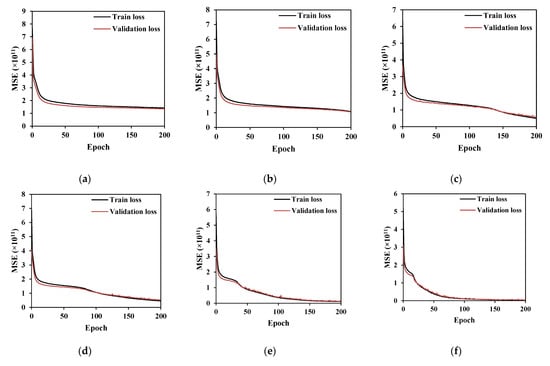
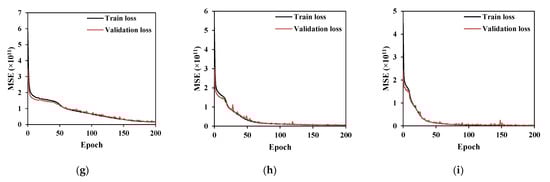
Figure 9.
Comparisons of training and validation loss of bracing moments (): (a) 3-50-200; (b) 3-100-200; (c) 3-200-200; (d) 4-50-200; (e) 4-100-200; (f) 4-200-200; (g) 5-50-200; (h) 5-100-200; and (i) 5-200-200 (in which 3-50-200 means a DNN model with three hidden layers, 50 neurons for each hidden layer, and 200 epochs).
Table 9.
Accuracy of DNN models for using various performance criteria.
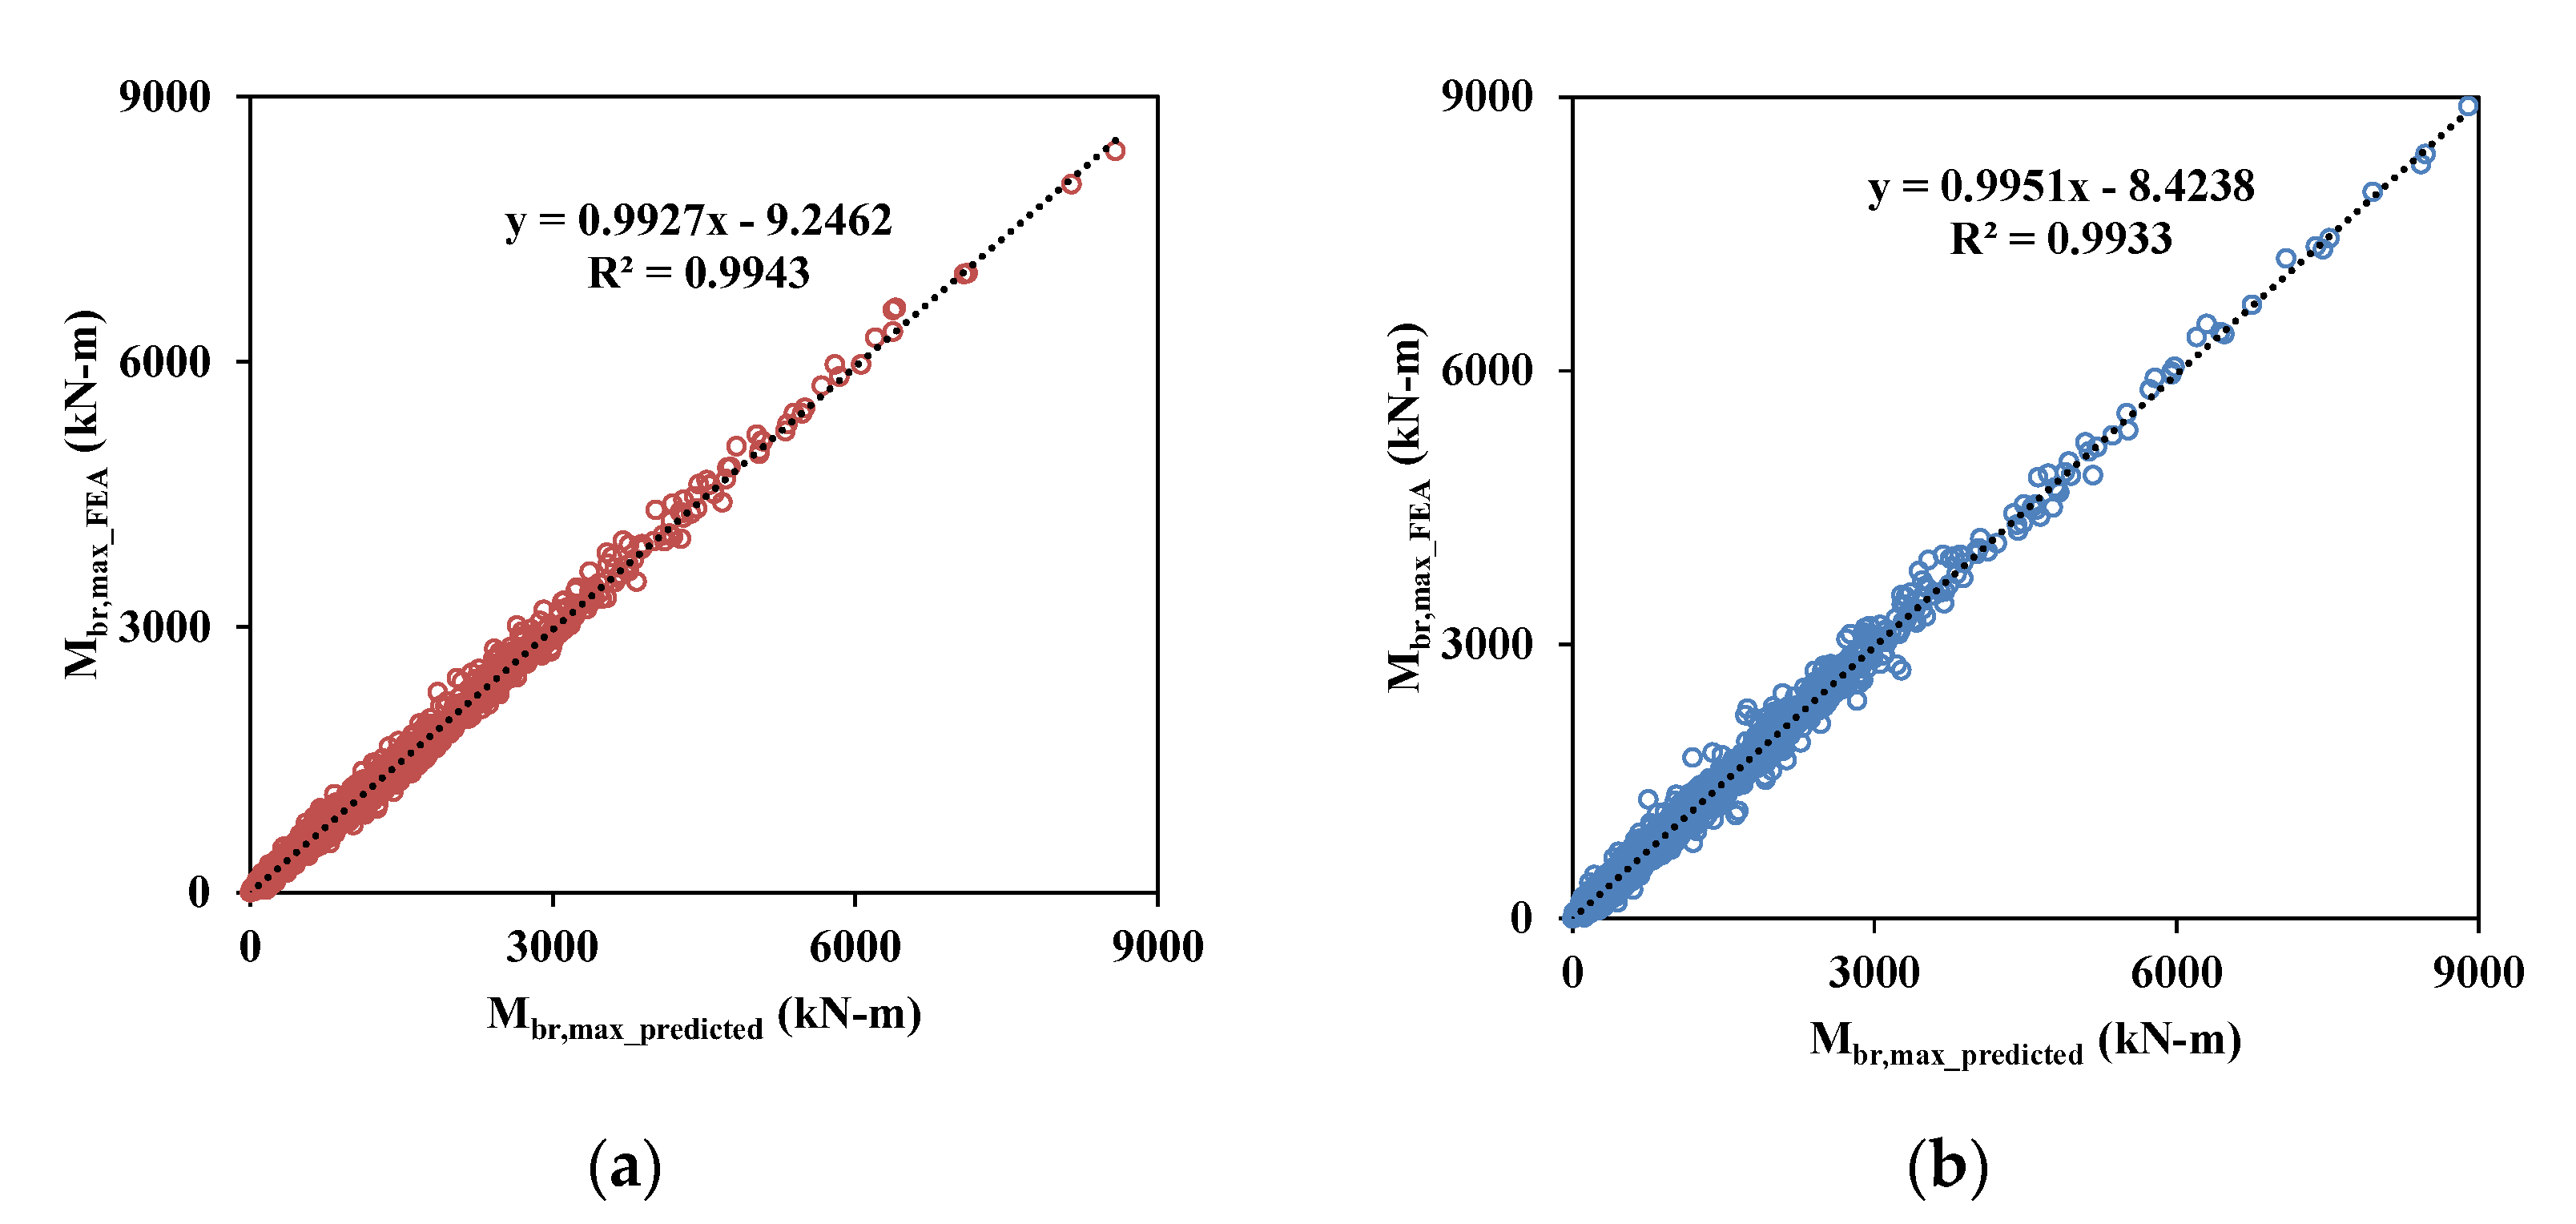
Figure 10 and Figure 11 show a comparison of the predicted bracing moments (, ) and FEA results, which are the training and validation data used in this study. For all cases, the prediction values show good correlations with the FEA results.
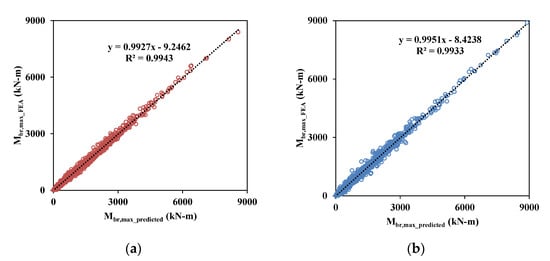
Figure 10.
Comparisons of predicted maximum bracing moments () of training and validation data sets: (a) training data and (b) test data.
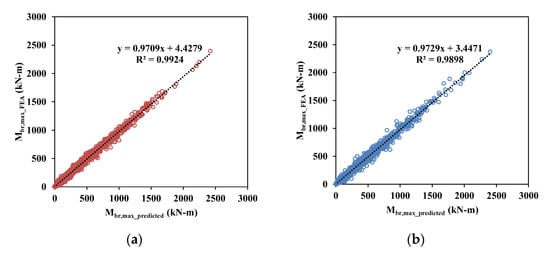
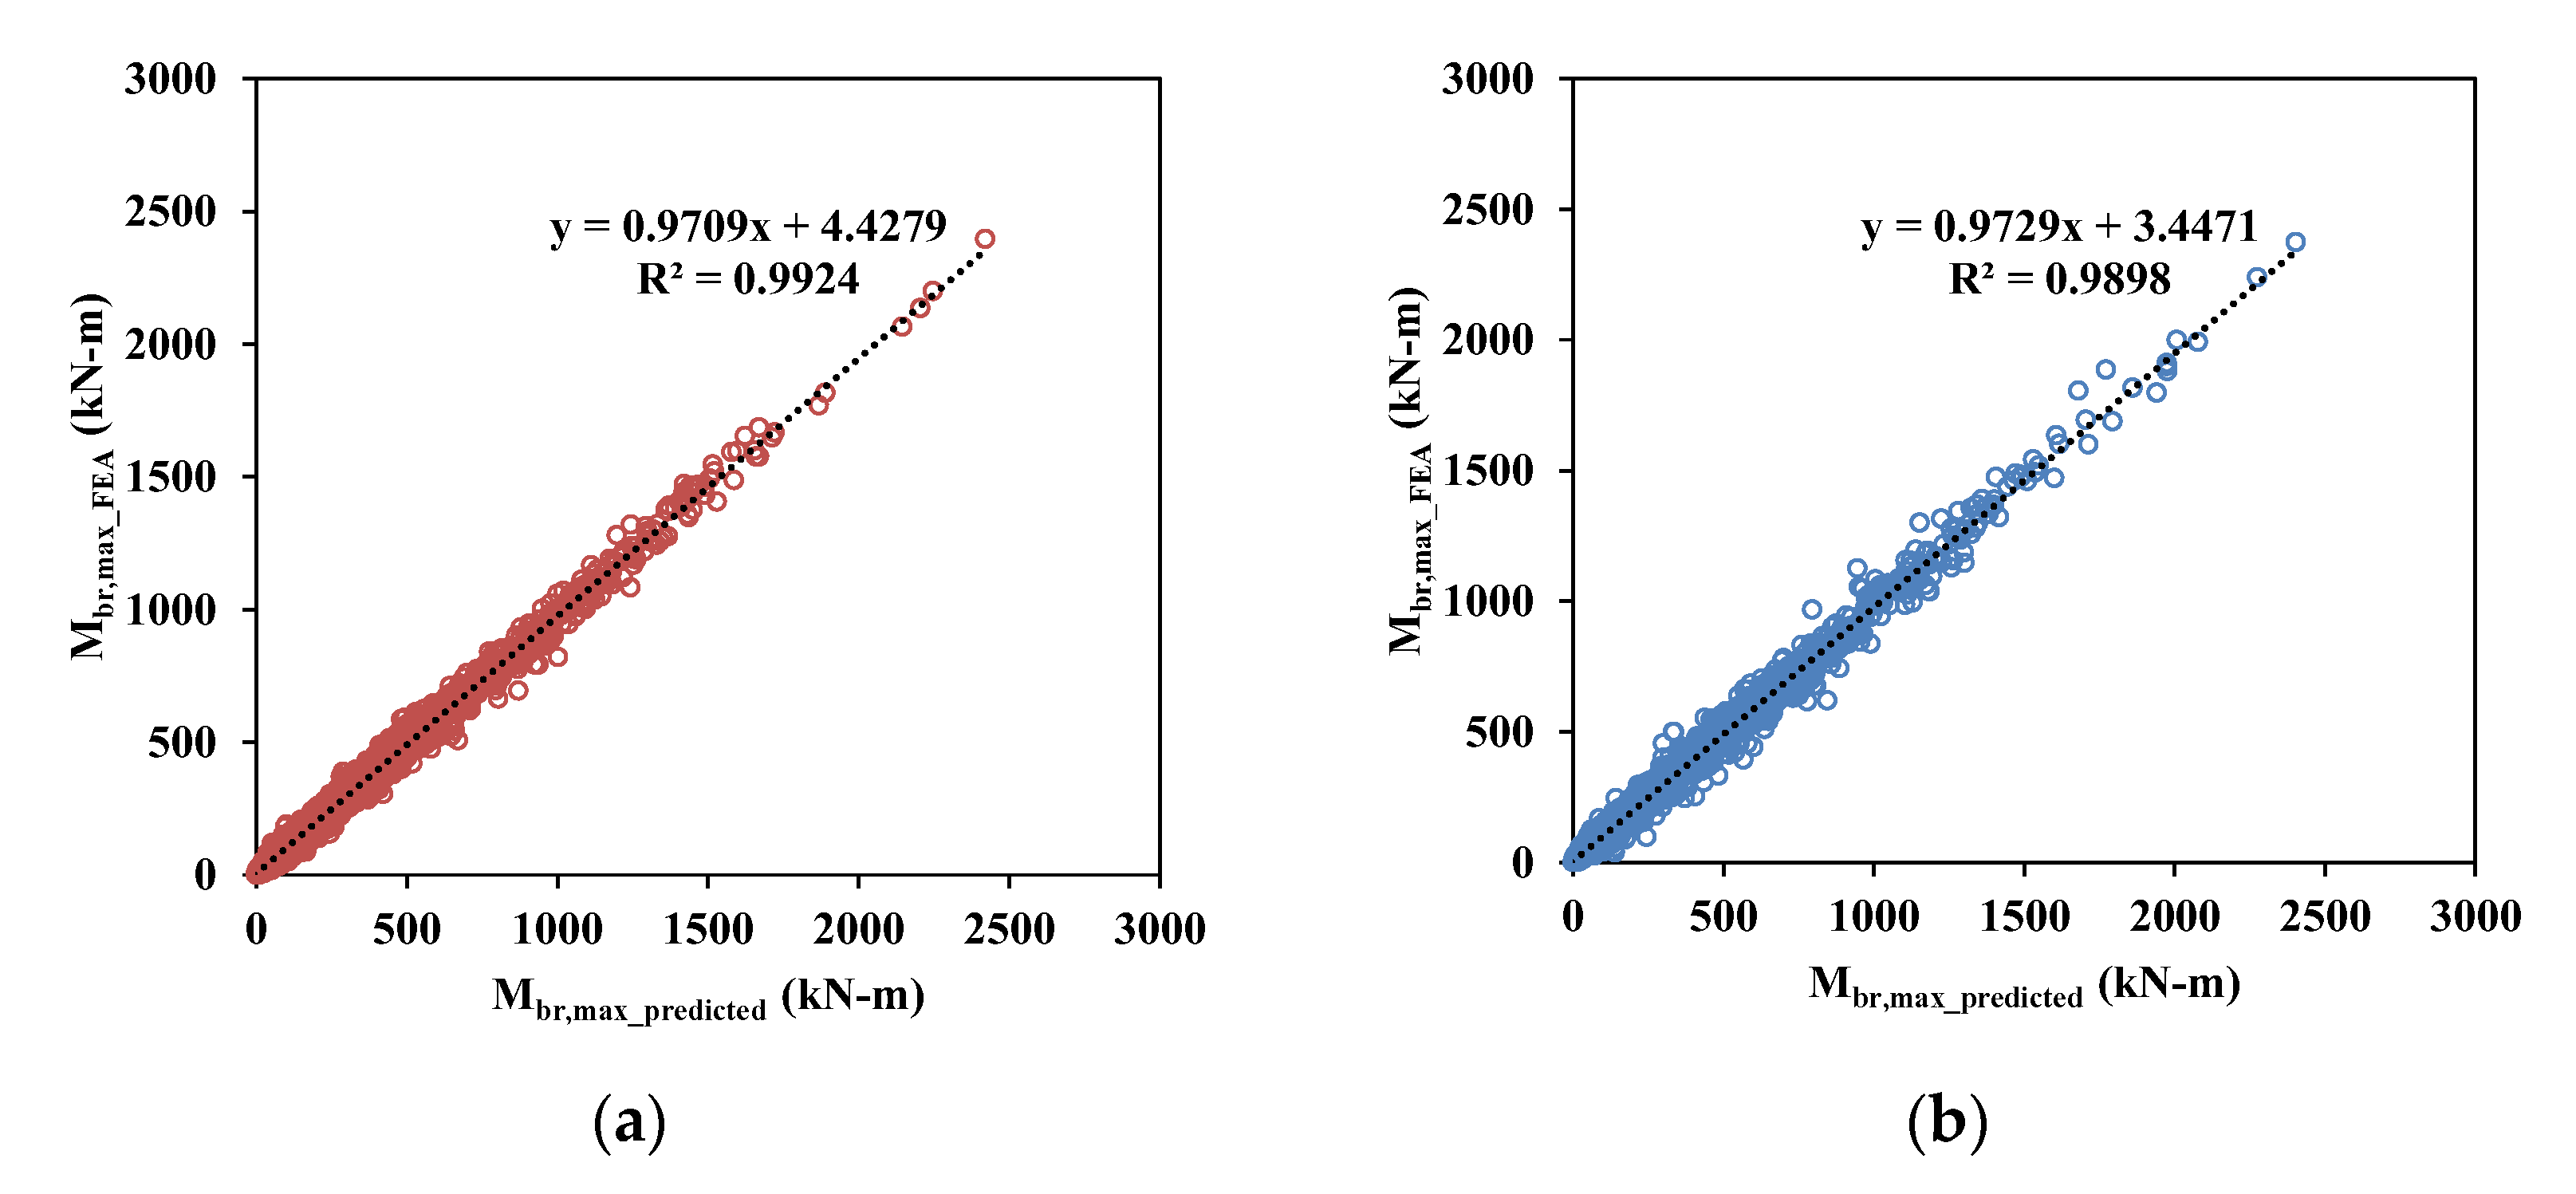
Figure 11.
Comparisons of predicted minimum bracing moments () of training and validation data sets: (a) training data and (b) test data.
5.1.2. Estimation of Bracing Force ()
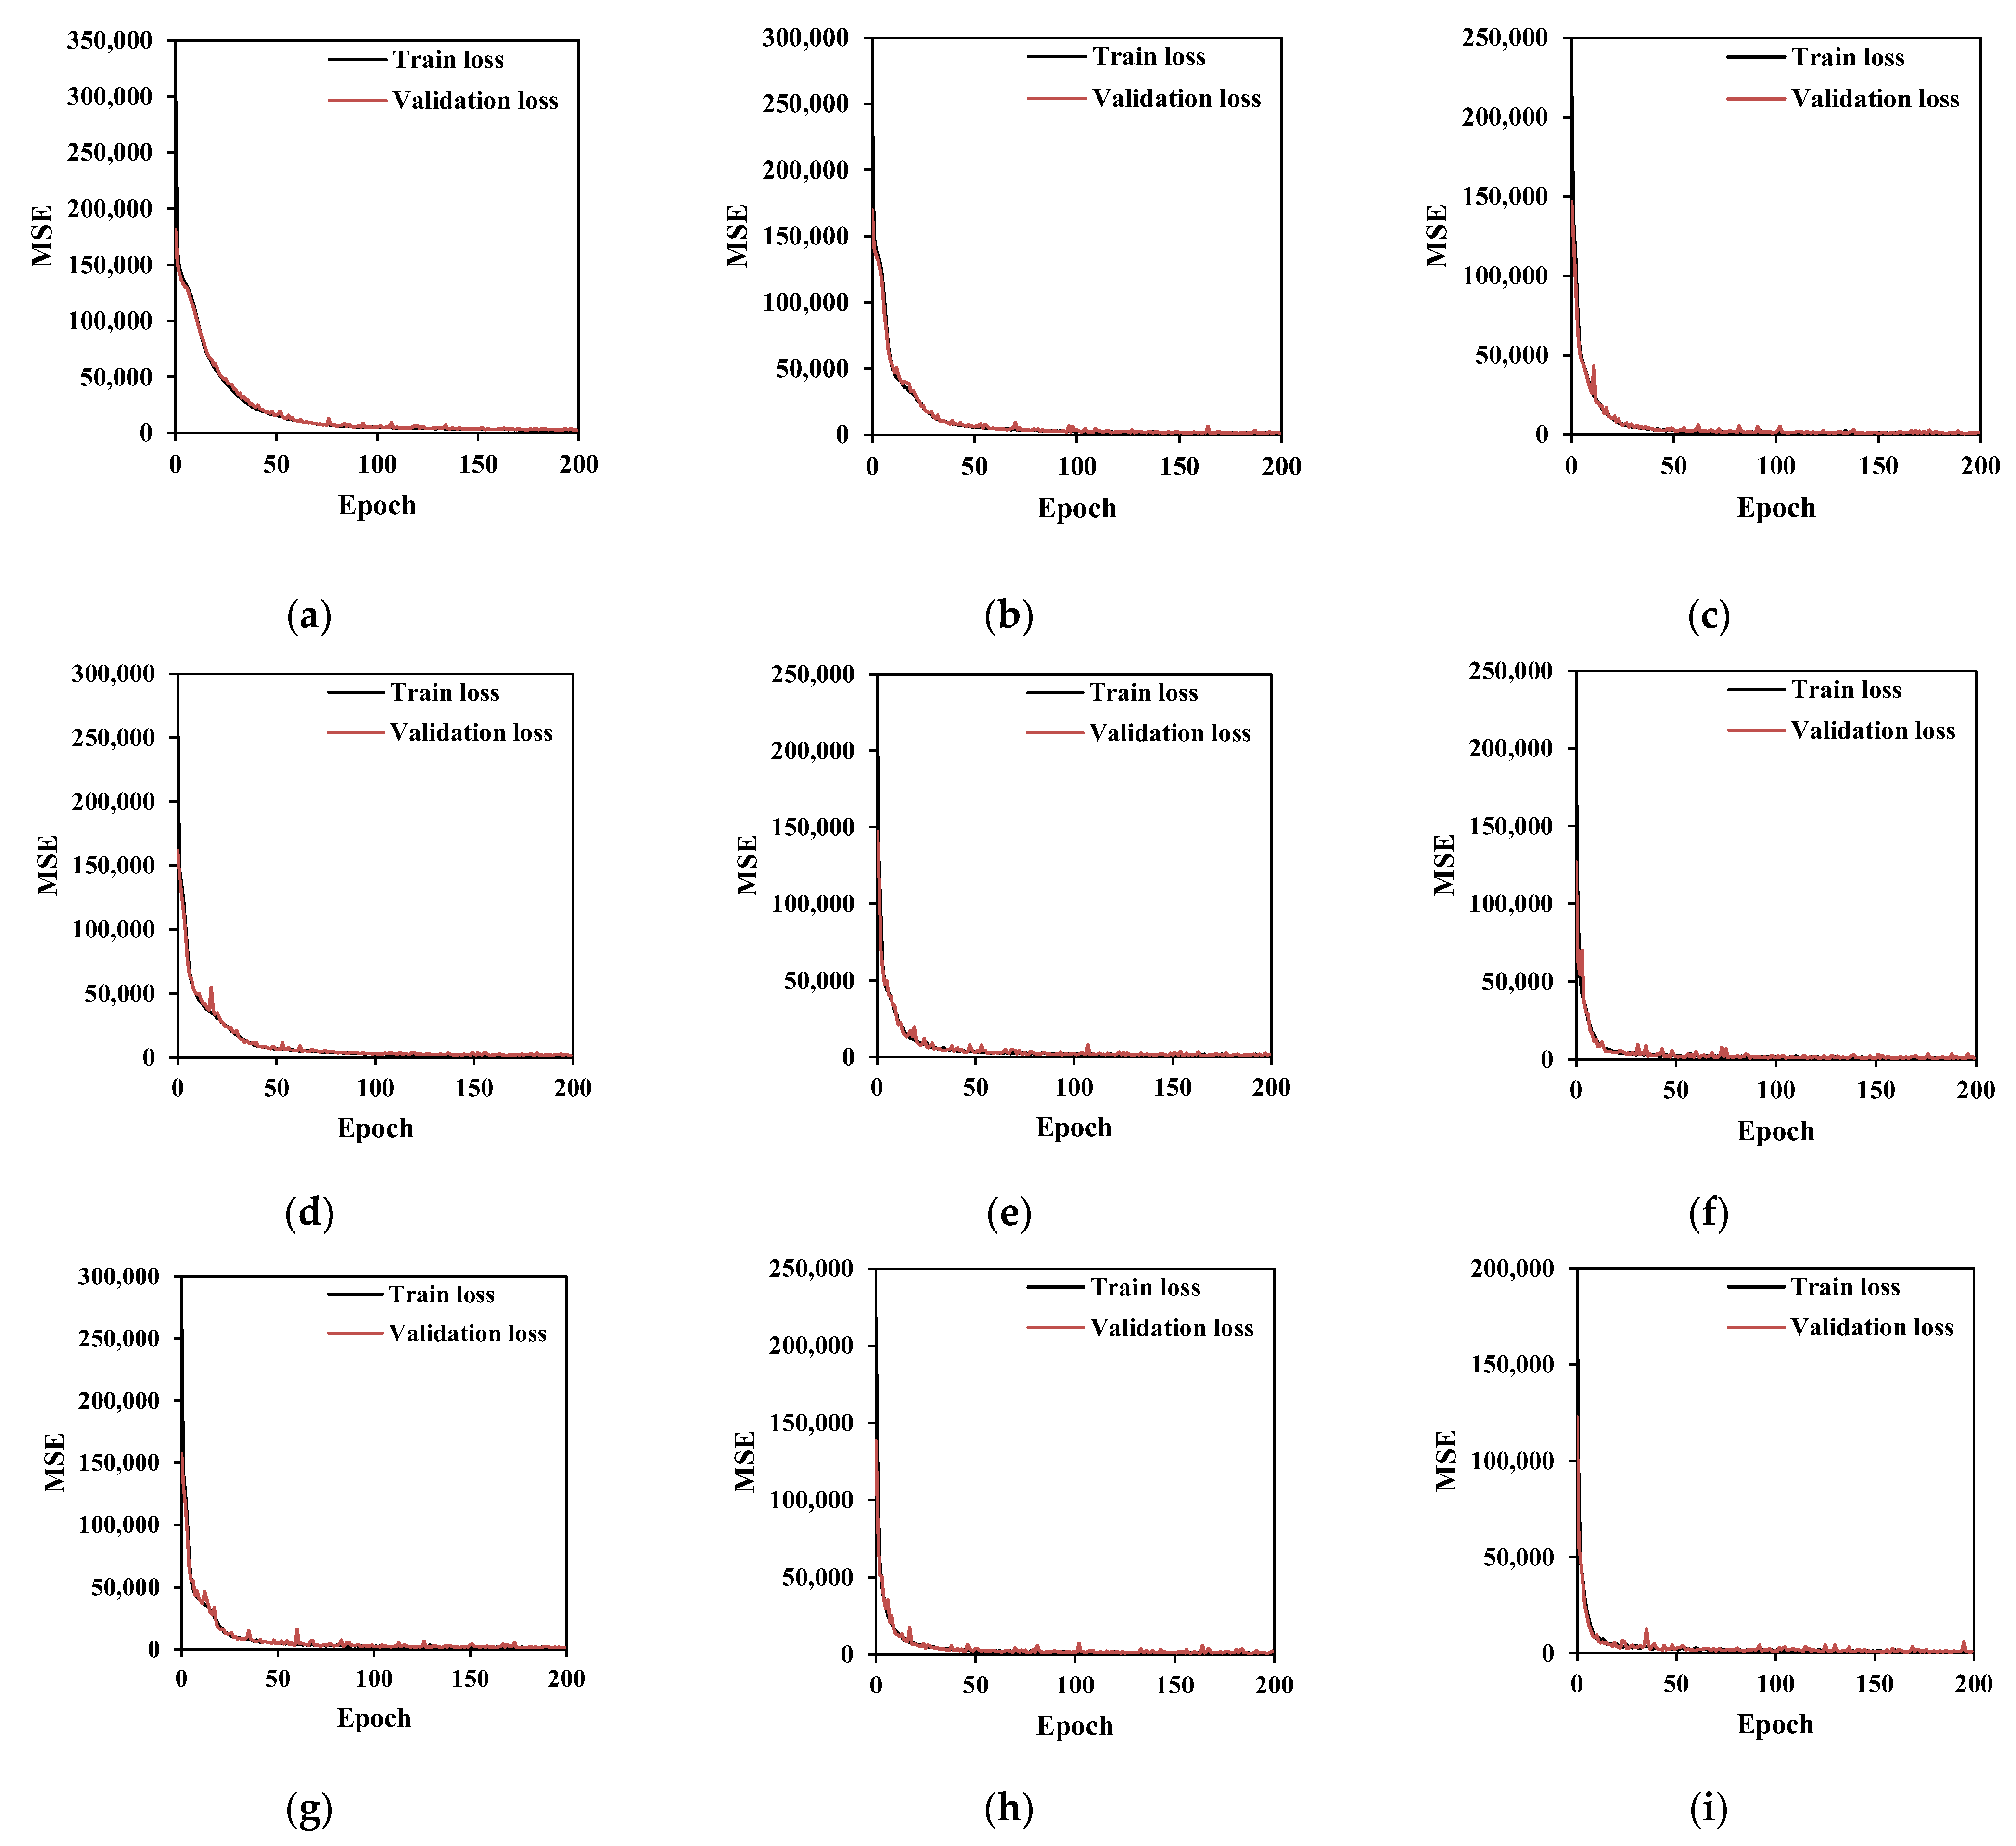
Figure 12 shows comparisons of the training and validation loss with respect to MSE between predicted and FEA values. Based on the comparisons, the DNN models require at least 100 epochs for all cases of the number of neurons for reasonable estimations from Figure 12. Furthermore, the predicted of the test sets were also compared using various performance criteria, as summarized in Table 10. The DNN model with five hidden layers, 50 neurons, and 100 epochs (H5N50E100) shows the best prediction results, based on the comparisons. In this model, the performance values in terms of the coefficient of determination are 0.997 and the minimum values for RMSE, MSE, and MAE, respectively.
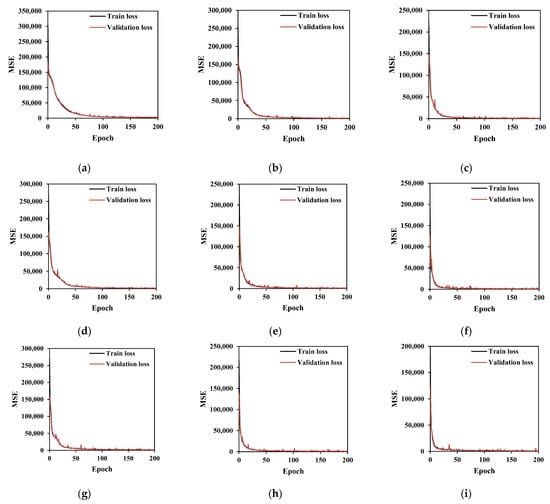
Figure 12.
Comparisons of training and validation loss of bracing forces (): (a) 3-50-200; (b) 3-100-200; (c) 3-200-200; (d) 4-50-200; (e) 4-100-200; (f) 4-200-200; (g) 5-50-200; (h) 5-100-200; and (i) 5-200-200 (in which 3-50-200 means a DNN model with 3 hidden layers, 50 neurons for each hidden layer, and 200 epochs).
Table 10.
Accuracy of DNN models for using various performance criteria.
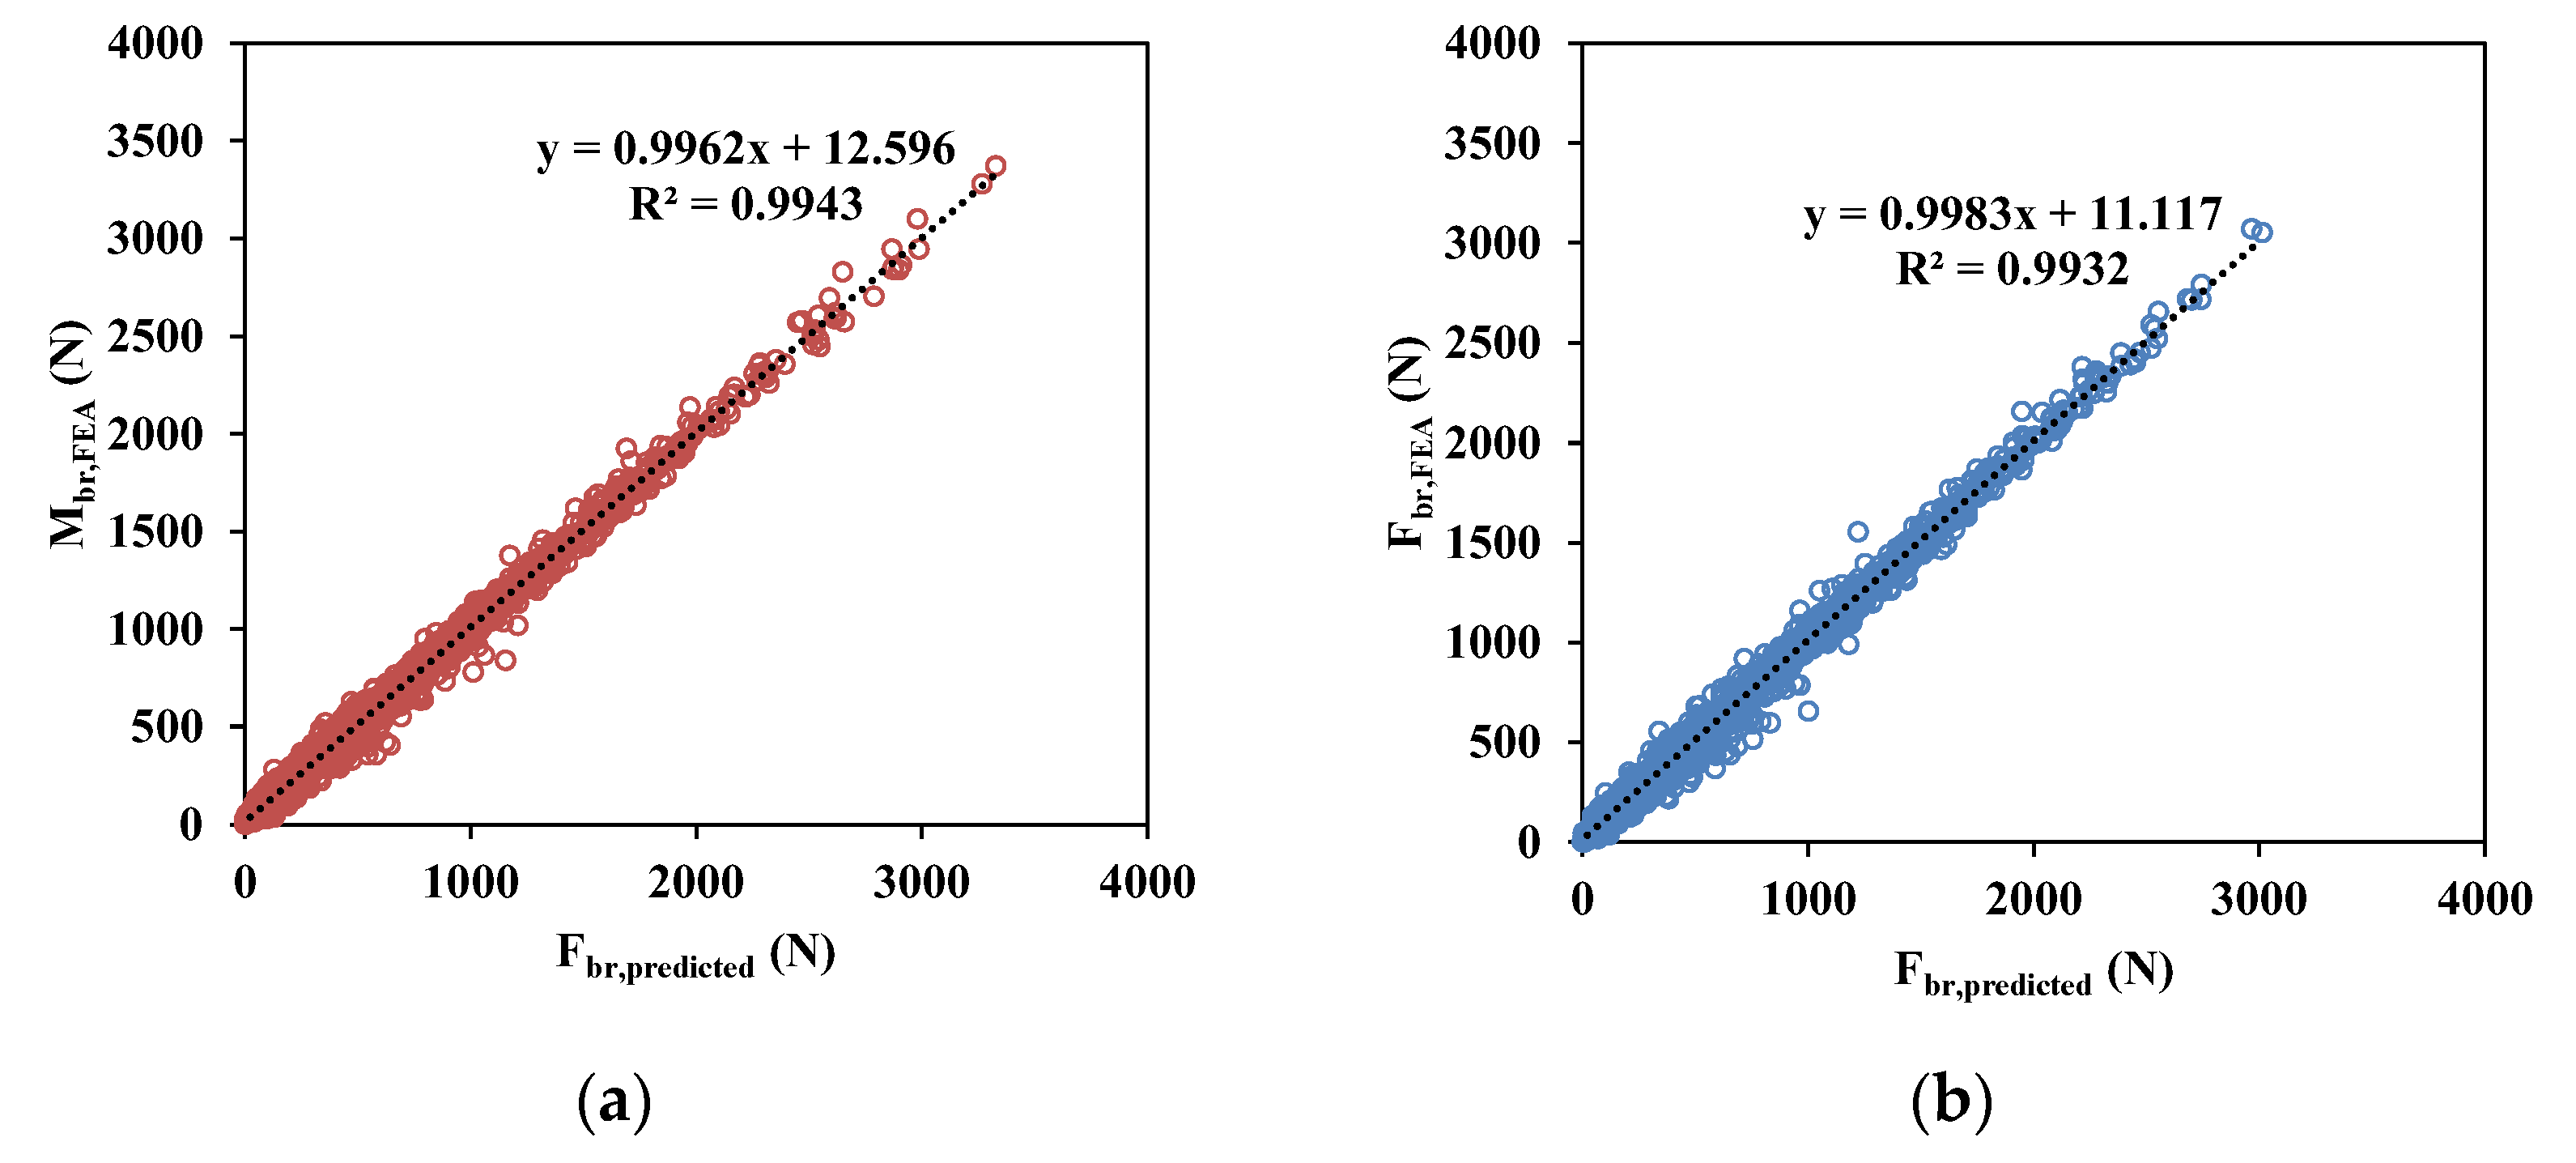
Figure 13 compares the predicted bracing forces () with the FEA results, which served as training and validation data in this study. For all cases, the prediction values show good correlations with the FEA results. Based on the FEA results, the magnitude of the bracing forces is relatively low compared to the bracing moments, as the maximum bracing force acting on the bracing elements is 3421.2 N, as seen in Table 6. Although the bracing forces are relatively small compared to the bracing moments, a more accurate prediction may be possible if we use the bracing force prediction model derived from this study.
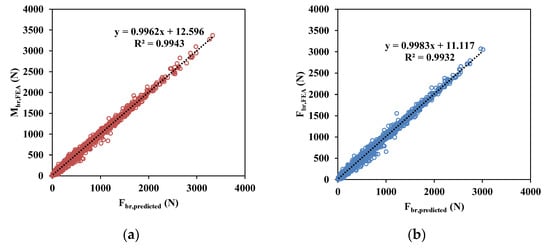
Figure 13.
Comparisons of predicted bracing forces () of training and validation data sets: (a) training data and (b) test data.
6. Conclusions
This study investigated the application of DNN algorithms to estimate internal forces, with two design variables, namely bracing moments () and bracing force (), respectively. Based on this study, DNN-based prediction models were proposed for estimating the internal forces acting along the bracing elements in steel I-girder bracing systems. The conclusions are summarized below.
- This study constructed structural response data based on three-dimensional geometrically nonlinear analysis with imperfections. The structural response data include the bracing moments () and bracing forces () acting on the bracing elements at the states in which LTB behavior occurs. This study introduces critical imperfections at the target bracing element to ensure that the maximum bracing internal forces occur in the bracing elements of the steel I-girder bracing systems.
- The bracing moments obtained from FEA were compared to the design equation stipulated in the AISC provisions [1]. The FEA results indicate that the design provisions provide considerably conservative design values for torsional bracing steel I-girder systems, regardless of the types of loading conditions. The built-up sections provide more conservative results compared to the W-sections. It may be concluded that the design bracing moments computed by AISC [1] provide conservative design values when it has wide flange sections, compared to the girder sections that have relatively smaller flange widths.
- This study proposed DNN models to estimate the bracing moments and forces acting along the bracing elements. Based on the parametric study of the hyperparameters, such as the hidden layers, neurons, and epochs, several DNN models, which exhibit the best prediction results, were proposed. The accuracy of the presented DNN models was evaluated based on four different statistical performance indices (i.e., RMSE, MSE, MAE, and R2). For estimating bracing moments, the DNN models require five hidden layers with 200 neurons and 200 epochs to ensure the higher accuracy of the models. For bracing force estimations, the DNN models require five hidden layers with 50 neurons and 100 epochs to show the best prediction results compared to other models.
- Although the bracing forces have minor effects on the bracing internal forces, it was concluded that using a prediction model for bracing forces may lead to a more accurate prediction of the internal forces acting on the bracing elements. Furthermore, the proposed models can be used for preliminary design phases to determine reasonable bridge layouts. It is recommended that the simultaneous use of the DNN models for bracing moments and forces may provide a more accurate estimation of the bracing internal forces.
- The proposed DNN models were constructed for twin steel I-girder bracing systems. Thus, future research works on multi-girder systems are required.
Author Contributions
Conceptualization, J.L.; methodology, J.L. and S.R.; software, Y.J.K.; validation, J.L., S.R., W.C., S.K., and Y.J.K.; formal analysis, J.L.; investigation, J.L., S.R., and Y.J.K.; resources, W.C., S.K., and Y.J.K.; data curation, J.L. and S.R.; writing—original draft preparation, J.L.; writing—review and editing, J.L. and Y.J.K.; visualization, J.L.; supervision, Y.J.K.; project administration, J.L. and Y.J.K.; funding acquisition, J.L. and Y.J.K. All authors have read and agreed to the published version of the manuscript.
Funding
This research was supported by a Korea Agency for Infrastructure Technology Advancement (KAIA) grant funded by the Ministry of Land, Infrastructure and Transport (Grant 21CTAP-C163783-01).
Institutional Review Board Statement
Not applicable.
Informed Consent Statement
Not applicable.
Data Availability Statement
All data supporting the findings of this study are available from the corresponding author upon reasonable request.
Conflicts of Interest
The authors declare no conflict of interest.
Appendix A
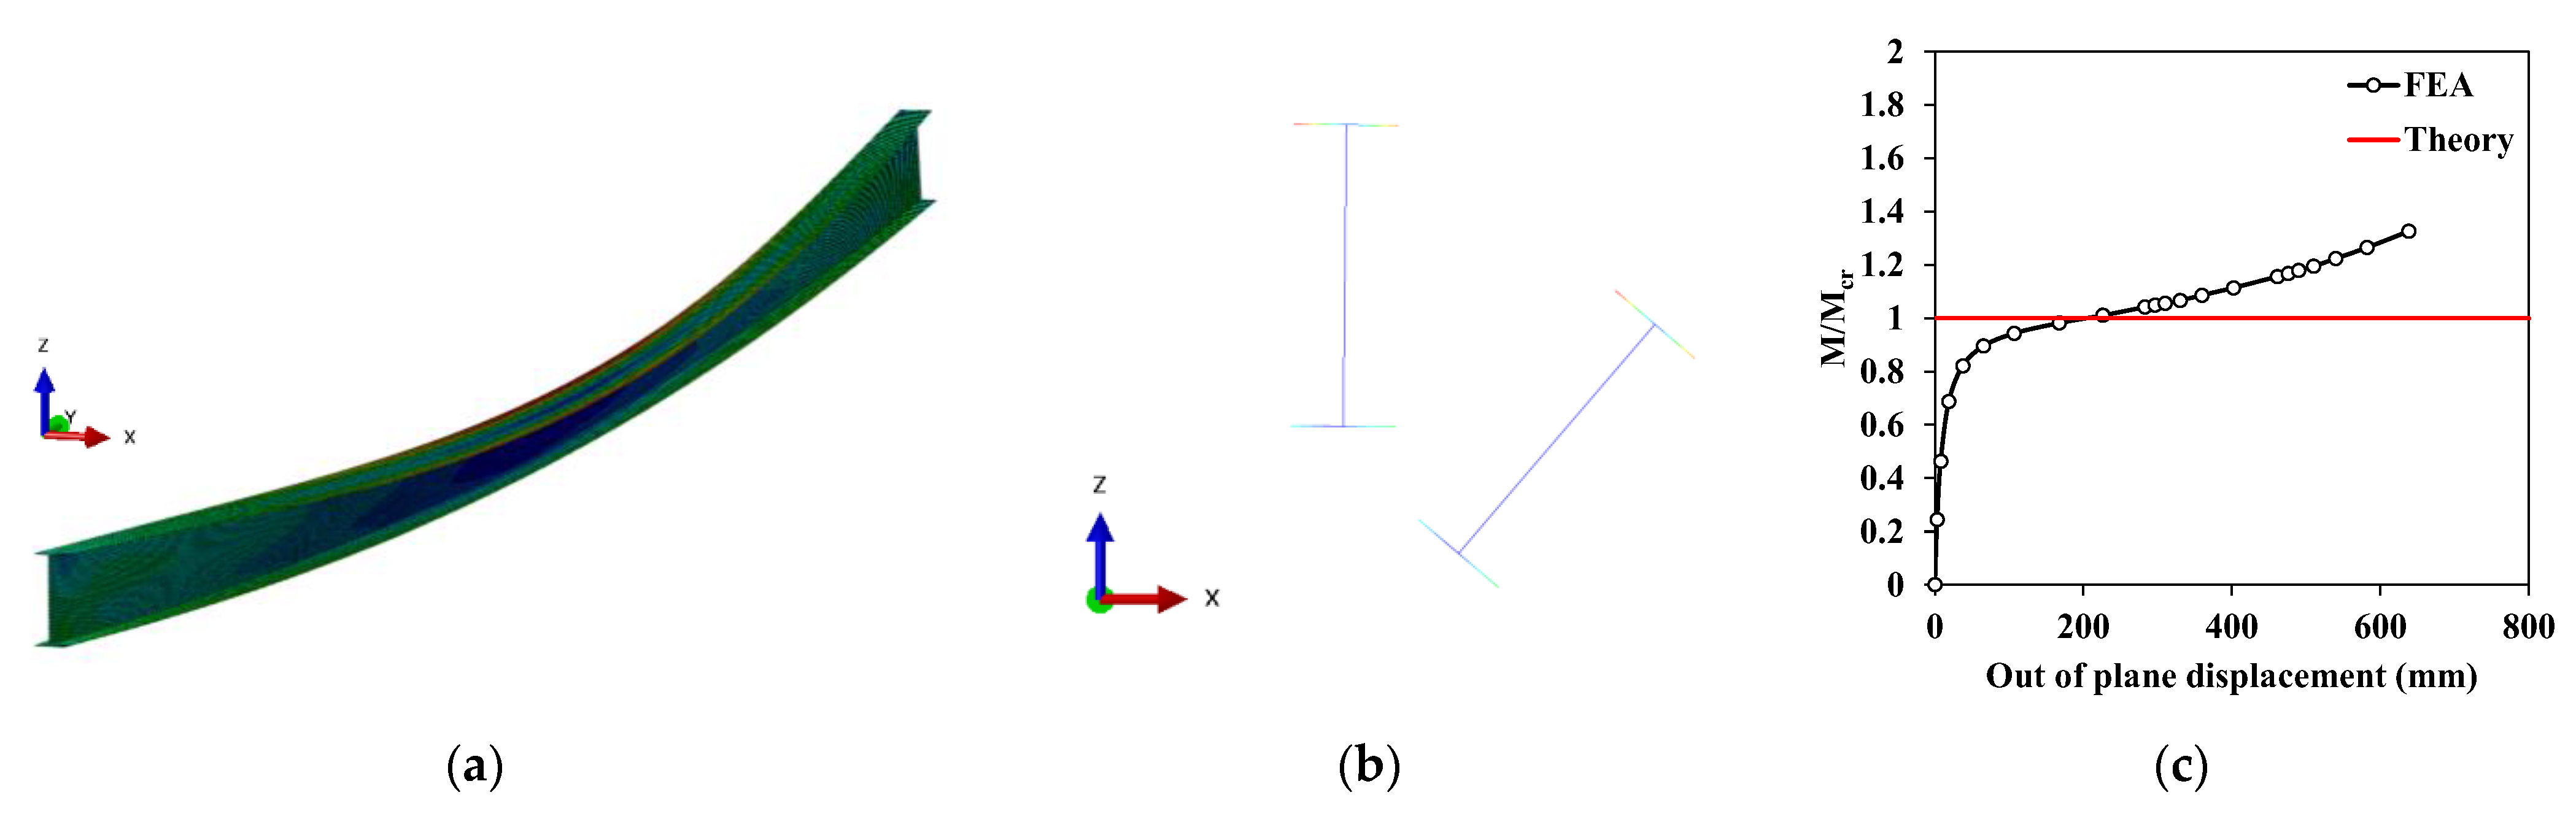
This section provides validation of the FEA models utilized in this study. In this preliminary analysis, the W920 × 201 section was chosen for the geometrically nonlinear finite element analysis with imperfections. The model has a flange width of 305 mm, a height of 902 mm, a flange thickness of 20.6 mm, a web thickness of 15.9 mm, and an unbraced length of 22.55 m. An initial imperfection of a half-sine shape was applied to simulate between the unbraced length of the girder. The maximum value of /2000 is applied in the mid-span. The number of the element was 8 for flange width directions, and the same element length was utilized along the web height and longitudinal directions. Based on the geometrically nonlinear analysis, the deformed shape of the girder shows typical LTB behavior with a lateral displacement and rotation. In addition, the comparison between the FEA results (FEA in Figure A1c) and theoretical LTB strength (Theory in Figure A1c) shows similar LTB strength, as shown in Figure A1c.
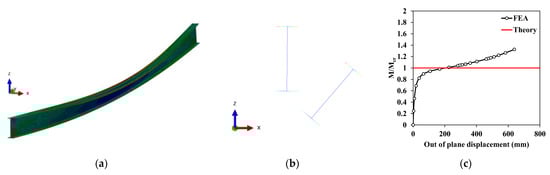
Figure A1.
Preliminary analysis of W920 201 with the initial imperfection of /2000: (a) deformed shape of the girder; (b) deformed shape of mid-section; and (c) a normalized loading and out-of-plane displacement (x-direction) relationship.
Figure A1.
Preliminary analysis of W920 201 with the initial imperfection of /2000: (a) deformed shape of the girder; (b) deformed shape of mid-section; and (c) a normalized loading and out-of-plane displacement (x-direction) relationship.
References
- AISC. Specification for Structural Steel Buildings; American Institute of Steel Construction: Chicago, IL, USA, 2016. [Google Scholar]
- Taylor, A.C.; Ojalvo, M. Torsional Restraint of Lateral Buckling. J. Struct. Div. 1966, 92, 115–130. [Google Scholar] [CrossRef]
- Milner, H.R. Design of Simple Supported Beams Braced Against Twisting on the Tension Flange. Civ. Eng. Trans. 1977, 19, 84–91. [Google Scholar]
- Yura, J.A. Bracing for Stability-State-of-the-Art. In Proceedings of the Structural Congress XIII, Boston, MA, USA, 2–5 April 1995; pp. 1793–1797. [Google Scholar]
- Yura, J.A. Fundamentals of Beam Bracing. Eng. J. 2001, 38, 11–26. [Google Scholar]
- AISC. Load and Resistance Design Specification for Structural Steel Buildings; American Institute of Steel Construction: Chicago, IL, USA, 2001. [Google Scholar]
- Winter, G. Lateral Bracintg of Columns and Beams. J. Struct. Div. 1958, 84, 1561. [Google Scholar] [CrossRef]
- Wang, L.; Helwig, T.A. Critical Imperfections for Beam Bracing Systems. J. Struct. Eng. 2005, 131, 933–940. [Google Scholar] [CrossRef]
- Liu, Y.; Helwig, T. Torsional Brace Strength Requirements for Steel I-Girder Systems. J. Struct. Eng. 2020, 146, 04019185. [Google Scholar] [CrossRef]
- AISC. Specification for Structural Steel Buildings; American Institute of Steel Construction: Chicago, IL, USA, 2010. [Google Scholar]
- Han, L.; Helwig, T.A. Elastic Global Lateral-Torsional Buckling of Straight I-Shapted Girder Systems. J. Struct. Eng. 2020, 146, 04020043. [Google Scholar] [CrossRef]
- Nguyen, T.; Kashani, A.; Ngo, T.; Bordas, S. Deep neural network with high-order neuron for the prediction of foamed concrete strength. Comput.-Aided Civ. Infrastruct. Eng. 2018, 34, 316–332. [Google Scholar] [CrossRef]
- Dung, C.V.; Sekiya, H.; Hirano, S.; Okatani, T.; Miki, C. A vision-based method for crack detection in gusset plate welded joints of steel bridges using deep convolutional neural networks. Autom. Constr. 2019, 102, 217–229. [Google Scholar] [CrossRef]
- Degtyarev, V.V. Neural networks for predicting shear strength of CFS channels with slotted webs. J. Constr. Steel Res. 2021, 177, 106443. [Google Scholar] [CrossRef]
- Ly, H.B.; Nguyen, T.A.; Mai, H.V.T.; Tran, V.Q. Development of deep neural network model to predict the compressive strength of rubber concrete. Constr. Build. Mater. 2021, 301, 124081. [Google Scholar] [CrossRef]
- Nguyen, D.D.; Tran, V.L.; Ha, D.H.; Nguyen, V.Q.; Lee, T.H. A machine learning-based formulation for predicting shear capacity of squat flanged RC walls. Structures 2021, 29, 1734–1747. [Google Scholar] [CrossRef]
- Pizarro, P.N.; Massone, L.M. Structural design of reinforced concrete buildings based on deep neural networks. Eng. Struct. 2021, 241, 112377. [Google Scholar] [CrossRef]
- Tam, V.W.Y.; Butera, A.; Le, K.N.; Silva, L.C.F.D.; Evangelista, A.C.J. A prediction model for compressive strength of CO2 concrete using regression analysis and artificial neural networks. Constr. Build. Mater. 2022, 324, 126689. [Google Scholar] [CrossRef]
- Tanhadoust, A.; Yang, T.Y.; Dabbaghi, F.; Chai, H.K.; Mohseni, M.; Emadi, S.B. Predicting stress-strain behavior of normal weight and lightweight aggregate concrete exposed to high temperature using LSTM recurrent neural network. Constr. Build. Mater. 2023, 362, 129703. [Google Scholar] [CrossRef]
- Min, S.; Jeong, K.; Hoh, Y.; Won, D.; Kim, S. Damage detection for tethers of submerged floating tunnels based on convolutional neural networks. Ocean. Eng. 2022, 250, 111048. [Google Scholar] [CrossRef]
- Helwig, T.A.; Frank, K.H.; Yura, J.A. Lateral-Torsional Buckling of Singly Symmetric I-Beams. J. Struct. Eng. 1997, 123, 1172–1179. [Google Scholar] [CrossRef]
- AASHTO. AASHTO LRFD Bridge Design Specifications; Americal Association of State Highway and Transportation Officials: Washington, DC, USA, 2020. [Google Scholar]
- ABAQUS. In Abaqus/CAE User’s Guide; Dassault Systems Simulia Corporation: Providence, RI, USA, 2020.


Disclaimer/Publisher’s Note: The statements, opinions and data contained in all publications are solely those of the individual author(s) and contributor(s) and not of MDPI and/or the editor(s). MDPI and/or the editor(s) disclaim responsibility for any injury to people or property resulting from any ideas, methods, instructions or products referred to in the content. |
© 2023 by the authors. Licensee MDPI, Basel, Switzerland. This article is an open access article distributed under the terms and conditions of the Creative Commons Attribution (CC BY) license (https://creativecommons.org/licenses/by/4.0/).