Article

Suitability of Apples Flesh from Different Cultivars for Vacuum Impregnation Process

by
Marcin Kidoń
*,
Elżbieta Radziejewska-Kubzdela
,
Róża Biegańska-Marecik
and
Przemysław Łukasz Kowalczewski
Department of Food Technology of Plant Origin, Poznań University of Life Sciences, 60-624 Poznań, Poland
*
Author to whom correspondence should be addressed.
Appl. Sci. 2023, 13(3), 1528; https://doi.org/10.3390/app13031528
Submission received: 8 December 2022 / Revised: 16 January 2023 / Accepted: 20 January 2023 / Published: 24 January 2023
(This article belongs to the Special Issue Recent Advances in Applied Microbiology and Food Sciences, Volume II)

Abstract

:

Featured Application

Depending on the way of industrial processing, specific properties of apple fruit are required. The fruit of some cultivars has characteristics that predispose them to the production of juices or purees. Other properties are important for the vacuum impregnation process. The results obtained will be useful in the case of industrial application of the vacuum process of apple tissue.

Abstract

The article evaluated the suitability of 14 apple cultivars for the vacuum impregnation (VI) process based on the comparison of the physicochemical properties of fresh and impregnated tissue. The cube-cut apple was impregnated in a solution close to isotonic composed of 0.5% ascorbic acid, 0.5% citric acid, and 10% sucrose. The VI process was conducted with vacuum time and absolute pressure at 10 min and 15 kPa, restoring atmospheric pressure at 5 min and relaxation time at atmospheric pressure at 10 min. The content of ascorbic acid after VI increased by 3 to 25 times and was in the range of 73.5–130 mg/100 g, while the mass gain for the samples ranged from 15% to 34%. On the basis of the Pearson correlation, it was found that the mass gain was negatively correlated with the firmness of the fresh apple cubes (r = −0.85). The cultivars with favorable features after the VI process in terms of vitamin C content; hardness; and browning index (BI) are Cortland; Shampion; and Ligol.

1. Introduction

Apple trees (Malus domestica) are cultivated throughout the world, and apples are the second fruit crop in the world. The largest apple producers are China, the United States, Turkey, and Poland [1]. Apples are popularly consumed fresh, but also as processed products. For instance, juices, nectars, chips, snacks, or applesauce are appreciated by customers. A very popular form is minimally processed apples, in the form of cubes, which could be in demand by the bakery and confectionary industry. Apples are also important from a nutritional point of view. They are a rich source of monosaccharides, minerals, dietary fiber, and phenolic compounds [2,3,4,5]. The enrichment of the raw material with active ingredients can be achieved, among others, by applying the vacuum impregnation (VI) technique. Incorporation of a suitable composed solution into apple tissue could enhance both sensory and nutritional characteristics [6,7,8,9]. The main cultivars produced in the European country are Golden Delicious, Gala, Idared, Jonagold, and Jonagored [10]. Different apple cultivars represent different technological properties. It is very important to select and identify cultivars and their properties that predispose them to a specific processing method.
VI is a technology that accelerates the mass transfer of an adequate solution to a solid matrix. Internal porous matrices, which contain air and fluids, such as tissue from fruit or vegetables, are well-suitable for VI. VI has by now found many applications in the food industry, for instance, for salting, degreasing, or fortification of food. Depending on the composition of the solution incorporated into food matrices, different effects could be achieved. In the literature, examples of increasing nutritional values can be found, by the addition of antioxidants or minerals, changing physicochemical properties by the addition of pH-lowering agents or cryoprotectants, protecting from browning by the addition of ascorbic acid or improving texture by the addition of calcium ions [6,9,11,12,13,14,15,16].
Tissue impregnation by the solution during the VI process has been theoretically described by the hydrodynamic mechanism (HDM) and the deformation-relaxation phenomena (DRP). In the proposed model, two phases of the process are distinguished: vacuum and impregnation. In the first vacuum phase, food (usually cut into particles of uniform shape and size) is immersed in the impregnation solution, and pressure is reduced. It causes the internal gas and fluids trapped in the product pores to be expanded and partially evacuated. In the second impregnation phase, pressure is restored to the atmosphere. During that, the external solution penetrates the pores of the product, and residual gas is compressed until the equilibrium pressure is reached [6,9,17,18].
The effectiveness of the process is determined by synergistic external (process conditions, among others, pressure and temperature, time of vacuum maintenance and relaxation, the size and shape of the material, and others) and internal factors (properties of the impregnated material and its three-dimensional architecture). Apple tissue has properties such as high porosity, the presence of large intercellular spaces, and quite firm texture that predispose it to VI [18,19,20].
Many studies were conducted to optimize VI conditions, including vacuum level, restoration times, solution composition, and temperature [21,22,23,24,25,26]. The vacuum level that allows the removal of native fluids from the tissue is related to the morphological characteristics and porosity of the fruits [27]. Mujica-Paz et al. [28] evaluated the effect of vacuum pressure (135–674 mbar) and its application time (3–45 min) on the volume of isotonic solution impregnated in slices of apple, peach, and other fruits. The authors reported the vacuum pressure had a significant effect on the volume of the impregnation solution in all fruit slices; furthermore, the impregnation also depended on the VI time, except for the apple. However, the properties of fruit and vegetable tissues are also critical factors, and investigations of the suitability of different apple cultivars for the VI process are very important.
The aim of this research was to determine the suitability of different apple cultivars for the VI process, to specify the physical characteristics of the apple tissue that predispose it to VI, and to evaluate the selected quality parameters of the product after VI.

2. Materials and Methods

2.1. Apple Fruits

The apples of different cultivars were purchased from local producers in Poland in 2017. Apples were collected at respective commercial harvest times. Fourteen apple cultivars were used, namely Boskoop, Cortland, Gala, Gala Must, Golden Delicious, Idared, Jonagold, Jonagored, Jonaprince, Ligol, Lobo, Pinova, Shampion, and Topaz. Before analysis, apples were stored in the refrigerator at a temperature of approximately 4 °C, not longer than 2 weeks.

2.2. VI Process

The apples were placed at room temperature for 24 h before VI. Other treatments were conducted immediately before the experiment. The fruits were washed, then manually pilled and cored. The entire apples were cut into cubes of 8 × 8 × 8 mm using the Robot Coupe CL 50 (Robot Coupe, Montceau-en-Bourgogne, France). The VI treatment was carried out using vacuum laboratory equipment composed of a stainless-steel vacuum chamber VC1621S volume 4.2 dm3 with a transparent glass cover (VacuumChambers.eu, Białystok, Poland). The vacuum chamber was connected to a vacuum pump and manometer. A portion of approximately 500 g of apple cubes was weighed and placed in a vacuum chamber. After that, the vacuum pump was turned on, and an absolute pressure of 15 kPa was achieved. Then 1000 g of impregnation solution, composed of 0.5% ascorbic acid, 0.5% citric acid, and 10% sucrose in water, was added. If necessary, an absolute pressure of 15 kPa was returned and held for 10 min. After this time, the atmospheric pressure was restored linearly for 5 min, and the sample was kept immersed in solution at atmospheric pressure for the next 10 min. Then samples were separated from the solution by sieving. The vacuum level and the time of its application were determined based on numerous literature data describing the VI process for apples and on the author’s preliminary research. The applied vacuum and time values were supposed to influence the most effective impregnation process while maintaining the favorable texture characteristics of the apple cubes. The vacuum-impregnated apple cubes were weighed and subjected to other analyses. Each experiment was performed in duplicate.

2.3. Analytical Methods

2.3.1. Mass Gain (MG) after VI

The mass gain after VI was calculated according to Equation (1):
M G = m 1 m 0 m 0 · 100 %  
where m0—initial mass of the sample [g]
m1—mass of the sample after VI [g].

2.3.2. Ascorbic Acid Determination

In order to determine the ascorbic acid content, 10 g of apple cubes were homogenized using an Ultra Turrax T-25 homogenizer (IKA-Werke, Staufen im Breisgau, Germany) with metaphosphoric acid (10 g/L), extracted by shaking (Water Bath Shaker 357, Elpin-Plus S.C., Lubawa, Poland) and centrifuged for 15 min. at 4000 × g (MPW-351R centrifuge, MPW, Warsaw, Poland). The procedure was performed twice, and the supernatants were combined. A 2 mL aliquot of the obtained extract was transferred to a volumetric flask, then 1 mL of dithiothreitol (50 g/L) was added, and the solution was supplemented with metaphosphoric acid to a volume of 10 mL [29]. This solution was analyzed using an LC Agilent Technologies 1200 Rapid Resolution system (Agilent Technologies Inc., Santa Clara, CA, USA) equipped with a UV–vis detector and a Zorbax SB-C18 column (4.6 × 150 mm, 5 µm). A gradient solvent system consisting of potassium dihydrogen phosphate 0.005 mol/L, pH 2.6 (solvent A), and methanol gradient grade (solvent B) was used as follows: linear increase from 5% B to 22% B in 6 min and then returned to the initial conditions within the next 9 min. The flow rate was 0.7 mL/min, and the separation time was 15 min. The eluate was detected using a DAD set to 245 nm. The ascorbic acid was identified by comparing its retention time with that of the standard.

2.3.3. Texture Parameters (Firmness) of Apple Cubes

The firmness of the apple cubes was evaluated by Kramer’s shear test. Measurements were made using a texture analyzer TA.XTplus (Stable Micro Systems, Godalming, UK). In brief, 50 g of sample was placed in a Kramer shear cell with a 5-bladed head and compressed at a constant speed of 1 mm/s. From the force-distance curves, values of maximum shear forces were obtained. The test was performed with five replications for each sample.

2.3.4. Color Parameters Measurement and Browning Index (BI)

The color parameters of the apple cubes were measured using a CR-400 colorimeter (Konica Minolta, Tokyo, Japan) using the CIELAB color space. The measurement was performed by directly applying the colorimeter’s measuring window to the sample. The color was expressed in CIE L*a*b* system coordinates where L* is the lightness, and a* and b* are chromatic parameters that indicate the color directions: from red to green (a*) and from yellow to blue (b*). Measurements were repeated ten times for each sample. The data was used to calculate the total color change (ΔE) between fresh apple cubes and vacuum-impregnated apple cubes according to the following equation:
Δ E = ( L 0 L V I ) + ( a 0 a V I ) + ( b 0 b V I )
L 0 ;   a 0 ;   b 0 —values of color parameters for fresh apple cubes, L V I ;   a V I ;   b V I —values of color parameters for apple cubes after VI.
The browning index (BI) was calculated according to [22] as follows:
B I = 100 · x 0.31 0.172   where   x = a + 1.75 · L 5.645 · L + a 3.012 · b

2.3.5. The pH and Soluble Solids Determination

The pH measurement of homogenized apple cubes (homogenizer IKA-Werker, Staufen im Breisgau, Germany) was performed using a HI 221 pH-meter (Hanna Instruments, Smithfield, Woonsocket, RI, USA) by directly immersing the electrode in the sample. Before measurement, the electrode was calibrated with buffers pH 4.0 and 7.0. Three repetitions were made in each sample analyzed.
The total soluble solids content of the apple cubes was determined at 20 °C using a HI 96801 digital refractometer (Hanna Instruments, RI, USA). A few drops of liquid were squeezed from the homogenized sample onto the prism of the refractometer. Three repetitions were made in each sample analyzed.

2.4. Statistical Analysis

The results were expressed as mean ± standard deviation (SD). Statistical analyses were performed using Statistica 13.1 software (TIBCO Software Inc., Palo Alto, CA, USA) and Excel 2010 (Microsoft Corporation, Redmond, WA, USA). Analysis of two-way variance (ANOVA) at p < 0.05 followed by the Tukey test was applied. The relationships between variables were examined using the Pearson correlation coefficient. The Principal Component Analysis (PCA) was performed on mean values of samples for variables: soluble solids content, pH, browning index (BI), ascorbic acid content, firmness, and mass gain.

3. Results and Discussion

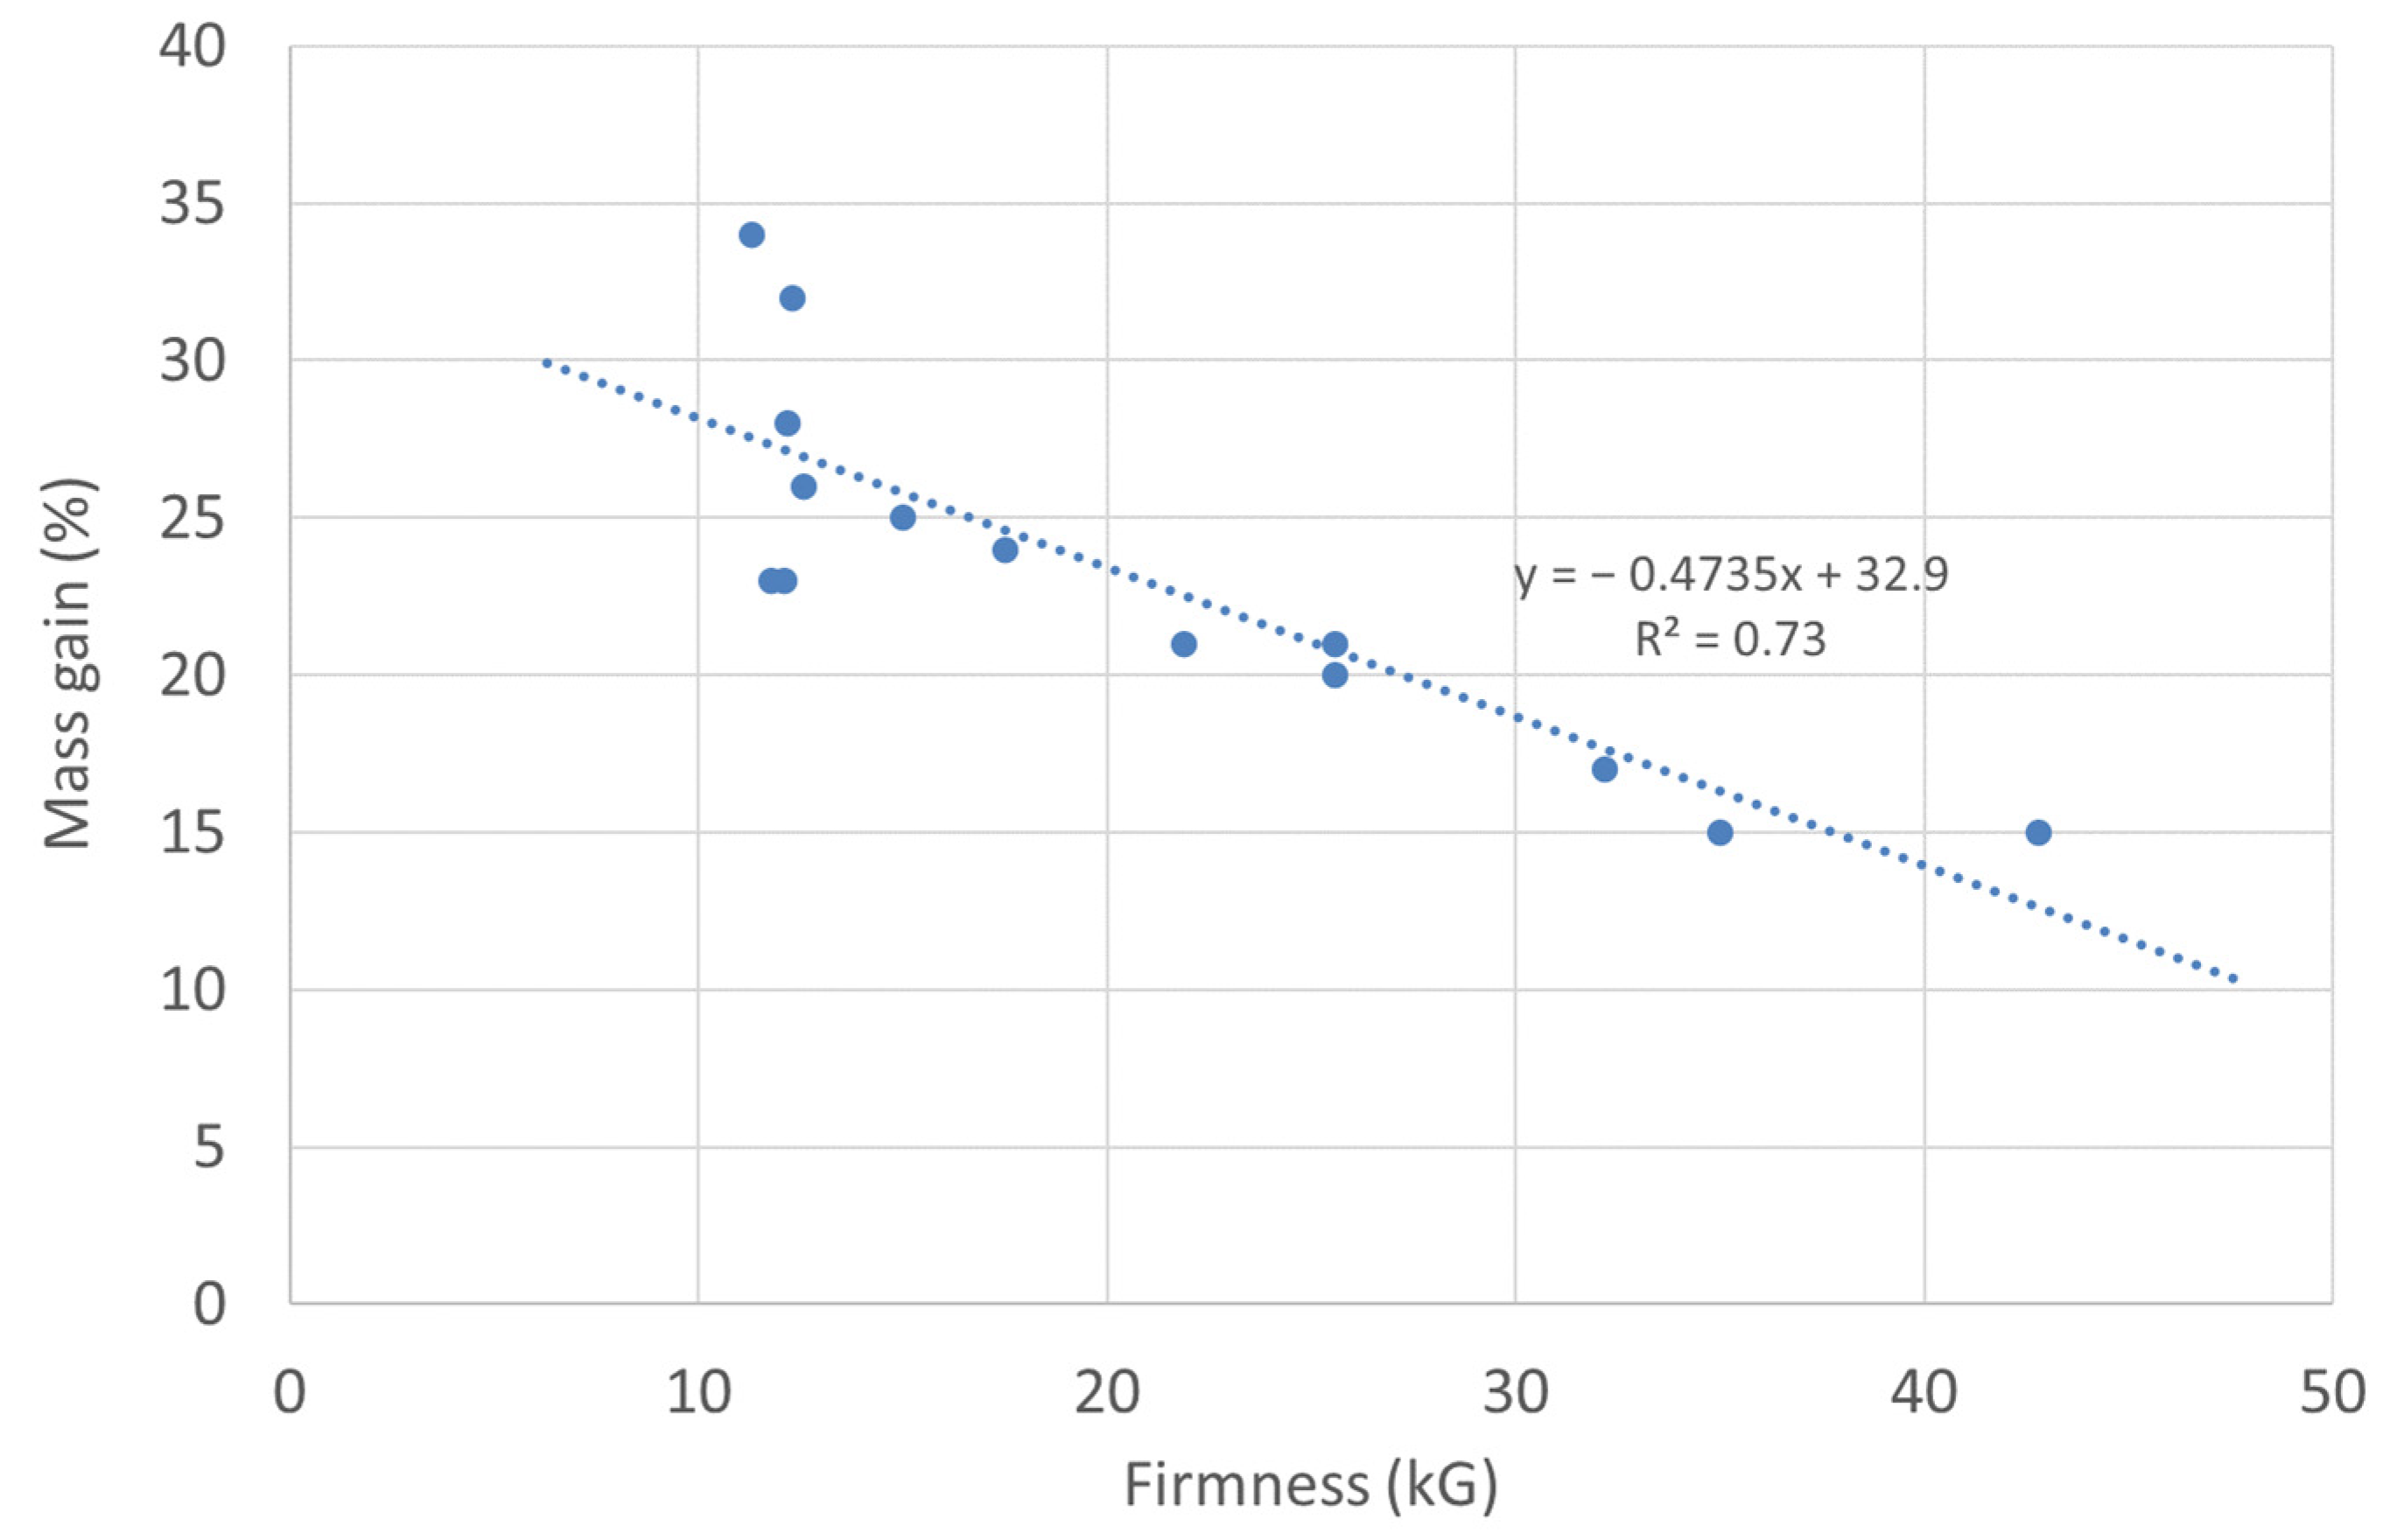
3.1. Ascorbic Acid Content, Firmness, and Mass Gain after VI Process

Apple fruit is not a rich source of vitamin C. The initial content of this vitamin in the tissue of the investigated apple cultivars ranged from about 5 mg/100 g to 25 mg/100 g, with an average content of 11.1 mg/100 g (Table 1). VI with the solution consisting of 0.5% ascorbic acid, 0.5% citric acid, and 10% sucrose resulted in an increase in ascorbic acid content to range 63–130 mg/100 g of fresh mass. The highest content of vitamin C after the VI process was found in Golden Delicious, Shampion, and Cortland apples. The positive correlation between ascorbic acid content and mass gain after VI was noticed (r = 0.46). Golden Delicious and Cortland cultivars, along with the highest ascorbic acid content (130 mg and 124/100 g, respectively), characterized the highest mass gain (34% and 28%, respectively). The low mass gain after VI (about 15–17%), as in the case of Gala Must, Red Jonaprince, or Ligol, was in pair with lower ascorbic acid content after VI (77 mg to 98/100 g). The tissue of these three cultivars is also firmer than other investigated cultivars, but no statistically important relationship between tissue firmness and ascorbic acid content was found. It is possible that other factors may also have influenced the level of saturation of apple tissue with ascorbic acids, such as the porosity of the tissue, the structure of capillaries, or size and shape of the material [6,9].
VI caused a considerable increase in the level of ascorbic acid in the apple tissue. Hironaka et al. [30] also observed an increase in ascorbic acid content during VI of potato slices. After 60 min, the vacuum-impregnated potato had from 9 to even 21 times higher ascorbic acid content than the raw potatoes. The effect strongly depends on the impregnation time. The increase after 15 min was about 2–3 times compared to the fresh sample. In our study, an increase in ascorbic acid from 3 to even 25 times was noticed after 10 min of vacuum pressure. Apple tissue possessed different textural characteristics from potatoes. The major differences can be seen in terms of the porosity of the material and, thus, the space that the impregnation fluid can fill. The porosity of apple tissue is approximately 6.4–31%, while the porosity of potato is only 3 to 8% [19,20,31]. The shorter time needed to achieve the same effect with apples as with potatoes can be explained by this.
The forces values obtained from texture analysis for tested apples ranged from 11.3 kG to 43 kG. Apple cultivars based on their initial firmness could be divided into three groups: Boscoop, Cortland, Gala, Golden Delicious, Jonagold, Jonagored, Lobo, and Pinova, characterized by the softest texture (firmness from 11.3 to 17.5 kG); Idared, Shampion, and Topaz apples, slightly firmer (21.9 and 25.6 kG); Ligol, Gala Must, and Red Jonaprince, hard (firmness 32 to 43 kG). The VI process caused softening of the tissue. The results obtained from the texture analysis of the impregnated apple cubes ranged from 6.0 to 34.6 kG. The decrease in firmness after VI may depend on the value of this parameter in fresh apple cubes. Soft samples before (firmness ≤ 17.5 kG) resulted in 1.2 to 2.1 times lower firmness after VI, while initially harder samples (firmness ≥ 30 kG) resulted in 1.1 to 1.2 times lower firmness after impregnation. VI of apple cubes could result in greater deformation in the case of cultivars with softer tissue.
VI considerably increases the mass transfer between the product and the surrounding liquid. The amount of solution incorporated into the tissue depends on many factors, such as the working pressure, the time of the process, the composition of the solution, and the characteristics of the tissue [6,9]. The VI process carried out at 15 kPa absolute pressure resulted in the mass gain of the sample in the range of 15 to 34% (Table 1). A connection between initial firmness and the amount of solution incorporated into the tissue could also be found. Apple cultivars with hard firmness resulted in a low mass gain (Gala Must, Ligol, and Red Jonaprince mass gain were from 15 to 17%), while lower firmness value responded to higher mass gain. In Figure 1 relationship between mass gain and initial firmness of apple tissue was plotted. It was found that the mass gain was negatively correlated with fresh apple firmness (r = −0.85).
Mass gain also depends on VI condition and tissue characteristics. This dependency is usually quite complex and not linear. As found by Pasławska et al. [32], mass gain after VI of apple cubes is dependent on the vacuum level, the time of impregnation, and the characteristic of the impregnation solution. In the case of the citric acid solution, increasing time and absolute pressure caused an increase in the mass gain of the samples, which was in the range of 8.7 to 30%. But in the case of impregnation with apple-pear juice (probably with higher soluble solids and viscosity), increasing the time of VI did not cause statistically important changes in mass gain, and also, these gains were very low, not exceeding 4.6%. In spite of other fruit and vegetables with low porosity and high density, apple tissue has large interstitial spaces and is well suited to VI. For example, Igual et al. [33], in the case of persimmon fruit, with a porosity level of 4–5%, obtained only 3% mass gain after VI with 24°Brix sucrose solution for 5 min at 50 mbar. The porosity of apples found by others ranged from 6.4 to 31% [19,20,31]. The shape and size of the sample are also important for effective impregnation. As found by Laurindo et al. [34], small cylindrical or cuboid samples impregnated faster than half pieces of apples.

3.2. Color Parameters

An important aspect of the quality of apples subjected to VI is color. Apple flesh color and its susceptibility to the browning process are cultivar-specific. The tendency to darken the flesh of apples is related to its chemical composition, mainly the content of polyphenols and the activity of ascorbic acid and PPO [4,35].
The brightness (L*) of fresh apple flesh is significantly higher (for most cultivars) compared to apples after the impregnation process. The values of the initial and after VI color parameters are in the range of 54.4–67.8 and 33.4–48.3, respectively (Table 2). A similar relationship was found for the chromatic color parameters a* and b*. However, a statistically significant reduction was only observed for the b* value. The decrease in the value of the L* and b* parameters is due to the increase in the glassiness and translucency of the fruit flesh after the VI process as a result of introducing the solution into the tissue. This gives the effect of a lesser light reflection from the measured surface. The decrease in brightness and b* value of the apple cubes after the vacuum impregnation process was also noted by Pasławska et al. [36] and Tappi et al. [37]. The a* parameter assumed both positive values (red color direction) and negative values (green color direction), depending on the cultivar. Its changes after impregnation tended to achieve zero, i. e. an increase in the case of negative values and a decrease in the case of positive values. This is due to the loss of a distinct color tone of the tissue after introducing the solution. González-Pérez et al. [38] points to the possibility of improving the color and its uniformity in the case of VI of apples by using a very high vacuum (pressure of about 7 kPa). However, such treatment may cause deterioration in the texture of the fruit and impede the impregnation of the tissue by solution.
The calculated values of the color difference (∆E) between the L*, a*, and b* values of the samples, before and after impregnation, assume lower values for cultivars with rapidly darkening flesh, such as Idared, Lobo, Pinova, Gala Must, which result from the immediate browning of the samples and reduction in the L* value at the time of dicing. Components of the impregnation solution, ascorbic and citric acid, are compounds that inhibit the enzymatic browning process, which contributes to less differentiation of color parameters after VI.
Based on the results obtained from the color measurement, it can be stated that the VI process with a solution of 0.5% ascorbic acid, 0.5% citric acid, and 10% sucrose effectively inhibited the browning process of various cultivar apple cubes, regardless of their susceptibility to this process. However, differences in the color of the samples were noted. The obtained values of L*, a*, and b* were used to calculate the browning index (BI) of fresh and vacuum-impregnated apple cubes. These values had a significantly higher range for fresh apple cubes (21.5–61.1) compared to cubes subjected to impregnation (16.5–45.0). Tappi et al. [37] recorded BI values for apples after vacuum impregnation in the range of 28 to 37. The most important distinguishing feature affecting the BI values was the positive values of the b* parameter, which indicated the share of yellow. A high correlation (r = 0.92) was found between the BI and b* values of the vacuum-impregnated apple cubes. In the case of the sample before impregnation, this correlation was lower (r = 0.73). The correlation between BI and a* values was noted only for fresh samples before impregnation (r = 0.69). There was no correlation between BI and L* values. Among the cultivars tested, the lowest BI values were found in Cortland and Ligol. These cultivars were characterized by light flesh (L* = 62 and 65.2, respectively) and low susceptibility to tissue browning. Biegańska-Marecik & Czapski [39] indicate these cultivars are characterized by the white or green-white color of the flesh. The b* values of these samples were low, both before and after impregnation. The Shampion cultivar was characterized by a low BI value before VI. In the studies of Biegańska-Marecik & Czapski [39] and Jabłońska-Ryś et al. [35] apples of this cultivar are indicated as very little susceptible to the enzymatic browning process.

3.3. Changes in pH Value and Soluble Solids Content

The pH and soluble solids values, as well as their ratio, can have a significant impact on the taste of the apple. Therefore, the influence of the VI process on the above-mentioned parameters is very important. Table 3 shows the values of pH and soluble solids content before and after the VI process for cubes obtained from different cultivars of apples. A water solution close to isotonic was used, consisting of 0.5% ascorbic acid, 0.5% citric acid, and 10% sucrose, was used for the impregnation of the cubes. The pH values of fresh apples ranged from 3.25 (Boskoop cultivar) to 4.18 (Gala cultivar). These pH values were in a similar range to 3.36–3.78, detected by Biegańska-Marecik and Czapski [39], and 3.40–4.16, detected by Wu et al. [5]. A significant decrease in the pH value, reached around 20–30%, as a result of VI was noted in the case of cubes obtained from the following cultivars: Gala, Jonagold, and Jonagored. A decrease in pH value from 7 to even 30% as a result of VI of pepper, eggplants, and mushrooms with a lactic acid solution was also obtained by Derossi et al. [40,41,42]. These results also confirmed that VI treatments allowed improving pH reduction in samples in comparison to traditional dipping acidifying. In turn, the content of the soluble solids in the fresh apple cubes ranged from 10.9% for the Gala to 14.8% for the Red Jonaprince. These values are in a similar range (10.0%−16.8%) as other findings [4,5,39]. After VI, a significant decrease in soluble solids content was noted in the following cultivars: Boskoop, Cortland, Gala Must, Golden Delicious, Jonagold, Lobo, Red Jonaprince, and Shampion. The decrease ranged from 4.5% to 13.5%. In the case of the Gala cultivar with the lowest content of soluble solids, a slight increase was found, but it was not statistically significant. As in the case of the pH value, changes in the soluble solids content after VI were not directly affected by the initial soluble solids content in the raw material. Soluble solids of the impregnation liquid were close to isotonic. As found by Xie and Zhao [43] using the VI process of apples with 50% fructose corn syrup, differences in soluble solids content could lead to approximately 6% moisture loss and a 5.5% gain in soluble solids. However, the changes in these properties were just 1.5% for samples impregnated with 20% fructose corn syrup. In the VI process, the mass exchange is mainly caused by the mechanically induced pressure difference. The difference in osmotic pressure between the tissue and the solution plays a minor role in saturation compared to the mechanical properties of the tissue, such as porosity, size and shape of pores, connectivity, tortuosity, and capillary curvatures [44]. However, osmosis could occur if the impregnation process was prolonged. The effect of the osmosis phenomenon on the content of soluble solids in the tissue was observed during cranberry impregnation with the relaxation time extended to 30 min [27].
Harker et al. [45] studied the influence of pH and soluble solids content on the sensory characteristics of apples. They found that differences in pH values by 0.14 or soluble solids content by 1.38 could be identified as a change in sour taste. At the same time, sweet taste changes could be noticed when the difference in pH value is 0.25 and in soluble solids content is 0.99. VI of tested apples, in most cases, causes a greater difference in the pH value than 0.14. The exceptions are cultivars: Lobo, Red Jonaprice, Shampion, and Topaz. In the case of the soluble solids content, a difference greater than 0.99 was recorded for the following cultivars: Boskop, Cortland, Golden Delicious, and Red Jonaprice. Therefore, it seems that the apple impregnation process could cause changes in taste and, depending on their further use, should be subjected to sensory evaluation.

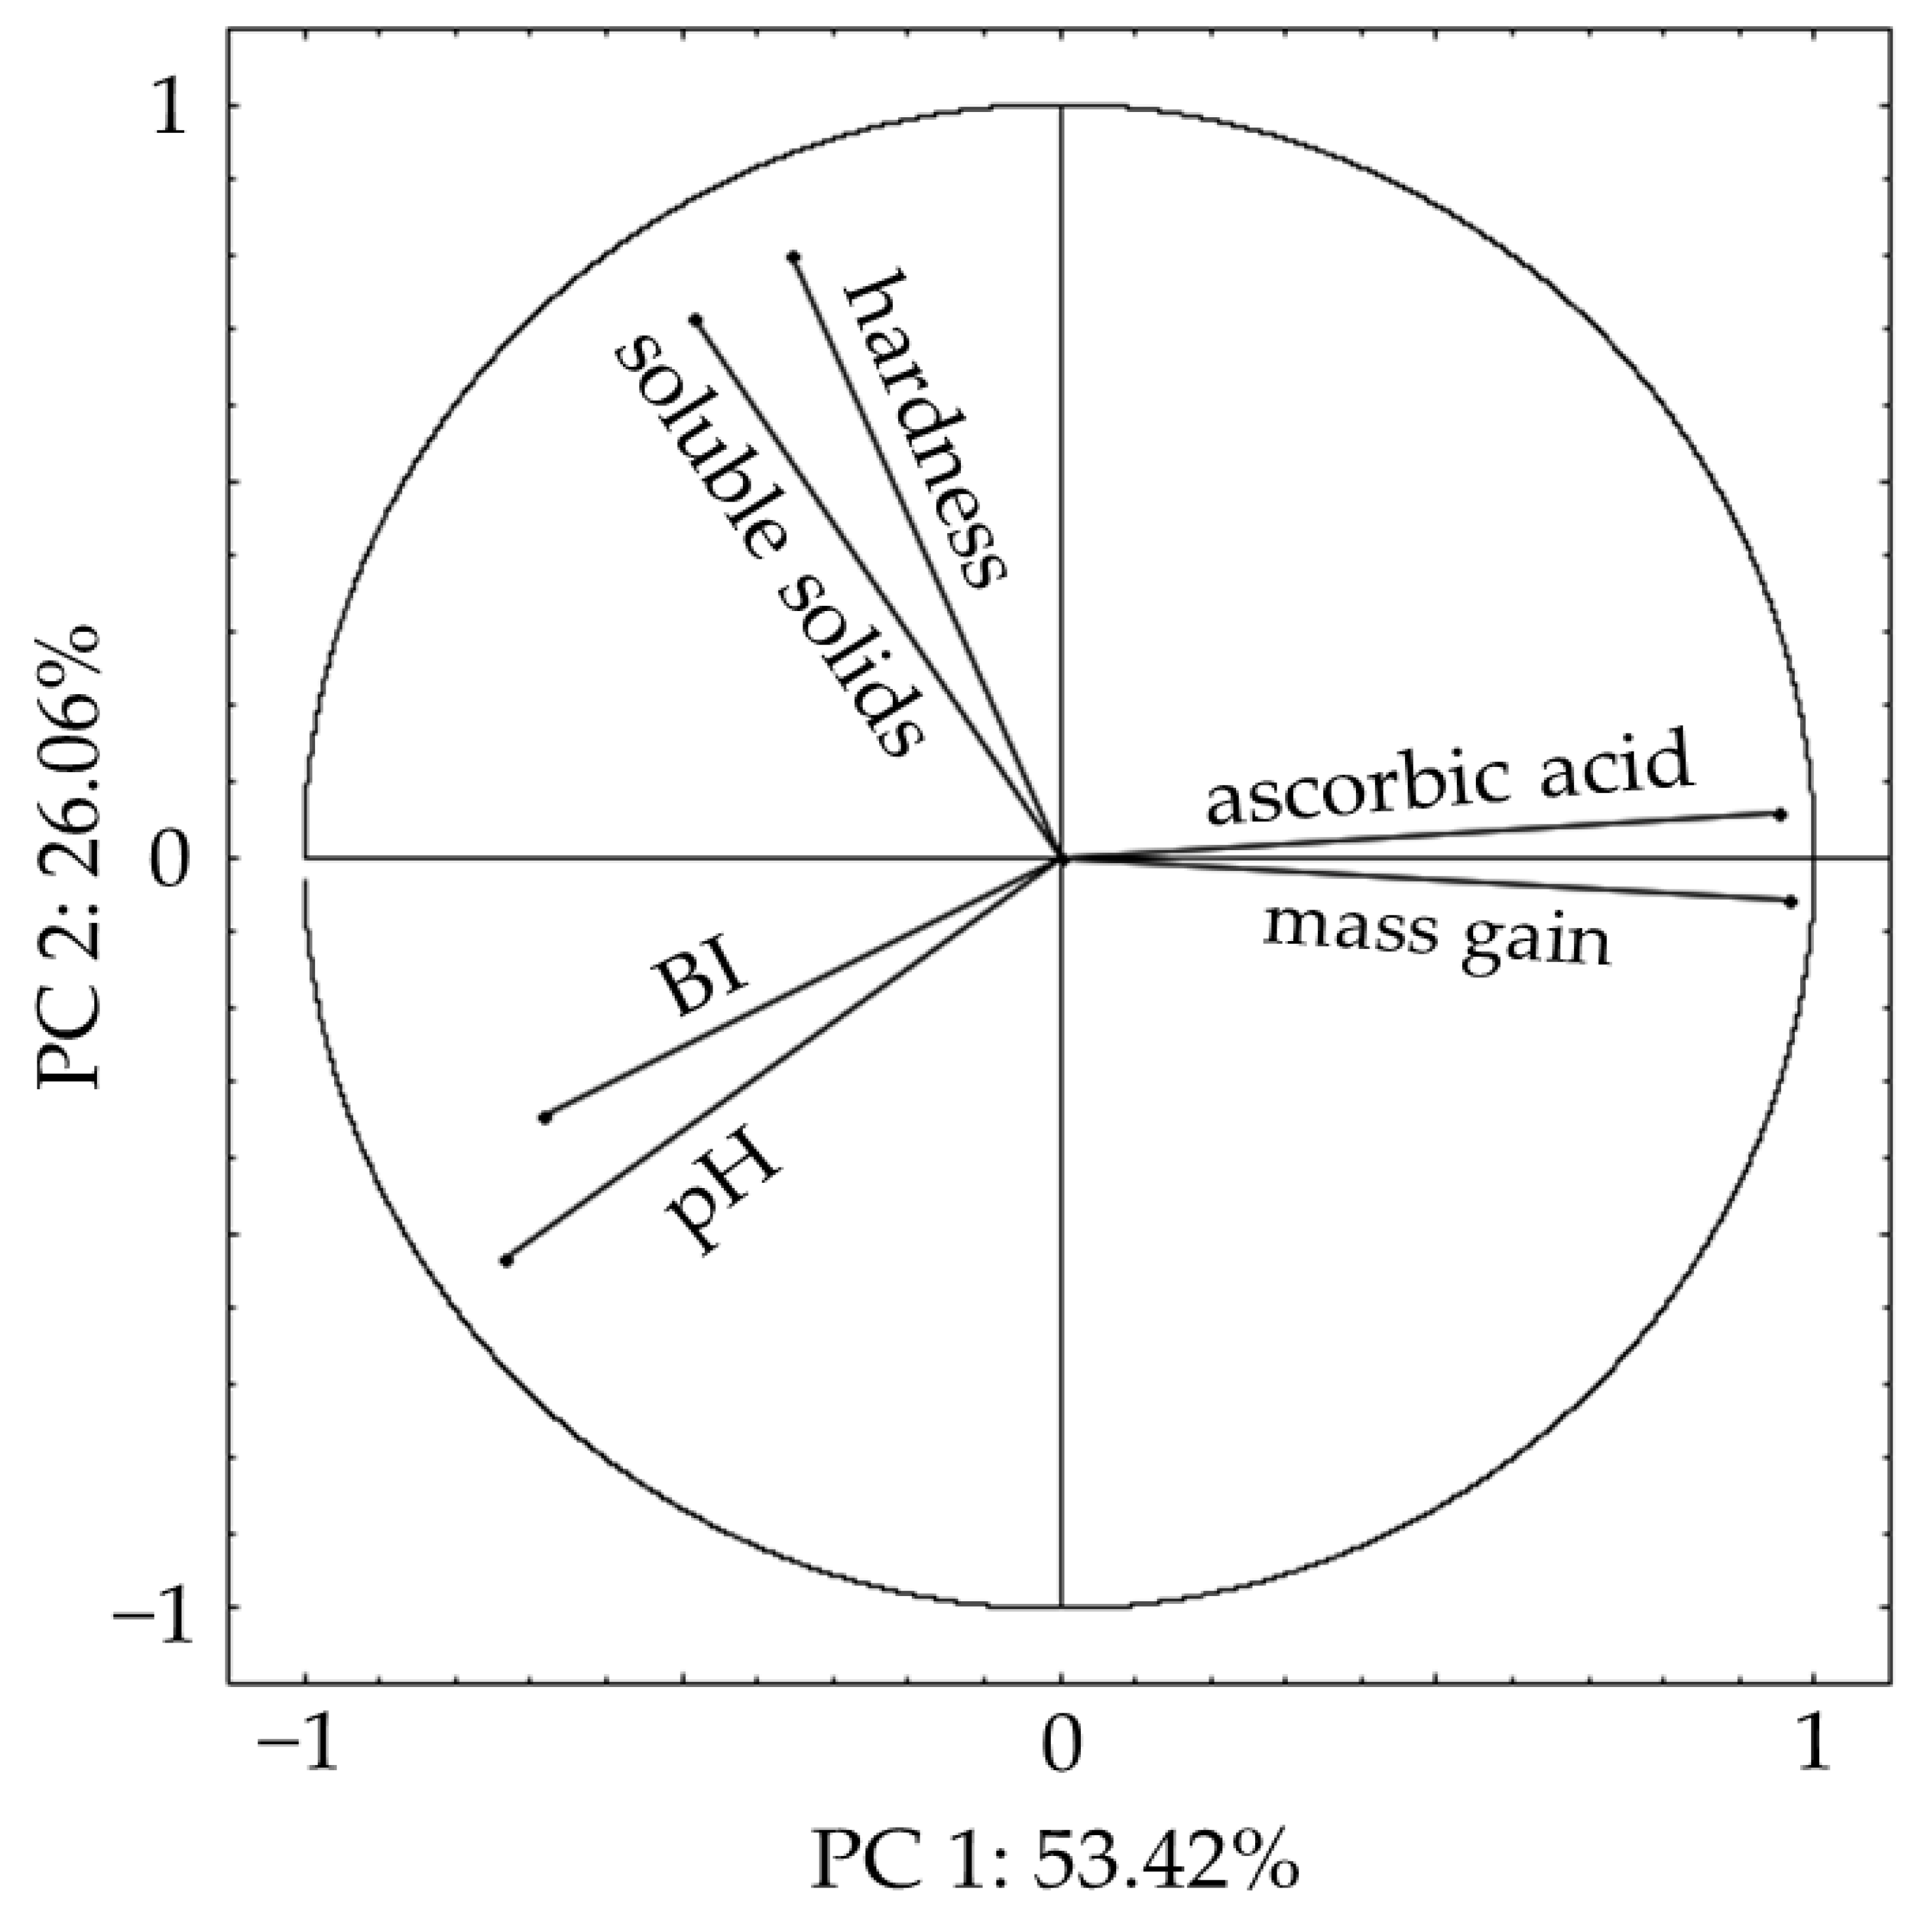
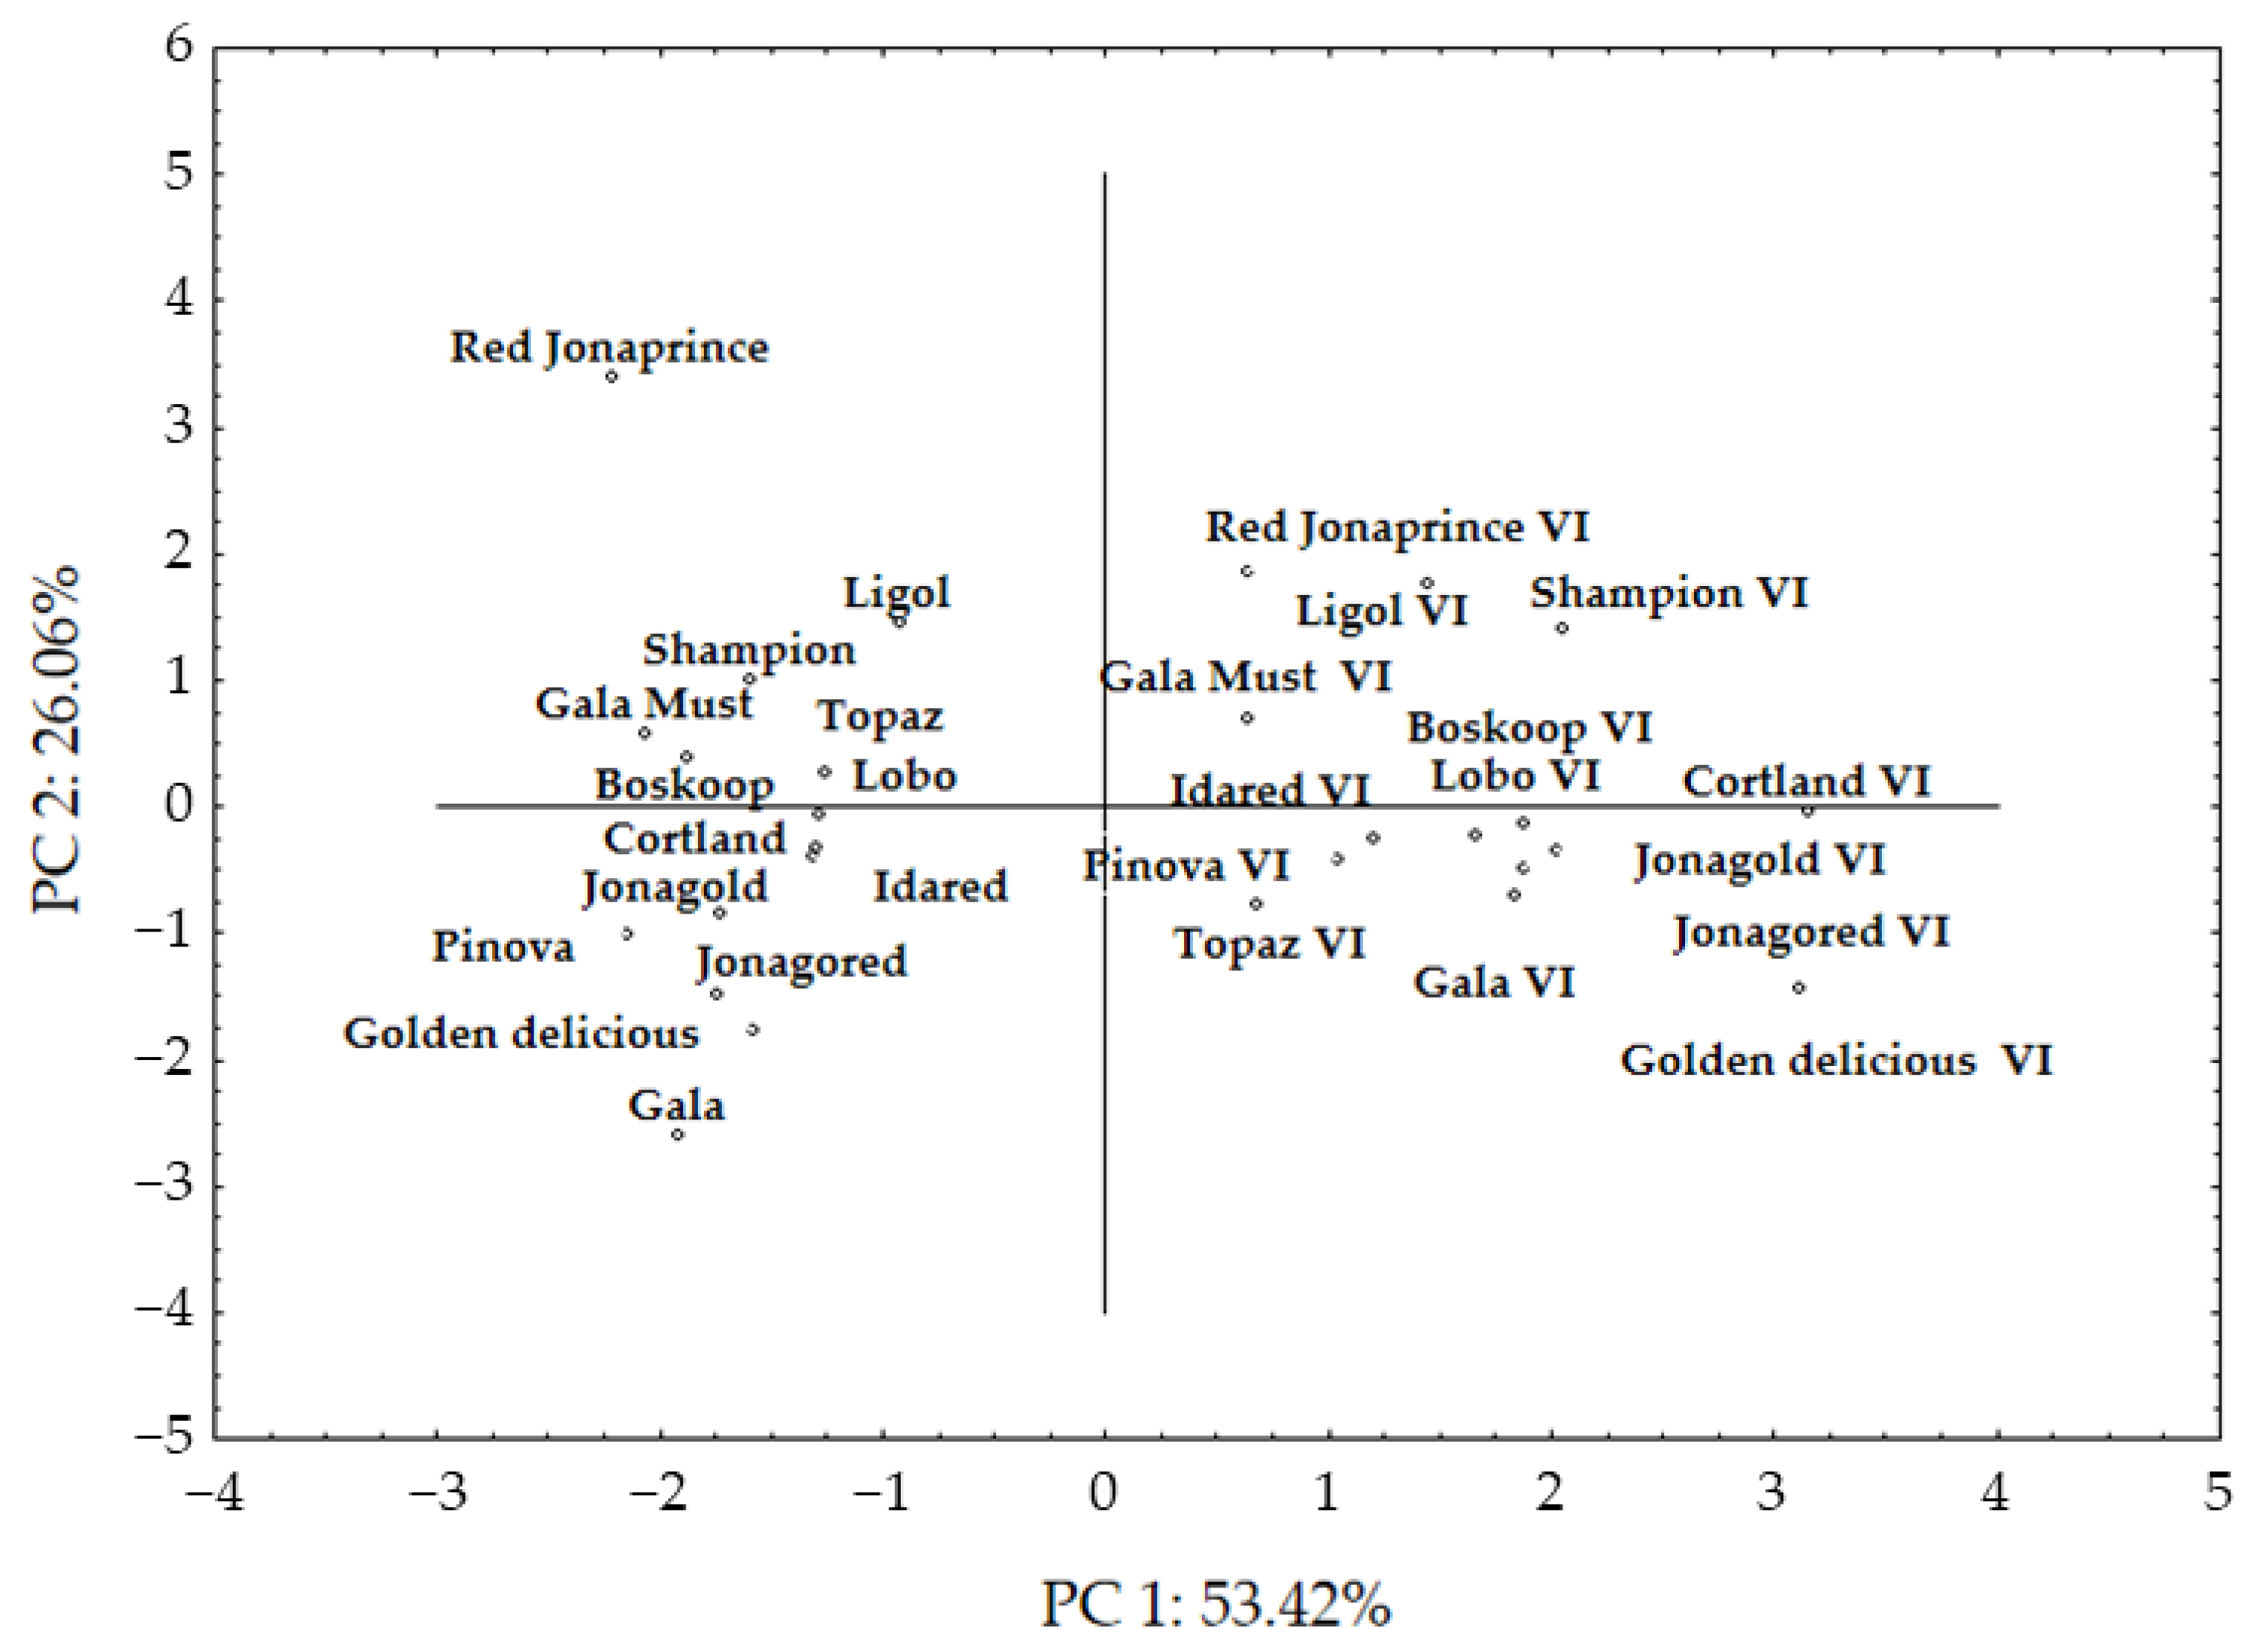
3.4. Principal Component Analysis (PCA)

Principal component analysis transforms the original measured variable into new non-correlated components. Based on the correlation matrix (Figure 2 and Figure 3), two principal components were identified, explaining 79.5% total variability, 56.51% variation for PC1, and 26.06% for PC2. PC1 was positively correlated with ascorbic acid content and mass gain but negatively with pH value and browning index. The influence of the ascorbic acid content on the susceptibility of various apple cultivars to browning is indicated, among others, by Jabłońska-Ryś et al. [35]. In turn, PC2 was positively correlated with hardness and soluble solids content (Figure 2). VI of apple cubes of different cultivars contributes to the increase in ascorbic acid content, decrease in the browning index, pH value, soluble solids content and firmness (Figure 3). The PCA scores plots indicate that the cultivars with favorable characteristics of apple cubes after the impregnation process in terms of vitamin C content, hardness, and browning index are Cortland, Shampion, and Ligol (Figure 3).

4. Conclusions

The selection of suitable cultivars for the VI process could be an effective approach to increase the efficiency of the process and the quality of the product. As a result of the VI process of cubes of 14 apple cultivars, an attractive form of fruit enriched with vitamin C was obtained. Nowadays, the recommended daily allowance (RDA) of vitamin C for adults 19 years of age or older is 90 mg per day for men and 75 mg for women. So, it is interesting to note that the consumption of a 100 g serving of apple cubes after VI could cover even more than 100% of this recommendation for this population because the highest ascorbic acid content after VI reached approximately 130 mg/100 g.
The result of this study indicates that the initial firmness of the sample strongly influenced the amount of liquid incorporated into the tissue. This, in turn, indicated a higher ascorbic acid content, a lower pH, and a lower BI after VI. However, the tested parameters could not explain all dependencies and suggested that mass transfer was not only forced by the hydrodynamic mechanism. It could also be limited by such factors as different properties of the tissue of particular cultivars, such as its juiciness, size and shape of pores, connectivity, tortuosity and capillary curvatures. More research in this field is needed.
VI could contribute to preventing color deterioration and browning after cutting apple tissue, but the initial color of the apples is not retained. Furthermore, excessive softening of the apple tissue after impregnation, especially noted for apples with an initially softer texture, may be a disadvantage for its longer storage, e.g., in the form of a minimally processed product, but it will still be suitable for preservation by drying.

Author Contributions

M.K.: conceptualization, methodology, investigation, formal analysis, writing-original draft, writing-review and editing, supervision, funding acquisition. E.R.-K.: conceptualization, methodology, investigation, formal analysis, writing-original draft, writing-review and editing, supervision, funding acquisition. R.B.-M.: conceptualization, methodology, investigation, formal analysis, writing-original draft, writing-review and editing, supervision, funding acquisition. P.Ł.K.: methodology, investigation, writing-review, and editing. All authors have read and agreed to the published version of the manuscript.

Funding

This research was funded by Polish National Centre for Research and Development project number POIR.01.01.01-00-0146/17-00.

Institutional Review Board Statement

Not applicable.

Informed Consent Statement

Not applicable.

Data Availability Statement

Data are available from the authors on request.

Acknowledgments

The authors would like to thank the colleagues in the Department of Food Technology of Plant Origin and anonymous reviewers for their comments that helped to improve this paper.

Conflicts of Interest

The authors declare no conflict of interest.

References

  1. FAO Food and Agriculture Organization of the United Nations. FAOSTAT Statistical Database. Available online: https://www.fao.org/faostat/en/ (accessed on 21 November 2022).
  2. Soler, C.; Soriano, J.M.; Mañes, J. Apple-products phytochemicals and processing: A review. Nat. Prod. Commun. 2009, 4, 659–670. [Google Scholar] [CrossRef] [PubMed] [Green Version]
  3. Markowski, J.; Płocharski, W. Determination of Phenolic Compounds in Apples and Processed Apple Products. J. Fruit Ornam. Plant Res. 2006, 14, 133–142. [Google Scholar]
  4. Podsędek, A.; Wilska-Jeszka, J.; Anders, B.; Markowski, J. Compositional Characterisation of Some Apple Varieties. Eur. Food Res. Technol. 2000, 210, 268–272. [Google Scholar] [CrossRef]
  5. Wu, J.; Gao, H.; Zhao, L.; Liao, X.; Chen, F.; Wang, Z.; Hu, X. Chemical compositional characterization of some apple cultivars. Food Chem. 2007, 103, 88–93. [Google Scholar] [CrossRef]
  6. Radziejewska-Kubzdela, E.; Biegańska-Marecik, R.; Kidoń, M. Applicability of Vacuum Impregnation to Modify Physico-Chemical, Sensory and Nutritive Characteristics of Plant Origin Products—A Review. Int. J. Mol. Sci. 2014, 15, 16577–16610. [Google Scholar] [CrossRef] [PubMed] [Green Version]
  7. Betoret, N.; Puente, L.; Díaz, M.J.; Pagán, M.J.; García, M.J.; Gras, M.L.; Martínez-Monzó, J.; Fito, P. Development of probiotic-enriched dried fruits by vacuum impregnation. J. Food Eng. 2003, 56, 273–277. [Google Scholar] [CrossRef]
  8. Zhao, Y.; Xie, J. Practical applications of vacuum impregnation in fruit and vegetable processing. Trends Food Sci. Technol. 2004, 15, 434–451. [Google Scholar] [CrossRef]
  9. Derossi, A.; De Pilli, T.; Severini, C. The Application of Vacuum Impregnation Techniques in Food Industry. In Scientific, Health and Social Aspects of the Food Industry; Benjamin, V., Ed.; InTech: London, UK, 2012; pp. 25–56. [Google Scholar]
  10. The European Market Potential for Apples. Available online: https://www.cbi.eu/market-information/fresh-fruit-vegetables/apples/market-potential (accessed on 5 December 2022).
  11. Tamer, C.E.; Çopur, Ö.U. Use of Vacuum Impregnation for Minimally Processed Fruits and Vegetables. In VI International Postharvest Symposium; Erkan, M., Aksoy, U., Eds.; INT SOC Horticultural Science: Leuven, Belgium, 2010; pp. 577–582. [Google Scholar]
  12. Chiralt, A.; Fito, P.; Barat, J.M.; Andrés, A.; González-Martínez, C.; Escriche, I.; Camacho, M.M. Use of vacuum impregnation in food salting process. J. Food Eng. 2001, 49, 141–151. [Google Scholar] [CrossRef]
  13. Xie, J.; Zhao, Y. Improvement of physicochemical and nutritional qualities of frozen Marionberry by vacuum impregnation pretreatment with cryoprotectants and minerals. J. Hortic. Sci. Biotechnol. 2003, 78, 248–253. [Google Scholar] [CrossRef]
  14. Velickova, E.; Tylewicz, U.; Rosa, M.D.; Winkelhausen, E.; Kuzmanova, S.; Galindo, F.G. Effect of vacuum infused cryoprotectants on the freezing tolerance of strawberry tissues. LWT Food Sci. Technol. 2013, 52, 146–150. [Google Scholar] [CrossRef]
  15. Martínez-Monzó, J.; Martínez-Navarrete, N.; Chiralt, A.; Fito, P. Mechanical and Structural Changes in Apple (Var. Granny Smith) Due to Vacuum Impregnation with Cryoprotectants. J. Food Sci. 1998, 63, 499–503. [Google Scholar] [CrossRef]
  16. Sham, P.W.Y.; Scaman, C.H.; Durance, T.D. Texture of Vacuum Microwave Dehydrated Apple Chips as Affected by Calcium Pretreatment, Vacuum Level, and Apple Variety. J. Food Sci. 2001, 66, 1341–1347. [Google Scholar] [CrossRef]
  17. Fito, P.; Andrés, A.; Chiralt, A.; Pardo, P. Coupling of hydrodynamic mechanism and deformation-relaxation phenomena during vacuum treatments in solid porous food-liquid systems. J. Food Eng. 1996, 27, 229–240. [Google Scholar] [CrossRef]
  18. Roa, V.; Tapia, M.S.; Millán, F. Mass Balances in Porous Foods Impregnation. J. Food Sci. 2001, 66, 1332–1336. [Google Scholar] [CrossRef]
  19. Mendoza, F.; Verboven, P.; Ho, Q.T.; Kerckhofs, G.; Wevers, M.; Nicolaï, B. Multifractal properties of pore-size distribution in apple tissue using X-ray imaging. J. Food Eng. 2010, 99, 206–215. [Google Scholar] [CrossRef]
  20. Schulze, B.; Peth, S.; Hubbermann, E.M.; Schwarz, K. The influence of vacuum impregnation on the fortification of apple parenchyma with quercetin derivatives in combination with pore structures X-ray analysis. J. Food Eng. 2012, 109, 380–387. [Google Scholar] [CrossRef]
  21. Neri, L.; Biase, L.D.; Sacchetti, G.; Mattia, C.D.; Santarelli, V.; Mastrocola, D.; Pittia, P. Use of vacuum impregnation for the production of high quality fresh-like apple products. J. Food Eng. 2016, 179, 98–108. [Google Scholar] [CrossRef]
  22. Rößle, C.; Brunton, N.; Gormley, T.R.; Butler, F. Quality and antioxidant capacity of fresh-cut apple wedges enriched with honey by vacuum impregnation. Int. J. Food Sci. Technol. 2011, 46, 626–634. [Google Scholar] [CrossRef]
  23. Martínez-Monzó, J.; Barat, J.M.; González-Martínez, C.; Chiralt, A.; Fito, P. Changes in thermal properties of apple due to vacuum impregnation. J. Food Eng. 2000, 43, 213–218. [Google Scholar] [CrossRef]
  24. Yılmaz, F.M.; Ersus Bilek, S. Natural colorant enrichment of apple tissue with black carrot concentrate using vacuum impregnation. Int. J. Food Sci. Technol. 2017, 52, 1508–1516. [Google Scholar] [CrossRef]
  25. Guillemin, A.; Degraeve, P.; Noël, C.; Saurel, R. Influence of impregnation solution viscosity and osmolarity on solute uptake during vacuum impregnation of apple cubes (var. Granny Smith). J. Food Eng. 2008, 86, 475–483. [Google Scholar] [CrossRef]
  26. Guz, T.; Rydzak, L.; Domin, M. Influence of Selected Parameters and Different Methods of Implementing Vacuum Impregnation of Apple Tissue on Its Effectiveness. Processes 2020, 8, 428. [Google Scholar] [CrossRef] [Green Version]
  27. Mierzwa, D.; Szadzińska, J.; Radziejewska-Kubzdela, E.; Biegańska-Marecik, R.; Kidoń, M.; Gapiński, B. Effectiveness of cranberry (Vaccinium macrocarpon, cv. Pilgrim) vacuum impregnation: The effect of sample pretreatment, pressure, and processing time. Food Bioprod. Process. 2022, 134, 223–234. [Google Scholar] [CrossRef]
  28. Mújica-Paz, H.; Valdez-Fragoso, A.; López-Malo, A.; Palou, E.; Welti-Chanes, J. Impregnation and osmotic dehydration of some fruits: Effect of the vacuum pressure and syrup concentration. J. Food Eng. 2003, 57, 305–314. [Google Scholar] [CrossRef]
  29. Howard, L.A.; Wong, A.D.; Perry, A.K.; Klein, B.P. β-Carotene and Ascorbic Acid Retention in Fresh and Processed Vegetables. J. Food Sci. 1999, 64, 929–936. [Google Scholar] [CrossRef]
  30. Hironaka, K.; Kikuchi, M.; Koaze, H.; Sato, T.; Kojima, M.; Yamamoto, K.; Yasuda, K.; Mori, M.; Tsuda, S. Ascorbic acid enrichment of whole potato tuber by vacuum-impregnation. Food Chem. 2011, 127, 1114–1118. [Google Scholar] [CrossRef]
  31. Mejía-Águila, R.A.; Aguilar-Galvez, A.; Chirinos, R.; Pedreschi, R.; Campos, D. Vacuum impregnation of apple slices with Yacon (Smallanthus sonchifolius Poepp. \& Endl) fructooligosaccharides to enhance the functional properties of the fruit snack. Int. J. Food Sci. Technol. 2021, 56, 392–401. [Google Scholar]
  32. Pasławska, M.; Stępień, B.; Nawirska-Olszańska, A.; Sala, K. Studies on the Effect of Mass Transfer in Vacuum Impregnation on the Bioactive Potential of Apples. Molecules 2019, 24, 3533. [Google Scholar] [CrossRef] [Green Version]
  33. Igual, M.; Castelló, M.L.; Ortolá, M.D.; Andrés, A. Influence of vacuum impregnation on respiration rate, mechanical and optical properties of cut persimmon. J. Food Eng. 2008, 86, 315–323. [Google Scholar] [CrossRef]
  34. Laurindo, J.B.; Stringari, G.B.; Paes, S.S.; Carciofi, B.A.M. Experimental Determination of the Dynamics of Vacuum Impregnation of Apples. J. Food Sci. 2007, 72, E470–E475. [Google Scholar] [CrossRef]
  35. Jabłońska-Ryś, E.; Gustaw, W.; Latoch, A. Ocena przydatności technologicznej wybranych odmian jabłek pod względem potencjału brązowienia. Żywność. Nauka. Technologia. Jakość 2014, 1, 114–123. [Google Scholar]
  36. Pasławska, M.; Stępień, B.; Nawirska-Olszańska, A.; Maślankowski, R.; Rydzak, L. Effect of Vacuum Impregnation on Drying Kinetics and Selected Quality Factors of Apple Cubes. Int. J. Food Eng. 2017, 13, 1–16. [Google Scholar] [CrossRef]
  37. Tappi, S.; Velickova, E.; Mannozzi, C.; Tylewicz, U.; Laghi, L.; Rocculi, P. Multi-Analytical Approach to Study Fresh-Cut Apples Vacuum Impregnated with Different Solutions. Foods 2022, 11, 488. [Google Scholar] [CrossRef] [PubMed]
  38. González-Pérez, J.E.; Jiménez-González, O.; Ramírez-Corona, N.; Guerrero-Beltrán, J.A.; López-Malo, A. Vacuum impregnation on apples with grape juice concentrate: Effects of pressure, processing time, and juice concentration. Innov. Food Sci. Emerg. Technol. 2022, 77, 102981. [Google Scholar] [CrossRef]
  39. Biegańska-Marecik, R.; Czapski, J. Porównanie przydatności odmian jabłek do produkcji plastrów o małym stopniu przetworzenia. Acta Sci. Polonarum. Technol. Aliment. 2003, 2, 115–127. [Google Scholar]
  40. Derossi, A.; Pilli, T.; Severini, C. Application of Vacuum Impregnation Techniques to Improve the pH Reduction of Vegetables: Study on Carrots and Eggplants. Food Bioprocess Technol. 2013, 6, 3217–3226. [Google Scholar] [CrossRef]
  41. Derossi, A.; Pilli, T.D.; Severini, C. Application of pulsed vacuum acidification for the pH reduction of mushrooms. LWT Food Sci. Technol. 2013, 54, 585–591. [Google Scholar] [CrossRef]
  42. Derossi, A.; Pilli, T.D.; Severini, C. Reduction in the pH of vegetables by vacuum impregnation: A study on pepper. J. Food Eng. 2010, 99, 9–15. [Google Scholar] [CrossRef]
  43. Xie, J.; Zhao, Y. Nutritional enrichment of fresh apple (Royal Gala) by vacuum impregnation. Int. J. Food Sci. Nutr. 2003, 54, 387–398. [Google Scholar] [CrossRef]
  44. Galindo, F.G.; Yusof, N.L. New insights into the dynamics of vacuum impregnation of plant tissues and its metabolic consequences. J. Sci. Food Agric. 2015, 95, 1127–1130. [Google Scholar] [CrossRef]
  45. Harker, F.R.; Marsh, K.B.; Young, H.; Murray, S.H.; Gunson, F.A.; Walker, S.B. Sensory interpretation of instrumental measurements 2: Sweet and acid taste of apple fruit. Postharvest Biol. Technol. 2002, 24, 241–250. [Google Scholar] [CrossRef]
Figure 1. Relationship between mass gain and firmness of apple cubes before VI.
Applsci 13 01528 g001
Figure 2. PCA loading plot.
Applsci 13 01528 g002
Figure 3. PCA score plot.
Applsci 13 01528 g003
Table 1. Ascorbic acid content and firmness before and the after VI and mass gain of the apple cubes.
Apple CultivarAscorbic Acid Content (mg/100 g)Firmness (kG)Mass Gain (%)
BeforeAfterBeforeAfter
Boskoop25.2 ± 1.6 d84 ± 7 gh12.3 ± 0.5 abc6.0 ± 0.5 a32 ± 4 cd
Cortland5.0 ± 0.5 a124 ± 3 l12.2 ± 1.1 abc8.5 ± 0.7 ab28 ± 3 bcd
Gala5.0 ± 0.3 a85 ± 4 ghi12.1 ± 1.4 abc8.5 ± 0.9 ab23 ± 3 abcd
Gala Must11 ± 4 abc77.4 ± 1.8 fg35 ± 2 fgh30 ± 3 cdefgh15 ± 4 a
Golden Delicious16.0 ± 1.3 cd130 ± 1 l11.3 ± 0.5 abc6.3 ± 0.5 a34 ± 4 d
Idared7.0 ± 1.0 abc63 ± 3 e21.9 ± 0.8 abcdef19 ± 2 abcdef21 ± 4 abc
Jonagold16.0 ± 0.8 cd96 ± 4 jk12.6 ± 0.7 abcd9.5 ± 0.7 ab26 ± 4 abcd
Jonagored10 ± 2 abc89.2 ± 1.3 hijk11.8 ± 0.8 abc6.7 ± 0.4 a23 ± 3 abcd
Ligol4.7 ± 0.3 a79 ± 9 fg32 ± 3 efgh30.5 ± 1.5 defgh17 ± 3 ab
Lobo11.5 ± 0.8 abc86 ± 4 ghij15.0 ± 0.8 abcde11.3 ± 0.4 ab25 ± 2 abcd
Pinova13.0 ± 1.4 abc95 ± 4 ijk17.5 ± 1.3 abcde14.4 ± 1.3 abcdef24 ± 4 abcd
Red Jonaprince10.5 ± 1.5 abc97.5 ± 1.5 k43 ± 3 gh35 ± 4 fgh15 ± 2 a
Shampion6.0 ± 1.0 ab128 ± 2 l25.6 ± 1.6 bcdefg25.9 ± 1.3 bcdefg21 ± 6 abc
Topaz15.0 ± 0.8 bc73.5 ± 0.9 f25.6 ± 1.6 bcdefg13.8 ± 0.9 abcd20 ± 4 ab
Values are mean ± standard deviation; the different letters within a given parameter indicate a significant difference at p < 0.05 for the two-way ANOVA and Tukey post-hoc test means comparisons.
Table 2. Color parameters of apple cubes before and after VI.
Apple CultivarL*a*b*BIΔE
BeforeAfterBeforeAfterBeforeAfterBeforeAfter
Boskoop54 ± 5 cdefg41 ± 3 ab7 ± 2 i1.8 ± 0.5 bcdefg22 ± 3 jkl11 ± 2 absdef61 ± 5 k34 ± 4 cdefgh19 ± 3 bcd
Cortland62 ± 4 fgh47 ± 4 bcd4 ± 2 fgh0.5 ± 0.4 abcdef18 ± 3 ghijkl7.1 ± 1.8 a37 ± 6 efghi17 ± 4 a18.5 ± 1.0 bcd
Gala64 ± 2 gh40 ± 2 ab0.1 ± 0.7 abcdef−0.7 ± 0.4 abcd23.8 ± 1.7 l10.6 ± 1.8 abcde45 ± 3 ghij28 ± 5 abcde27.3 ± 0.1 f
Gala Must60 ± 5 efgh46 ± 3 bcd2 ± 2 cdefg−1.0 ± 0.5 abcd22 ± 3 ijkl13.1 ± 1.4 abcdefg46 ± 6 hij30.8 ± 0.6 cdef16 ± 3 abc
Golden Delicious62 ± 5 fgh44 ± 3 abc3 ± 2 defg−0.6 ± 0.5 abcd24.2 ± 1.7 l14 ± 2 bcdefg51.3 ± 1.5 jk35 ± 5 defgh20.5 ± 1.3 cde
Idared55 ± 5 cdefg40 ± 4 ab3.1 ± 1.6 sfgh0.3 ± 0.6 abcdef14.9 ± 1.6 cdefgh10 ± 2 abcde35 ± 2 defgh29 ± 6 abcde15.8 ± 1.1 abc
Jonagold61 ± 4 fgh44 ± 3 abc1.3 ± 0.9 bcdefg−1.2 ± 0.6 abc24 ± 2 l14 ± 3 abcdefg50 ± 3 ijk34 ± 7 cdefgh20.7 ± 0.4 cde
Jonagored51 ± 7 bcdef33 ± 2 a1.6 ± 1.9 bcdefg−0.8 ± 0.3 abcde16 ± 2 defghi7.4 ± 1.4 ab36 ± 4 efghi24 ± 5 abcd20 ± 5 bcde
Ligol65 ± 3 gh46 ± 3 bcd−2.5 ± 0.8 a−1.9 ± 0.4 ab14.5 ± 1.9 cdefgh8.7 ± 1.2 abc22 ± 3 abc17 ± 2 ab20.1 ± 0.4 cde
Lobo60 ± 4 efgh48 ± 6 bcde4.7 ± 1.6 ghi1.0 ± 0.7 abcdef17 ± 2 efghi9.1 ± 1.4 abcd38 ± 4 efghi21.8 ± 1.7 abc14.7 ± 1.3 ab
Pinova56 ± 3 defgh47 ± 4 bcd6.5 ± 1.5 hi0.6 ± 0.9 abcdef23.7 ± 1.9 kl17 ± 3 fghijk62 ± 3 k45 ± 6 ghij12.9 ± 0.3 a
Red Jonaprince65 ± 2 gh46 ± 2 bcd−1.5 ± 0.9 abc−1.4 ± 0.4 abc22.0 ± 1.9 ijkl13.0 ± 1.8 abcdefg39 ± 4 efghij29.9 ± 1.3 bcde20.5 ± 0.2 cde
Shampion68 ± 3 h46 ± 2 bcd−2.5 ± 0.3 a−1.4 ± 0.4 abc20.5 ± 1.5 hijkl13.0 ± 1.8 abcdefg32.2 ± 1.0 cdefg29.9 ± 1.3 bcde23.0 ± 0.8 def
Topaz65 ± 2 gh44 ± 3 abc−1.4 ± 0.4 abc−1.1 ± 0.7 abcd24 ± 2 l12 ± 3 abcdefg43 ± 3 fghij29 ± 6 abcde24.6 ± 0.8 ef
Values are mean ± standard deviation; the different letters within a given parameter indicate a significant difference at p < 0.05 for the two-way ANOVA and Tukey post-hoc test means comparisons.
Table 3. pH and total soluble solids of apple cubes before and after VI.
Apple CultivarspHSoluble Solids (%)
BeforeAfterBeforeAfter
Boskoop3.25 ± 0.02 bc3.07 ± 0.02 abc13.9 ± 0.2 k12.5 ± 0.0 fghi
Cortland3.51 ± 0.02 bcde2.98 ± 0.01 ab12.6 ± 0.2 ghi11.5 ± 0.4 cd
Gala4.18 ± 0.02 e3.20 ± 0.02 bc10.9 ± 0.1 ab11.4 ± 0.1 bc
Gala Must3.64 ± 0.02 bcde3.30 ± 0.02 bcd12.4 ± 0.1 fghi11.8 ± 0.1 cde
Golden Delicious3.75 ± 0.09 cde3.08 ± 0.01 abc11.5 ± 0.2 cd10.5 ± 0.3 a
Idared3.64 ± 0.02 bcde3.25 ± 0.02 bc11.8 ± 0.2 cde11.3 ± 0.1 bc
Jonagold3.66 ± 0.04 bcde3.14 ± 0.00 a12.5 ± 0.1 fghi11.7 ± 0.1 cde
Jonagored4.02 ± 0.00 de3.16 ± 0.02 abc12.0 ± 0.3 def11.8 ± 0.2 cde
Ligol3.35 ± 0.02 bcd3.30 ± 0.02 abc12.5 ± 0.0 fghi12.2 ± 0.0 efgh
Lobo3.49 ± 0.01 bcde3.37 ± 0.02 bcd12.7 ± 0.2 hij12.0 ± 0.2 def
Pinova3.65 ± 0.01 bcde3.27 ± 0.01 bcd12.2 ± 0.2 efgh12.0 ± 0.1 def
Red Jonaprince3.26 ± 0.05 bc3.20 ± 0.01 bc14.8 ± 0.4 l12.8 ± 0.1 ij
Shampion3.53 ± 0.01 bcde3.03 ± 0.01 abc13.2 ± 0.1 j12.3 ± 0.3 def
Topaz3.36 ± 0.01 bcd3.46 ± 0.05 bcde12.1 ± 0.2 efg11.8 ± 0.1 cde
Values are mean ± standard deviation; the different letters within a given parameter indicate a significant difference at p < 0.05 for the two-way ANOVA and Tukey post-hoc test means comparisons.
Disclaimer/Publisher’s Note: The statements, opinions and data contained in all publications are solely those of the individual author(s) and contributor(s) and not of MDPI and/or the editor(s). MDPI and/or the editor(s) disclaim responsibility for any injury to people or property resulting from any ideas, methods, instructions or products referred to in the content.

