Abstract
Living and working in comfort while a building’s energy consumption is kept under control requires monitoring a system’s consumption to optimize the energy performance. The way energy is generally used is often far from optimal, which requires the use of smart meters that can record the energy consumption and communicate the information to an energy manager who can analyze the consumption behavior, monitor, and optimize energy performance. Given that the heating, ventilation, and air conditioning (HVAC) systems are the largest electricity consumers in buildings, this paper discusses the importance of incorporating occupancy data in the energy efficiency analysis and unveils energy inefficiencies in the way the system operates. This paper uses 1-year data of a highly efficient certified office building located in the Houston area and shows the power of self-organizing maps and data analysis in identifying up to 4.6% possible savings in energy. The use of time series analysis and machine-learning techniques is conducive to helping energy managers discover more energy savings.
1. Introduction
Recently, artificial intelligence tools made the leap from a fascinating theory to a distinctive practice to control services with great flexibility and provide a better quality environment in various fields, including the buildings sector. The electricity that powers today’s buildings is supplied by a power grid designed in most cases over 50 years ago: a network comprised of power plants where electricity is produced, transmission lines that transport electricity over long distances, and substations where electrical voltage is conditioned and distributed to consumers through low voltage lines. The increasing electricity demand of the 21st century and the rapid development of information and communications technologies made smart grids emerge as the next-generation power grid aiming to make the current electrical grid more efficient, reliable, secure, and greener [1,2]. Energy efficiency and flexibility will enable smart grids to supply energy to a higher number of buildings without increasing the power generation linearly. In other words, the combination of smart grids with smarter buildings will enable more proactive interactions between the power company and the end user, extending the life of existing generation and transmission resources while supporting the energy transition.
Consequently, a number of territories in the USA have turned to the promotion of smart and high-performance buildings powered by local renewable energy, making Net Zero Energy buildings common, if not a standard [3]. In 2021, the residential and commercial sectors accounted for about 21% and 18%, respectively—39% combined—of total U.S. energy consumption [4]. The 2018 U.S. Energy Information Administration (EIA) Commercial Buildings Energy Consumption Survey highlighted office buildings as the highest electricity consumers. That electricity was mainly used in air conditioning and plug loads accounting for over 80% of the annual total. For example, in the last two years, the Houston Advanced Research Center (HARC), a high-performance LEED Platinum, Energy Start 99/100, and Net Zero-certified office building (located in The Woodlands, TX, USA) had two main electricity consumers, the plug loads and HVAC, account for more than 85% of the total building electricity consumption as presented in Figure 1 [5].
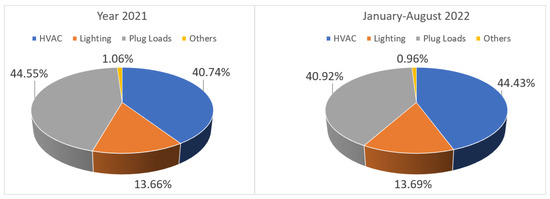
Figure 1.
2021 and 2022 electricity consumption per usage in the HARC building.
Following a 2015 U.S. energy department report [6], various research projects started working on building energy efficiency, aiming to improve the performance of an energy system in parallel to providing the user with a comfortable working environment. In addition to saving energy, optimizing energy usage has other benefits, including climate protection, as less energy implies reducing the fossil fuels demand, which will lower the level of carbon dioxide (CO2) in the atmosphere [7]. To monitor, control, and optimize the performance of their energy system, some buildings are equipped with an Energy Management System (EMS) that plays a vital role in the intelligent handling of energy and real-time demand [8]. To measure inefficiencies in the system, an EMS needs to analyze data produced daily from IoT devices, smart meters, weather data, and other building-related data and help building managers understand the cause of such inefficiencies. EMSs use building data to unveil inefficiencies in the way systems such as HVAC or plug loads are operated, bringing to the attention of building managers situations such as high energy consumption or low system performance [9].
In the past decade, many publications have used various machine learning and statistical techniques that extract knowledge from historical data to analyze the energy efficiency of a building and provide suggestions for redesigning its power configurations [10,11,12,13,14]. Some of the papers published used supervised techniques to predict building energy consumption patterns, which help building managers and owners to measure the impact of new efficient energy technologies or management policies [15,16,17,18,19,20]. On the other hand, some data-driven published work on energy used unsupervised learning techniques, such as clustering, to understand energy consumption profiles of buildings for diversifying tariffs, distribute electricity to buildings based on their level of energy consumption, and group buildings based on the same energy consumption patterns [21,22,23,24,25,26]. Most of the previous work relied on the expertise of the building manager and analyzed the efficiency after collecting data for an extended period. The research question this paper addresses is how a building EMS can identify inefficiencies by analyzing building-related data and make recommendations to the building manager to address those inefficiencies.
To address this research question, our work focuses on the use of unsupervised learning to help energy managers identify and quantify possible energy saving after analyzing building data, including smart meter data. In our earlier work [27], we used one year’s worth of power demand data from the HARC building and showed 1.87% of possible savings in energy using the K-Means clustering algorithm. This early experimentation was among the first to demonstrate the potential impact of unsupervised machine learning in identifying energy inefficiencies and in helping business users gain insight from huge amounts of building data; this paper is a continuation of the work presented in [27]. In this paper, we present how self-organizing maps (SOMs) unsupervised machine-learning algorithm is used to cluster and visualize building-related data to help energy managers easily identify possible energy saving even in a highly efficient energy building.
The main contributions of this paper are to
- Develop an unsupervised learning approach to identify energy inefficiencies in HVAC systems, which will entice the community to use these types of ML technology in other systems such as plug-ins, appliances, and others;
- Show the power of self-organizing maps (SOMs) and data analysis in helping energy managers easily identify HVAC energy inefficiencies;
- Quantify possible energy saving using SOM machine-learning algorithm in the operation of HVAC systems even in a highly efficient LEED, Energy Star, and Net Zero-certified building.
The rest of the paper is organized as follows: Section 2 introduces readers to the SOM algorithm and presents various applications of this clustering algorithm through a literature review. A summary of the data characteristics and the pre-processing methods adopted in a data-driven clustering process is presented in Section 3. Section 4 presents the results of applying SOMs to HARC data. Finally, a conclusion is presented in Section 5, highlighting the outcomes achieved, limitations, and possible solutions.
2. Self-Organizing Maps Applications: Background and Literature Review
Nowadays, the world has become a repository of various data generated from people, phones, computers, and other devices in different formats, varying from pictures, audio files, videos, spreadsheets, and many more. Traditionally, humans used to analyze data, but because the volume of data surpasses the ability of humans to make sense of it, automated systems are urgently needed to help data analysts gain information from data. Machine learning is a field of inquiry that uses a set of computer systems, called models, that can learn inferences and adapt to changes in data without explicit instructions from the programmer [28]. Unsupervised learning is a machine-learning technique used to train an algorithm to analyze data, infer patterns, and discover similarities/differences using unlabeled datasets that are not tagged with labels recognizing their properties. Analyzing data will have a meager value unless the latter is cast into business value, which is beneficial for organizations that start to use unsupervised learning for various applications ranging from data exploration, customer segmentation, anomaly detection recommendation engines, etc. [28].
Segmentation, as an unsupervised learning application, is a technique used to split and cluster data based on their properties, resulting in insights about the intrinsic grouping in a set of unlabeled data. Like segmentation, self-organizing maps or Kohonen Maps are a deep-learning unsupervised technique, introduced by a Finnish researcher named Teuvo Kohonen, used to produce a low dimensional representation (called map) of data with many dimensions while preserving the structure of data. Unlike other artificial neural networks that are trained on labeled data and use error-correction learning for regression or classification purposes, SOM is based on a competitive learning that uses a neighborhood function to cluster unlabeled high-dimensional data while maintaining the topological structure of the input space. To achieve this, SOMs adopt an architecture where various inputs are mapped with weights to various neurons that are in the Kohonen Map; these weights are important as they determine the spatial location of neurons in a 1D or a 2D space. During the SOM training phase, the weights get updated so that the weight vectors for nearby neurons are close in the feature space; consequently, nearby observations in the datasets are assigned to the same neurons or nearby neurons. The iterative changes in the position of the neurons in the map form clusters with a clear structure, which make them easy to visualize. Figure 2 presents a typical architecture of a SOM [29].
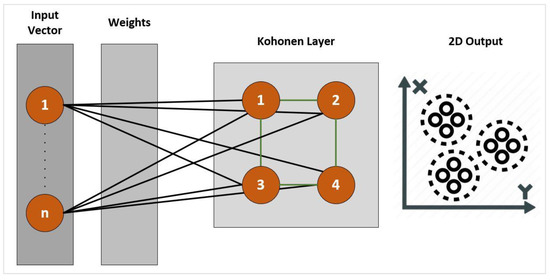
Figure 2.
SOM architecture.
The training algorithm of self-organizing maps can be summarized in five important steps:
- Assign initial weights to each neuron;
- Pick a random input vector X;
- Compare X with the weight assigned to each neuron using a distance metric such as the Euclidean Distance (1). The closet neuron (least distance) is named Best Matching Unit (BMU)
A, B: two points in n-space
n: n-space
- 4.
- Update the weights of the neighboring neurons that are close to the BMU using a learning rate and a neighborhood function that can be optimized using the Bayesian method [30];
- 5.
- Go back to step 2 until the map converges for a given number of iterations or once the weights are not changed.
Given their ability to produce satisfactory clustering results and good visualization of multidimensional data, self-organizing maps have been used by researchers in various application domains, including health, education, energy, psephology, economy, etc. [31,32]. To improve students’ achievements and facilitate the work of teachers in giving instructions, I. Purbasari used self-organizing maps to group newly enrolled students to high schools using their academic grades and managed to partition students into classes based on their abilities and interests. The use of SOMs turned the hourly work of staff into a decision support system that helped in extracting insights from data collected from students’ national examination results and managed to split students’ interests into three main groups, which are natural science, social science, and linguistics with a high interest on the natural science field [33].
In 2018, the World Health Organization reported that cancer was the second leading cause of death, accounting for approximately 9.6 million deaths, with breast cancer being the most common cancer type among women [34]. Scientifically, early diagnosis of cancer along with early treatment will help in the prognosis and treatment of the disease, in which data-driven predictive models can assist. In Ref. [35], N. Shukla used SOMs and a clustering algorithm called Density-Based Spatial Clustering of Application with Noise (DBSCAN) to develop a model using the National Cancer Institute’s Surveillance, Epidemiology and End Results (NCI’s SEER) data to understand breast cancer survivability, identify factors associated with patient survivability, and produce clusters of patients sharing the same properties. The produced clusters, along with the associated patterns, were used to train a multilayer perceptron, which improved the overall cancer survival prediction accuracy. The work presented in [35] is part of evidence-based medicine, where doctors use clinical research evidence to make decisions about the care of patients, provide better treatments, and hence improve clinical performance [36].
Another major cause of death around the world is car accidents; according to the World Health Organization, around 1.35 million people die each year because of road traffic crashes. Unfortunately, according to the 2018 global report, there has been no decrease in the number of road traffic deaths in low-income countries in the past 5 years [37]. To highlight the importance of data analysis and how data mining techniques can improve transportation systems, P. Kasbe presented a survey of various supervised and unsupervised techniques used for road accident analysis [38]. In the same survey, the author compared SOMs to K-Means and how the former excels at better visualization of data, which helps in extracting better patterns when analyzing road accident data, and hence improves the accuracy of the analysis and makes better predictions of accident reasons (human, environmental, or other factors).
Related to the energy sector, the global electricity demand is expected to increase where accurate energy management is essential to forecast energy usage, hence managing energy policy making and energy production. Understanding how a building is operating requires analyzing energy-related data that can be collected from different IoT devices, including smart meters that record energy consumption data and share them with the utility for analysis, to understand energy usage and dispatch electricity into different residential areas based on their level of consumption [39]. To identify customers that are more responsible for peaks in the system, M. Azaza used responsibility factor and consumption variability as input features for two clustering techniques, which are hierarchical clustering and SOMs, for better visualization of customers’ cluster distribution. Identifying customers responsible for peaks in the systems will improve recommendations for energy reductions, assure better dynamic pricing plans, offer economic benefits to consumers, and improve the overall operation of the electrical grid [40].
Demand response is one of the innovative, reliable solutions offered by smart grids aiming to reduce energy consumption without impacting everyday activities. This includes turning off non-essential lighting, adjusting thermostat levels, and using on-site energy-distributed energy resources (such as energy-stored systems) to power critical equipment while still minimizing demand on the grid. Load forecasting is one of the tools that assists in balancing supply and demand, as it can be used to plan and operate the system efficiently. To achieve this, data scientists will have to analyze data collected from multiple sources such as load history, weather data, temporal information (day, hour, holidays, etc.), outage logs, demographic data, etc. [24,41]. To forecast household load consumption, authors in [42] used a methodology referred to as CCF (Cluster, Classify, Forecast) to group daily profiles (using K-Means and SOMs), investigate the relationship between the produced load profiles and weather/temporal data (using a classification and a regression tree), and produce more additional inputs that can be used to feed a Smart Meter-Based Model (SMBM) to learn more about the overall profile shape of the cluster and hence make more accurate forecasting results. The work presented accredits the importance of SOMs in clustering similar daily profiles, presenting the results in a visual map (that includes the number of daily profiles), and revealing the distances between cluster centers to express the similarities and dissimilarities between the resulting groups [43].
On the other hand, J. Yun addressed the importance of analyzing building environment data to propose a new HVAC control strategy that can balance energy use against occupants’ comfort requirements. The work presented in [44] used a set of ZigBee wireless sensor nodes placed in different locations of a laboratory’s wall to collect a 1 min interval temperature and humidity datasets for a period of 1 month. Using K-Means and SOMs, the collected data were used to construct a model for the building environment that was then used to assess the occupants’ comfort level after receiving a social media message (Twitter or Facebook). For instance, if an occupant feels uncomfortable, he/she will notify the HVAC control system that will then use the created model to decide on the cluster to which the current building environment will belong (Comfortable Cluster or Uncomfortable Cluster). In case of an uncomfortable status, the HVAC system will be controlled to move the current building environment condition to the closest cluster that is marked as comfortable.
As noted, most existing work has focused on the ability of SOMs to group data of the same behavior into the same cluster and how it excels at producing a visual map that can reveal relationships between the generated groups. The generated clusters can sometimes be used for classification purposes, as presented in [44]. Our work is different as it discusses the power of SOMs in identifying energy inefficiencies missed by experts, in the way an HVAC is being operated (despite that the building is a highly efficient certified office building) to suggest opportunities to reduce an organization’s energy consumption, keep the same comfort, and save money.
3. Houston Advanced Research Center: Data Description and Exploration
Located in The Woodlands, Texas (USA), the HARC is an 18,600-square-foot office building. It was designed and certified as a LEED Platinum, obtaining a 99/100 Energy Star certification in 2019, 2020, and 2021 and the Net Zero certification in 2020. The climate in the Houston area is characterized as humid subtropical, with August being the warmest month (94.5 F on average) and January being the coldest one (42.2 F on average); high humidity and warm temperatures make the use of an HVAC system a necessity. The HARC building is full-electric, meaning that it only consumes electricity and has no fuel supply or consumption on site.
Despite its by-design efficiency features, the HARC started collecting data related to the building to carry out data analysis, build familiarity with data, extract useful insights, and, most importantly, identify any energy inefficiencies in the way the building energy is operated. To convert collected data (raw data) into useful information and make better decision making, it is important to follow a data analytics process as presented in Figure 3.
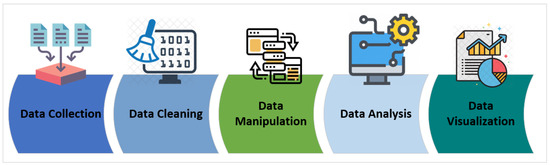
Figure 3.
Data analysis main steps.
3.1. Data Collection
Data collection is a systematic approach meant to gather relevant information from data collected from different sources, which can help to solve a defined problem. To identify inefficiencies in the way their building is operated, the HARC started collecting 1 min power data at different building levels using four meters: lighting plug loads, HVAC, and others. The relevance of the HVAC system in subtropical climates (over 40% of the total energy consumption) is the reason this paper focuses on understanding how the HVAC system is performing. Currently, the HVAC system is controlled by a Building Automation System (BAS), setting a set point that can be changed based on the climate period and whether users will be in the building or not. Assessing the energy performance of an HVAC requires power data from a meter but also in situ measurements (such as the indoor temperature) and relative information (such as climate data); unfortunately, the last two data categories were not available. Given the importance of the outdoor temperature and the number of occupants for our analysis, we collected the outdoor temperature from WILLIAM P. HOBBY AIRPORT STATION weather station as it provides hourly climate data. As for the number of occupants, we used data collected from the access-card system that recorded only the entrance time and assumed that users remained in the building till 17 h30. Because the HARC energy manager changes the scheduled set point value when needed, we decided not to use it in the analysis, as the exact set point values were not available either.
3.2. Data Cleaning
In data science, the quality of the analysis will depend on the quality of data; this is referred to as the concept of garbage-in/garbage-out. Data cleaning is the process of fixing data that may negatively affect the analysis, consequently ending up making wrong decisions. From deleting unnecessary columns to removing corrupted, incorrect, duplicate, or incomplete data, there are various techniques used to fix data impurities that impact the efficiency and accuracy of the analysis [45]. To prepare data for analysis, we took the following data imputation actions for 123 missing rows in the 1 min interval dataset:
- Replaced a missing row with the average of the previous two rows;
- For months where a whole week of data was missing, since the HVAC has a weekly repeated consumption behavior, the energy manager suggested replacing the missing rows with similar day timeslot data and similar outdoor temperature.
3.3. Data Manipulation
Data manipulation is the process of transforming data to produce a more organized and logical dataset through adding new variables, grouping data, selecting different sets of columns, sorting data, etc. Before we used data visualization tools and statistical techniques to uncover initial patterns, we applied the following:
- -
- Changed the sampling rate from a 1 min interval to a 1 h interval (using sum as the aggregation technique) for better visualization of the data;
- -
- We added a time index where each row is tagged with a time index made up of day and hour;
- -
- We added a set of columns representing weekday name, month name, hour, day type (weekday, weekend, or holiday), and timeslot description (no_users, few_users, many_users, or set point change).
Table 1 describes the HARC data before and after wrangling.

Table 1.
HARC data—a description.
3.4. Data Analysis and Visualization
Analyzing data is an important step in the data analysis pipeline that aims at extracting meaningful insights from data, interpreting and presenting data into useful information that can help an organization understand a problem. The first step in data analysis is data exploration, which allows a deep understanding of the dataset and uncovers initial insights/patterns with the help of statistical and graphical techniques. In this paper, we used R as a programming language (version 3.4.4), Linux as the platform, and Tidyverse as an R package meant to make data scientists work more productively by providing effective data manipulation, exploratory data analysis, and visualization tools [46]. Figure 4 shows a sample of the dataset used in the analysis.
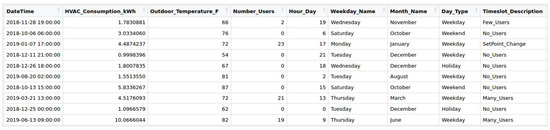
Figure 4.
A sample of the HARC dataset.
Statistically, measuring the spread of a numerical variable describes how scattered data values are and how different they are in comparison to the mean value. Additionally, breaking data into quartiles helps in computing the interquartile range that measures the variability around the median [47]. The median is used to divide data samples into two equal groups, and Table 2 shows that HVAC consumption has a median of 1.8 kWh, which is close to the first quartile and implies a positive skewness; the same applies for the number of users as the difference between the median and the third quartile is quite high (0 to 17). As for the outdoor temperature, we can say that the values have quite a normal distribution around the mean, which is around 71 F. These interpretations are visually represented using the histograms in Figure 5.
Table 2.
A statistical summary of numerical features used in the analysis.
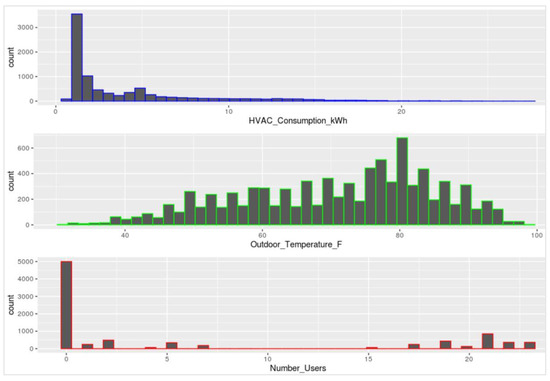
Figure 5.
HARC data frequencies.
To explore the HVAC consumption with respect to the timeslot type (No Users, Few Users, Set Point Change, or Many Users), we grouped data by timeslot type, and we computed the maximum, minimum, and average HVAC consumption as presented in Table 3. Surprisingly, for no users’ timeslot type, the maximum HVAC consumption is more than the many users’ timeslot type, which imposed further analysis.
Table 3.
HVAC consumption with respect to timeslot type.
In addition to exploring the HVAC consumption per timeslot type, we looked at its consumption values with respect to the day type (weekday, holiday, or weekend). One more time and unexpectedly, holiday day type columns showed higher energy consumption compared to weekend values, where some users are in the building on Saturdays. Table 4 is a summary of the results we obtained.
Table 4.
HVAC consumption per day type.
Data visualization is another important practice in the data analysis pipeline, as it transforms information into a visual context that allows the human brain to extract insight from graphs or maps. To view the HVAC consumption per weekday name, we used a variation of the bar chart called the lollipop plot to foreground the HVAC consumption trend over time, as presented in Figure 6. The vertical line in the graphs represents the HVAC consumption mean, which is around 4.16 kWh, and we can see that generally, most of the consumptions are beyond the mean value. Additionally, the HVAC consumption has the same trend during working days (with very few points that have higher values that can be explained by higher outdoor temperature), while for weekend days, and given that some users use the building on Saturdays, we can see higher HVAC consumption in comparison to Sunday, when we expect zero users in the building. Surprisingly, for holidays, Monday to Friday still show high HVAC consumption, which could be explained by some users being in the building even if it is a day off.
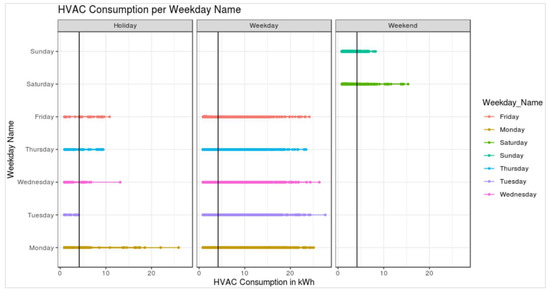
Figure 6.
HVAC consumption per weekday name.
On the other hand, Figure 7 is a collection of subplots representing the HVAC consumption per hour of the day for holidays, weekend, and weekday days. Except for a few points, the working days graph shows expected behavior, as the HVAC consumption shows a high value when the set point is changed, takes some time to stabilize, and follows the same trend after 7:00 as the number of users and outdoor temperature increases from 8:00 to 16:00 and drops starting 17:00. On the other hand, in the other two subplots, we could clearly identify points with high HVAC consumption while the number of users is zero (cyan points); these points are to be investigated in detail in the next section.
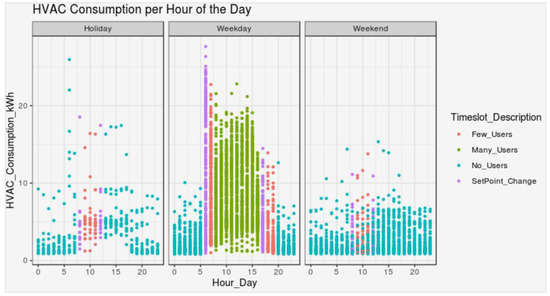
Figure 7.
HVAC consumption per hour of the day.
To graphically visualize the relationship between HVAC consumption and the outdoor temperature, we plot another graph, as shown in Figure 8. Once more, in the subplots holiday and weekend, we can locate points with high HVAC consumption while the outdoor temperature and the number of users are low, which will also be discussed in the next section.
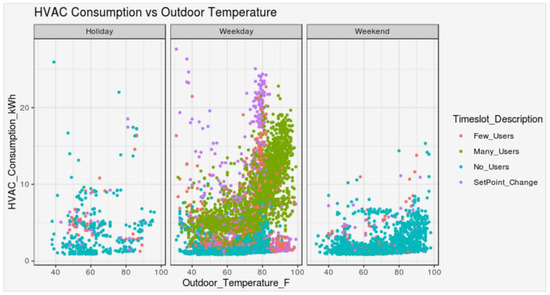
Figure 8.
HVAC consumption vs. outdoor temperature.
Given that we followed a heuristic approach regarding the number of users data, we decided to narrow our analysis to timeslots where we know for sure that the number of users is zero, yet the HVAC consumption exhibits a high-value behavior. The next section discusses the results we obtained after applying self-organizing maps.
4. Application of SOMs on HARC Data: Results and Analysis
Neural networks form the base of deep learning, which is a sub-field of machine learning that uses a set of algorithms that train themselves to recognize complex patterns in data in a way that mimics how a human brain works. There are different types of neural networks, each with its own use; one variant of neural networks is the self-organizing map or Kohonen Map, which is an unsupervised neural network used for dimensionality reduction, clustering, and data visualization. To better understand the HARC dataset, group the unlabeled dataset into a set of clusters, and, most importantly, produce effective visualization of the clustered data, we used SOMs. The ability of SOMs to produce satisfactory groupings/clusters that can be interpreted visually by a data analyst or even an energy manager easily is the main reason why we opted for this clustering technique to identify energy inefficiencies in the way the HVAC is operating. Our focus is to analyze the produced clusters and identify timeslots with energy inefficiencies, as the number of users was zero while the HVAC consumption was still high.
To train the SOM model, we decided to go for a 2 × 2 map where the choice of the number of clusters was selected using different metrics, such as the elbow method discussed in paper [27]. We used the Kohonen package in R, where the learning rate used declined linearly from 0.05 to 0.01 over rlen (the number of times the complete data will be presented in the map) updates [48]. As for the radius, we opted for a value that covers 2/3 of all unit-to-unit distances, which is the default option in the SOM function. The first two SOM graphs generated are called count and codes plots used to graphically represent data partitioned into four clusters using different data characteristics. The first plot, count plot, shows the number of observations assigned to each node as presented in Figure 9. As for the second plot, codes plot or fan diagram, it is used to show how large/small the values of a variable are in each node as presented in Figure 10.
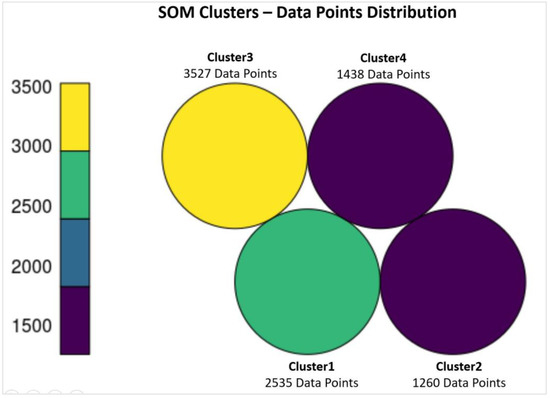
Figure 9.
Data point distribution in SOM clusters.
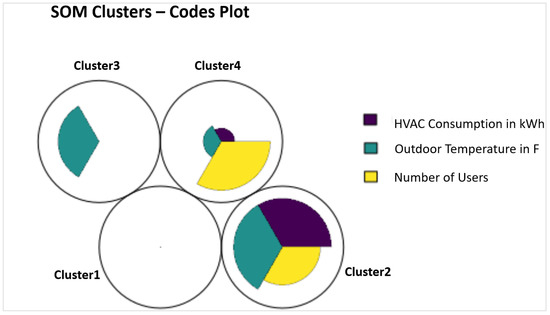
Figure 10.
Data point grouping—fan diagram.
To understand and compare the distribution of the HVAC consumption using the generated clusters, we generated some boxplots that are used to extract various types of information. The SOM generated four clusters with different HVAC consumption distributions, as presented in Figure 11, Figure 12 and Figure 13. From Figure 10 and Figure 11, clusters 1 and 3 are characterized by a low HVAC consumption, which is explained by excluding timeslots where the number of users is high, as presented in Figure 12. The second cluster, cluster2, grouped all types of timeslots of all day types and is characterized by high values of the number of users, Outdoor temperature, and HVAC consumption. Some timeslots in cluster2 have no users, but the HVAC consumption is still high, which requires further analysis. As for the third cluster, which contains most of the data points (3527), the SOM grouped all timeslot types except many users, and generally this cluster also has low values of all the analyzed features, with some potential outliers that we can see outside the whiskers. The whiskers, in a box plot, are the two lines outside the box that go from quartile 1 to minimum and from quartile 3 to maximum, respectively. Finally, for the last cluster, cluster4, we find only weekday times slots where either a set point was changed or the number of users is high, which explains why the HVAC consumption is somehow high. Given that our focus is based on identifying any energy inefficiencies that pertain to timeslots with zero users, we are excluding the fourth cluster.
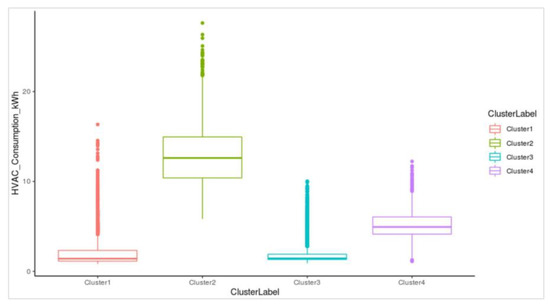
Figure 11.
HVAC consumption per cluster label.
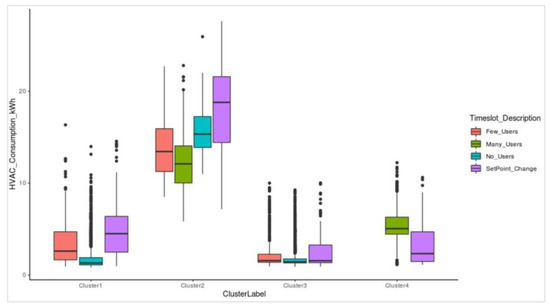
Figure 12.
HVAC consumption by cluster label and timeslot type.
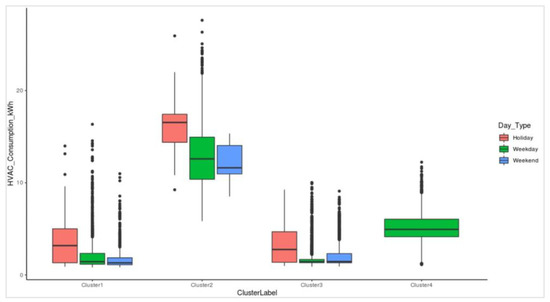
Figure 13.
HVAC consumption by cluster label and day type.
After excluding cluster4, the dataset was reduced to 7322 observations, which we filtered using only the rows corresponding to no_users timeslots, ending up with a dataset of 4999 observations. We applied SOM for the second time to visually highlight energy inefficiencies that may have occurred when the building was empty. Figure 14 shows the obtained results.
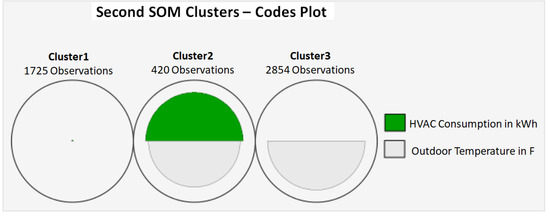
Figure 14.
Second-time SOM-generated clusters.
The second SOM generated three clusters with different distributions of HVAC consumption, as presented in Table 5. The first and the third clusters have an HVAC consumption mean of around 1.6 kWh, grouping data points that are mostly non-working hours (from 18:00 to 5:00); still, the first cluster has some observations with quite a high HVAC consumption and low outdoor temperature, which is explained by heating the building during cold days. Some data points in cluster1 are mapped to holidays, and the HVAC consumption is still relatively high, which could be explained by some users in the building during their days off. As for the third cluster, the grouped observations are non-working hours, but for hot days with an average temperature of 78 F. Finally, the second cluster grouped observations that are mostly not working hours as well, but with peak values of HVAC consumption with an average mean of 6.0 kWh, highlighting potential energy inefficiencies. A sample of these inefficiencies is shown in Figure 15, where the highest HVAC consumption in the whole dataset is mapped to an observation where the building is empty, and the outdoor temperature is low.
Table 5.
HVAC consumption description—second SOM.
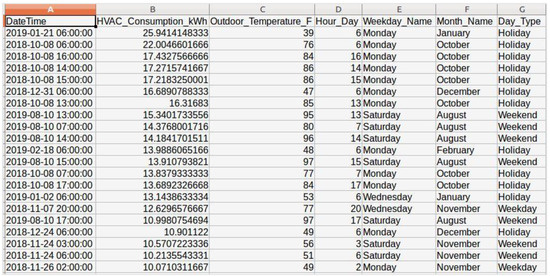
Figure 15.
A sample of timeslots with high HVAC consumption—cluster2.
To quantify the number of kilowatt hours wasted in cluster2, we used the first and the third clusters as the ground truth, but these two clusters have some outliers, and the HVAC consumption distribution is skewed right. Figure 16 is a histogram and a density plot for cluster3 HVAC consumption. Because the distribution is not a normal one, outliers were handled using the interquartile range method, where we inputted the upper (percentile 75) and lower limit (percentile 25) values to both regions of outliers.
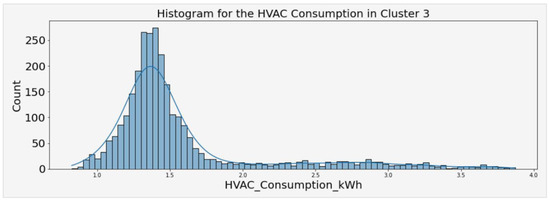
Figure 16.
HVAC consumption in cluster3—second SOM.
We replaced the timeslots with energy inefficiencies in cluster2 with the consumption mean value of the same timeslots in cluster 1 or 3, depending on whether the cluster2 observation is a hot, cold, or holiday one. For cluster2 timeslots with high outdoor temperature, we used the mean value of similar timeslots in cluster3, and for cluster2 timeslots with low outdoor temperature, we replaced them with the mean value of similar timeslots in cluster1. In addition to handling outliers with the interquartile range technique, this paper’s analysis led to an energy saving of up to 1665 kWh, which counts for 4.6% of the 1-year data used in this paper.
5. Conclusions
To cope with the climate of Houston, buildings must rely on the use of air conditioning, as high humidity and warm temperatures can cause damage. However, generating good indoor quality is very often energy intensive and hence a costly process, which attracted many researchers to work on different techniques to improve how an HVAC system operates and help energy managers identify opportunities for energy improvement.
The main goal of this paper is to once again prove the power of data analysis, unsupervised learning, and visualization tools in identifying inefficiencies in the way an HVAC system is managed, even for high-performance buildings in the Houston area. The paper also takes the reader through a step-by-step data analysis methodology that goes from data collection to data visualization using data collected from building meters, in addition to data collected from a weather station and building access cards. In Ref. [27], the K-Means algorithm was used to identify 1.87% saving; this work proves that self-organizing maps excel at generating better clustering results in addition to better graphical representation of the clustering results using forms of charts that can be easily interpreted by energy managers to identify improvement opportunities in the way an HVAC system is operating. This paper finds opportunities to reduce the energy consumption of the HARC building by up to 4.6% using the data analysis approach presented in this work.
As future work, the HARC is actively working on expanding the data collected to the indoor temperature, temperature set points, and real-time building occupancy. In April 2022, the HARC started monitoring each of the over 250 circuit breakers in its electrical panels. That level of detail and granularity will support future analysis along the lines presented in this paper. In addition to collecting more data, it is important for researchers and companies developing EMSs to create an end-to-end infrastructure that will be used to collect, wrangle, analyze, and visualize data for the energy manager to take the necessary actions meant for better management of the HVAC system.
Author Contributions
H.T. worked on conceptualization, methodology, software, formal analysis, investigation, data curation, visualization, and writing—original draft. D.B. worked on supervision, project administration, conceptualization, methodology, investigation, and writing—review and editing. C.G. worked on providing resources, conceptualization, investigation, and writing—review and editing. M.B. worked on conceptualization, investigation, and writing—review and editing. M.E. worked on conceptualization, supervision, writing—review and editing. All authors have read and agreed to the published version of the manuscript.
Funding
This research received no external funding.
Institutional Review Board Statement
The study was conducted according to the guidelines to the declaration of Helsinki and approved by the Institutional Review Board of the University of Houston, IRB ID: MOD00000338 approved on 26 April 2017, and valid until 5 October 2021.
Informed Consent Statement
Not Applicable.
Data Availability Statement
The data analyzed in this paper cannot be shared publicly, as an NDA was signed by Houston Advanced Research Center, Houston University, and Al Akhawayn University to use the data for this research only.
Acknowledgments
Authors would like to acknowledge the HARC for providing the data used in this paper and for their continuous assistance.
Conflicts of Interest
The authors declare no conflict of interest.
References
- Tuballa, M.L.; Abundo, M.L. A review of the development of Smart Grid technologies. Renew. Sustain. Energy Rev. 2016, 59, 710–725. [Google Scholar] [CrossRef]
- Yoldaş, Y.; Önen, A.; Muyeen, S.M.; Vasilakos, A.V.; Alan, İ. Enhancing smart grid with microgrids: Challenges and opportunities. Renew. Sustain. Energy Rev. 2016, 72, 205–214. [Google Scholar] [CrossRef]
- Three States Enact Integrated Plans to Decarbonize Buildings|ACEEE. Available online: https://www.aceee.org/blog-post/2022/08/three-states-enact-integrated-plans-decarbonize-buildings (accessed on 14 October 2022).
- Frequently Asked Questions (FAQs)—U.S. Energy Information Administration (EIA). Available online: https://www.eia.gov/tools/faqs/faq.php?id=86&t=1 (accessed on 14 October 2022).
- U.S. Department of Energy, Building Technologies Office. Zero Energy Building Highlight: Houston Advanced Research Center. Available online: https://www.energy.gov/eere/buildings/articles/zero-energy-building-highlight-houston-advanced-research-center (accessed on 14 October 2022).
- DOE-USA. An Assessment of Energy Technologies and Research Opportunities, Chapter 5 Increasing Efficiency of Buildings Systems and Technologies, 2015; pp. 143–181. Available online: https://www.energy.gov/sites/prod/files/2017/03/f34/qtr-2015-chapter5.pdf (accessed on 15 October 2022).
- Rumanía, G. The 2021–2030 Integrated National Energy and Climate Plan. 2020; pp 103-110. Available online: https://energy.ec.europa.eu/system/files/2020-06/ro_final_necp_main_en_0.pdf (accessed on 15 October 2022).
- Talei, H.; Benhaddou, D.; Essaaidi, M. Smart Campus Energy Management System: Advantages, Architectures, and the Impact of using Cloud Computing. In Proceedings of the 2017 ACM International Conference Proceeding Series, Tacoma, WA, USA, 21 July 2017. [Google Scholar] [CrossRef]
- Wang, Y.; Chen, Q.; Hong, T.; Kang, C. Review of Smart Meter Data Analytics: Applications, Methodologies, and Challenges. IEEE Trans. Smart Grid 2018, 10, 3125–3148. [Google Scholar] [CrossRef]
- Marinakis, V. Big Data for Energy Management and Energy-Efficient Buildings. Energies 2020, 13, 1555. [Google Scholar] [CrossRef]
- Andor, M.A.; Bernstein, D.H.; Sommer, S. Determining the efficiency of residential electricity consumption. Empir. Econ. 2021, 60, 2897–2923. [Google Scholar] [CrossRef]
- Himeur, Y.; Ghanem, K.; Alsalemi, A.; Bensaali, F.; Amira, A. Artificial intelligence based anomaly detection of energy consumption in buildings: A review, current trends and new perspectives. Appl. Energy 2021, 287, 116601. [Google Scholar] [CrossRef]
- Ali, S.B.M.; Hasanuzzaman, M.; Rahim, N.; Mamun, M.; Obaidellah, U. Analysis of energy consumption and potential energy savings of an institutional building in Malaysia. Alex. Eng. J. 2021, 60, 805–820. [Google Scholar] [CrossRef]
- Mehmood, M.U.; Chun, D.; Zeeshan; Han, H.; Jeon, G.; Chen, K. A review of the applications of artificial intelligence and big data to buildings for energy-efficiency and a comfortable indoor living environment. Energy Build. 2019, 202, 109383. [Google Scholar] [CrossRef]
- Pham, A.-D.; Ngo, N.-T.; Truong, T.T.H.; Huynh, N.-T.; Truong, N.-S. Predicting energy consumption in multiple buildings using machine learning for improving energy efficiency and sustainability. J. Clean. Prod. 2020, 260, 121082. [Google Scholar] [CrossRef]
- Goyal, M.; Pandey, M.; Thakur, R. Exploratory Analysis of Machine Learning Techniques to predict Energy Efficiency in Buildings. In Proceedings of the 2020 8th International Conference on Reliability, Infocom Technologies and Optimization (Trends and Future Directions) (ICRITO), Noida, Italy, 4–5 June 2020; pp. 1033–1037. [Google Scholar] [CrossRef]
- Le, T.; Vo, M.T.; Vo, B.; Hwang, E.; Rho, S.; Baik, S.W. Improving Electric Energy Consumption Prediction Using CNN and Bi-LSTM. Appl. Sci. 2019, 9, 4237. [Google Scholar] [CrossRef]
- Bourdeau, M.; Zhai, X.Q.; Nefzaoui, E.; Guo, X.; Chatellier, P. Modeling and forecasting building energy consumption: A review of data-driven techniques. Sustain. Cities Soc. 2018, 2019, 101533. [Google Scholar] [CrossRef]
- Kim, T.-Y.; Cho, S.-B. Predicting residential energy consumption using CNN-LSTM neural networks. Energy 2019, 182, 72–81. [Google Scholar] [CrossRef]
- Zhong, H.; Wang, J.; Jia, H.; Mu, Y.; Lv, S. Vector field-based support vector regression for building energy consumption prediction. Appl. Energy 2019, 242, 403–414. [Google Scholar] [CrossRef]
- Fahim, M.; Sillitti, A. Analyzing Load Profiles of Energy Consumption to Infer Household Characteristics Using Smart Meters. Energies 2019, 12, 773. [Google Scholar] [CrossRef]
- Trotta, G. An empirical analysis of domestic electricity load profiles: Who consumes how much and when? Appl. Energy 2020, 275, 115399. [Google Scholar] [CrossRef]
- Pérez-Chacón, R.; Luna-Romera, J.; Troncoso, A.; Martínez-Álvarez, F.; Riquelme, J.; Pérez-Chacón, R.; Luna-Romera, J.M.; Troncoso, A.; Martínez-Álvarez, F.; Riquelme, J.C. Big Data Analytics for Discovering Electricity Consumption Patterns in Smart Cities. Energies 2018, 11, 683. [Google Scholar] [CrossRef]
- Ullah, A.; Haydarov, K.; Haq, I.U.; Muhammad, K.; Rho, S.; Lee, M.; Baik, S.W. Deep Learning Assisted Buildings Energy Consumption Profiling Using Smart Meter Data. Sensors 2020, 20, 873. [Google Scholar] [CrossRef]
- Tureczek, A.M.; Nielsen, P.S.; Madsen, H.; Brun, A. Clustering district heat exchange stations using smart meter consumption data. Energy Build. 2019, 182, 144–158. [Google Scholar] [CrossRef]
- An, J.; Yan, D.; Hong, T. Clustering and statistical analyses of air-conditioning intensity and use patterns in residential buildings. Energy Build. 2018, 174, 214–227. [Google Scholar] [CrossRef]
- Talei, H.; Benhaddou, D.; Gamarra, C.; Benbrahim, H.; Essaaidi, M. Smart Building Energy Inefficiencies Detection through Time Series Analysis and Unsupervised Machine Learning. Energies 2021, 14, 6042. [Google Scholar] [CrossRef]
- Batta, M. Machine Learning Algorithms—A Review. Int. J. Sci. Res. 2020, 9, 381–386. [Google Scholar] [CrossRef]
- Araujo, E.; Silva, C.R.; Sampaio, D.J.B.S. Video target tracking by using competitive neural networks. WSEAS Trans. Signal Process. 2008, 4, 420–431. [Google Scholar]
- Bergstra, J.; Yamins, D.; Cox, D.D. Hyperopt: A Python Library for Optimizing the Hyperparameters of Machine Learning Algorithms. In Proceedings of the 12th Python in Science Conference, Austin, TX, USA, 24–29 June 2013; pp. 13–19. [Google Scholar] [CrossRef]
- Cottrell, M.; Olteanu, M.; Rossi, F.; Villa-Vialaneix, N. Self-Organizing Maps, Theory and Applications. Revista de Investigacion Operacional, 2018, 39 (1), pp.1-22. Available online: https://direct.mit.edu/neco/article/7/6/1165-1177/5916 (accessed on 24 October 2022).
- Miljkovic, D. Brief review of self-organizing maps. In Proceedings of the 2017 40th International Convention on Information and Communication Technology, Electronics and Microelectronics (MIPRO), Opatija, Croatia, 22–26 May 2017. [Google Scholar] [CrossRef]
- Purbasari, I.Y.; Puspaningrum, E.Y.; Putra, A.B.S. Using Self-Organizing Map (SOM) for Clustering and Visualization of New Students based on Grades. J. Phys. Conf. Ser. 2020, 1569, 022037. [Google Scholar] [CrossRef]
- Cancer. Available online: https://www.who.int/health-topics/cancer#tab=tab_1 (accessed on 22 June 2022).
- Shukla, N.; Hagenbuchner, M.; Win, K.T.; Yang, J. Breast cancer data analysis for survivability studies and prediction. Comput. Methods Programs Biomed. 2018, 155, 199–208. [Google Scholar] [CrossRef] [PubMed]
- Davidoff, F.; Haynes, B.; Sackett, D.; Smith, R. Evidence based medicine. BMJ 1995, 310, 1085. [Google Scholar] [CrossRef]
- UNECE. Independent Evaluation of the United Nations Road Safety Trust Fund (UNRSF) Secretariat; UNECE: Geneva, Switzerland, 2021; pp. 1–81. [Google Scholar]
- Sakhare, A.; Kasbe, P.S. A review on road accident data analysis using data mining techniques. In Proceedings of the 2017 International Conference on Innovations In Information, Embedded and Communication Systems, Coimbatore, India, 17–18 March 2017; pp. 1–5. [Google Scholar] [CrossRef]
- Adams, J.; Bélafi, Z.; Horváth, M.; Kocsis, J.; Csoknyai, T. How Smart Meter Data Analysis Can Support Understanding the Impact of Occupant Behavior on Building Energy Performance: A Comprehensive Review. Energies 2021, 14, 2502. [Google Scholar] [CrossRef]
- Jia, L.; Tong, L. Dynamic Pricing and Distributed Energy Management for Demand Response. IEEE Trans. Smart Grid 2016, 7, 1128–1136. [Google Scholar] [CrossRef]
- Li, K.; Ma, Z.; Robinson, D.; Ma, J. Identification of typical building daily electricity usage profiles using Gaussian mixture model-based clustering and hierarchical clustering. Appl. Energy 2018, 231, 331–342. [Google Scholar] [CrossRef]
- Yildiz, B.; Bilbao, J.I.; Dore, J.; Sproul, A. Household electricity load forecasting using historical smart meter data with clustering and classification techniques. In Proceedings of the 11th International Conference on Innovative Smart Grid Technologies (Asia), Singapore, 1–5 November 2018; pp. 873–879. [Google Scholar] [CrossRef]
- Sinaga, K.P.; Yang, M.-S. Unsupervised K-Means Clustering Algorithm. IEEE Access 2020, 8, 80716–80727. [Google Scholar] [CrossRef]
- Yun, J.; Won, K.-H. Building Environment Analysis Based on Temperature and Humidity for Smart Energy Systems. Sensors 2012, 12, 13458–13470. [Google Scholar] [CrossRef]
- Chu, X.; Ilyas, I.F.; Krishnan, S.; Wang, J. Data Cleaning. In Proceedings of the 2016 International Conference on Management of Data, San Francisco, CA, USA, 26 June 2016–1 July 2016; pp. 2201–2206. [Google Scholar] [CrossRef]
- R: The R Project for Statistical Computing. Available online: https://www.r-project.org/ (accessed on 4 January 2023).
- Galeano, P.; Peña, D. Data Science, Big Data and Statistics; Springer: Berlin/Heidelberg, Germany, 2019; Volume 28. [Google Scholar]
- Som Function—RDocumentation. Available online: https://www.rdocumentation.org/packages/kohonen/versions/2.0.19/topics/som (accessed on 26 July 2022).


Disclaimer/Publisher’s Note: The statements, opinions and data contained in all publications are solely those of the individual author(s) and contributor(s) and not of MDPI and/or the editor(s). MDPI and/or the editor(s) disclaim responsibility for any injury to people or property resulting from any ideas, methods, instructions or products referred to in the content. |
© 2023 by the authors. Licensee MDPI, Basel, Switzerland. This article is an open access article distributed under the terms and conditions of the Creative Commons Attribution (CC BY) license (https://creativecommons.org/licenses/by/4.0/).