Article

Experimental Evaluation of the Influence of the Diameter of the Outlet Nozzle Bore of a Gas Injector on Its Flow Characteristic

Faculty of Mechanical Engineering, Bialystok University of Technology, 45C Wiejska Str., 15-351 Bialystok, Poland
*
Author to whom correspondence should be addressed.
Appl. Sci. 2023, 13(3), 1700; https://doi.org/10.3390/app13031700
Submission received: 29 December 2022 / Revised: 18 January 2023 / Accepted: 27 January 2023 / Published: 29 January 2023

Abstract

:

Featured Application

The flow characteristics of the injectors from gas-fueling systems of automobile engines under pulsating flow were determined. The approximating equations and the results of statistical treatment are presented. Possible causes of discrepancies by the indirect method are given and verified. The results are applicable to the calculation of fuel systems, as well as whole internal combustion engines and the practical implementation of component selection.

Abstract

Despite the growing share of electrically powered vehicles, internal combustion engines are still one of the primary sources of propulsion in transportation. One way to decarbonize engines is to use alternative fuels, where liquefied petroleum gas (LPG) accounts for a large share. Popular car gas systems are LPG indirect vapor phase injection systems, in which the low-pressure gas-phase injector is the actuator. The purpose of the research and analysis presented in this paper is to determine the flow characteristics of three injectors that are structurally different depending on the diameter of the outlet nozzle bore. The tests are conducted, which is new, with pulsed operation of the injector, which, as it turned out, helps explain the discrepancies found. The obtained characteristics are fitted with a polynomial of the second degree, obtaining high-quality indices. In the group of three tested injectors, the average values of volumetric flow rate decreases relative to the maximum by 19.6 and 35.8%. Differences in opening times of 29.3 and 36.6%, respectively, are cited as one of the main reasons for this. Closing times are similar to each other. In addition, the injector with the highest volumetric flow rate and the shortest opening time obtains 1.8 and 9.94% lower average cycle pressures measured at the outlet of the injector nozzle. The differences in opening times and average cycle pressures are considered as possible reasons for the differences in flow characteristics. The obtained characteristics are applicable to engine conversions and calculations.

1. Introduction

The gradual reduction in CO2 emissions from transportation will result in the phasing out of internal-combustion-only vehicles in the near future (around 2035). In 2018, the CO2 emission level of a vehicle controlled under approval could not exceed 120.5 g·km−1, from 2020 it was only 95 g·km−1. Further regulations indicate a reduction of 15% in 2025 and 37.5% in 2030. The soon-to-be-planned EURO VII emission standards will most likely exclude the use of internal-combustion-only engines for propulsion [1]. As emissions are lowered, type-approval tests are being modified, no longer relying solely on laboratory tests (NEDC, WLTC) but mandating on-road testing (RDE) [2]. There are many ways to reduce the emissions performance of internal combustion engines, including the use of fuels with lower carbon content [3,4], changes in the organization of the combustion process [5,6,7] or eco-driving [8]. All of these activities are a part of a worldwide trend referred to as GHGs [9]. Additionally, legal norms are being created for alternative fuels (CAFÉ, AMFA [10]), but it is CO2 emissions (CARB-CAR) that determine all actions [11].
Internal-combustion-only drives are being replaced by hybrid powertrains [12,13], or pure electric drives [14,15]. The charging network for these types of vehicles is being expanded, making them more competitive, especially in short-haul transportation. Drives using H2 [16,17] or compressed air [18,19] are also emerging [20].
Among the most popular alternative fuels used in transportation are LPG [21,22], CNG [23,24], and LNG [25,26]. One obstacle to converting modern internal combustion engines to alternative fuels, especially LPG, are direct injection systems using piezoelectric injectors [27]. Systems already exist that use gasoline injectors to inject LPG in the liquid phase [28,29], making the gas supply system very simplified. The gas controller here starts switching the type of fuel, while the operation of the injector is still controlled by the gasoline module. An unusual solution was proposed by one of the companies producing gas supply systems. To convert the engine to run on LPG, a system was created that is a combination of direct injection of LPG in the liquid phase (with gasoline injectors) and indirect injection of the vapor phase with additional injectors [30]. The vast majority of engines in service use LPG indirect vapor-phase injection systems. The market for manufacturers of components for such power systems is constantly developing. LPG and CNG supply are used in the conversion of working machinery engines [31,32].
A wide variety of methods can be used in the study of the injectors of different fuels, depending on the purpose adopted. High-speed cameras [33,34,35], optical lasers [36,37,38], and a combination of high-speed cameras and optical lasers [39] are mainly used to observe the injection process. There are also trials using X-ray [40,41], heat flow sensors [42], and light fluorescence absorption [37,43,44]. The methods, too, are very complicated but give precise results depicting the process. The mass flow meter and schlieren imaging method [45], optical sensors [46], long-range microscopy [47], current in the power line [48,49], acceleration sensors [49,50], and pressure sensors [48,49] are used to evaluate injector response times. The [51] presents the results of experimental studies and numerical analyses of diesel atomization from single- and multi-hole injectors. The laser absorption scattering technique was used in the experiments. The Eulerian Langrangian two-phase fluid framework was used in the calculations. In [52], on the other hand, to measure the concentration of droplets and vapor inside the atomized fuel, a two-wavelength, second- and fourth-harmonic wavelength Nd:YAG laser absorption-scattering technique was used for dimethylnaphthalene as fuel. In detail, the test methods are described in [53] where you can find a range of information on testing fuel systems with different actuation systems. If it is possible to fix the measurement system, injector lift is assessed using lift sensors [49,54]. In dosage measurements, the most popular methods are the gravimetric method [55,56] and ‘fuel tank refill’ method [55].
The determination of the characteristics of the low-pressure gas-phase injector can be realized on the basis of the standards provided for low-pressure gasoline injectors SAE J1832 and J2715 [57], as there are no standards dedicated to them. The SAE standards are largely applicable to gasoline injectors, but the difference in fuel state is the main discrepancy. The basic characteristic of an injector is its volumetric/mass flow rate depending on the length of the pulse controlling its opening (opening time). Such characteristics are the subject of many studies and are also included in manufacturers’ technical materials. In the technical materials of gas injectors, the dependence of the volumetric flow rate on the diameter of the outlet nozzle bore is placed very rarely. If such information is given, it is with the injector fully open, which does not fully reflect the performance of the pulse injector. More often, manufacturers state that the maximum power of one cylinder depends on the diameter of the outlet nozzle bore, which also raises some doubts. Engines have widely varying single-cylinder horsepower because of many factors, such as variable valve timing, intake manifold lengths, supercharging, and others. Fuel consumption is important here, and this determines fuel requirements. A research gap appears here, which is worth addressing in the course of research.
The purpose of this study was to determine the flow characteristics of the low-pressure gas-phase injectors of different designs. In basic terms, such characteristics are determined as a function of the injector opening time. In this case, the input variable was defined as the diameter of the outlet nozzle bore. The topic analyzed is very important because, in the case of converting an engine to gas power, when the injector opening time proves insufficient, then the diameter of the outlet nozzle bore should be increased. The research gap in this area was considered to be how injectors respond to variation in nozzle bore diameter and what may lie behind the causes of any discrepancies. The available (very modest) literature reports present the issue only for the case of a fully open injector. Therefore, it is very valuable from the cognitive point of view to conduct tests with cyclic operation of the injector, i.e., at a certain time and frequency of opening.

2. Materials and Methods

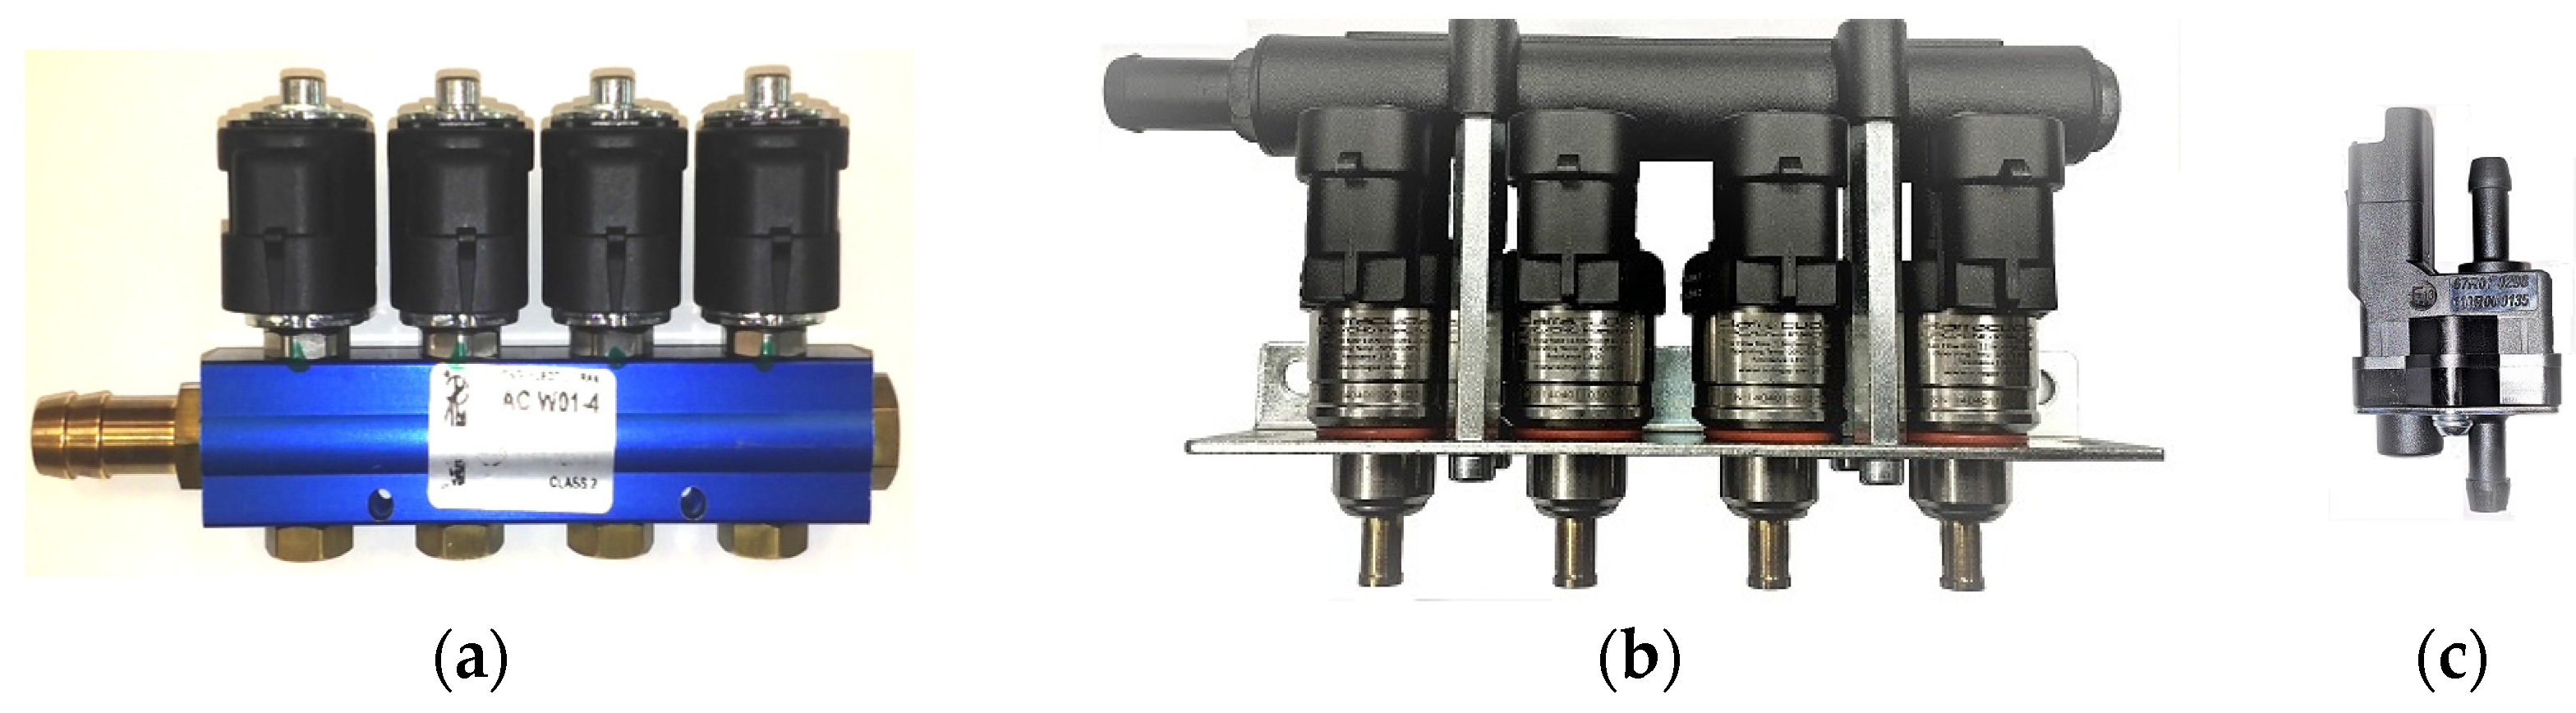
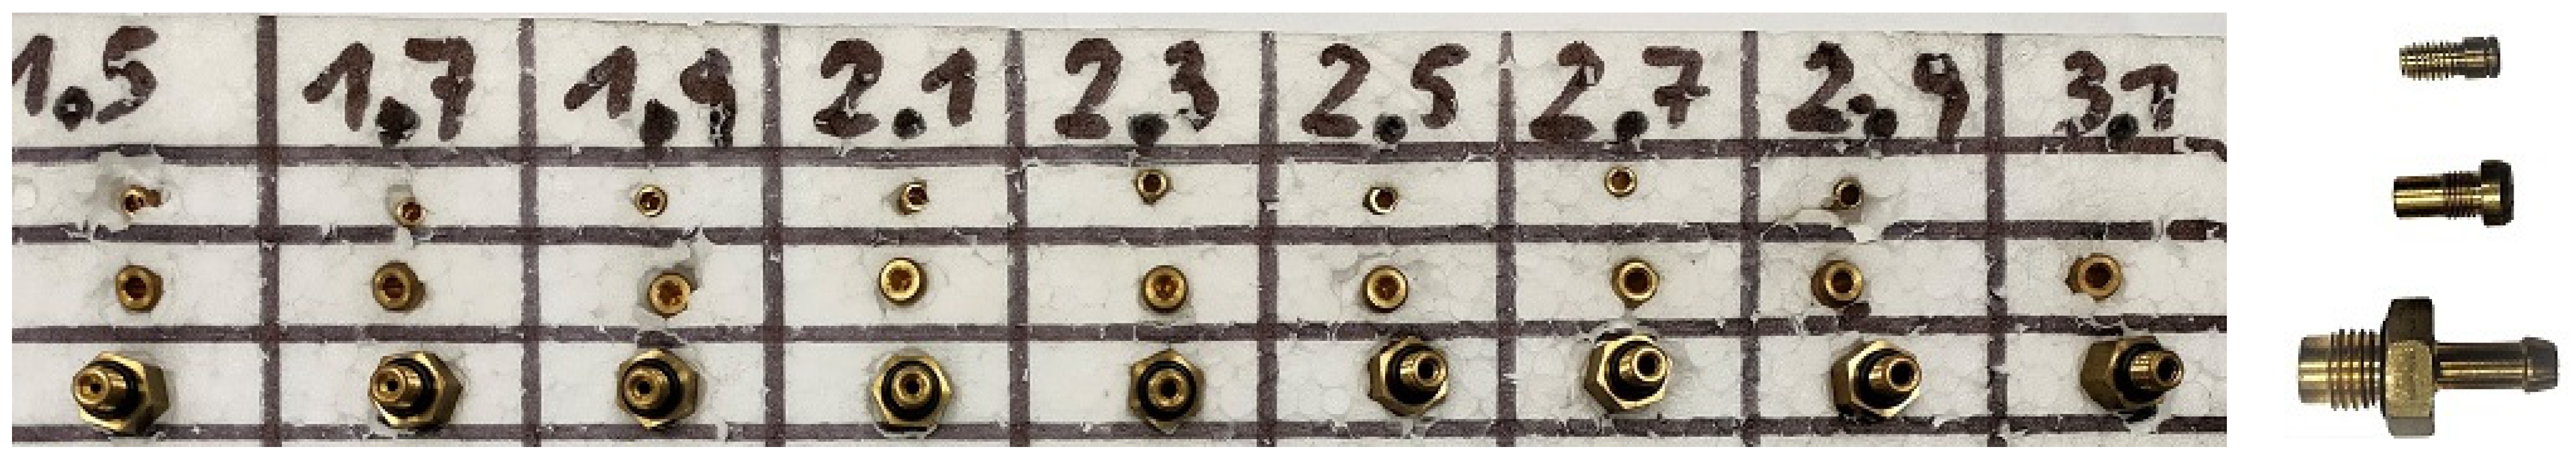
2.1. Research Objects

Three types of the low-pressure gas-phase injectors were used in the study: AC W01-4 (Figure 1a), Barracuda 115 (Figure 1b), and Matrix HS 211.20 (Figure 1c). The selected injectors were characterized by different designs in relation to each other. The AC W01-4 injector is a plunger injector with transverse gas flow. The Barracuda 115 injector, on the other hand, is also a plunger injector, with the difference that the gas flow occurs along the plunger. The Matrix HS injector has a flow control element in the form of a plate. The injectors shown in Figure 1 are among the very popular in Poland and Europe. They are commonly used in alternative power systems for cars.
The basic technical data of the tested injectors are presented in Table 1.
The subject variation in the diameters of the outlet nozzle bore was realized by gradual reaming. For this purpose, calibrated drills with gradations of 0.2 mm were used. Figure 2 shows the outlet nozzles of the injectors (from below: AC W01-4; Barracuda 115; Matrix HS 211.20).
In the case of the Matrix injector nozzles, it was not possible to achieve a diameter of 3.1 mm by the drilling method. Therefore, in the last case, the injector was left without a nozzle, finding that the spigot diameter was 0.07 mm larger than the required 3.1 mm.
Verification of the diameters of randomly selected nozzles was carried out. For this purpose, a FALCON microscope (Figure 3a), based on a 5:1 CCD camera, incremental lines of the X, Y, Z axes–1 µm, and software with a QC5000VED edge sensor (Figure 3a) was used. The average value of the deviations was 0.058 mm.

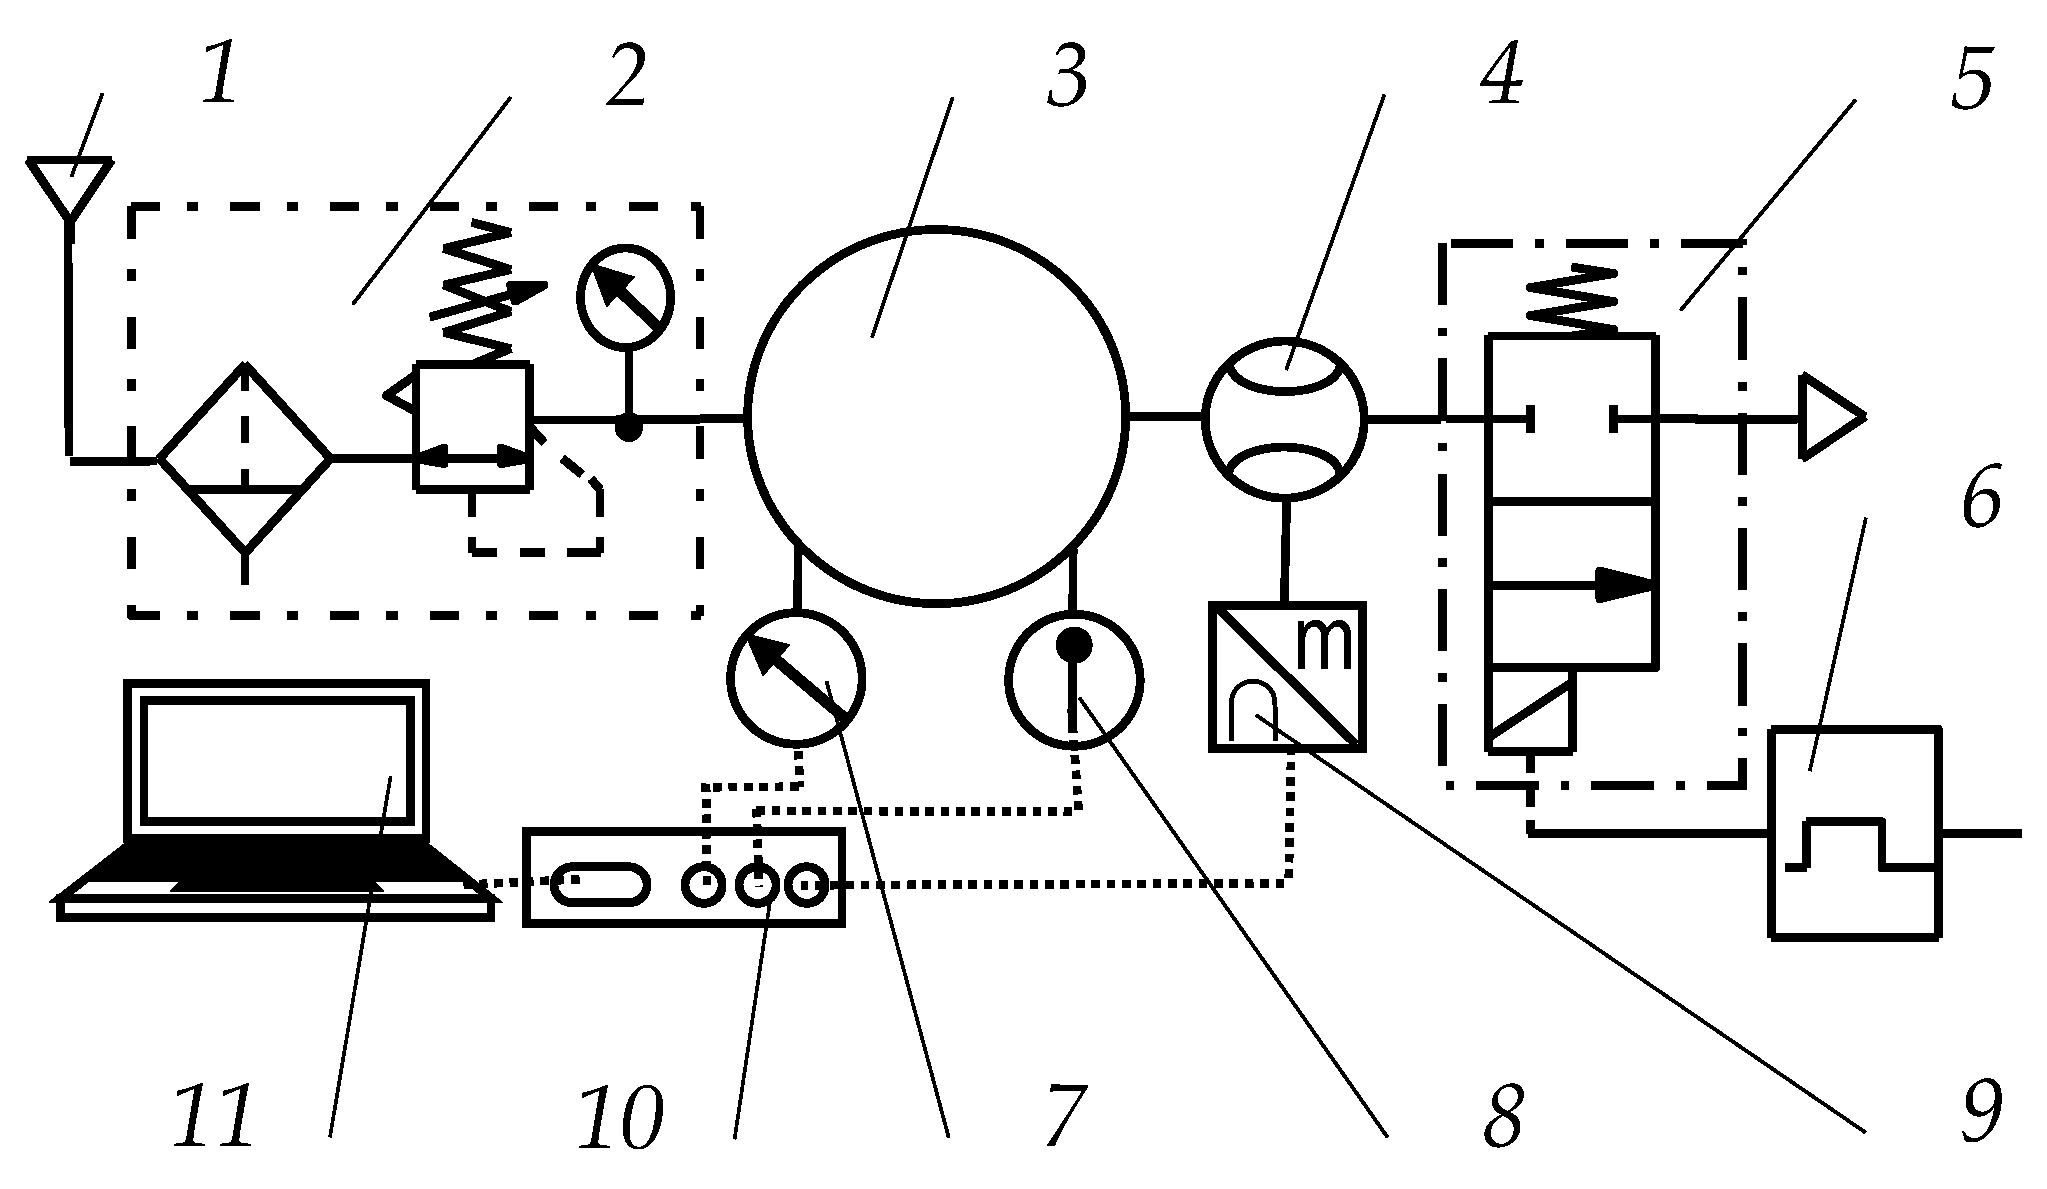
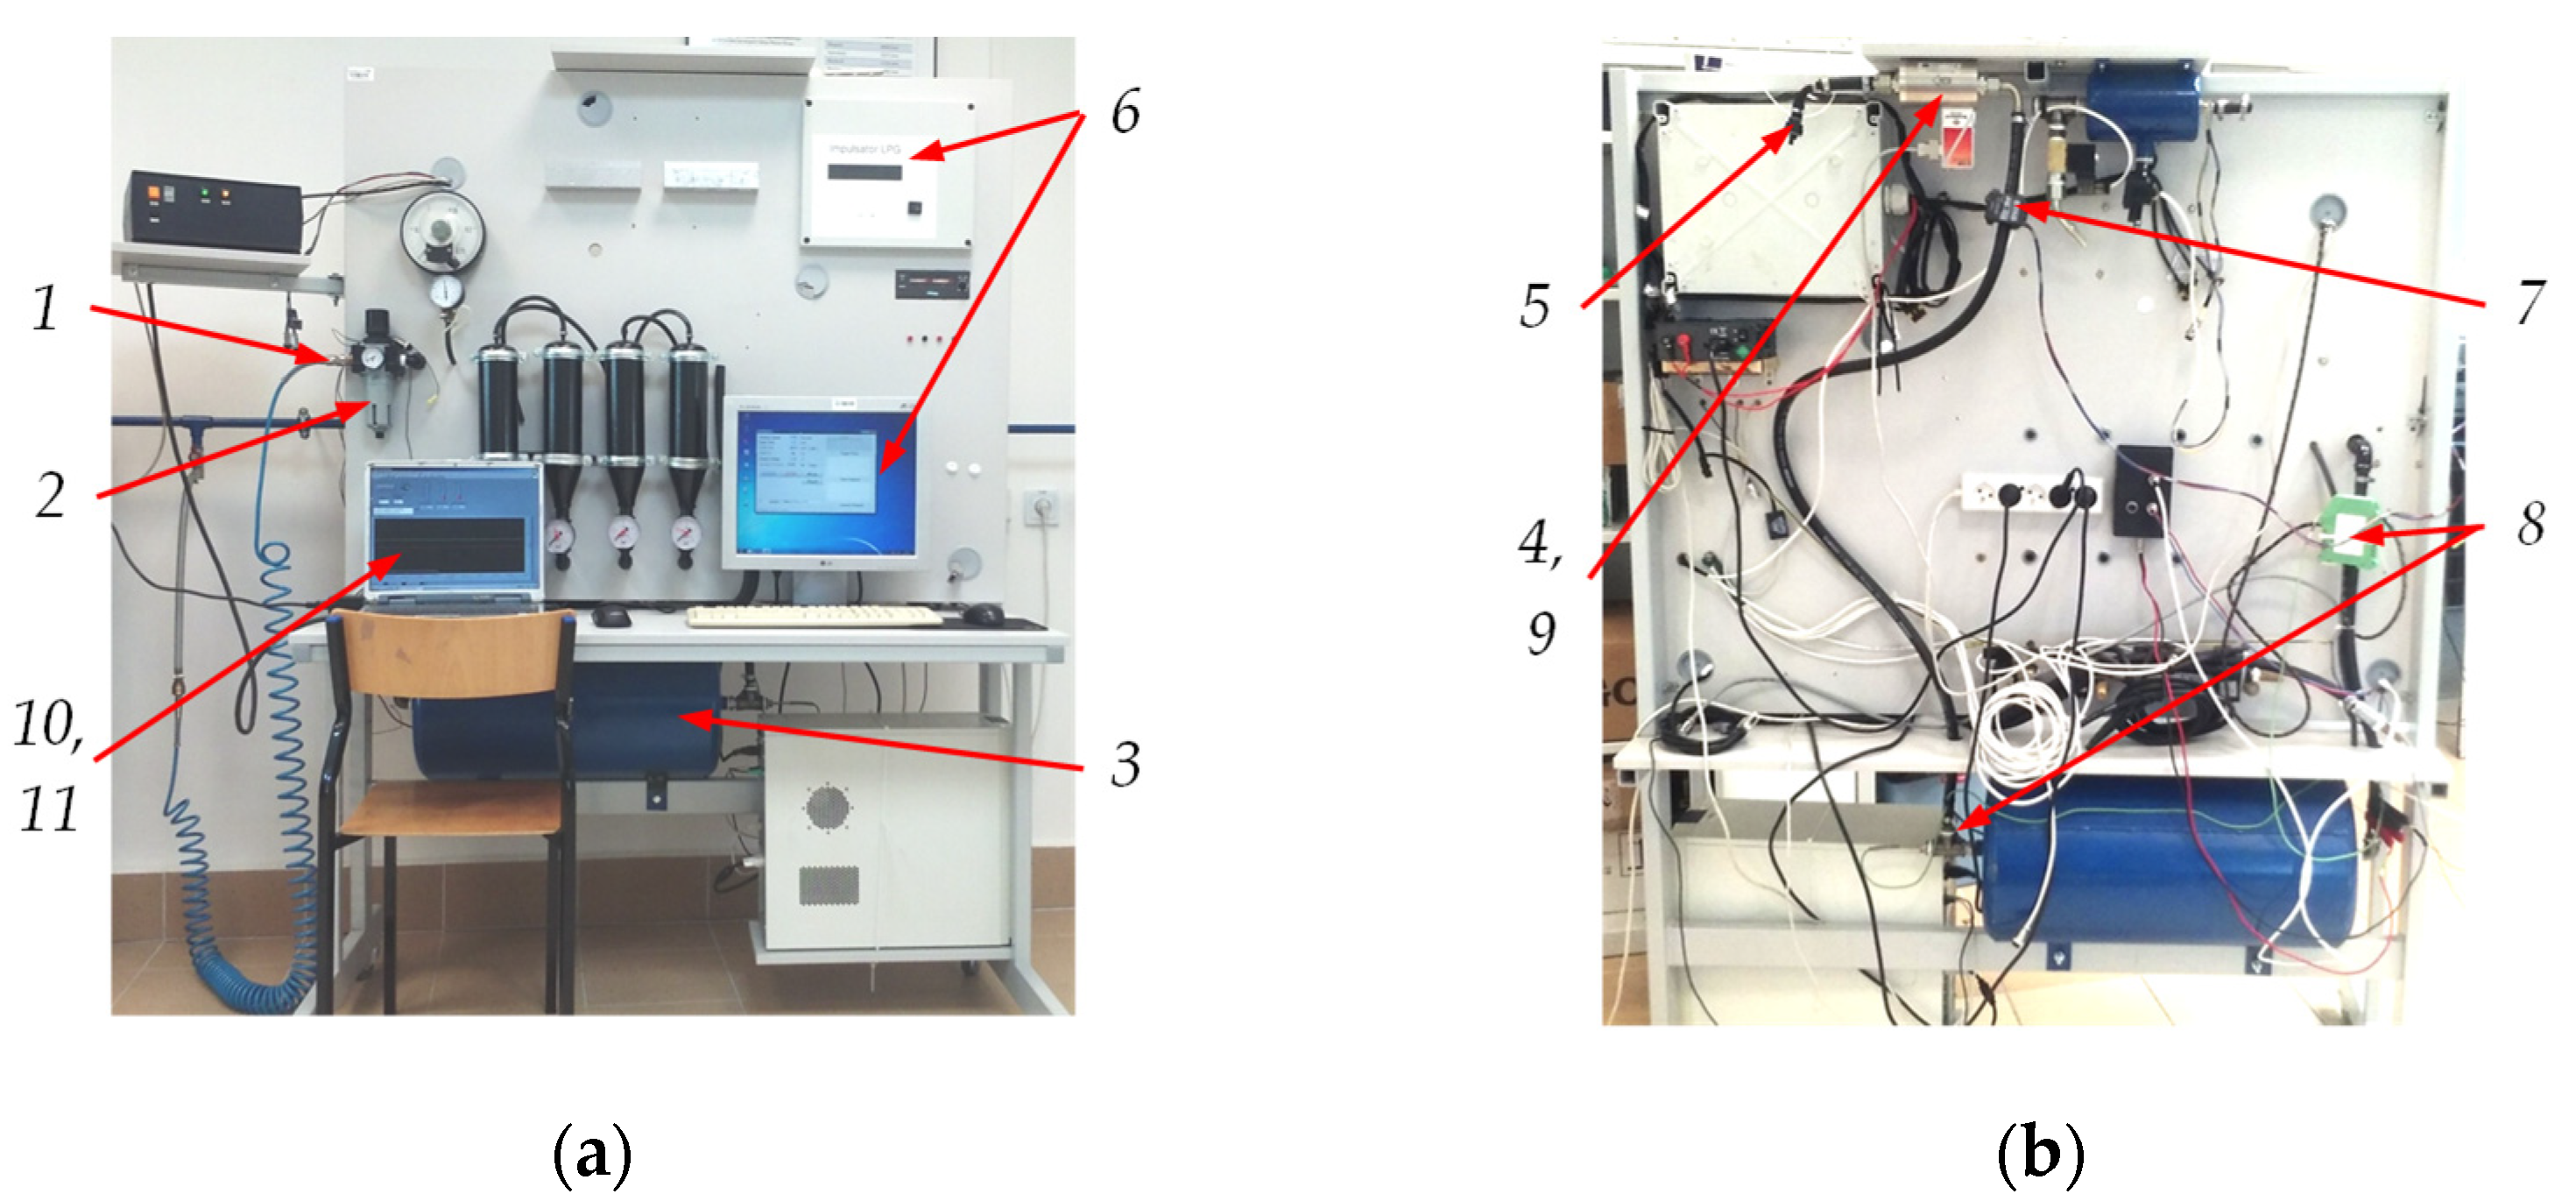
2.2. Research Equipment

The test stand used in the test course is shown in Figure 4. For safety reasons, the tests were conducted using air instead of gas. Compressed air was the source of supply 1. It further passed through air preparation system 2 to buffer tank 3. From buffer tank 3, the air flowed through mass flow meter 4 to the tested injector 5. The mass flow meter was retrofitted with a converter 9. An electro-valve control system 6 was responsible for shaping the pulses that controlled the cyclic operation of the injector. A pressure gauge with pressure converter 7 and thermometer gauge with converter 8 were placed in tank 3. Electrical signals from the pressure, thermometer, and mass flow converters were sent to a measurement card 10 and further to a laptop with software 11.
Figure 5a,b show the practical implementation of the test stand. In addition to the application under study, this test stand is also used to determine the functional parameters of gas injectors (opening and closing times [49], non-repeatability [61], and irregularity [62] dosage). In addition to the equipment described in the caption of Figure 5, the bench was equipped with electrical power supplies and analog indicators. The parameters of the measurement equipment are presented in Table 2.

2.3. Research Method

Before carrying out the measurements, the injectors under test were turned on for 5 min for them to reach their nominal operating temperature. According to the manufacturer’s recommendations, the flow meter and other test equipment were also prepared.
By analyzing the literature reports on the average opening time of the injector, its operating frequency, and gas pressure in normalized and non-normalized driving cycles [63,64], they were found to be timp = 5 ms, pgas = 1 × 10⁵ Pa, and n = 2000 min−1, respectively (in the case of a four-stroke engine, this would be f = 16.67 Hz).
On this basis, the input data in the control module and the settings of the input devices were adopted. The sampling of the measurement card was set to 0.1 s, which gave 80 points for a measurement time of 8 s. This was a sufficient number of points (above 31) for statistical evaluation [65]. It was decided not to increase the measurement time because of the fear of possible fluctuations in supply pressure caused by the operation of the controller. With an 8 s test at 16.67 Hz, the result was an average of about 133 injector opening cycles. The electrical supply voltage of the injector was U = 14 V, the temperature in the test room was Ta = (21 + 273.15) K, and the atmospheric pressure was pa = 1.01 × 10⁵ Pa.

3. Results

Tests were conducted starting with the smallest diameter of the discharge nozzle. After converting the electrical signals by the coefficients characterizing the measuring devices, unit sets of results were obtained (Figure 6a). For statistical processing of the measurement results, special software was created in the MATLAB/Simulink GUI environment [66]. It allowed the determination of average values and evaluation of the nature of the scatter of measurement points. Figure 6b shows example histograms and box plots evaluating the values of volumetric flow rate, air pressure, and temperature in the supply line. In addition, Gaussian fits (red curves) were plotted on the histograms. In addition to visualization in the form of graphs, the software determined for volumetric flow rate mean value, variance, standard deviation, asymmetry factor, kurtosis, max value, and min value. For air pressure and temperature, it was limited to mean, max, and min value.

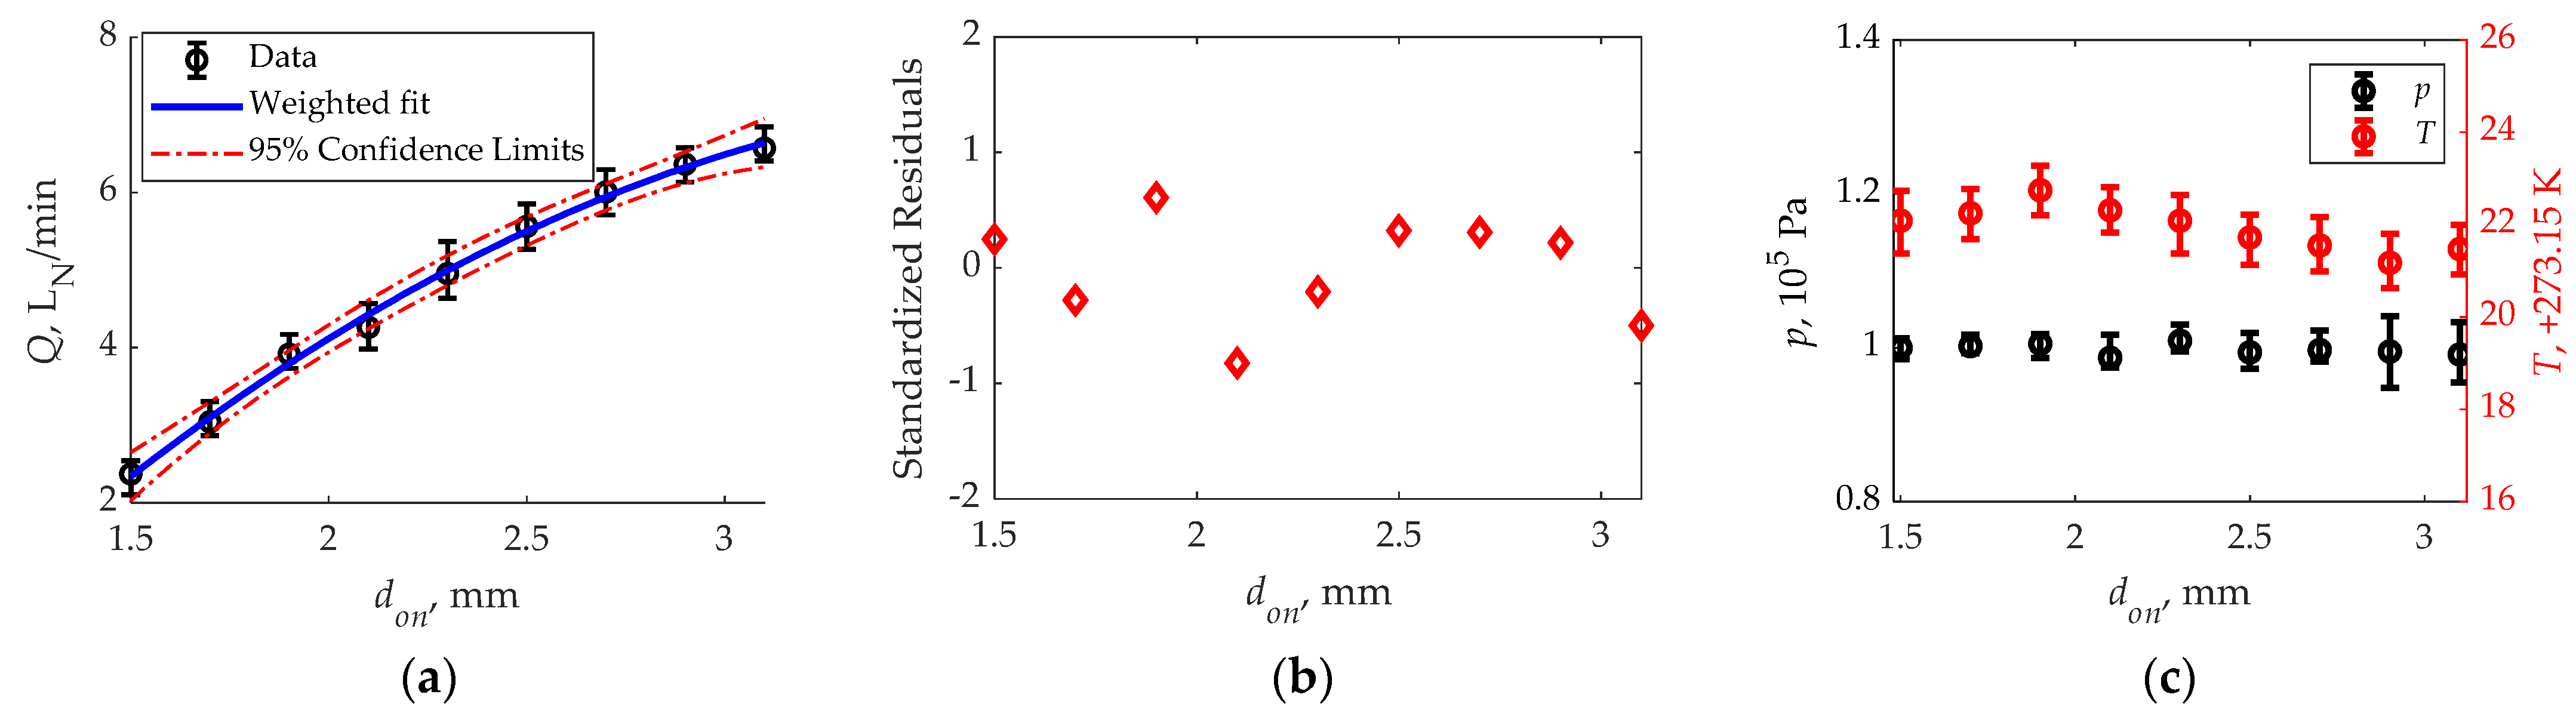
3.1. AC W01-4 Injector

Preliminary analysis of the flow measurement results indicated that they were characterized by non-constant variance (Table 3, Table 4 and Table 5). The variation of the volumetric flow rate (Q) as a function of the diameter of the outlet nozzle bore (don) indicated a nonlinear trend. For this reason, it was decided to use flow-characteristic matching through nonlinear regression [65,67]. The study was conducted using the same test apparatus, so weighted fitting using the Levenberg–Marquardt method was possible [68,69]. Minimization of the squared deviations in this method was conducted iteratively starting from the initial values of the assumed model.
Analyzing the results of the AC W01-4 injector presented in Table 3, it was found that the values of Q mean and median are close to each other, which indicates the correctness of the inference. The values of standard deviation are within the limits of (0.119…0.150), which is sufficient to evaluate the shape of the flow characteristics. Positive kurtosis values indicate leptokurtic distribution. Asymmetry factor showed left and right skewness. The values of skewness, as well as kurtosis, are acceptable for further analysis [65]. Based on the average Q values, the flow characteristics of the W01-4 AC injector were determined (Figure 7a). The shape of the characteristics was fitted with a second-degree polynomial using the method described above. The identification of significant coefficients resulted in an equation in the form of Equation (1).
Q = 1.377 d o n 2 + 8.396 d o n 7.447 .
At nine characteristic points, the root mean squared error was 0.292, with an adjusted R2 = 0.988. The determined coefficients of the polynomial were significant, pvalue = 7.550 × 10⁻⁷. Figure 7a also shows the confidence intervals of the coefficient estimates in the nonlinear regression model. The sharpest points were observed at don of 1.9 mm and 2.3 mm. However, they are within the range defined by the confidence limits.
Analyzing the standardized residuals at individual Q points (Figure 7b), a range of scatter (−1…1) is evident. The nature of the scatter is irregular and reaches maximum values at don of 1.9 and 2.3 mm. There was no correlation between the value of standardized residuals and the diameter of the outlet nozzle bore, which could suggest problems with the measurement range of the test equipment. The pressure and temperature fluctuations (Table 3 and Figure 7c) were negligible (pair = 0.070 × 10⁵ Pa and Tair = (1.367 + 273.15) K), and thus should not affect the shape of the flow characteristics.

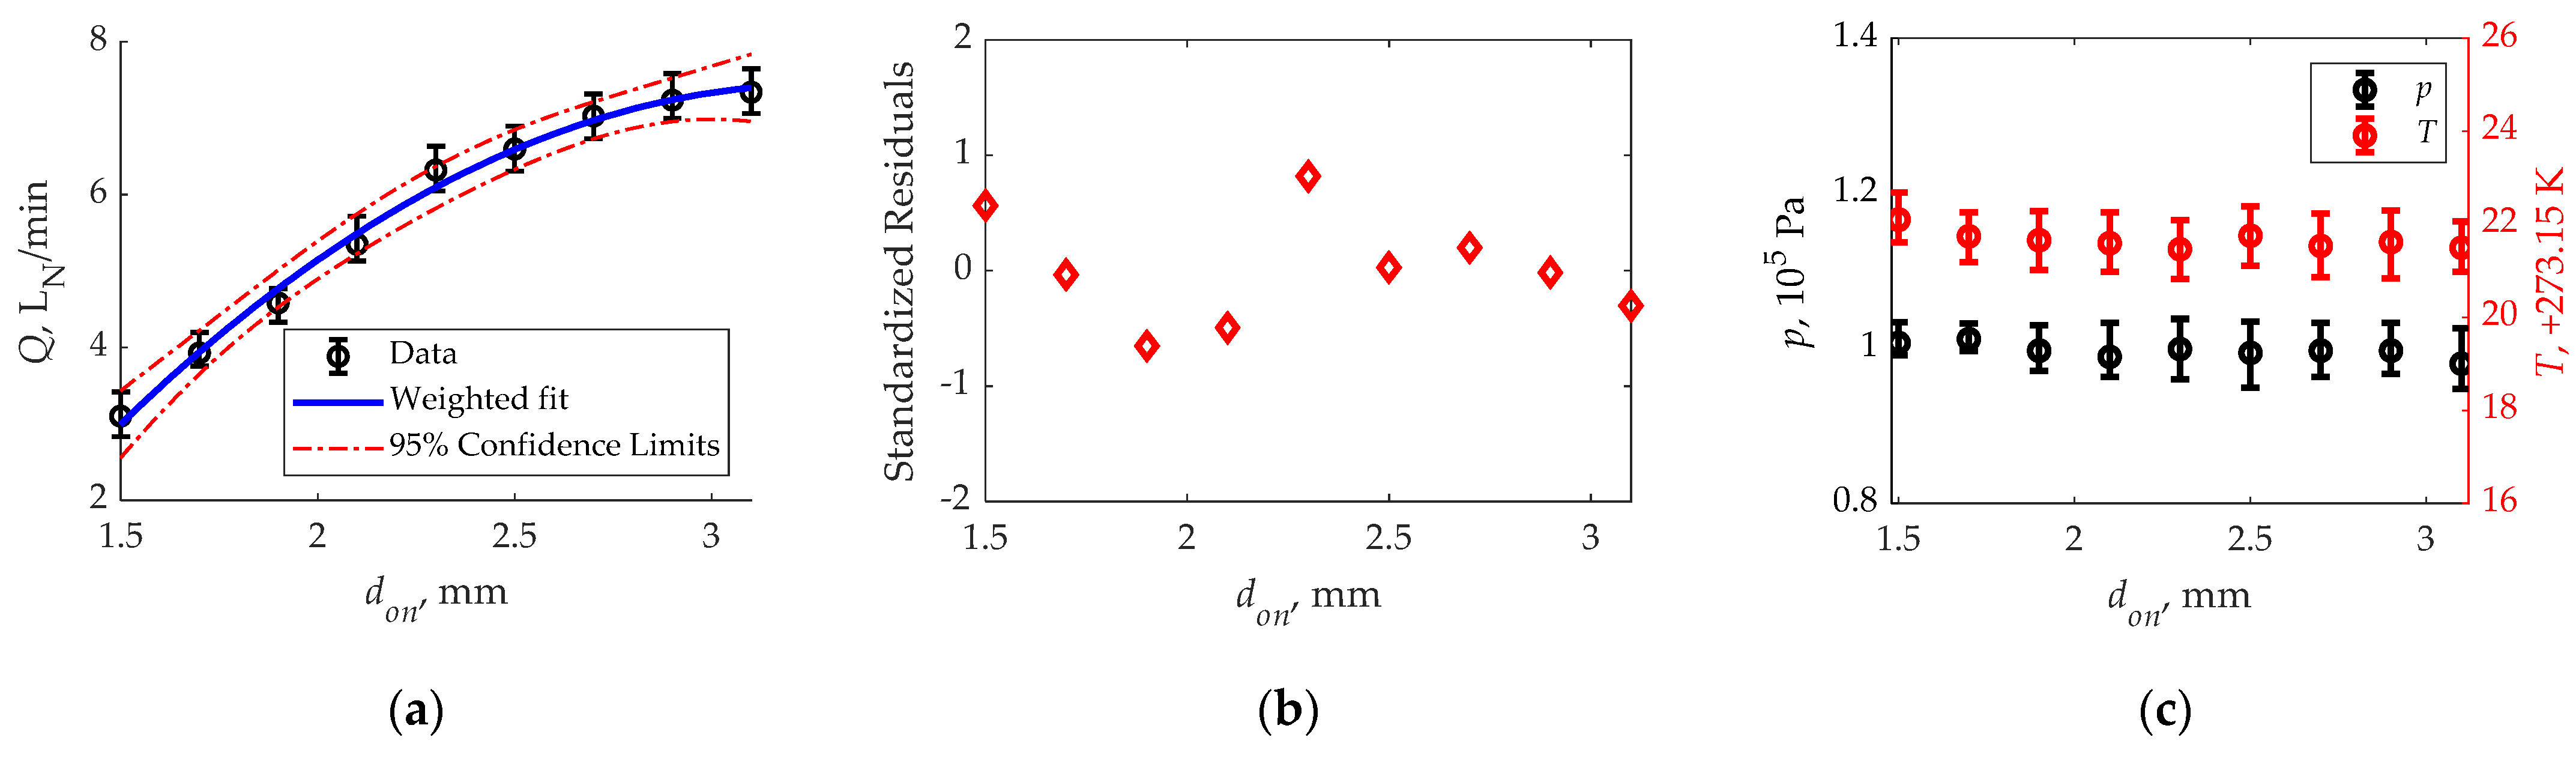
3.2. Barracuda 115 Injector

In the case of the Baracuda 115 injector (Table 4), as in the case of the AC injector, the values of Q mean and median were found to be close to each other, indicating the correctness of the inference. The values of standard deviation are within the limits (0.123…0.144), so they will not substantially affect the evaluation of the shape of the flow characteristics. Positive values of kurtosis indicate leptokurtic distribution. The asymmetry factor mostly showed left skewness. The values of skewness, as well as kurtosis, are acceptable for further analysis [65]. The flow characteristics of the Barracuda 115 injector are shown in Figure 8a. The shape of the characteristic was fitted as before with a second-degree polynomial. The identification of significant coefficients resulted in an equation in the form of Equation (2).
Q = 0.789 d o n 2 + 6.318 d o n 5.3624 .
At nine characteristic points, the root mean squared error was 0.226, adjusted R2 = 0.995. The determined coefficients of the polynomial were significant, pvalue = 4.170 × 10⁻⁸. Figure 8a also shows the confidence intervals of the coefficient estimates in the nonlinear regression model. The sharpest points were observed at don of 1.9 mm and 2.1 mm. However, they are within the range defined by the confidence limits.
Standardized residuals at individual points of Q (Figure 8b) ranged from (−1…1). The nature of the scatter is irregular and reaches maximum values at don of 1.9 mm and 2.1 mm. As in the case of AC injector W01-4, there was no relationship between the value of standardized residuals and the diameter of the outlet nozzle bore. The pressure and temperature fluctuations (Table 4 and Figure 8c) were negligible (pair = 0.094 × 10⁵ Pa and Tair = (1.367 + 273.15) K), and thus should not affect the shape of the flow characteristics.

3.3. Matrix HS 211.20. Injector
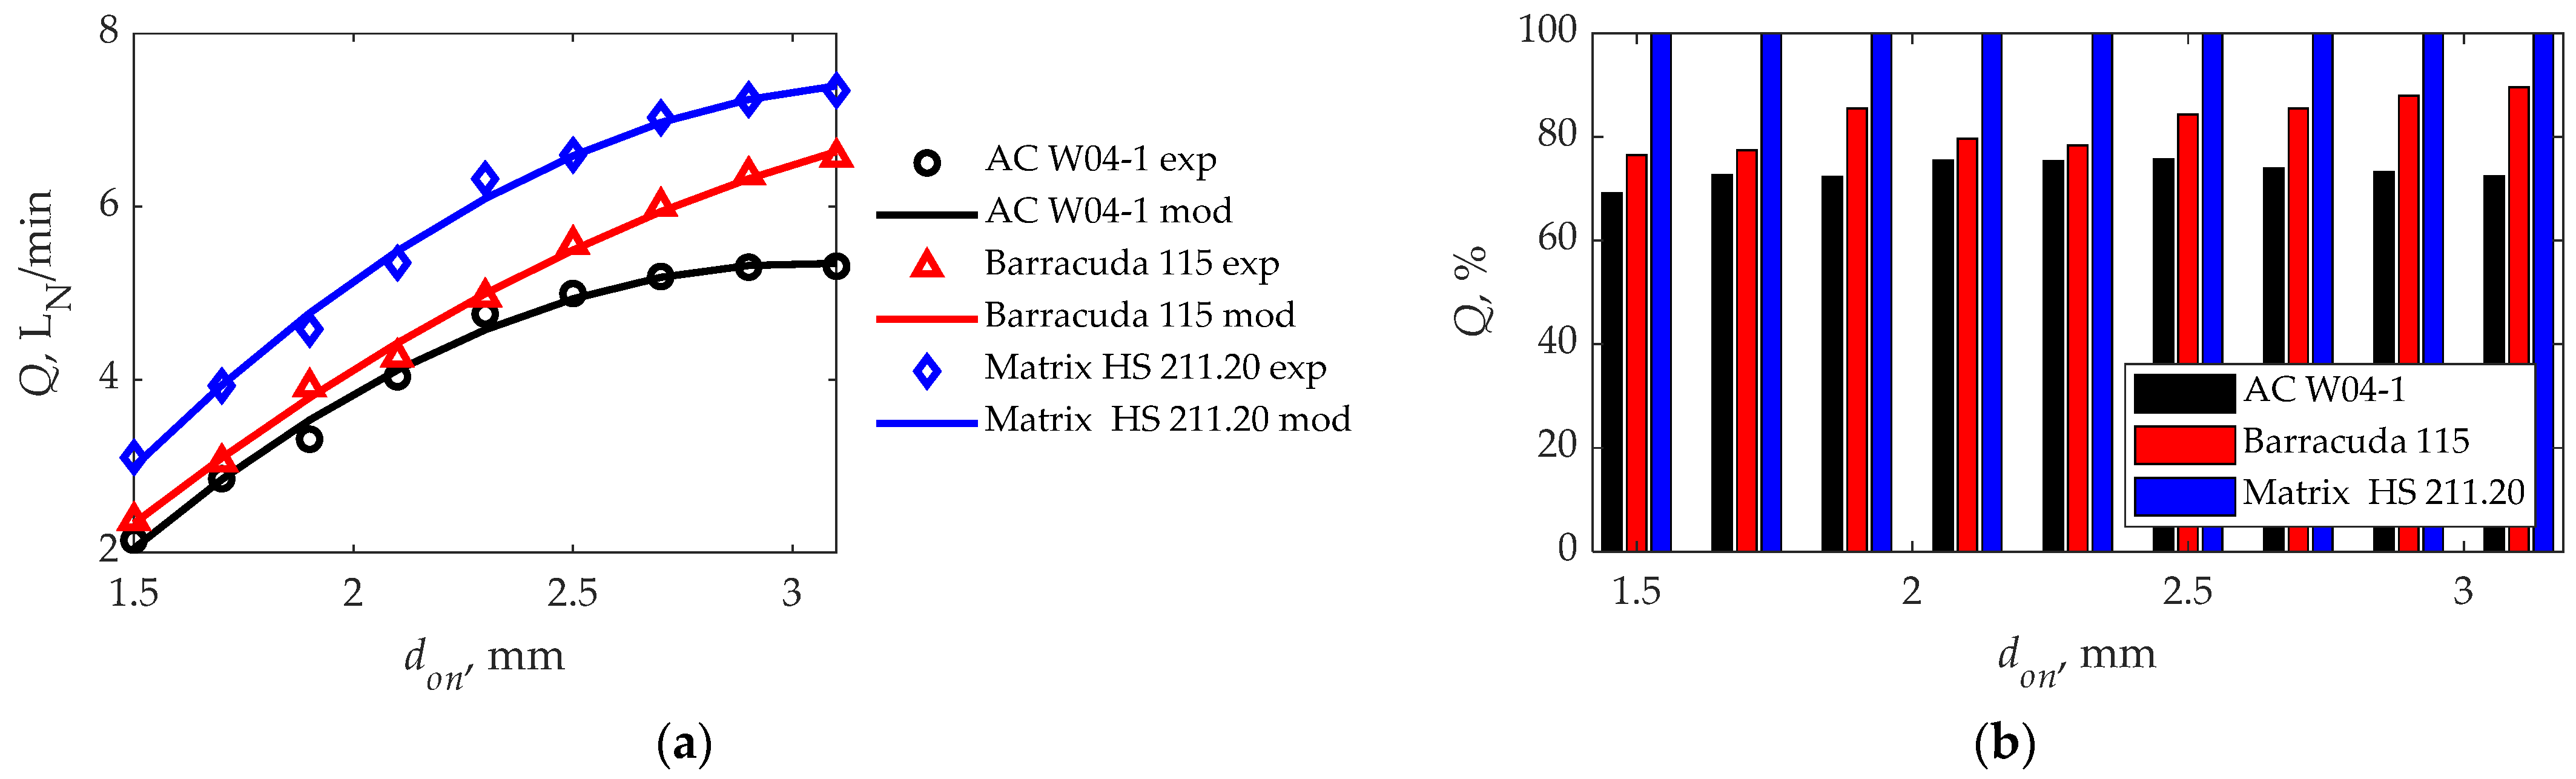
The results of the Matrix HS 211.20 injector (Table 5), similarly to the previous two, showed that the values of Q mean and median are close to each other, which indicates the correctness of the inference. The values of standard deviation are within the limits (0.128…0.148), by which they will not fundamentally affect the evaluation of the shape of the flow characteristics. Positive values of kurtosis indicate leptokurtic distribution. The asymmetry factor mostly showed left skewness. The values of skewness, as well as kurtosis, are acceptable for further analysis [65]. Following the pattern of previous analyses, the flow characteristics of the Matrix HS 211.20 injector were fitted with a second-degree polynomial (Figure 9a), obtaining significant coefficients as written in Equation (3).
Q = 1.404 d o n 2 + 9.212 d o n 7.663 .
At nine characteristic points, the root mean squared error was 0.320, with an adjusted R2 = 0.982. The determined coefficients of the polynomial were significant, pvalue = 2.590 × 10⁻⁷. Figure 7a also shows the confidence intervals of the coefficient estimates in the nonlinear regression model. The sharpest points were observed at don of 1.9 mm and 2.3 mm. However, they are within the range defined by the confidence limits.
Standardized residuals at individual measurement points are shown in Figure 9b, where scatter within (−1…1) is evident. The nature of the scatter is irregular and reaches maximum values at don of 1.9 mm and 2.3 mm. As in the previous two cases, there was no relationship between the value of standardized residuals and the diameter of the outlet nozzle bore. The pressure and temperature fluctuations (Table 5 and Figure 9c) were negligible (pair = 0.091 × 10⁵ Pa and Tair = (1.478 + 273.15) K), and thus should not affect the shape of the flow characteristics.

4. Discussion

Compiling the test results in graphical form, Figure 10a was obtained. All of the tested injectors showed an increasing trend with an “inflection” near the maximum values. The Barracuda 115 injector has the characteristic with the least degree of curvature. The studies presented in the paper are among the first on the subject, so it is difficult to find literature reports for comparison. The only data we can find are the rarely posted information in manufacturers’ technical materials.
Figure 11a shows the dependence of volumetric flow rate on injector nozzle bore diameter for the Barracuda injector [70] (supply pressure pair = 1 × 10⁵ Pa). The difference here is that the injector was continuously open, rather than cycled open at a preset time and frequency as in this study. There are differences in Q values, but the trend of increments in both cases is preserved. For the other injectors studied, unfortunately, no comparative data was found. In manufacturers’ technical materials, information regarding the predicted maximum power Pmax obtainable from one cylinder at different don diameters can be found more often than information regarding Q values. Figure 11b shows the dependence of Pmax on don for Barracuda 115 [70] and AC W01-4 [58] injectors (supply pressure pgas = 1 × 10⁵ Pa). Here, too, an upward trend of a comparable nature to the study’s results is evident (except for the last point in the case of the AC W01-4 injector).
Analyzing the aggregate results shown in Figure 10a, the issue of Q differences at the same don points for different injectors remains to be clarified. Keep in mind that the same supply pressure value (pair = 1 × 10⁵ Pa) and the same don hole diameters are the main flow restriction. The highest Q values were obtained for the Matrix HS 211.20 injector, on average the volumetric flow rate was 17.3% higher than the Barracuda 115 injector and 26.7% higher than the AC-W01-4 injector (Figure 10b). Different injector opening and closing times are seen as a possible reason for the differences in Q values under the same test conditions for the different injectors. It is uncertain at this point whether the manufacturers (Table 1) meant the same thing by opening and closing times, i.e., whether it includes the response (delay) time or only the opening and closing times.
Therefore, it was decided to conduct additional tests to confirm the values of opening and closing times for the tested injectors. The test stand, as mentioned earlier, had the ability to determine these times. The cyclicality of the injector was assumed according to the basic tests, timp = 5 ms, f = 16.67 Hz, supply air pressure pair = 1 × 10⁵ Pa, and diameter don = 2.9 mm. Additional equipment included:
  • Oscilloscope RIGOL MSO4014 (bandwidth—100 MHz; real time sample rate—up to 4 GSa/s; vertical resolution—8 bit; frequency—1 kHz);
  • Voltage meter RIGOL RP1500A (bandwidth ~150 MHz; damping factor—10:1; maximum input voltage—CAT II 300V AC);
  • Pressure sensor MPXH6400A (response time < 1 ms; range (20…400) kPa; output signal (0…5) V; accuracy 0.25%).
Measuring the pressure at the outlet of the injector nozzle as an indirect method for evaluating opening and closing times is widely used by manufacturers and, as shown in [49], yields results comparable to direct methods, particularly for opening times.
Comparing the results of the additional tests shown in Figure 12 and in Table 6, differences between the injectors are apparent. While the closing times are similar and within (1.64…1.88) ms, the opening times are different. The times quoted by the injector manufacturers (Table 1) also differ from those determined in additional tests (Table 6). The implication is that manufacturers can only determine the opening and closing times based on the process itself, ignoring the response times. The Matrix HS 211.20 injector had the shortest opening time (calculated from the start of the control pulse), which is 1.54 ms. The Barracuda 115 injector’s time was 29.3% longer (2.18 ms), as was the AC W01-4 injector’s one, with an elongation of 36.6% (2.45 ms). The pressure waveforms shown in Figure 12 show lower values for the Matrix HS 211.20 injector, which translated into lower average pressure per cycle (Table 6). In this case, the AC W01-4 injector’s pressure was 1.8% higher, while the Barracuda 115 injector’s one was 9.94% higher.
All this helps indirectly explain the differences in volumetric flow rate of the tested injectors when using nozzles with the same bore diameter. The supply pressure was maintained at 1 × 10⁵ Pa. An increase in supply pressure increases the maximum values at the outlet while increasing the opening time and decreasing the closing time, as shown in study [71].
The maximum stroke of the actuator (plunger, plate) and the resulting relationship of the flow field within the injector valve and the flow field in the outlet nozzle bore may be responsible for the nature of the “inflection” of the flow characteristic (Figure 10a). Unfortunately, the stroke of the actuators is not given in the manufacturers’ technical materials, so it requires further research.
The overall study showed a significant effect of the diameter of the outlet nozzle bore don of the injector on its flow characteristics. In addition, it was proven that the volumetric flow rate Q is also affected by the process of opening and closing the injector, so that different injectors with the same nozzle diameter have different Q. The topic addressed in the study requires further research, especially in the aspect of the effect of actuator pitch on flow characteristic.

5. Conclusions

Although transportation is increasingly using electric and hybrid propulsion, internal combustion engines are still the main source of propulsion. The use of alternative car-power systems, particularly LPG, is cited as one method that promotes reductions in toxic emissions and fuel costs. In this type of system, the executive element responsible for fuel dosage is the low-pressure gas-phase injector. If the conversion of an internal combustion engine to gas power indicates the need to increase the diameter of the outlet nozzle bore, it is important to know the flow characteristics with respect to this variable. Injector manufacturers present such characteristics for a continuously open injector, which is not practical, since the injector cycles at a certain frequency and time of opening. Therefore, which is new, it was decided to determine the flow characteristics of structurally different injectors operating at a certain frequency and time of opening depending on the diameter of the nozzle bore. Based on the research and analysis carried out, it was found out that:
  • There are discrepancies in the flow characteristics of the tested injectors at the same diameters of the outlet nozzle bores;
  • Flow characteristics can be successfully fitted by a second-degree polynomial obtaining high-quality values.
  • Highest volumetric flow rate values were obtained for the Matrix HS 211.20 injector; on average, it was 19.6% higher than the Barracuda 115 injector and 35.8% higher than the AC-W01-4 injector;
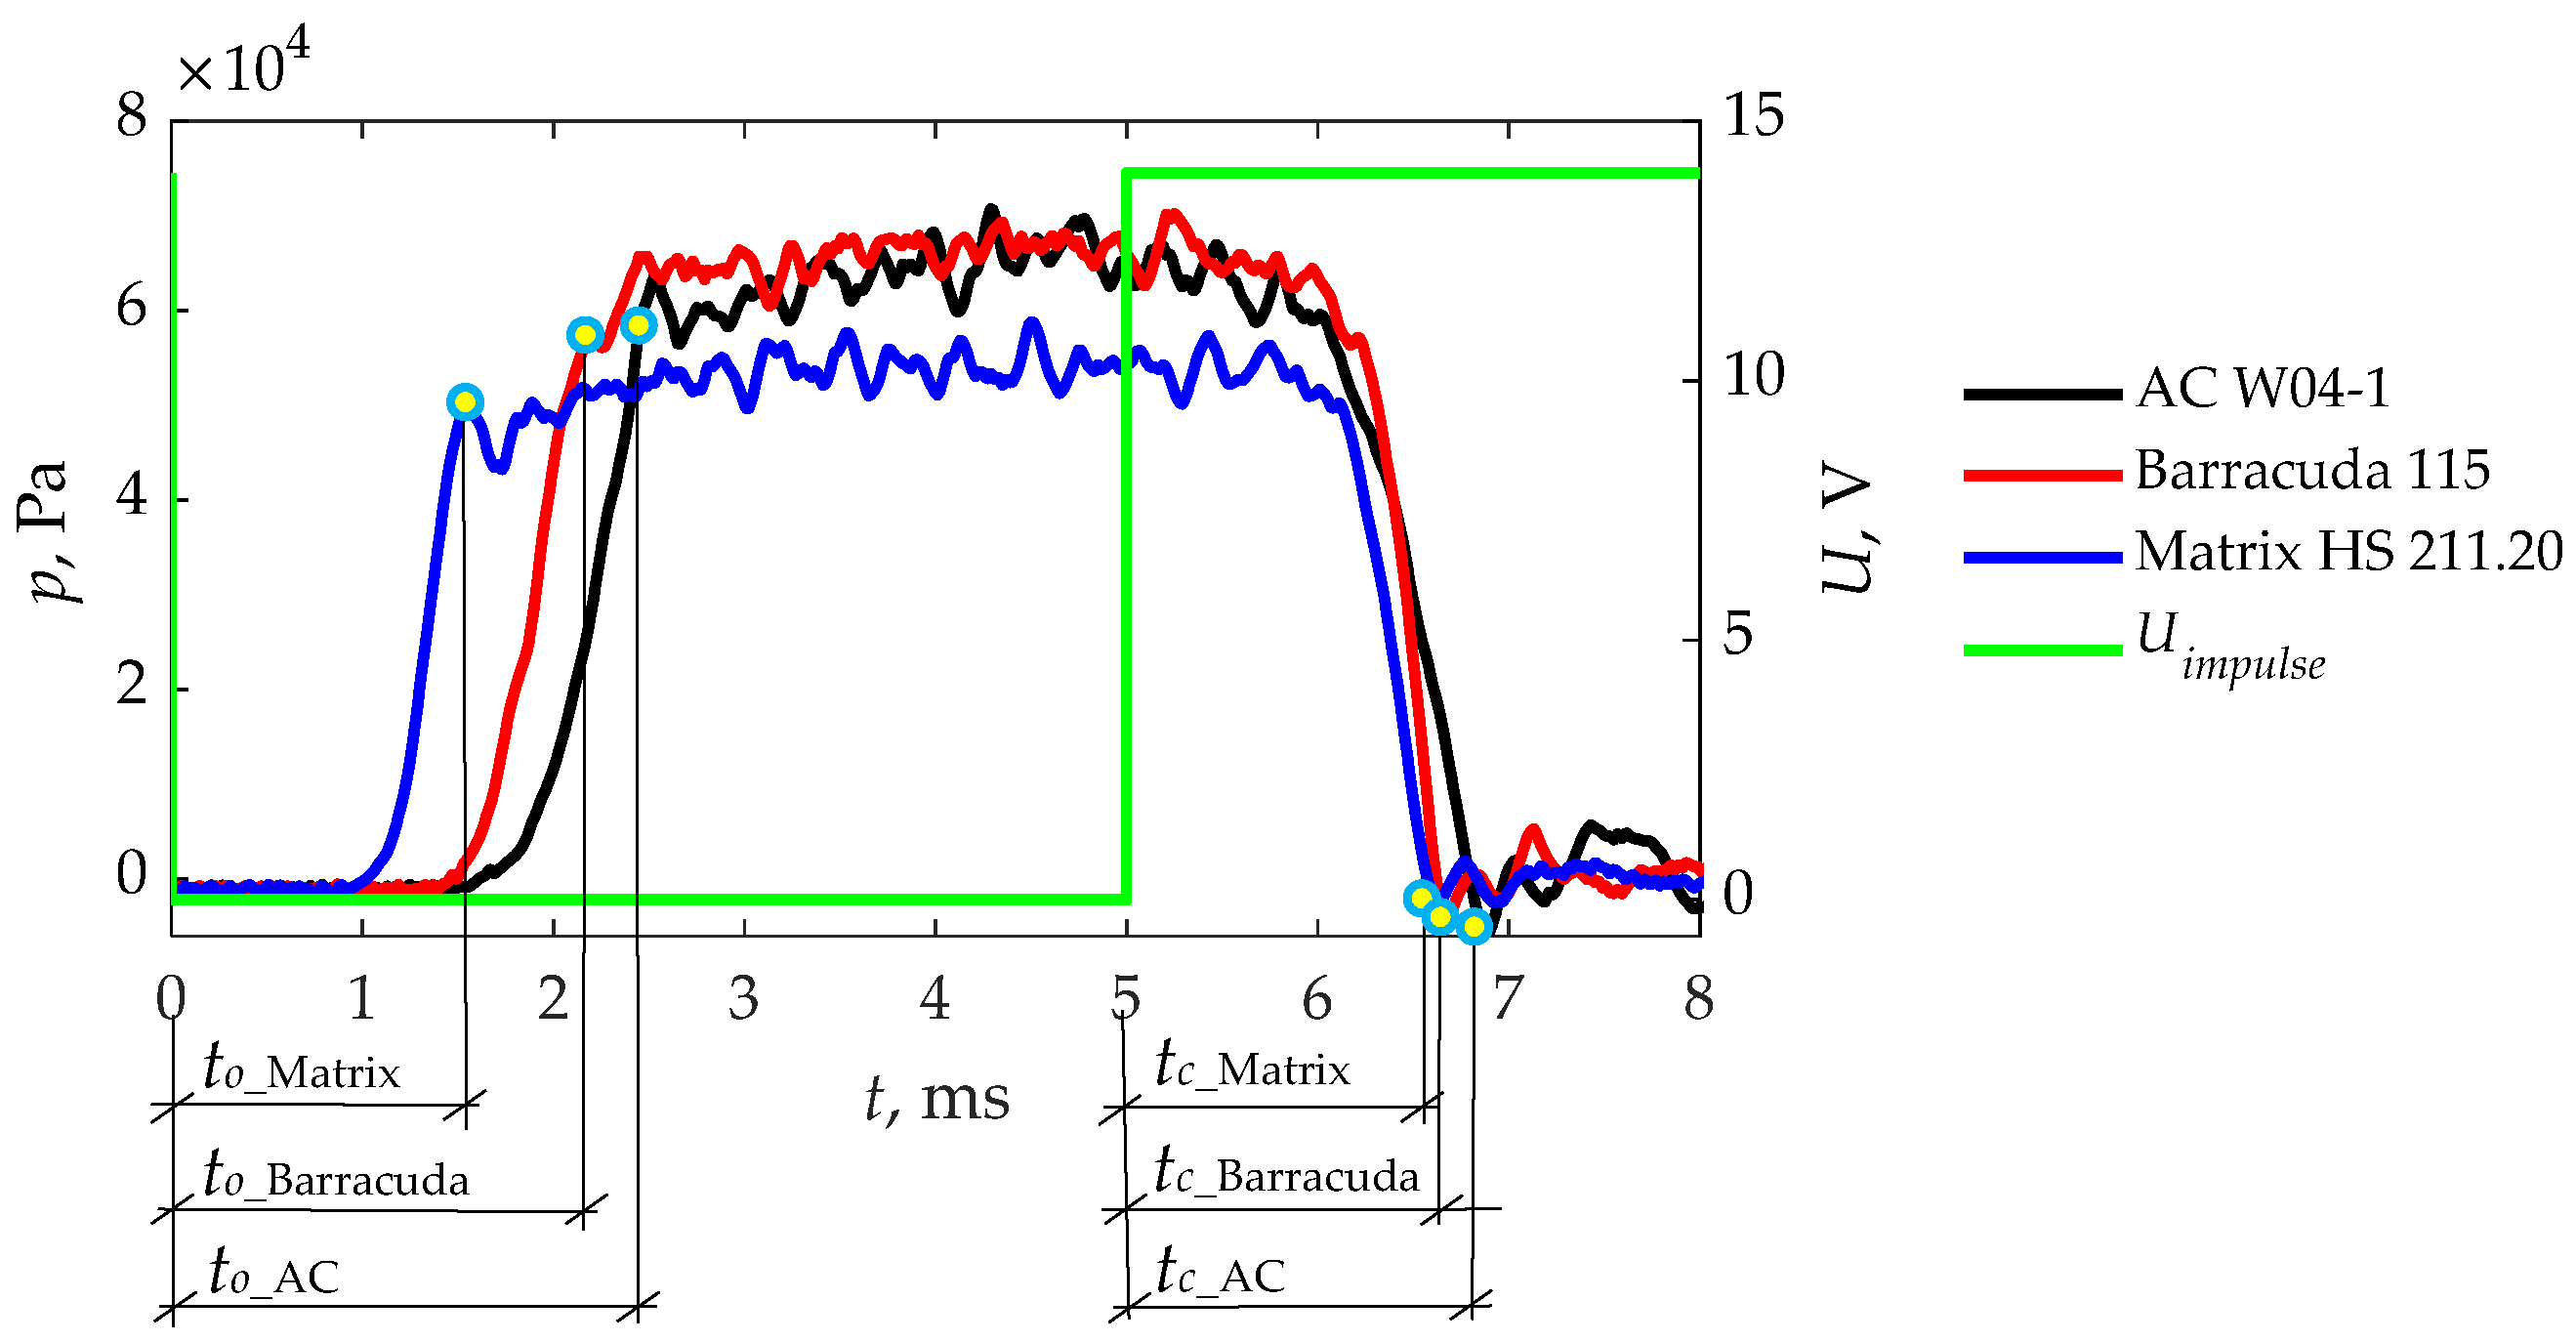
  • Shortest opening time (calculated from the beginning of the control pulse) was obtained for the Matrix HS 211.20 injector and was 1.54 ms; the Barracuda 115 injector`s time was longer by 29.3% (2.18 ms), while the AC W01-4 injector’s time was longer by 36.6% (2.45 ms);
  • The closing times of the tested injectors (calculated from the control pulse fade) were very similar (1.64…1.88) ms;
  • Injector nozzle outlet pressure waveforms showed lower values for the Matrix HS 211.20 injector, which translated into lower average cycle pressure; the AC W01-4 injector’s pressure was 1.8% higher, and the Barracuda 115 injector’s one was 9.94% higher;
  • Studies of opening and closing times and nozzle outlet pressure waveforms allowed an indirect explanation of the differences in volumetric flow rate of the tested injectors when using nozzles with the same bore diameter.
In the next stage, it is planned to continue research on the determination of flow characteristics with different variables, such as supply pressure and actuator stroke.

Author Contributions

D.S. and B.T. supervised all the analyses, conceptualized the article, participated in the research and wrote the paper; A.B. and G.M. compiled the literature review, performed the analysis, and performed the re-review and editing and formal analysis. All authors have read and agreed to the published version of the manuscript.

Funding

This research received no external funding.

Institutional Review Board Statement

Not applicable.

Informed Consent Statement

Not applicable.

Data Availability Statement

The data presented in this study are available on request from the corresponding author. At the time the project was carried out, there was no obligation to make the data publicly available.

Acknowledgments

Analyses was partially financed through a subsidy from the Ministry of Science and Higher Education of Poland for the discipline of mechanical engineering at the Faculty of Mechanical Engineering Bialystok University of Technology WZ/WM-IIM/4/2020.

Conflicts of Interest

The authors declare no conflict of interest.

Abbreviations and Acronyms

The following abbreviations and acronyms are used in this manuscript.
AMFAAlternative Motor Fuels Act
CAFÉCorporate Average Fuel Economy
CAIControlled Auto-Ignition
CARB-CAR California Air Resources Board and validated by the Climate Action Reserve
CNGCompressed Natural Gas
CO2Carbon dioxide
GHGsGreenhouse Gases
H2Hydrogen
HCCIHomogeneous Charge Compression Ignition
LNGLiquefied Natural Gas
LPGLiquefied Petroleum Gas
NEDCNew European Driving Cycle
PWMPulse-Width Modulation signal
RCCIReactivity Controlled Compression Ignition
RDEReal Driving Emissions test
WLTCWorldwide Harmonized Light vehicles Test Cycle

References

  1. García, A.; Monsalve-Serrano, J.; Villalta, D.; Guzmán-Mendoza, M. Methanol and OMEx as fuel candidates to fulfill the potential EURO VII emissions regulation under dual-mode dual-fuel combustion. Fuel 2020, 287, 119548. [Google Scholar] [CrossRef]
  2. Bielaczyc, P.; Woodburn, J. Trends in Automotive Emission Legislation: Impact on LD Engine Development, Fuels, Lubricants and Test Methods: A Global View, with a Focus on WLTP and RDE Regulations. Emiss. Control Sci. Technol. 2019, 5, 86–98. [Google Scholar] [CrossRef] [Green Version]
  3. Toumasatos, Z.; Kontses, A.; Doulgeris, S.; Samaras, Z.; Ntziachristos, L. Particle emissions measurements on CNG vehicles focusing on Sub-23nm. Aerosol Sci. Technol. 2021, 55, 182–193. [Google Scholar] [CrossRef]
  4. Raslavičius, L.; Keršys, A.; Mockus, S.; Keršiene, N.; Starevičius, M. Liquefied petroleum gas (LPG) as a medium-term option in the transition to sustainable fuels and transport. Renew. Sustain. Energy Rev. 2014, 32, 513–525. [Google Scholar] [CrossRef]
  5. Saiteja, P.; Ashok, B. A critical insight review on homogeneous charge compression ignition engine characteristics powered by biofuels. Fuel 2021, 285, 119202. [Google Scholar] [CrossRef]
  6. Mikulski, M.; Bekdemir, C. Understanding the role of low reactivity fuel stratification in a dual fuel RCCI engine—A simulation study. Appl. Energy 2017, 191, 689–708. [Google Scholar] [CrossRef]
  7. Hunicz, J.; Kordos, P. An experimental study of fuel injection strategies in CAI gasoline engine. Exp. Therm. Fluid Sci. 2011, 35, 243–252. [Google Scholar] [CrossRef]
  8. Caban, J. The investigation of eco-driving possibilities in passenger car used in urban traffic. Proc. Transp. Res. Procedia 2021, 55, 212–219. [Google Scholar] [CrossRef]
  9. Clairotte, M.; Suarez-Bertoa, R.; Zardini, A.A.; Giechaskiel, B.; Pavlovic, J.; Valverde, V.; Ciuffo, B.; Astorga, C. Exhaust emission factors of greenhouse gases (GHGs) from European road vehicles. Environ. Sci. Eur. 2020, 32, 125. [Google Scholar] [CrossRef]
  10. Liu, Y.; Helfand, G.E. The Alternative Motor Fuels Act, alternative-fuel vehicles, and greenhouse gas emissions. Transp. Res. Part A: Policy Pract. 2009, 43, 755–764. [Google Scholar] [CrossRef]
  11. Marino, B.D.V.; Mincheva, M.; Doucett, A. California air resources board forest carbon protocol invalidates offsets. PeerJ 2019, 2019, e7606. [Google Scholar] [CrossRef]
  12. Yang, C.; Zha, M.; Wang, W.; Liu, K.; Xiang, C. Efficient energy management strategy for hybrid electric vehicles/plug-in hybrid electric vehicles: Review and recent advances under intelligent transportation system. IET Intell. Transp. Syst. 2020, 14, 702–711. [Google Scholar] [CrossRef]
  13. Hannan, M.A.; Azidin, F.A.; Mohamed, A. Hybrid electric vehicles and their challenges: A review. Renew. Sustain. Energy Rev. 2014, 29, 135–150. [Google Scholar] [CrossRef]
  14. Zarma, T.A.; Galadima, A.A.; Aminu, M.A. Review of Motors for Electrical Vehicles. J. Sci. Res. Rep. 2019, 24, 1–6. [Google Scholar] [CrossRef]
  15. Ahmad, A.; Khan, Z.A.; Alam, M.; Rafat, Y.; Chabaan, R.C.; Khan, I.; Bharadwaj, A. A Bibliographical Review of Electrical Vehicles (xEVs) Standards. SAE Int. J. Altern. Powertrains 2018, 7, 63–98. [Google Scholar] [CrossRef]
  16. Sun, Y.; Anwar, M.; Hassan, N.M.S.; Spiryagin, M.; Cole, C. A review of hydrogen technologies and engineering solutions for railway vehicle design and operations. Railw. Eng. Sci. 2021, 29, 212–232. [Google Scholar] [CrossRef]
  17. Popa, M.E.; Segers, A.J.; Denier van der Gon, H.A.C.; Krol, M.C.; Visschedijk, A.J.H.; Schaap, M.; Röckmann, T. Impact of a future H2 transportation on atmospheric pollution in Europe. Atmos. Environ. 2015, 113, 208–222. [Google Scholar] [CrossRef] [Green Version]
  18. Fang, Y.; Lu, Y.; Roskilly, A.P.; Yu, X. A review of compressed air energy systems in vehicle transport. Energy Strategy Rev. 2021, 33, 100583. [Google Scholar] [CrossRef]
  19. Korbut, M.; Szpica, D. A Review of Compressed Air Engine in the Vehicle Propulsion System. Acta Mech. Autom. 2021, 15, 215–226. [Google Scholar] [CrossRef]
  20. Rayapureddy, S.M.; Matijošius, J.; Rimkus, A.; Caban, J.; Słowik, T. Comparative Study of Combustion, Performance and Emission Characteristics of Hydrotreated Vegetable Oil–Biobutanol Fuel Blends and Diesel Fuel on a CI Engine. Sustainability 2022, 14, 7324. [Google Scholar] [CrossRef]
  21. Masi, M. Experimental analysis on a spark ignition petrol engine fuelled with LPG (liquefied petroleum gas). Energy 2012, 41, 252–260. [Google Scholar] [CrossRef]
  22. Erkus, B.; Sürmen, A.; Karamangil, M.I. A comparative study of carburation and injection fuel supply methods in an LPG-fuelled SI engine. Fuel 2013, 107, 511–517. [Google Scholar] [CrossRef]
  23. Frick, M.; Axhausen, K.W.; Carle, G.; Wokaun, A. Optimization of the distribution of compressed natural gas (CNG) refueling stations: Swiss case studies. Transp. Res. Part D Transp. Environ. 2007, 12, 10–22. [Google Scholar] [CrossRef]
  24. Aslam, M.U.; Masjuki, H.H.; Kalam, M.A.; Amalina, M.A. A Comparative Evaluation of the Performance and Emissions of a Retrofitted Spark Ignition Car Engine. J. Energy Environ. 2005, 4, 97–110. [Google Scholar]
  25. Arteconi, A.; Brandoni, C.; Evangelista, D.; Polonara, F. Life-cycle greenhouse gas analysis of LNG as a heavy vehicle fuel in Europe. Appl. Energy 2010, 87, 2005–2013. [Google Scholar] [CrossRef]
  26. Kumar, S.; Kwon, H.-T.; Choi, K.-H.; Lim, W.; Cho, J.H.; Tak, K.; Moon, I. LNG: An eco-friendly cryogenic fuel for sustainable development. Appl. Energy 2011, 88, 4264–4273. [Google Scholar] [CrossRef]
  27. Wu, Z.; Wang, L.; Badra, J.A.; Roberts, W.L.; Fang, T. GDI fuel sprays of light naphtha, PRF95 and gasoline using a piezoelectric injector under different ambient pressures. Fuel 2018, 223, 294–311. [Google Scholar] [CrossRef]
  28. Mitukiewicz, G.; Dychto, R.; Leyko, J. Relationship between LPG fuel and gasoline injection duration for gasoline direct injection engines. Fuel 2015, 153, 526–534. [Google Scholar] [CrossRef]
  29. Kim, K.B.; Kim, Y.J.; Lee, K.H.; Lee, K.S. Experimental approaches to investigating liquefied LPG spray characteristics. At. Sprays 2010, 20, 553–564. [Google Scholar] [CrossRef]
  30. AC, S.A. STAG 500 DIS—Dual Injection System. Available online: https://autogasecologico.com/wp-content/uploads/2020/11/STAG-500-DIS.pdf (accessed on 20 December 2022).
  31. Warguła, Ł.; Kukla, M.; Lijewski, P.; Dobrzyński, M.; Markiewicz, F. Influence of the use of Liquefied Petroleum Gas (LPG) systems in woodchippers powered by small engines on exhaust emissions and operating costs. Energies 2020, 13, 5773. [Google Scholar] [CrossRef]
  32. Warguła, Ł.; Kukla, M.; Lijewski, P.; Dobrzyński, M.; Markiewicz, F. Impact of Compressed Natural Gas (CNG) fuel systems in small engine wood chippers on exhaust emissions and fuel consumption. Energies 2020, 13, 6709. [Google Scholar] [CrossRef]
  33. Aleiferis, P.G.; Serras-Pereira, J.; Augoye, A.; Davies, T.J.; Cracknell, R.F.; Richardson, D. Effect of fuel temperature on in-nozzle cavitation and spray formation of liquid hydrocarbons and alcohols from a real-size optical injector for direct-injection spark-ignition engines. Int. J. Heat Mass Transf. 2010, 53, 4588–4606. [Google Scholar] [CrossRef] [Green Version]
  34. Jang, C.; Kim, S.; Choi, S. An experimental and analytical study of the spray characteristics of an intermittent air-assisted fuel injector. At. Sprays 2000, 10, 199–217. [Google Scholar] [CrossRef]
  35. Panão, M.R.O.; Moreira, A.L.N. Flow characteristics of spray impingement in PFI injection systems. Exp. Fluids 2005, 39, 364–374. [Google Scholar] [CrossRef] [Green Version]
  36. Kakuhou, A.; Urushihara, T.; Itoh, T.; Takagi, Y. Characteristics of mixture formation in a direct injection SI engine with optimized in-cylinder swirl air motion. J. Engines 1999, 108, 550–558. [Google Scholar] [CrossRef]
  37. Leach, B.; Zhao, H.; Li, Y.; Ma, T. Two-phase fuel distribution measurements in a gasoline direct injection engine with an air-assisted injector using advanced optical diagnostics. Proc. Inst. Mech. Eng. Part D J. Automob. Eng. 2007, 221, 663–673. [Google Scholar] [CrossRef]
  38. Cavicchi, A.; Postrioti, L. Simultaneous needle lift and injection rate measurement for GDI fuel injectors by laser Doppler vibrometry and Zeuch method. Fuel 2021, 285, 119021. [Google Scholar] [CrossRef]
  39. Sedarsky, D.; Idlahcen, S.; Rozé, C.; Blaisot, J.B. Velocity measurements in the near field of a diesel fuel injector by ultrafast imagery. Exp. Fluids 2013, 54, 1451. [Google Scholar] [CrossRef] [Green Version]
  40. Sforzo, B.A.; Tekawade, A.; Kastengren, A.L.; Fezzaa, K.; Ilavsky, J.; Powell, C.F.; Pei, Y.; Zhang, A.; Levy, R. X-Ray Characterization of Real Fuel Sprays for Gasoline Direct Injection. J. Energy Resour. Technol. Trans. ASME 2022, 144, 022303. [Google Scholar] [CrossRef]
  41. Ramírez, A.I.; Som, S.; Aggarwal, S.K.; Kastengren, A.L.; El-Hannouny, E.M.; Longman, D.E.; Powell, C.F. Quantitative X-ray measurements of high-pressure fuel sprays from a production heavy duty diesel injector. Exp. Fluids 2009, 47, 119–134. [Google Scholar] [CrossRef]
  42. Serras-Pereira, J.; Aleiferis, P.G.; Walmsley, H.L.; Davies, T.J.; Cracknell, R.F. Heat flux characteristics of spray wall impingement with ethanol, butanol, iso-octane, gasoline and E10 fuels. Int. J. Heat Fluid Flow 2013, 44, 662–683. [Google Scholar] [CrossRef]
  43. Aleiferis, P.G.; Van Romunde, Z.R. An analysis of spray development with iso-octane, n-pentane, gasoline, ethanol and n-butanol from a multi-hole injector under hot fuel conditions. Fuel 2013, 105, 143–168. [Google Scholar] [CrossRef] [Green Version]
  44. Locke, R.J.; Hicks, Y.R.; Anderson, R.C.; Zaller, M.M. Optical Fuel Injector Patternation Measurements in Advanced Liquid-Fueled, High Pressure, Gas Turbine Combustors. Combust. Sci. Technol. 1998, 138, 297–311. [Google Scholar] [CrossRef] [Green Version]
  45. Dong, Q.; Yang, X.; Jia, D.; Song, E.; Yao, C. Measurement and verification of transient injection flow rate of high pressure natural gas pulse injector. Flow Meas. Instrum. 2020, 76, 101831. [Google Scholar] [CrossRef]
  46. Walaszyk, A.; Busz, W. Application of optical method for the analysis delay between control injector coil and beginning of the fuel injection. Combust. Engines 2013, 154, 1038–1041. [Google Scholar]
  47. Crua, C.; Heikal, M.R.; Gold, M.R. Microscopic imaging of the initial stage of diesel spray formation. Fuel 2015, 157, 140–150. [Google Scholar] [CrossRef] [Green Version]
  48. Duk, M.; Czarnigowski, J. The method for indirect identification gas injector opening delay time. Prz. Elektrotech. 2012, 88, 59–63. [Google Scholar]
  49. Szpica, D. Validation of indirect methods used in the operational assessment of LPG vapor phase pulse injectors. Meas. J. Int. Meas. Confed. 2018, 118, 253–261. [Google Scholar] [CrossRef]
  50. Czarnigowski, J. Teoretyczno-Empiryczne Studium Modelowania Impulsowego Wtryskiwacza Gazu; Wydawnictwo Politechniki Lubelskiej: Lublin, Poland, 2012; ISBN PL 978-83-63569-09-9. [Google Scholar]
  51. Safiullah; Chandra Ray, S.; Nishida, K.; McDonell, V.; Ogata, Y. Effects of full transient Injection Rate and Initial Spray Trajectory Angle profiles on the CFD simulation of evaporating diesel sprays- comparison between singlehole and multi hole injectors. Energy 2023, 263, 125796. [Google Scholar] [CrossRef]
  52. Zhang, Y.; Nishida, K.; Yoshizaki, T. Quantitative Measurement of Droplets and Vapor Concentration Distributions in Diesel Sprays by Processing UV and Visible Images; SAE Technical Papers; SAE International: Warrendale, PA, USA, 2001. [Google Scholar]
  53. Lefebvre, A.H.; Mcdonell, V.G. Atomization and Sprays, 2nd ed.; CRC Press: Boca Raton, FL, USA, 2017; ISBN 9781498736268. [Google Scholar]
  54. Ambrozik, A.; Kurczyński, D. Analysis of fast-changing quantities in the AD3.152 UR engine running of mineral fuel, plant fuel and their blends. Motrol 2008, 10, 11–22. [Google Scholar]
  55. Szpica, D.; Czaban, J. Operational assessment of selected gasoline and LPG vapour injector dosage regularity. Mechanika 2014, 20, 480–488. [Google Scholar] [CrossRef] [Green Version]
  56. Lim, B.C.; Lee, C.H. A comparative study of the measurement of the fuel injection rate of a diesel piezo injector with a scale and a positive displacement flow meter. ARPN J. Eng. Appl. Sci. 2021, 16, 2668–2673. [Google Scholar]
  57. Hung, D.L.S.; Harrington, D.L.; Gandhi, A.H.; Markle, L.E.; Parrish, S.E.; Shakal, J.S.; Sayar, H.; Cummings, S.D.; Kramer, J.L. Gasoline fuel injector spray measurement and characterization—A new SAE J2715 recommended practice. SAE Int. J. Fuels Lubr. 2009, 1, 534–548. [Google Scholar] [CrossRef]
  58. AC S.A. Instrukcja Obsługi. Listwa Wtryskowa AC W01 i AC W01 BFC. Available online: https://www.ac.com.pl/pl-centrum-pobran-schematy-listwy-wtryskowe (accessed on 20 December 2022).
  59. Alex Sp. z o.o. Barracuda LPG/SNG Injector. Available online: https://autogas-alex.com/wp-content/uploads/2019/07/Barracuda-PL.pdf (accessed on 20 December 2022).
  60. MATRIX S.p.A. Matrix Gas Injectors HS Series—CNG & LPG. Available online: http://www.matrix.to.it/pdf/hslight.pdf (accessed on 20 December 2022).
  61. Szpica, D. Investigating fuel dosage non-repeatability of low-pressure gas-phase injectors. Flow Meas. Instrum. 2018, 59, 147–156. [Google Scholar] [CrossRef]
  62. Szpica, D. Fuel dosage irregularity of LPG pulse vapor injectors at different stages of wear. Mechanika 2016, 22, 44–50. [Google Scholar] [CrossRef]
  63. Szpica, D.; Dziewiątkowski, M. Analysis of selected functional parameters of the gas supply system during NEDC and WLTC cycles. In Transport Means, Proceedings of the International Conference, Kaunas, Lithuania, 30 September–2 October 2020; Kaunas University of Technology: Kaunas, Lithuania, 2020. [Google Scholar]
  64. Beik, Y.; Dziewiątkowski, M.; Szpica, D. Exhaust emissions of an engine fuelled by petrol and Liquefied Petroleum Gas with control algorithm adjustment. SAE Int. J. Engines 2020, 13, 739–759. [Google Scholar] [CrossRef]
  65. Carey, V.J.; Wang, Y.-G. Mixed-Effects Models in S and S-Plus. J. Am. Stat. Assoc. 2001, 96, 1135–1136. [Google Scholar] [CrossRef]
  66. Yang, W.Y.; Cao, W.; Chung, T.-S.; Morris, J. Applied Numerical Methods Using MATLAB®; Wiley & Sons: Hoboken, NJ, USA, 2020; ISBN 9780471698333. [Google Scholar]
  67. Kass, R.E.; Bates, D.M.; Watts, D.G.; Seber, G.A.F.; Wild, C.J. Nonlinear Regression Analysis and Its Applications. J. Am. Stat. Assoc. 1990, 85, 594. [Google Scholar] [CrossRef]
  68. Yang, W.; Wang, Y.; Yan, L.; Han, Z.; Gerling, D. Online detection of inverter voltage error based on the voltage oversampling measurement and sigmoidal function model. IEEE Trans. Power Electron. 2022, 37, 303–312. [Google Scholar] [CrossRef]
  69. Chen, L.; Zeng, R.; Jiang, Z. Nonlinear dynamical model of an automotive dual mass flywheel. Adv. Mech. Eng. 2015, 7, 1–11. [Google Scholar] [CrossRef]
  70. Alex, Sp. z o.o. Tabela Przepływów Statycznych Względem Średnicy Dyszy Wtryskiwaczy RAIL-001, FLIPPER, Barracuda. Available online: https://autogas-alex.com/wp-content/uploads/2020/12/tabela-przeplywow-statycznych-względem-średnicy-dyszy.pdf (accessed on 20 December 2022).
  71. Szpica, D.; Borawski, A.; Mieczkowski, G.; Kusznier, M.; Awad, M.M.; Sadik, A.M.; Sallah, M. Evaluation of the influence of the supply pressure on functional parameters of the impulse low-pressure gas-phase injector. Acta Mech. Autom. 2020, 14, 180–185. [Google Scholar] [CrossRef]
Figure 1. Tested gas injectors: (a) AC W01-4; (b) Barracuda 115; (c) Matrix HS 211.20.
Applsci 13 01700 g001
Figure 2. Injector nozzles tested. From below: AC W01-4; Barracuda 115; Matrix HS 211.20.
Applsci 13 01700 g002
Figure 3. FALCON microscope: (a) view; (b) software.
Applsci 13 01700 g003
Figure 4. The stand structure diagram: 1—air supply; 2—air preparation system; 3—buffer tank; 4—mass flow meter; 5—tested injector; 6—electro-valve control system; 7—pressure gauge or pressure convertor; 8—thermometer gauge or thermometer convertor, 9—mass flow convertor; 10—measurement card; 11—laptop with software.
Applsci 13 01700 g004
Figure 5. Tested gas injectors: (a) front view; (b) rear view; 1—air supply; 2—air preparation system; 3—buffer tank; 4—mass flow meter; 5—tested injector; 6—electro valve control system; 7—pressure gauge or pressure convertor; 8—thermometer gauge or thermometer convertor, 9—mass flow convertor; 10—measurement card; 11—laptop with software.
Applsci 13 01700 g005
Figure 6. Example test results (a) and their statistical treatment (b) from the measurement of a Matrix 211.20 injector with a nozzle of 2.7 mm internal diameter.
Applsci 13 01700 g006
Figure 7. AC W01-4 injector flow test results with statistical analysis—graphical interpretation: (a) flow characteristic; (b) standardized residuals; (c) pressure and temperature in supply line.
Applsci 13 01700 g007
Figure 8. Barracuda 115 injector flow test results with statistical analysis—graphical interpretation: (a) flow characteristic; (b) standardized residuals; (c) pressure and temperature in supply line.
Applsci 13 01700 g008
Figure 9. Matrix HS.211.20 injector flow test results with statistical analysis—graphical interpretation: (a) flow characteristic; (b) standardized residuals; (c) pressure and temperature in supply line.
Applsci 13 01700 g009
Figure 10. Summary of research results: (a) flow characteristic; (b) percentage differences to the Matrix HS 211.20 injector.
Applsci 13 01700 g010
Figure 11. Comparative data: (a) maximum flow; (b) power from one cylinder. Based on Refs. [58,70].
Applsci 13 01700 g011
Figure 12. Pressure waveforms at the outlet of the injector nozzle as a response to the control impulse.
Applsci 13 01700 g012
Table 1. Basic technical data of the tested injectors. Data taken from Refs. [58,59,60].
ParameterAC W01-4Barracuda 115Matrix HS 211.20
Type of injectorplunger, cross flowplunger, longitudinal flowflap
Max. flow at continuous opening125 LN/min115 LN/min95 LN/min
Max. performance39 kW33 kW30 kW
Coil resistance2 Ω1.9 Ω2 Ω
Opening time2.3 ms1.9 ms1.0 ms
Closing time1.4 ms1.2 ms1.0 ms
Max. working pressure4.5 × 105 Pa4.5 × 105 Pa3.0 × 105 Pa
Operating temperature(−20… + 120) + 273.15 K(−20… + 120) + 273.15 K(−20… + 120) + 273.15 K
Table 2. Parameters of the measurement equipment used in the experiments.
ParameterMeasurement DeviceResponse TimeRangeOutput SignalAccuracy
PressureMPXH6400A<1 ms(20…400) kPa(0…5) V0.25%
Temperature1-TTP002-K-1,5-150-M10x1
and TS-2000-SO-2
<0.25 s(−200…+1350)
+273.15 K
(0…10) V(±1.5)/0.2%
Flow meterBRONKHORST
F-113AC-M50-ABD-00-V
<2 s(0…300) LN/min(0…10) V0.5%
RecordDAQ-6024E measurement card (12-bit resolution) and the LabVIEW software bandwidth
Table 3. AC W01-4 injector flow test results with statistical analysis (Q, LN/min).
Parameter\Diameter1.5 mm1.7 mm1.9 mm2.1 mm2.3 mm2.5 mm2.7 mm2.9 mm3.1 mm
Mean2.1442.8553.3124.0344.7594.9955.1935.3015.310
Variance0.0160.0150.0160.0140.0220.0140.0210.0230.017
Standard deviation0.1260.1210.1240.1190.1490.1200.1450.1500.132
Asymmetry factor0.049−0.2980.081−0.4090.142−0.047−0.134−0.2310.041
Kurtosis2.2693.1092.3132.5892.1961.7982.5742.2771.934
Max value2.3443.0763.5164.2485.1275.2735.4205.5665.566
Min value1.9042.4903.0763.8094.5414.8344.8344.9815.127
Median2.1212.8323.2894.0124.7314.9735.1665.2825.276
At pressure
×105 Pa
0.995+0.0121.027+0.0160.980+0.0161.016+0.0350.995+0.0321.018+0.0171.003+0.0321.008+0.0351.019+0.027
−0.015−0.019−0.019−0.036−0.031−0.034−0.034−0.032−0.027
At temperature
+273.15 K
22.155+0.63922.902+0.57522.391+0.69422.815+0.56422.404+0.68222.327+0.56420.945+0.67622.565+0.61921.910+0.492
−0.436−0.499−0.673−0.608−0.587−0.510−0.593−0.455−0.582
Table 4. Barracuda 115 injector flow test results with statistical analysis (Q, LN/min).
Parameter\Diameter1.5 mm1.7 mm1.9 mm2.1 mm2.3 mm2.5 mm2.7 mm2.9 mm3.1 mm
Mean2.3713.0433.9154.2614.9535.5636.0046.3636.572
Variance0.0190.0160.0150.0210.0180.0190.0170.0150.018
Standard deviation0.1360.1280.1230.1440.1340.1360.1310.1210.133
Asymmetry factor0.288−0.128−0.218−0.095−0.320−0.238−0.0830.269−0.233
Kurtosis2.1842.2182.4782.1943.1512.1881.9902.5452.089
Max value2.6373.2234.1024.5415.2735.8596.2996.5926.738
Min value2.1972.7833.6623.9554.5415.2735.7136.1526.299
Median2.34593.01953.89194.23414.92815.53755.97976.34046.5468
At pressure
×105 Pa
1.000+0.0151.002+0.0091.005+0.0180.987+0.0131.009+0.0140.994+0.0210.997+0.0150.995+0.0470.991+0.036
−0.012−0.015−0.013−0.030−0.021−0.025−0.025−0.046−0.042
At temperature
+273.15 K
22.081+0.71222.242+0.55122.744+0.53722.312+0.48122.086+0.70721.720+0.58521.548+0.56221.172+0.54721.466+0.546
−0.656−0.524−0.537−0.496−0.563−0.490−0.610−0.625−0.529
Table 5. Matrix HS 211.20 injector flow test results with statistical analysis (Q, LN/min).
Parameter\Diameter1.5 mm1.7 mm1.9 mm2.1 mm2.3 mm2.5 mm2.7 mm2.9 mm3.1 mm
Mean3.1003.9294.5835.3506.3216.5977.0287.2367.341
Variance0.0210.0160.0130.0190.0220.0210.0200.0200.016
Standard deviation0.1450.1250.1150.1380.1480.1450.1420.1410.128
Asymmetry factor−0.329−0.3970.249−0.302−0.0790.164−0.203−0.014−0.450
Kurtosis2.4212.6042.7232.5462.2762.4702.2862.3772.556
Max value3.3694.1024.8345.5666.5926.8857.3247.4717.617
Min value2.7833.6624.3954.9816.0066.2996.7386.8857.031
Median3.0733.9064.5625.3256.2936.5707.0017.2107.317
At pressure
×105 Pa
1.007+0.0161.012+0.0150.997+0.0260.989+0.0260.999+0.0390.994+0.0450.997+0.0340.997+0.0300.980+0.032
−0.027−0.020−0.033−0.044−0.039−0.041−0.036−0.036−0.046
At temperature
+273.15 K
22.101+0.49721.743+0.56121.658+0.64721.594+0.61321.465+0.64521.757+0.64621.534+0.67321.619+0.78421.497+0.515
−0.577−0.513−0.622−0.657−0.625−0.624−0.695−0.681−0.559
Table 6. Comparison of injector opening and closing times determined from additional tests with manufacturers’ data from Table 1 and cycle mean pressure.
ParameterAC W01-4Barracuda 115Matrix HS 211.20
Manuf.Measur.Manuf.Measure.Manuf.Measur.
Opening time2.30 ms2.43 ms1.90 ms2.18 ms1.00 ms1.54 ms
Closing time1.40 ms1.88 ms1.20 ms1.68 ms1.00 ms1.64 ms
Cycle mean pressure1.911 × 104 Pa2.089 × 104 Pa1.878 × 104 Pa
Disclaimer/Publisher’s Note: The statements, opinions and data contained in all publications are solely those of the individual author(s) and contributor(s) and not of MDPI and/or the editor(s). MDPI and/or the editor(s) disclaim responsibility for any injury to people or property resulting from any ideas, methods, instructions or products referred to in the content.

