Article

Comparison of Fatigue Performances Based on Shape Change of Rail Fastening Spring

1
Department of Civil and Environmental Engineering, Incheon National University, Incheon 22012, Republic of Korea
2
Department of Civil Engineering, Inha University, Incheon 22212, Republic of Korea
*
Author to whom correspondence should be addressed.
Appl. Sci. 2023, 13(3), 1770; https://doi.org/10.3390/app13031770
Submission received: 25 December 2022 / Revised: 24 January 2023 / Accepted: 29 January 2023 / Published: 30 January 2023
(This article belongs to the Special Issue Railway Infrastructures Engineering: Latest Advances and Prospects)

Abstract

:
The fastening spring of a rail fastening system serves as an important connection in transferring the train load to the sleeper via rails on railway tracks. During initial fastening, a large tensile stress exceeding the yield stress can occur in the fastening spring structure, making it vulnerable to fatigue owing to stress fluctuations during train use. The damage caused by fatigue in the fastening springs have been reported for rail fastening systems on several domestic and international routes; however, research on this topic is limited. This study evaluates the fatigue performance of a fastening spring, SPS9 spring steel, developed in Korea based on shape change by performing a sensitivity analysis of various factors, including the heights at the end of the fastening spring and the spring arm, overall lateral width, and the diameter of the cross section of the fastening spring. The modified Goodman fatigue diagram was applied based on the tensile stress on initial fastening and the constant stress range due to a rail vertical displacement caused by train use through finite element analysis. The fatigue analysis showed that the lateral width and diameter factors of the fastening spring are found to be important variables for fatigue performance. Moreover, as the width and diameter increase, the fatigue performance improves significantly. The fatigue safety margin increased from 64% to 82% when the width increased from −20% to +20%, and increased from 54% to 81% with the diameter increase from 13 mm to 18 mm.

1. Introduction

A rail fastening system is critical to the running safety of a railway because it secures the rail to the sleeper or track substructure. Among the components of a rail fastening system, the fastening spring can generate a large initial tensile stress that exceeds the yield stress during the initial fastening in the assembly process. As a result of repeated stress caused by rail deflection while the train is running, the fastening spring may be vulnerable to fatigue failure. A thorough investigation on the fastening spring is required from safety perspectives. Existing studies on rail fastening systems focused solely on analyzing the interaction of the track system with each component [1,2], dynamic behavior [3,4], and overall mechanical behavior [5,6]. Regarding cases of fatigue damage to the fastening spring, studies were conducted to analyze the stress conditions and fatigue performance in the train operation [7,8,9] and the initial fastening process of the fastening spring [10,11]. Studies on the failure analysis of fatigue cracks in fastening springs [12,13] and fatigue reliability analysis [14] were also conducted.
The KR-type rail fastening system is an independently developed Korean rail fastening system and is used on some domestic railways. Figure 1a shows the assembly of the KR-type rail fastening system, while Figure 1b shows the geometry with the dimensions. The shape optimization analysis [15] and structural and fatigue performance analysis [16] for this new KR-type rail fastening system are being studied; however, these studies are still insufficient. In the shape optimization analysis studied by Han et al., they developed a fastening spring that could lower longitudinal resistance and accommodate the upward force generated by the bending angle [15]. They also conducted the shape optimization of the Vossloh fastening system [17]. Considering the resonance effect, Gao et al. changed the natural frequency of the fastening spring [17]. However, the fatigue strength of metallic structures can be defined by the initial stress and stress range. A higher initial tensile stress or stress range reduces the fatigue strength of a structure [12,18]. Past studies to identify main geometrical parameters affecting the stress condition and the fatigue performance of fastening springs have been very limited. Furthermore, a sensitivity analysis with various shape parameters to improve the fatigue performance of fastening springs has been also insufficient. As part of the method for improving the fatigue performance of the KR-type fastening spring, the effect of changing the shape of the fastening spring on fatigue performance is investigated in this study using the finite element analysis. The shape change variables include the heights of the fastening spring end and spring arm, overall lateral width, and the diameter of the cross section of the fastening spring. A sensitivity analysis of the factors is conducted. The initial stresses during the fastening process and the stress fluctuation (or amplitude) caused by vertical rail displacement owing to train use are first derived using finite element analysis. The fatigue performances of each shape change are then compared using the modified Goodman fatigue diagram [19].

2. Finite Element Analysis

Using ABAQUS, a commercial finite element analysis program, nonlinear finite element analysis was performed to derive the tensile stress value during the initial fastening process as well as the stress fluctuation value owing to the vertical deflection of the rail caused by train use. The model configuration of the KR-type fastening spring shown in Figure 2a was constructed using a 3D Scan and a hexahedral element, C3D8R, was applied. Figure 2b shows the trilinear material properties of the model based on the tensile coupon test results of the SPS9 spring steel. Partially fixed boundary conditions were assigned to the interfaces between the fastening spring-to-rail and fastening spring-to-guide plate in the rail fastening assembly. The x-, y-, and z-axis of the coordination in Figure 2a represent the transverse, vertical, and longitudinal directions of the rail, respectively. In the fastening spring-to-rail boundary region, the z-axis displacement and the rotation around the x-axis direction were restrained while the other degrees of freedom were released. In the fastening spring-to-guide plate boundary region, the x- and y-axis displacements and the rotations around the x- and y-axis directions were restrained, while the other degrees of freedom were released. These boundary conditions for the analysis were assumed to simulate the structural behavior at the interfaces with the fastening spring.
Two steps of displacement-controlled loading were applied to simulate the installation of the fastening spring and vertical displacement during train use, as shown in Figure 3. Step 1 simulated the initial fastening process by torque tightening. The top surfaces of the two fastening springs at the free ends were tied to the center, and displacement was applied to the center control point to simulate screw spike tightening. The displacement level in Step 1 will be discussed in Section 3. In Step 2, a 1 mm vertical displacement level in the y-axis direction for the fastening spring was applied to the center of the fastening spring-to-rail contact area based on the field measurements to simulate the fastening spring movement during train use.
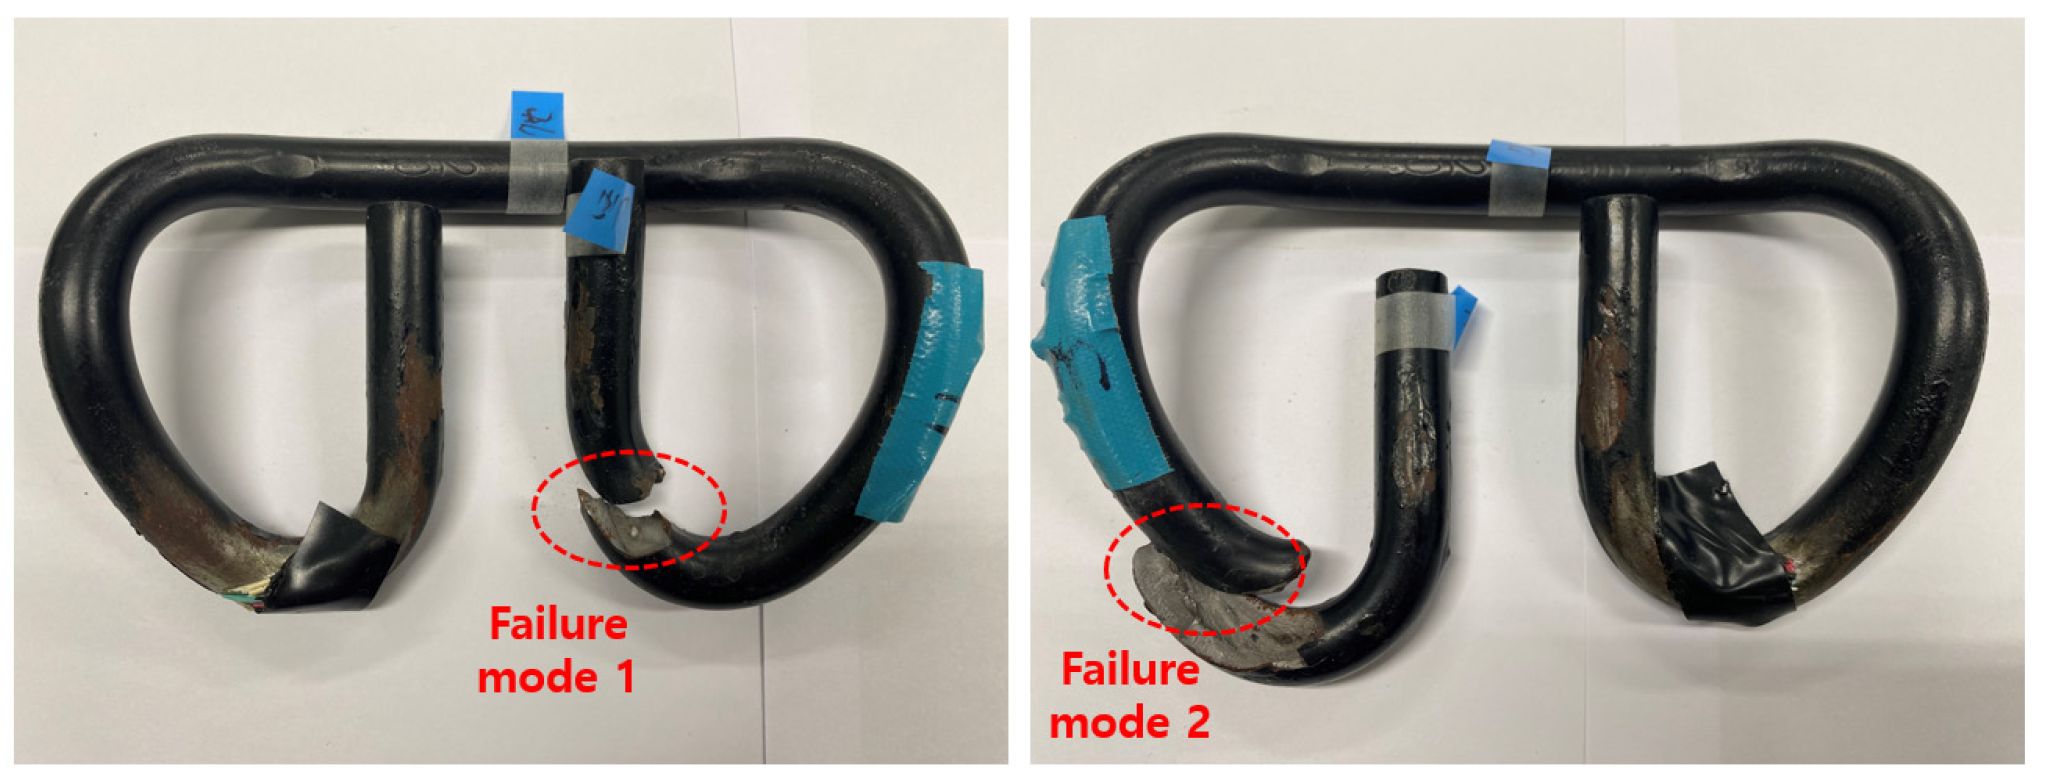
Figure 3 shows the contours of the maximum principal stresses from the finite element analysis. As shown in Figure 3a, two stress concentration locations are identified and designated as “Mode 1” and “Mode 2.” In Step 2, the stresses at these locations were slightly released with the downward vertical displacement caused by train use. This observation indicated that the two stress concentration points could potentially be the fatigue crack initiation points. Figure 4 shows the failure patterns from fatigue testing of the KR-type fastening spring, which are consistent with the two critical locations of stress concentration from the finite element analysis [16].

3. Comparison of Fatigue Performance Based on Fastening Spring Shapes

In order to limit various physical responses, such as axial force and displacement generated by the track–bridge interaction in Korea, the European design standard UIC-774-3(R) [20] is applied to define and apply KRC-08080 [21]. According to KRC-08080, the longitudinal load–displacement diagram of the track was modeled, and the main variables that determine the characteristics of the longitudinal resistance of the limit displacement track are defined as the limit displacement u0 and the longitudinal resistance F0. The longitudinal resistance of the rail fastening system was determined as follows by the frictional resistance caused by the initial fastening force:
RL = µF0
where RL is the longitudinal resistance and µ is the static friction coefficient between the rail and rail pad.
According to KRS TR0014-13R [22], the standard value of the longitudinal resistance of the rail fastening system should be ≥7 kN for type C (speed of general railways ˂250 km/h) and ≥9 kN for type D (speed of high-speed railways ˃250 km/h). In the case of the rail fastening system for a slab track, the static friction coefficient between the rail and the rail pad was assumed to be 0.5 [22]. Therefore, the initial fastening force must be greater than 18 kN to secure a minimum longitudinal resistance of 9 kN for type D of our study of interest. The fastening springs were installed on both sides of the rail, resulting in a clamping force of ≥9 kN for a single fastening spring. Herein, a fastening force of 9 kN was set as the fastening requirement.
The fatigue performance of the fastening spring was determined by the fracture criterion defined using the stress amplitude, mean stress, and material strengths under constant amplitude loading [23]. Park et al. [12] stated that the measured stress amplitude and vertical displacement in the rail fastening spring during service showed almost consistent stress and displacement variations for each train operation. Among several fracture criteria, the modified Goodman [19] and Gerber [24] criteria are widely used to represent the lower and upper bounds, respectively, of fatigue performance [18].
Modified   Goodman :   σ m S U + σ a S E 1
Gerber :   ( σ m S U ) 2 + σ a S E 1
where SU and SE are the tensile strength and endurance limit of the material, respectively. The yield and tensile strengths of the fastening spring used herein were 1377 and 1509 MPa, respectively. The endurance limit, SE, which is the fatigue strength of a metallic material under stress reversal, generally ranged from 35% to 60% of the tensile strength of the material [18,25]. The endurance limit was conservatively assumed to be 35% of the tensile strength of the spring steel.

3.1. Height of the Spring End

The effect of height on fatigue performance was evaluated by changing the spring end height as a variable. The height here actually means the height difference between the free end and the support of the spring at the spring-to-rail interface. In Figure 5, the original shape of the fastening spring is shown in gray. The FE model, in which the height has been changed, is shown in orange. Three different heights of the fastening spring end (i.e., +10%, +15%, and +50% of the original height) were compared. For example, 10% in Figure 6 means the height increment in Figure 5 divided by the original height in Figure 5.
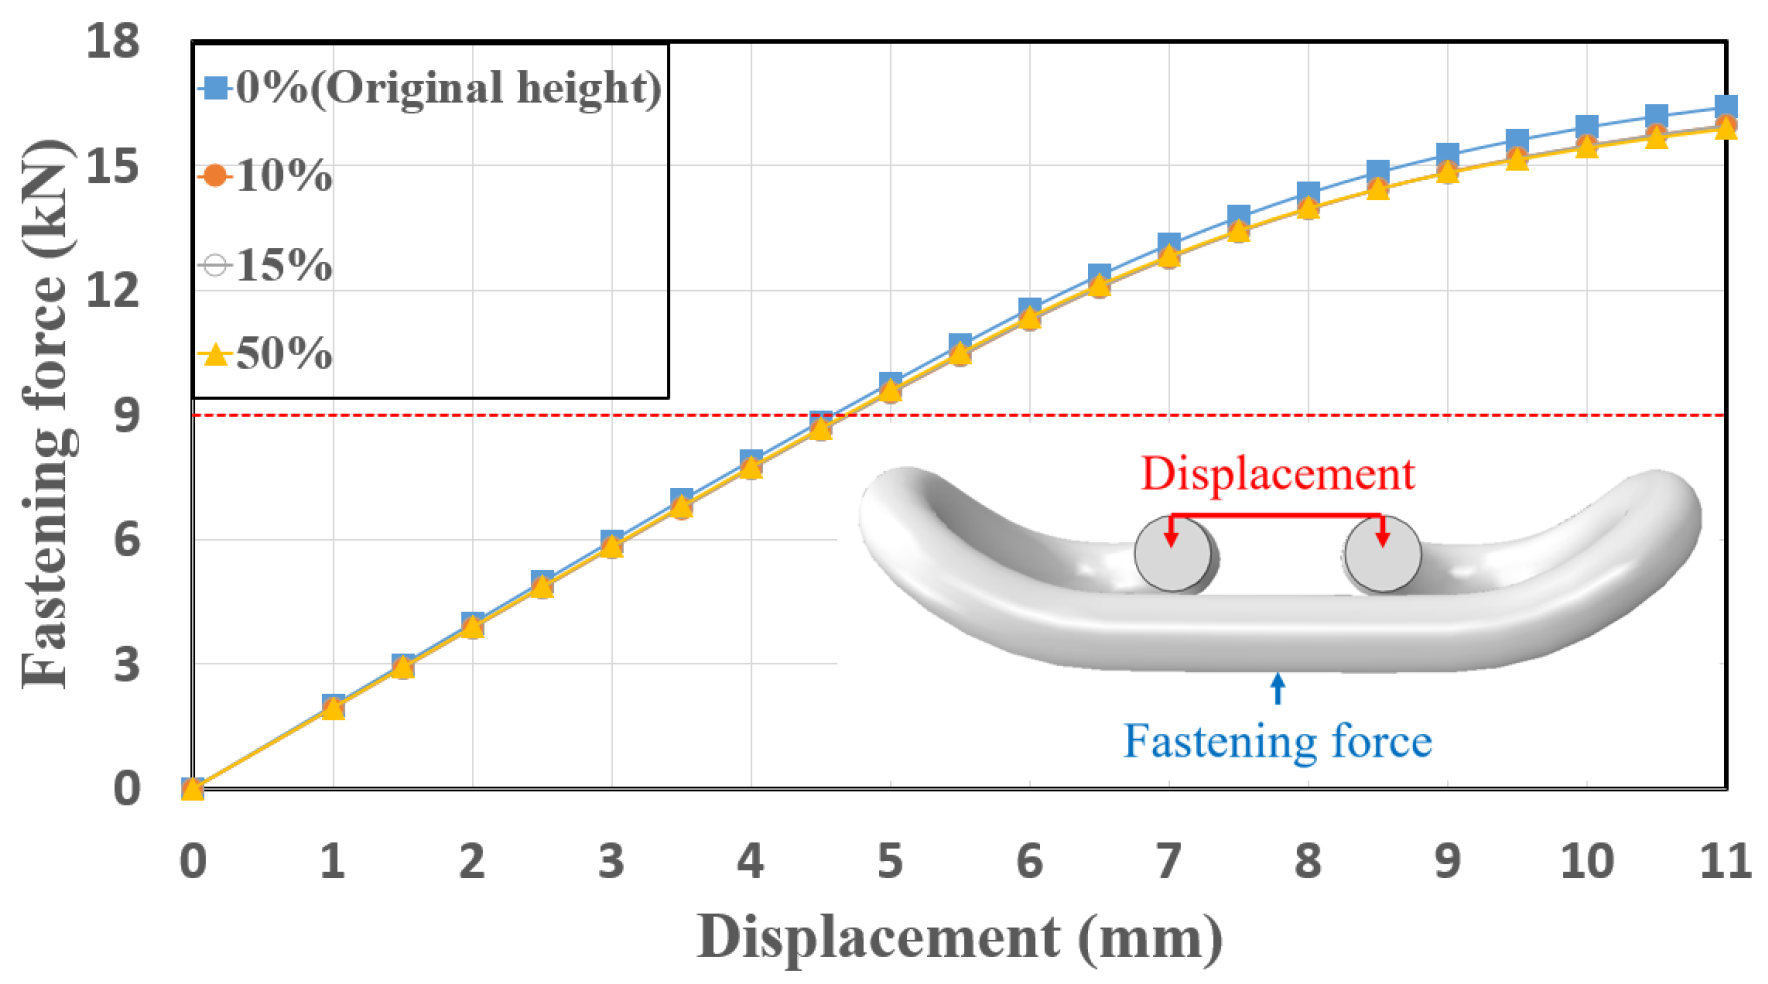
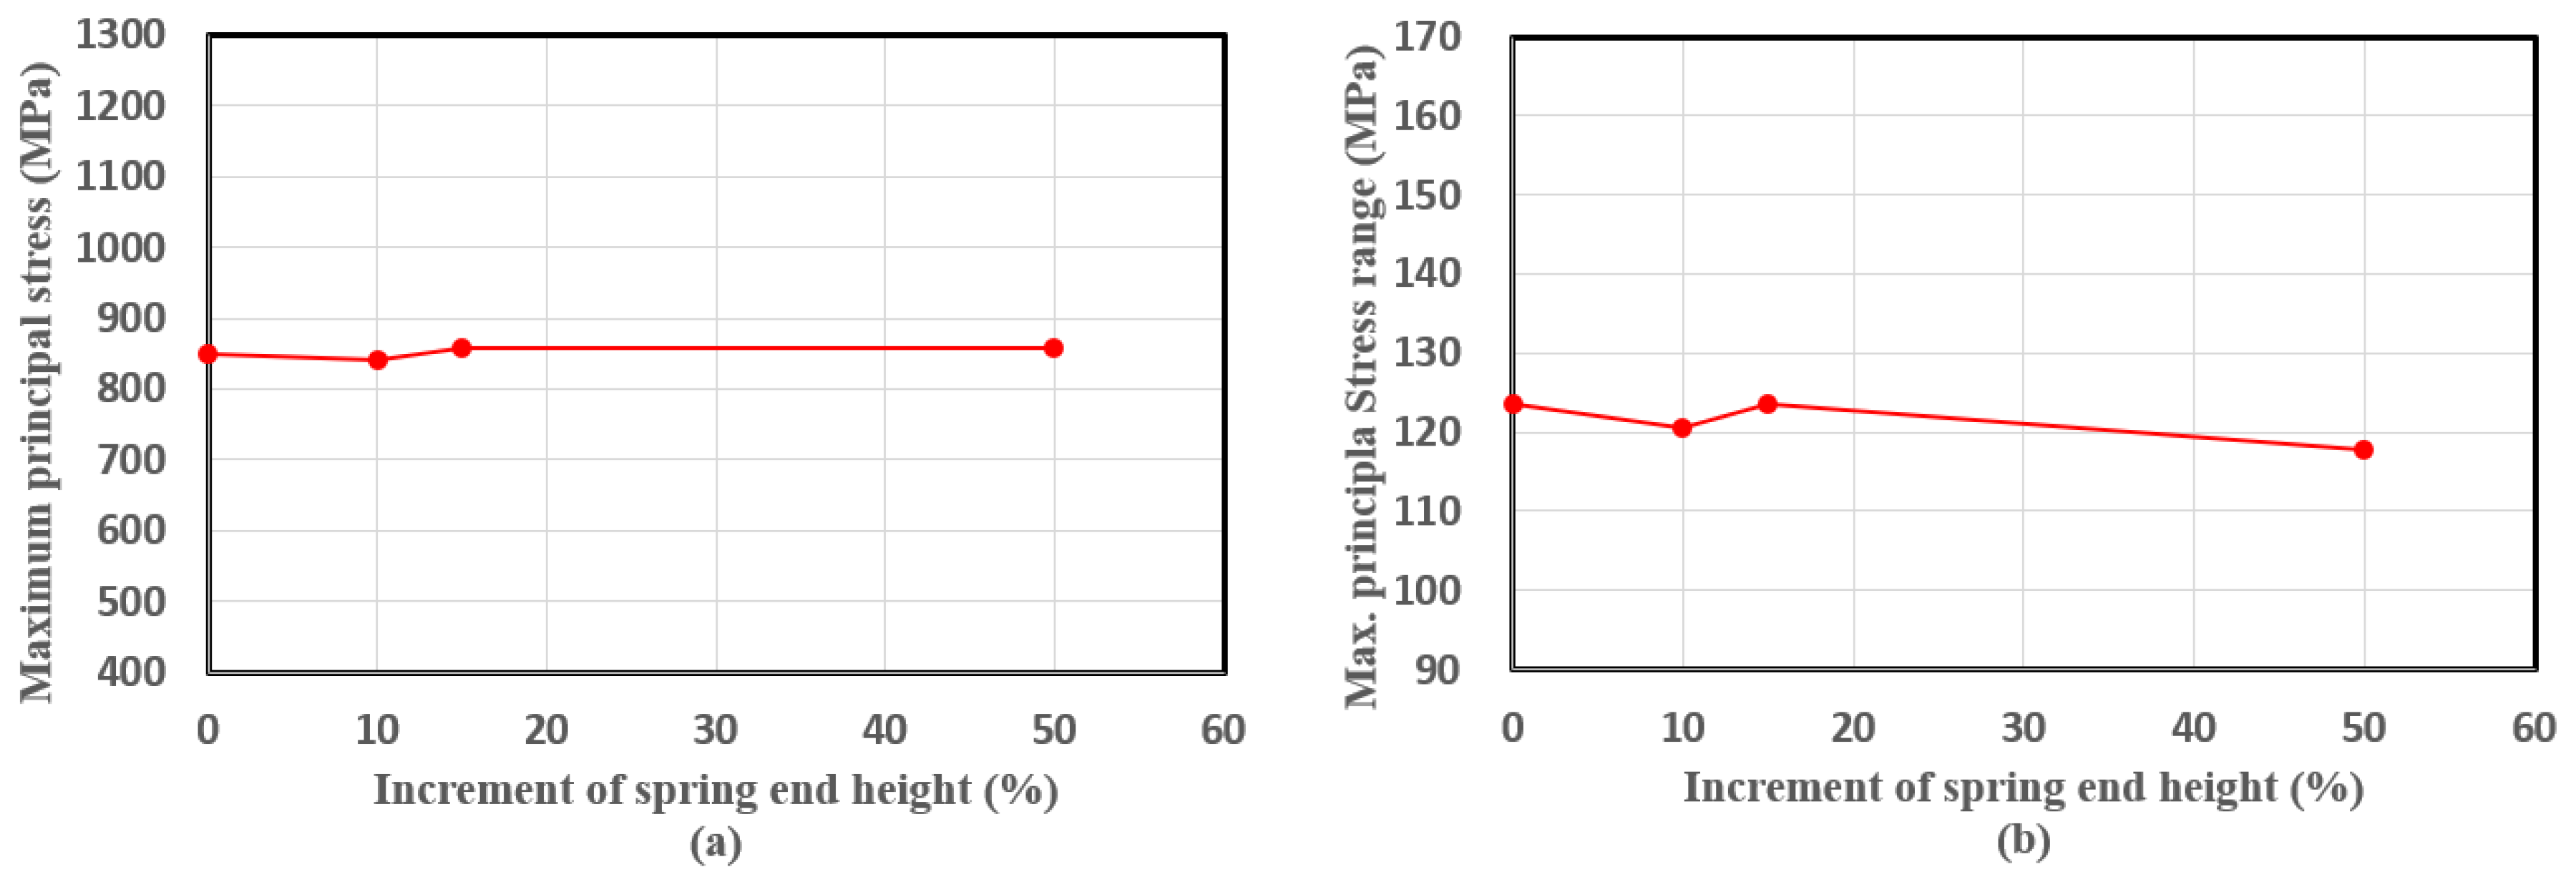
Figure 6 plots the global response of the fastening force vs. the displacement for various heights of the fastening spring end. Vertical displacement was applied to the torque location, and the displacement values corresponding to the rail fastening force (i.e., clamping force to the rail) of 9 kN were applied to the finite element models. Figure 7a shows the maximum principal stresses during fastening in Step 1, varying the height of the fastening spring, while Figure 7b shows the range of maximum principal stresses due to the vertical deflection caused by train use. Steps 1 and 2 yielded the stress range shown in Figure 7b. It can be observed from the results that the variation of the spring end height has little effect on the stress conditions of the fastening spring. This might be due to the fact that the internal forces (i.e., shear force and bending moment) on the critical sections of stress concentration have little change for each model because the moment arm from the loading location to the critical sections remained unchanged. In other words, the fatigue performance of the fastening spring may not be significantly affected by the change in the end height.

3.2. Height of the Spring Arm

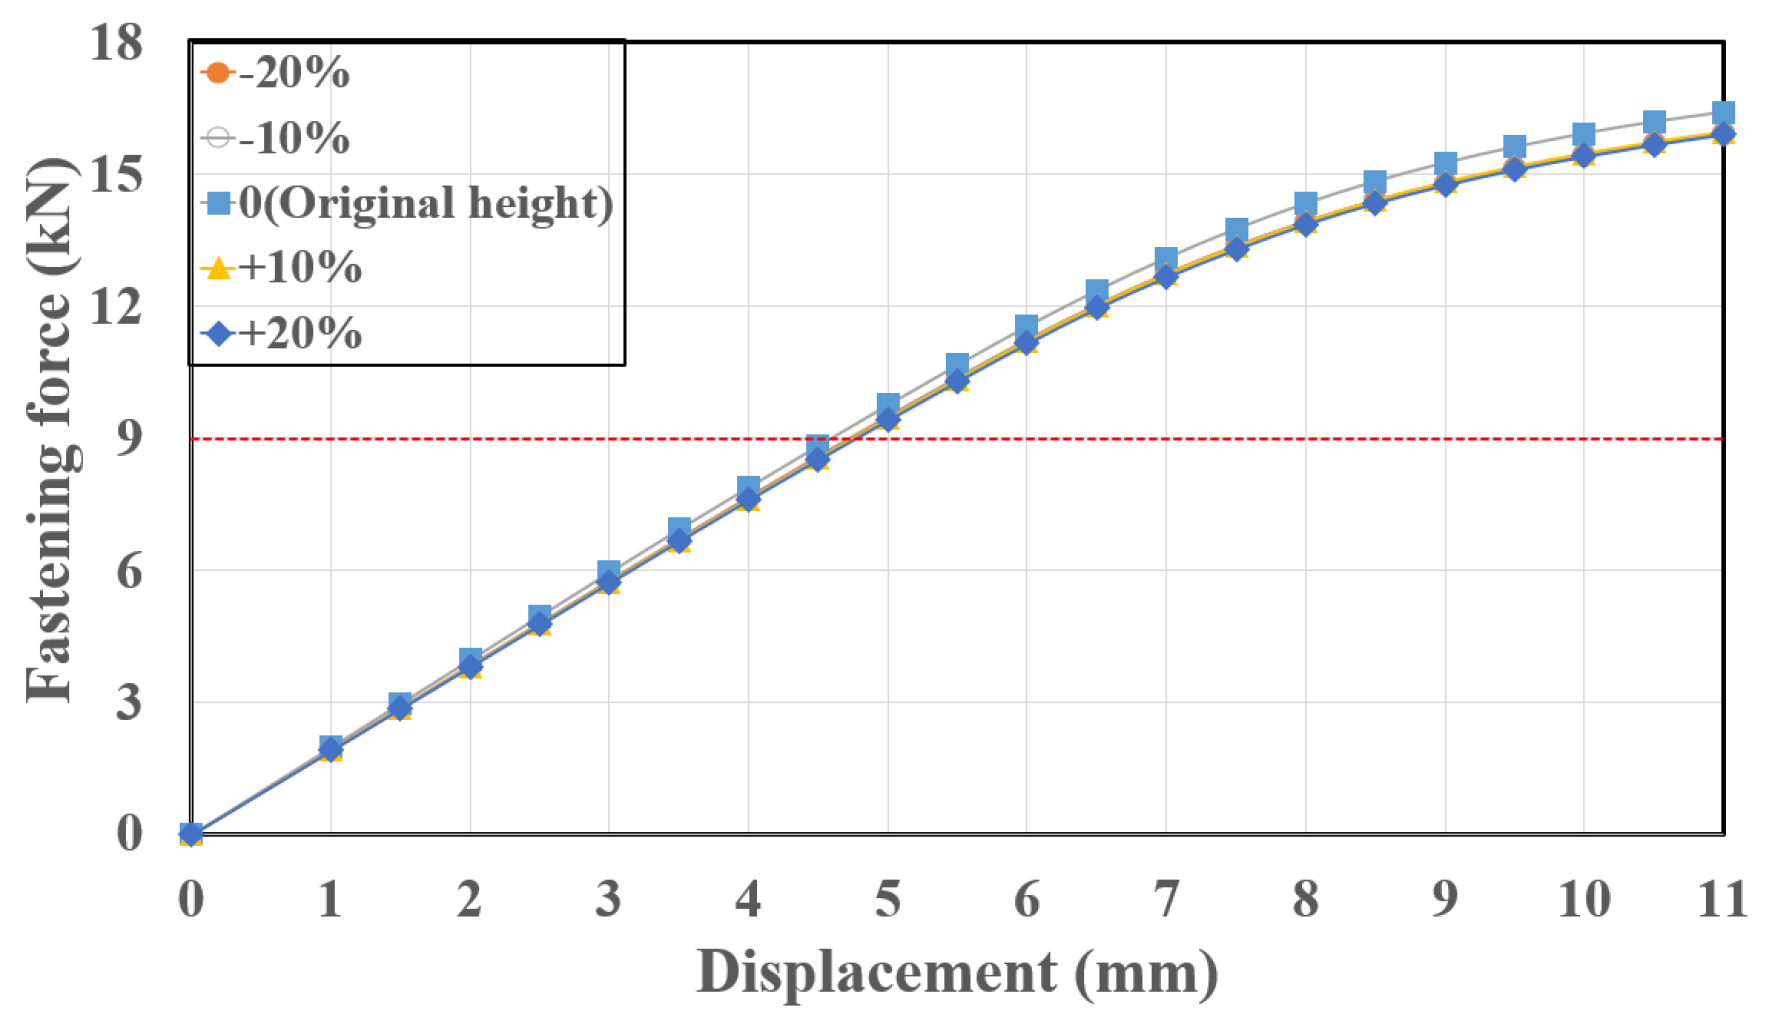
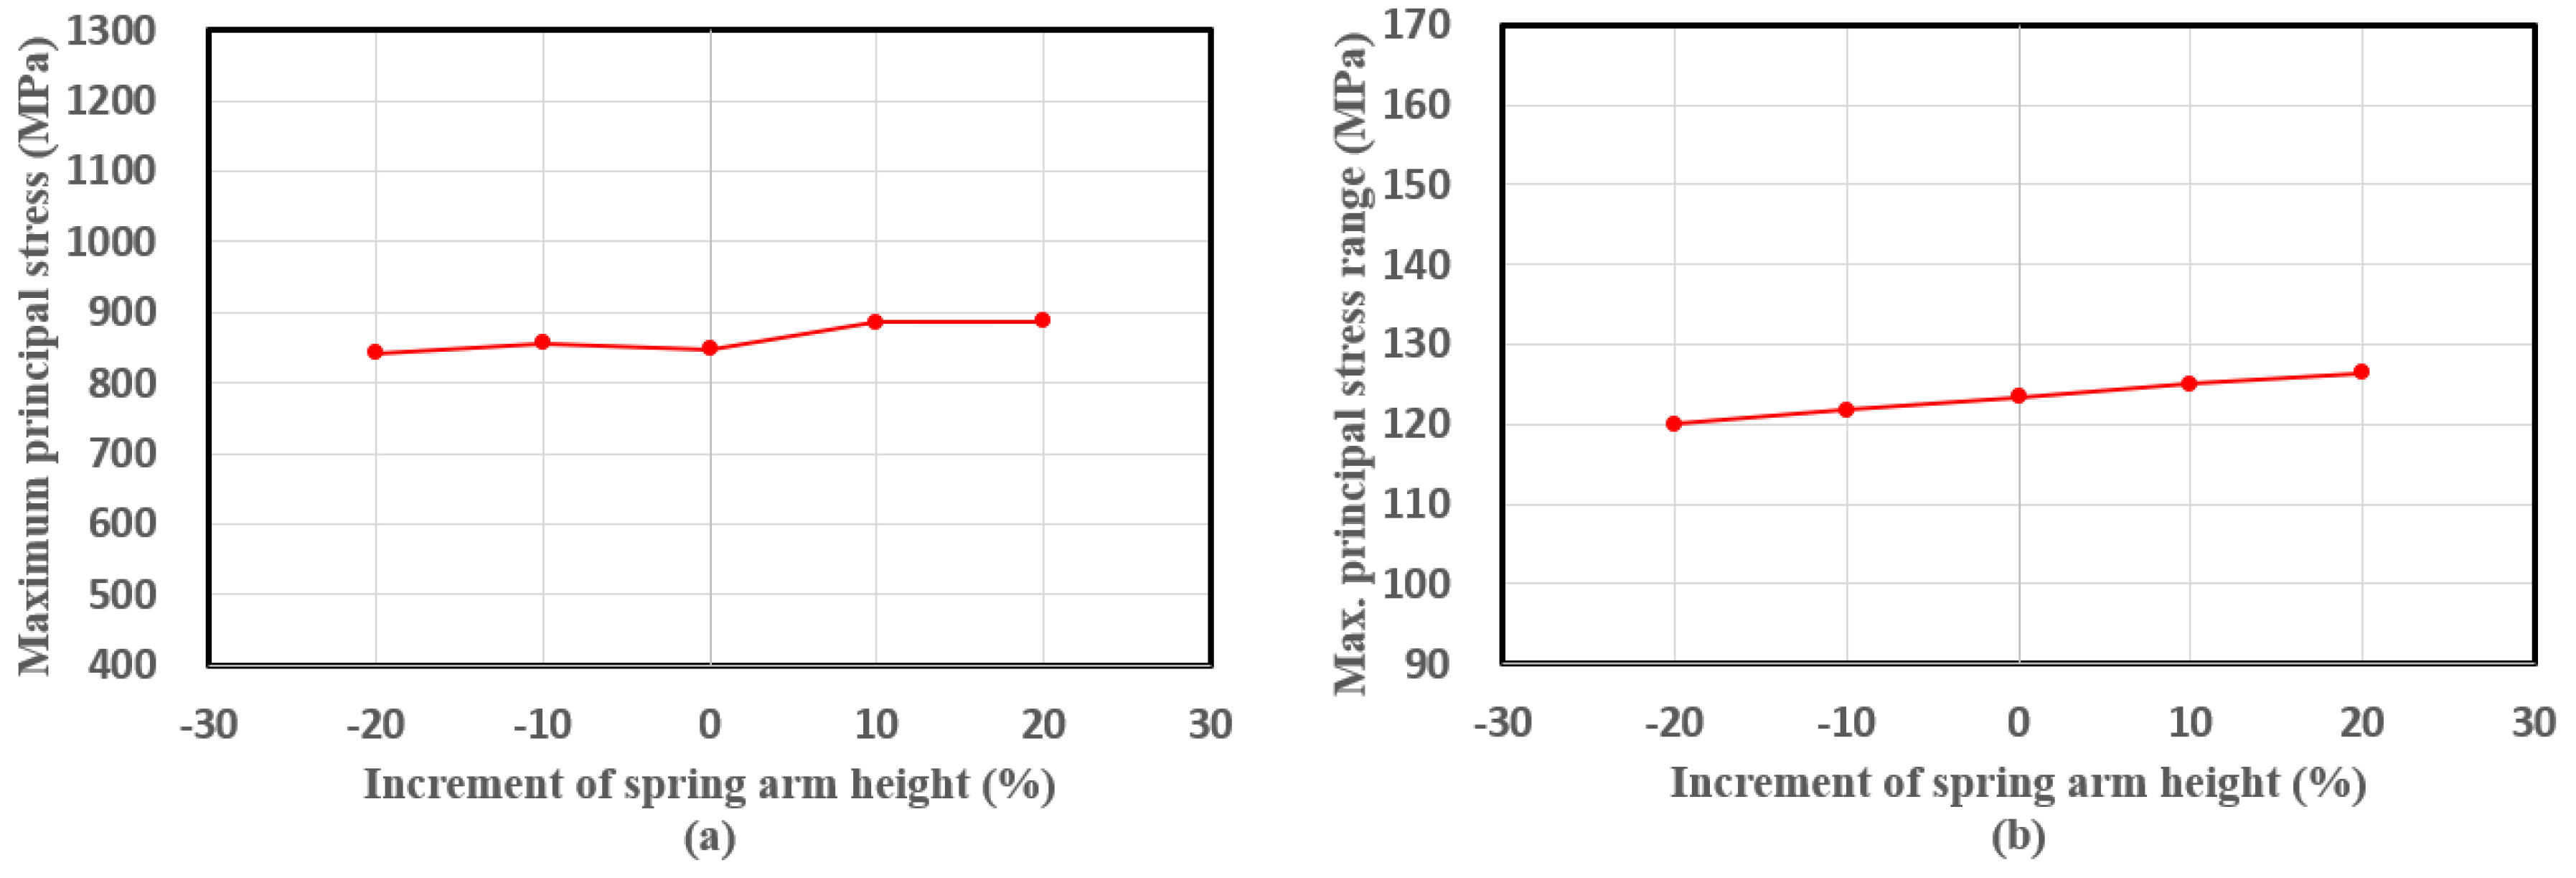
The effect of the spring arm height on the fatigue performance of the fastening spring was investigated. Figure 8 shows the perspective view of the change in the spring arm height. Four different cases with spring arm height increments of −20%, −10%, +10%, and +20% were compared with the original fastening spring (+0%). Figure 9 plots the global response (fastening force vs. displacement) for various spring arm heights. Displacement values corresponding to the rail fastening force of 9 kN were applied to the analysis. Figure 10a plots the maximum principal stresses during the fastening when varying the spring arm height, while (b) plots the range of maximum principal stress due to the vertical deflection caused by train use. The results showed that the spring arm height variable also only slightly affected the stress conditions; thus, the fatigue performance was only slightly affected by this variable. As discussed in Section 3.1, this result may also be attributed to similar internal forces on the critical sections of the fastening spring with the unchanged moment arm. The analysis results showed that the shear force and the bending moment at the critical section of stress concentration increased by about 8% and 7%, respectively, when the spring arm height increased from −20% to +20%.

3.3. Overall Spring Width

The effect of the overall fastening spring width on the fatigue performance was evaluated with five different spring widths, including the original one. Figure 11 shows the perspective view of the spring width change. The widths were changed from −20% to 20% of the original one with 10% increments. Figure 12a depicts the fastening force vs. displacement diagram for various spring widths. The required vertical displacements corresponding to the fastening force (9 kN) could be reduced as the width becomes smaller.
Figure 12b compares the clamping force at the torque location with the fastening force at the rail-to-spring boundary of the interface. By equilibrium, the clamping force of the torque can be resisted at the two boundary locations of the rail-to-spring and guide plate-to-spring interfaces. In Figure 12b, the ratio of the clamping force at the torque to the rail fastening force was approximately 61% for the +20% model. This ratio was approximately the same for the other models.
Figure 13a illustrates the maximum principal stresses during fastening when varying the spring width, while (b) shows the range of the maximum principal stress due to the vertical deflection caused by train use. Both the maximum principal stress at the initial fastening and the stress range caused by the vertical deflection tended to decrease as the width increased. Although unclear, the curvature that can be related to the stress concentration on the critical sections of the original shape appeared higher than that of the one with a width increment. This curvature effect on the maximum principal stress might be more significant than the effect of the internal force increase at the critical sections with the width increment.
Figure 14 shows a comparison of the fatigue performances varying with the overall spring width based on the analysis results in Figure 13. The comparison in Figure 13a is based on the modified Goodman criterion, which can be more conservative than the Gerber criterion. The safety margin (%) is defined herein as an index for comparing the fatigue performances of each model. It is the ratio of the remaining stress amplitude to the allowable stress amplitude in the modified Goodman diagram. Therefore, when the safety margin is high, the fatigue performance is enhanced. In Figure 14, the spring width modifications of −20%, −10%, 0% (original shape), +10%, and +20% yielded safety margins of 64%, 73%, 75%, 80%, and 82%, respectively. The mean stress and stress amplitude decreased as the spring width increased. Based on the modified Goodman criterion, a larger safety margin can be achieved with an increased spring width.

3.4. Spring Diameter

The effect of the spring diameter on fatigue performance is evaluated in this section. In this analysis, six different diameter variables (12D, 13D, 14D, 16D, 17D, and 18D) were compared to the original spring (15D) used in current design practice, where 15D means the diameter of 15 mm. Figure 15a shows the fastening force vs. displacement diagram for the spring widths. It can be observed that the required vertical displacements corresponding to the fastening force (9 kN) could be reduced as the spring diameter increased. Figure 15b shows that the ratio of the clamping force at the torque to the rail fastening force is ~60% (for the model of +15%), which is similar to Figure 14b. This ratio was about the same for the other models. The shape with a 12 mm diameter could not achieve the rail fastening force of 9 kN during the initial fastening; thus, it was excluded from fatigue analysis.
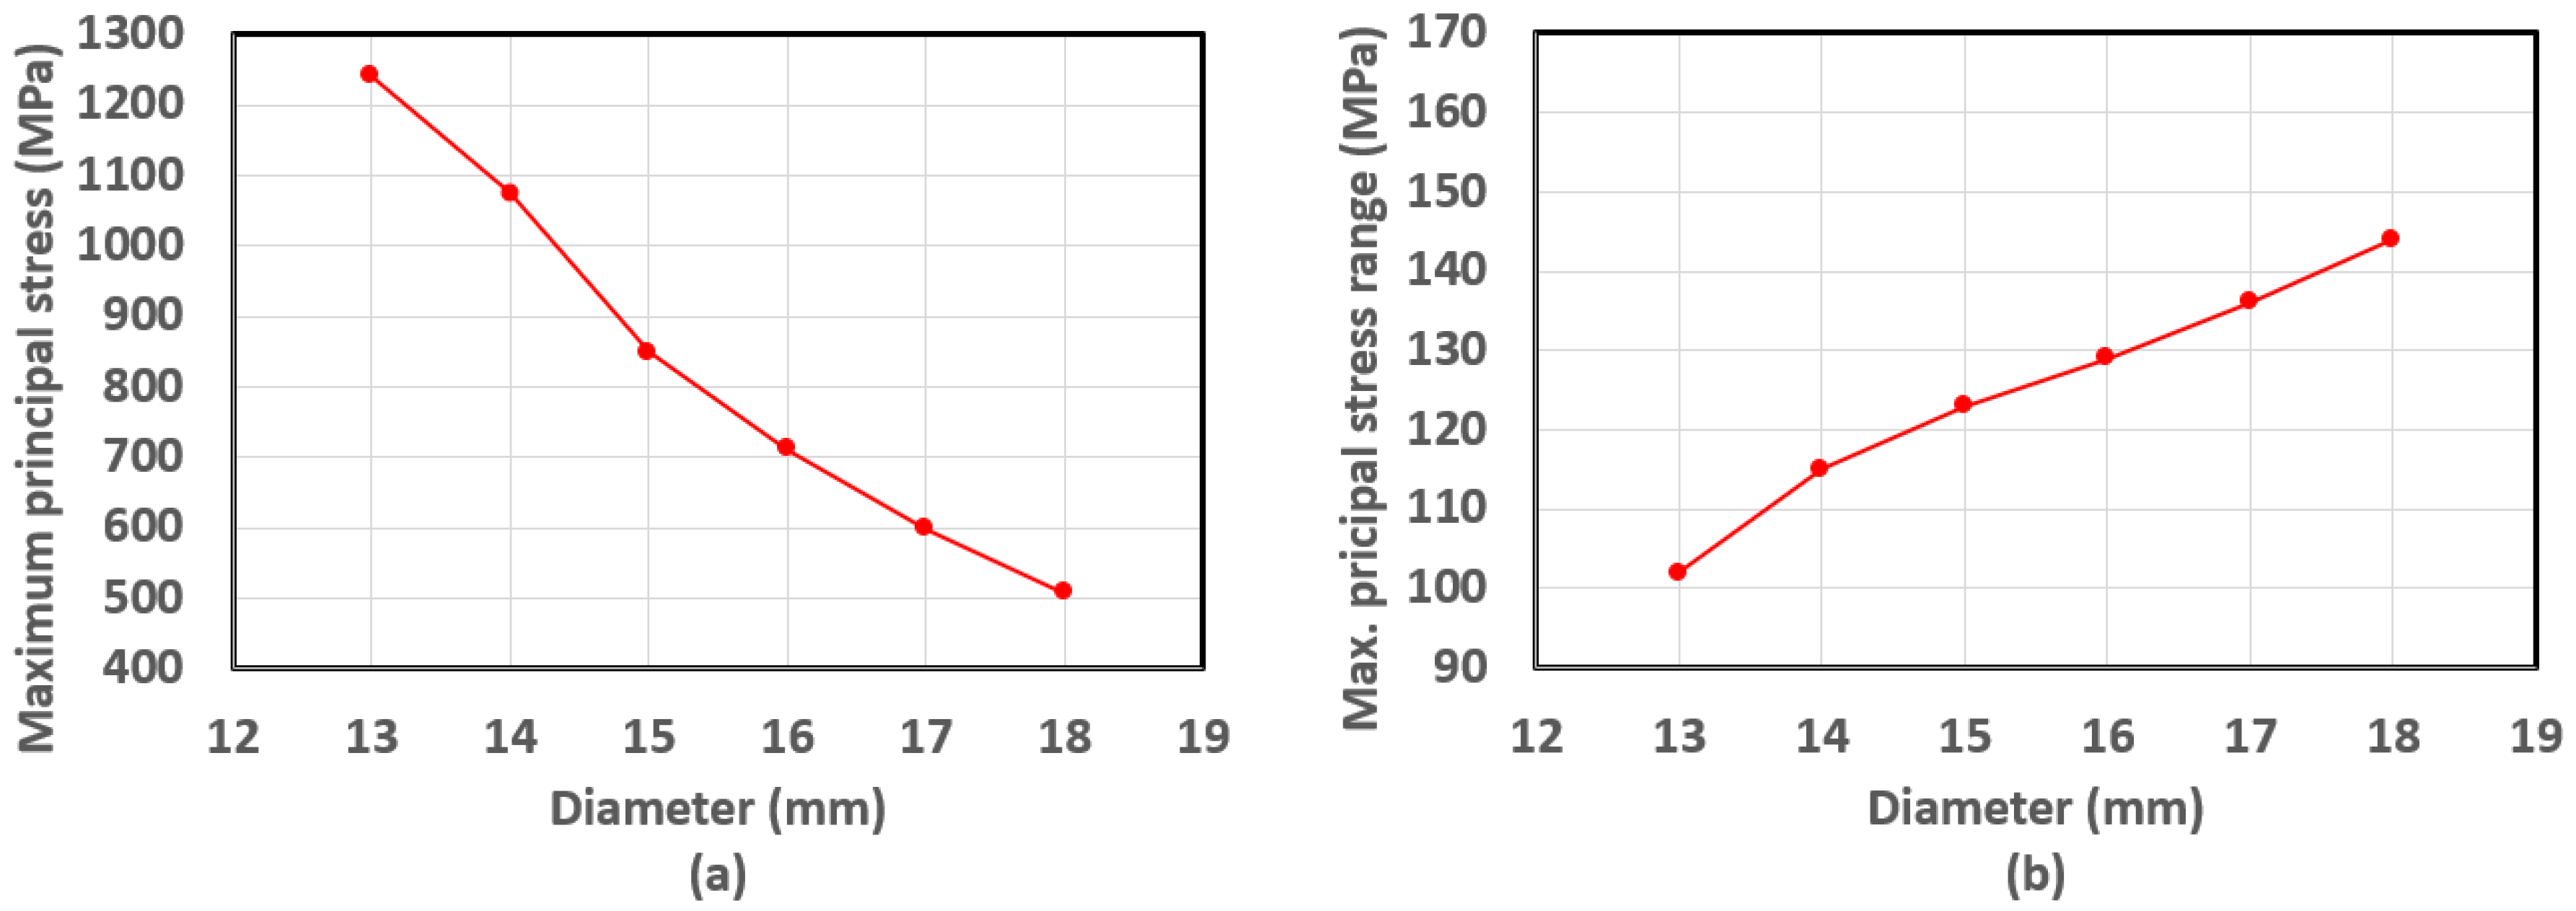
Figure 16a shows the maximum principal stresses at the fastening force of 9 kN for various diameters, while Figure 16b shows the stress range. The maximum principal stress during the initial fastening decreased as the diameter increased. In contrast, the stress range caused by the vertical deflection increased. Lower mean stress and stress amplitude are always preferable for achieving a better fatigue performance. However, the results showed that the larger diameter reduced the mean stress but increased the stress amplitude. Therefore, the optimum diameter can be determined by the margin of safety based on the modified Goodman diagram. Figure 17 shows the fatigue performance comparison based on the analysis results in Figure 16. The results presented safety margin ratios of 54%, 66%, 75%, 78%, 80%, and 81% for 13, 14, 15, 16, 17, and 18 mm diameters, respectively. These results indicated that the decreased mean stress for the thicker spring diameter could secure a larger margin of safety, despite an increased stress amplitude. Therefore, a better fatigue performance was expected from the thicker diameter of the fastening spring.

4. Conclusions

This study evaluated the effects of various shape factors, namely, the fastening spring end height, spring arm height, and overall lateral width and diameter of the cross section of the fastening spring, on fatigue performance. The following conclusions were obtained from this work:
  • The shape changes in the height of both the spring end and arm only slightly affected the mean stress and stress amplitude, which were the two main factors affecting the fatigue performance. This observation can be attributed to the similar internal forces (i.e., shear force and bending moment) that occurred in the critical sections with slight changes in the moment arm for each model. These two variables did not significantly change the safety margin ratio. In the case of the spring end height, the safety margin ratio was about the same (75%) when varied from 0% to 50%. In the case of the spring arm height, the safety margin ratio decreased from 75% to 73% when varied from −20% to 20%.
  • The overall lateral width of the fastening spring significantly affected the stress condition, particularly the stress amplitude. The mean stress and stress amplitude both decreased as the width increased. With increasing width, this curvature effect on the maximum principal stress was more significant than that of the increased internal force at the critical sections. When the width increased from −20% to 20%, the safety margin ration increased from 64% to 82%.
  • The variation in the maximum principal stress and the stress range according to the change in the cross-sectional diameter of the fastening spring were very remarkable. The maximum principal stress decreased as the diameter increased. In contrast, the stress range increased. The fatigue performance in the case of the modified Goodman criterion increased. For example, when the diameter was 13 mm, the safety margin was 54%, whereas in the case of the 18 mm diameter, the safety margin was 81%. It is believed that the maximum principal stress at the initial fastening has a greater dominant effect on the fatigue performance than the stress amplitude.
Both the lateral width and cross-sectional diameter of the fastening spring significantly influenced the fatigue performance. Moreover, the design that decreased the maximum principal stress can be more efficient than the one that reduced the stress range for the fatigue performance improvement. However, this study was based on the results of finite element and theoretical fatigue performance analyses; thus, the field environment, including constructability, should be separately considered. Future research may also include the fatigue testing of an optimized shape of the fastening spring based on the results of this work.

Author Contributions

Conceptualization, X.-J.F. and H.-B.S.; methodology, X.-J.F., Y.-C.P. and H.-B.S.; validation, J.-W.H. and Y.-C.P.; investigation, X.-J.F., Y.-C.P. and H.-B.S.; resources, H.-B.S.; writing—original draft preparation, X.-J.F.; writing—review and editing, Y.-C.P., J.-W.H. and H.-B.S.; visualization, X.-J.F.; supervision, H.-B.S.; project administration, H.-B.S.; funding acquisition, Y.-C.P., J.-W.H. and H.-B.S. All authors have read and agreed to the published version of the manuscript.

Funding

This work has been supported by the National Research Foundation of Korea (NRF). The grant has been funded by the Korean government (MSIT) (No. 2020R1A4A4079299). This work was also funded by the Incheon National University (International Cooperative) Research Grant (2018-0359).

Conflicts of Interest

The authors declare no conflict of interest.

References

  1. Oda, J.; Yamazaki, K.; Yoshida, H.; Nakada, K. An analytical and experimental investigation of rail fastening systems in travelling cranes. Int. J. Mech. Sci. 1983, 25, 935–944. [Google Scholar] [CrossRef]
  2. Kaewunruen, S.; Remennikov, A. Dynamic properties of railway track and its components: A-state-of-the-art review. 2008; research online. [Google Scholar]
  3. Thompson, D.J.; Verheij, J.W. The dynamic behavior of rail fasteners at high frequencies. Appl. Acoust. 1997, 52, 1–17. [Google Scholar] [CrossRef] [Green Version]
  4. Smutny, J. Measurement and analysis of dynamic and acoustic parameters of rail fastening. NDT Int. 2004, 37, 119–129. [Google Scholar] [CrossRef]
  5. Lakusic, S.; Bartos, D.; Goran, B. Experimental and numerical analysis of the rail fastening spring clips types SKL1-SKL12. In Symposium on Experimental Methods in Solid Mechanics. 22nd DANUBIA-ADRIA Symposium on Experimental Methods in Solid Mechanics; University of Parma: Parma, Italy, 2005; pp. 248–249. [Google Scholar]
  6. Baik, C.H.; Joo, B.G.; Choi, I.Y.; Park, Y.G. The parametric study on the performance characteristics of elastic rail fastening system on the sharp curved track. In Proceedings of the KSR Conference, Jeju, Republic of Korea, 19–21 May 2011; pp. 2163–2173. (In Korean). [Google Scholar]
  7. Mohammadzadeh, S.; Ahadi, S.; Nouri, M. Stress-based fatigue reliability analysis of the rail fastening spring clip under traffic loads. Lat. Am. J. Solids Struct. 2014, 11, 993–1011. [Google Scholar] [CrossRef] [Green Version]
  8. Tamagawa, S.; Kataoka, H.; Deshimaru, T. A fatigue limit diagram for plastic rail clips. WIT Trans. Built Environ. 2015, 39, 1–11. [Google Scholar]
  9. Xiao, J.H.; Yan, Z.Q.; Shi, J.; Ma, D.K. Effect of Wheel-rail impact on the fatigue performance of fastening clips in rail joint area of high-speed railway. KSCE J. Civ. Eng. 2022, 26, 120–130. [Google Scholar] [CrossRef]
  10. Lee, D.W.; Choi, J.Y.; Baik, C.H.; Park, Y.G. Influence of initial clamping force of tension clamp on performance of elastic rail fastening system. KSCE J. Civ. Environ. Eng. Res. 2013, 33, 1243–1251. (In Korean) [Google Scholar]
  11. Liu, Y.; Li, Q.T.; Jiang, X.J.; Liu, H.; Yuan, X.P.; Zhu, Z.H. The effect of material static mechanical properties on the fatigue crack initiation life of rail fastening clips. Adv. Civ. Eng. 2021, 2021, 1–14. [Google Scholar] [CrossRef]
  12. Park, Y.C.; An, C.B.; Sim, H.B.; Kim, M.C.; Hong, J.K. Failure analysis of fatigue cracking in the tension clamp of a rail fastening system. Int. J. Steel Struct. 2019, 19, 1570–1577. [Google Scholar] [CrossRef]
  13. Choi, J.Y.; Kim, S.H.; Kim, S.J.; Chung, J.S. Failure analysis of tension clamps (SKL15) used in serviced urban railway tracks: Numerical analysis and experiments. Materials 2022, 15, 6354. [Google Scholar] [CrossRef] [PubMed]
  14. Kim, J.H.; Park, Y.C.; Kim, M.C.; Sim, H.B. A fatigue reliability assessment for rail tension clamps based on field measurement data. Appl. Sci. 2022, 12, 624. [Google Scholar] [CrossRef]
  15. Han, J.G.; Park, S.S.; Kim, W.Y. A study on the design specification of KR type rail fastening spring. In Proceedings of the KSR Conference, Gangwon, Republic of Korea, 9–11 January 2017; pp. 296–298. (In Korean). [Google Scholar]
  16. Kim, S.H.; Fang, X.J.; Park, Y.C.; Sim, H.B. Evaluation of structural behavior and fatigue performance of a KR-type rail clip. Appl. Sci. 2021, 11, 12074. [Google Scholar] [CrossRef]
  17. Gao, X.G.; Wang, A.; He, Y.; Gu, X. Structural improvement of the ω-type high-speed rail clip based on a study of its failure mechanism. Shock. Vib. 2019. [CrossRef] [Green Version]
  18. Bannantine, J.A.; Comer, J.J.; Handrock, J.L. Fundamentals of Metal Fatigue Analysis; Prentice Hall: Englewood Cliffs, NJ, USA, 1990. [Google Scholar]
  19. Goodman, J. Mechanics Applied to Engineering; Longmans, Green and Co.: London, UK, 1899. [Google Scholar]
  20. UIC-774-3R; Track/Bridge Interaction: Recommendations for Calculations. International Union of Railway: Paris, France, 2001.
  21. KR C-08080; Railway Design Guidelines and Handbooks; Track-Bridge Longitudinal Interaction Analysis. Korea Rail Network Authority: Sejong-si, Republic of Korea, 2017. (In Korean)
  22. KRS TR 0014-13R; Korean Railway Standards (KRS). Rail Fastening Systems: Sejong-si, Republic of Korea, 2015. (In Korean)
  23. Budynas, R.G. Advanced Strength and Applied Stress Analysis, 2nd ed.; McGraw Hill: New York, NY, USA, 1999. [Google Scholar]
  24. Gerber, W.Z. Calculation of the allowable stresses in iron structures. Bayer Arch. Ing Ver 1874, 6, 101–110. [Google Scholar]
  25. Park, Y.C.; An, C.B.; Kim, M.C.; Sim, H.B. Effect of the depth of decarburized layer in SKL15 tension clamp on fatigue Strength. Appl. Sci. 2021, 11, 3841. [Google Scholar] [CrossRef]
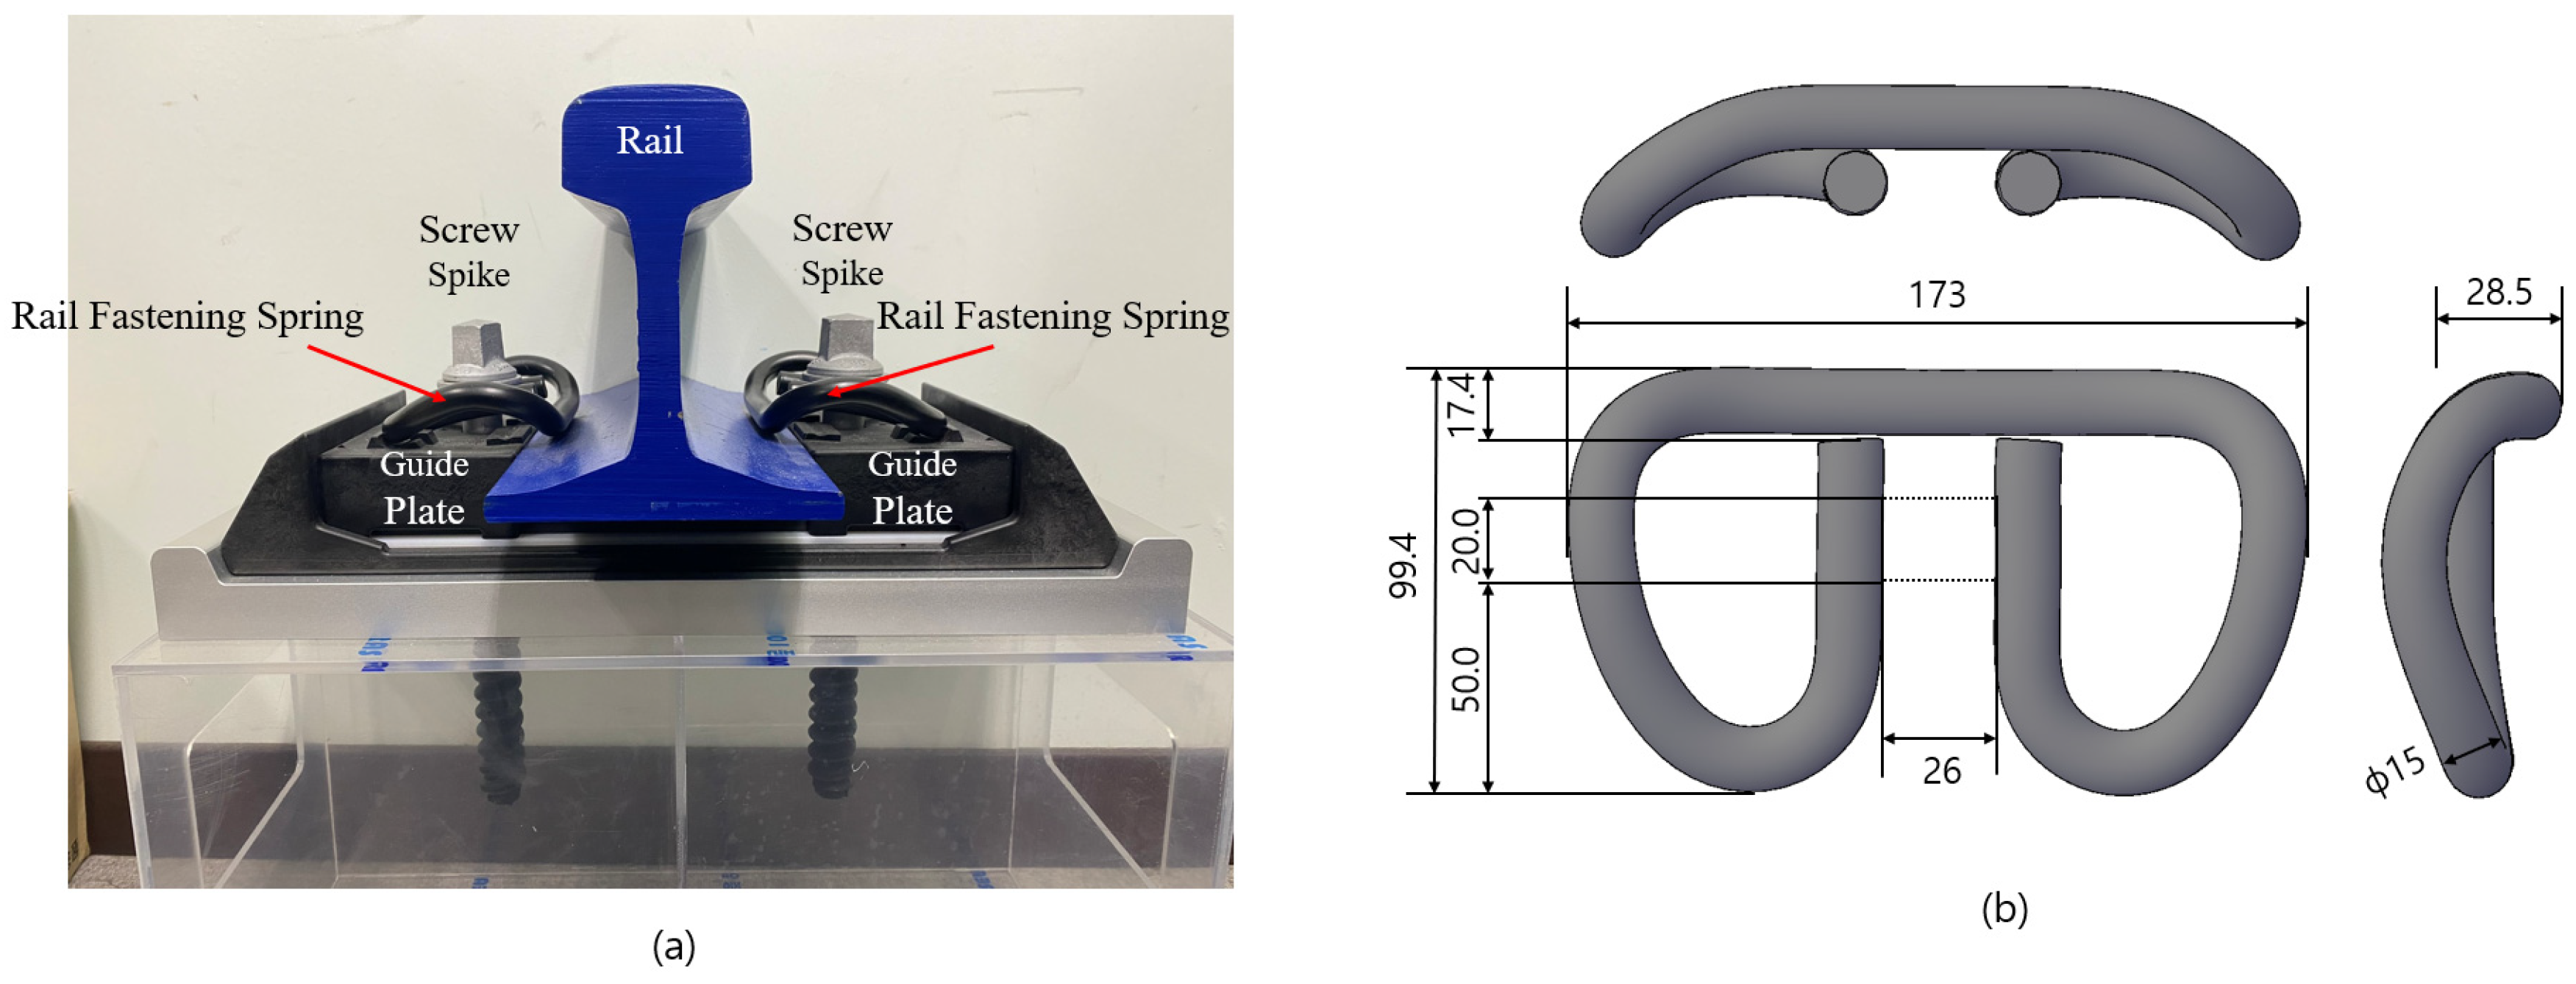
Figure 1. KR-type rail fastening system: (a) assembled configuration; (b) geometry of fastening spring.
Applsci 13 01770 g001
Figure 2. Finite element analysis modeling: (a) model configuration; (b) material model.
Applsci 13 01770 g002
Figure 3. Maximum principal stress contours: (a) initial fastening (Step 1); (b) vertical displacement (Step 2).
Applsci 13 01770 g003
Figure 4. Failure modes of KR-type fastening spring from fatigue testing.
Applsci 13 01770 g004
Figure 5. Perspective view of change in the height of the fastening spring end.
Applsci 13 01770 g005
Figure 6. Fastening force vs. displacement diagram varying the spring end height difference.
Applsci 13 01770 g006
Figure 7. Stress variation with the height of spring end: (a) maximum principal stress; (b) maximum principal stress range.
Applsci 13 01770 g007
Figure 8. Perspective view of the change in the spring arm height.
Applsci 13 01770 g008
Figure 9. Fastening force vs. displacement diagram varying the spring arm height.
Applsci 13 01770 g009
Figure 10. Stress variation with the spring arm height: (a) maximum principal stress; (b) maximum principal stress range.
Applsci 13 01770 g010
Figure 11. Perspective view of the change in the spring width: (a) front; (b) plan views.
Applsci 13 01770 g011
Figure 12. Force vs. displacement diagram: (a) fastening force vs. displacement when varying the spring width; (b) comparison of the clamping force at the torque with the rail fastening force for the +20% model.
Applsci 13 01770 g012
Figure 13. Stress variation with the spring width: (a) maximum principal stress; (b) maximum principal stress range.
Applsci 13 01770 g013
Figure 14. Comparison of the fatigue performances when varying the spring width: (a) fracture criteria; (b) safety margin (%).
Applsci 13 01770 g014
Figure 15. Force vs. displacement diagram: (a) fastening force vs. displacement when varying the spring diameter; (b) comparison of clamping force at the torque with rail fastening force (for the 15D model).
Applsci 13 01770 g015
Figure 16. Stress variation with the spring diameter: (a) maximum principal stress; (b) maximum principal stress range.
Applsci 13 01770 g016
Figure 17. Comparison of the fatigue performance when varying the spring diameter: (a) fracture criteria; (b) margin of safety (%).
Applsci 13 01770 g017
Disclaimer/Publisher’s Note: The statements, opinions and data contained in all publications are solely those of the individual author(s) and contributor(s) and not of MDPI and/or the editor(s). MDPI and/or the editor(s) disclaim responsibility for any injury to people or property resulting from any ideas, methods, instructions or products referred to in the content.