
Natural Gas Flaring Management System: A Novel Tool for Sustainable Gas Flaring Reduction in Nigeria


Abstract
:1. Introduction
2. Materials and Methods
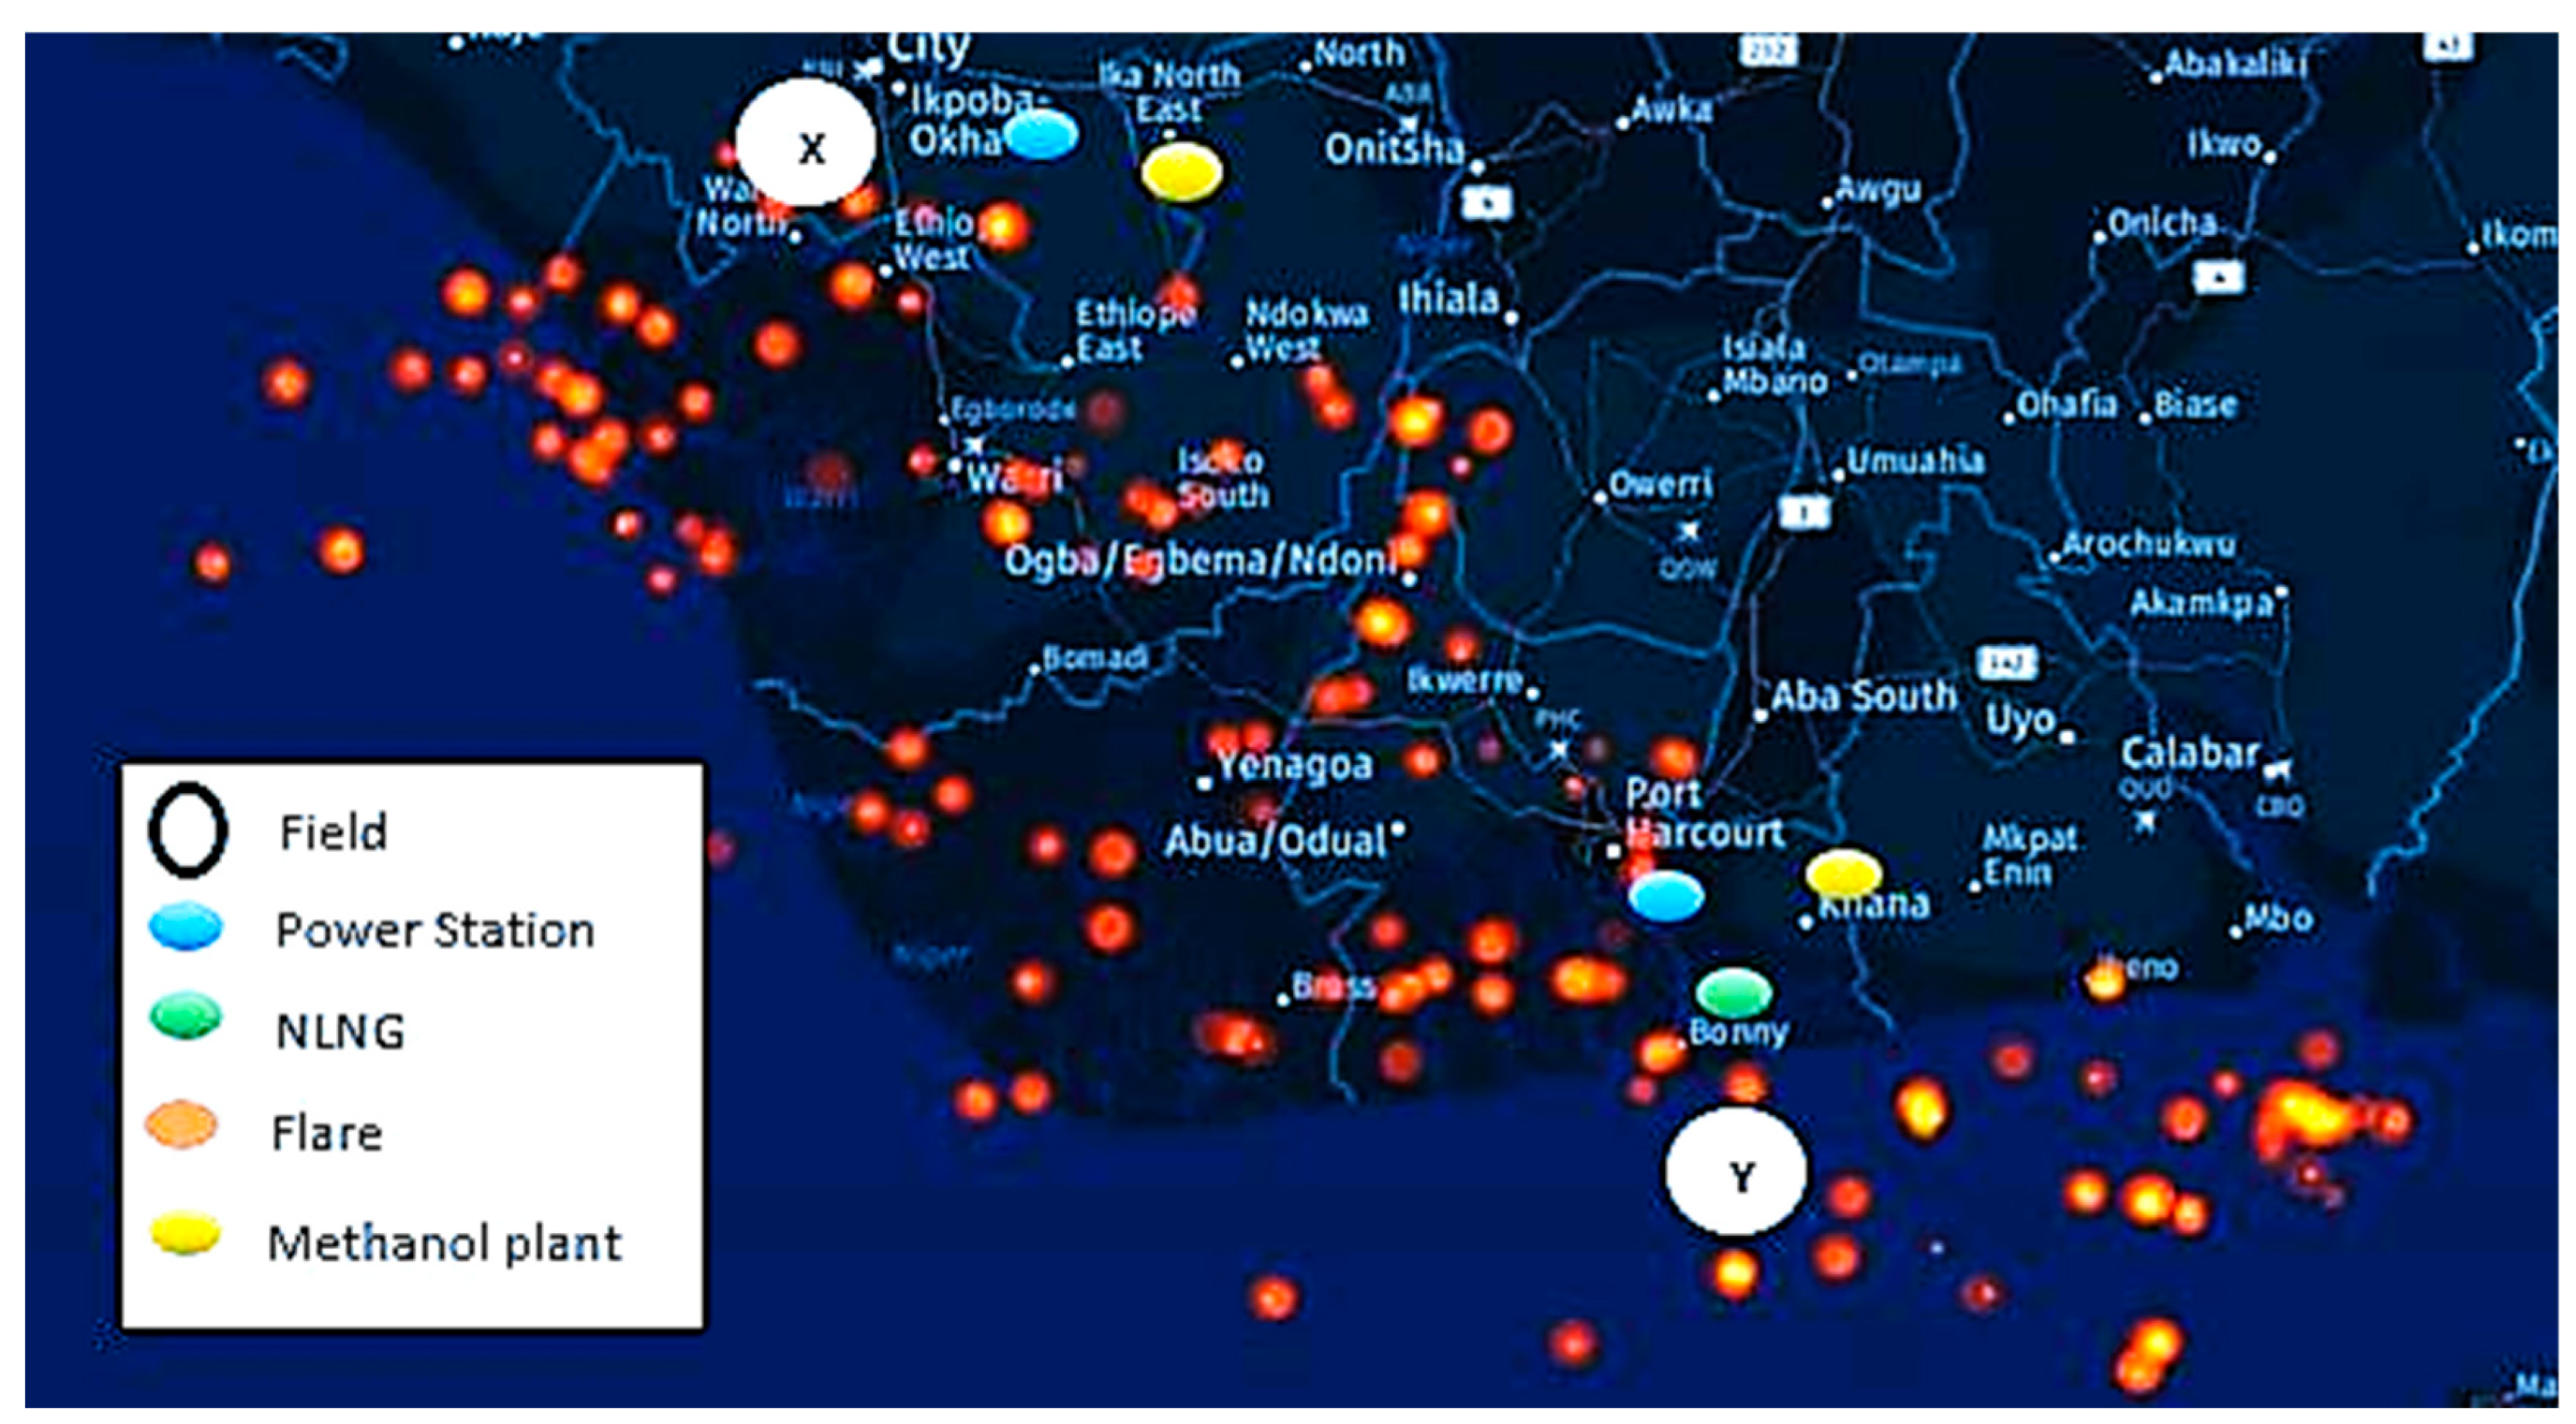
2.1. Case Study Field
2.1.1. Case Study: Field Y
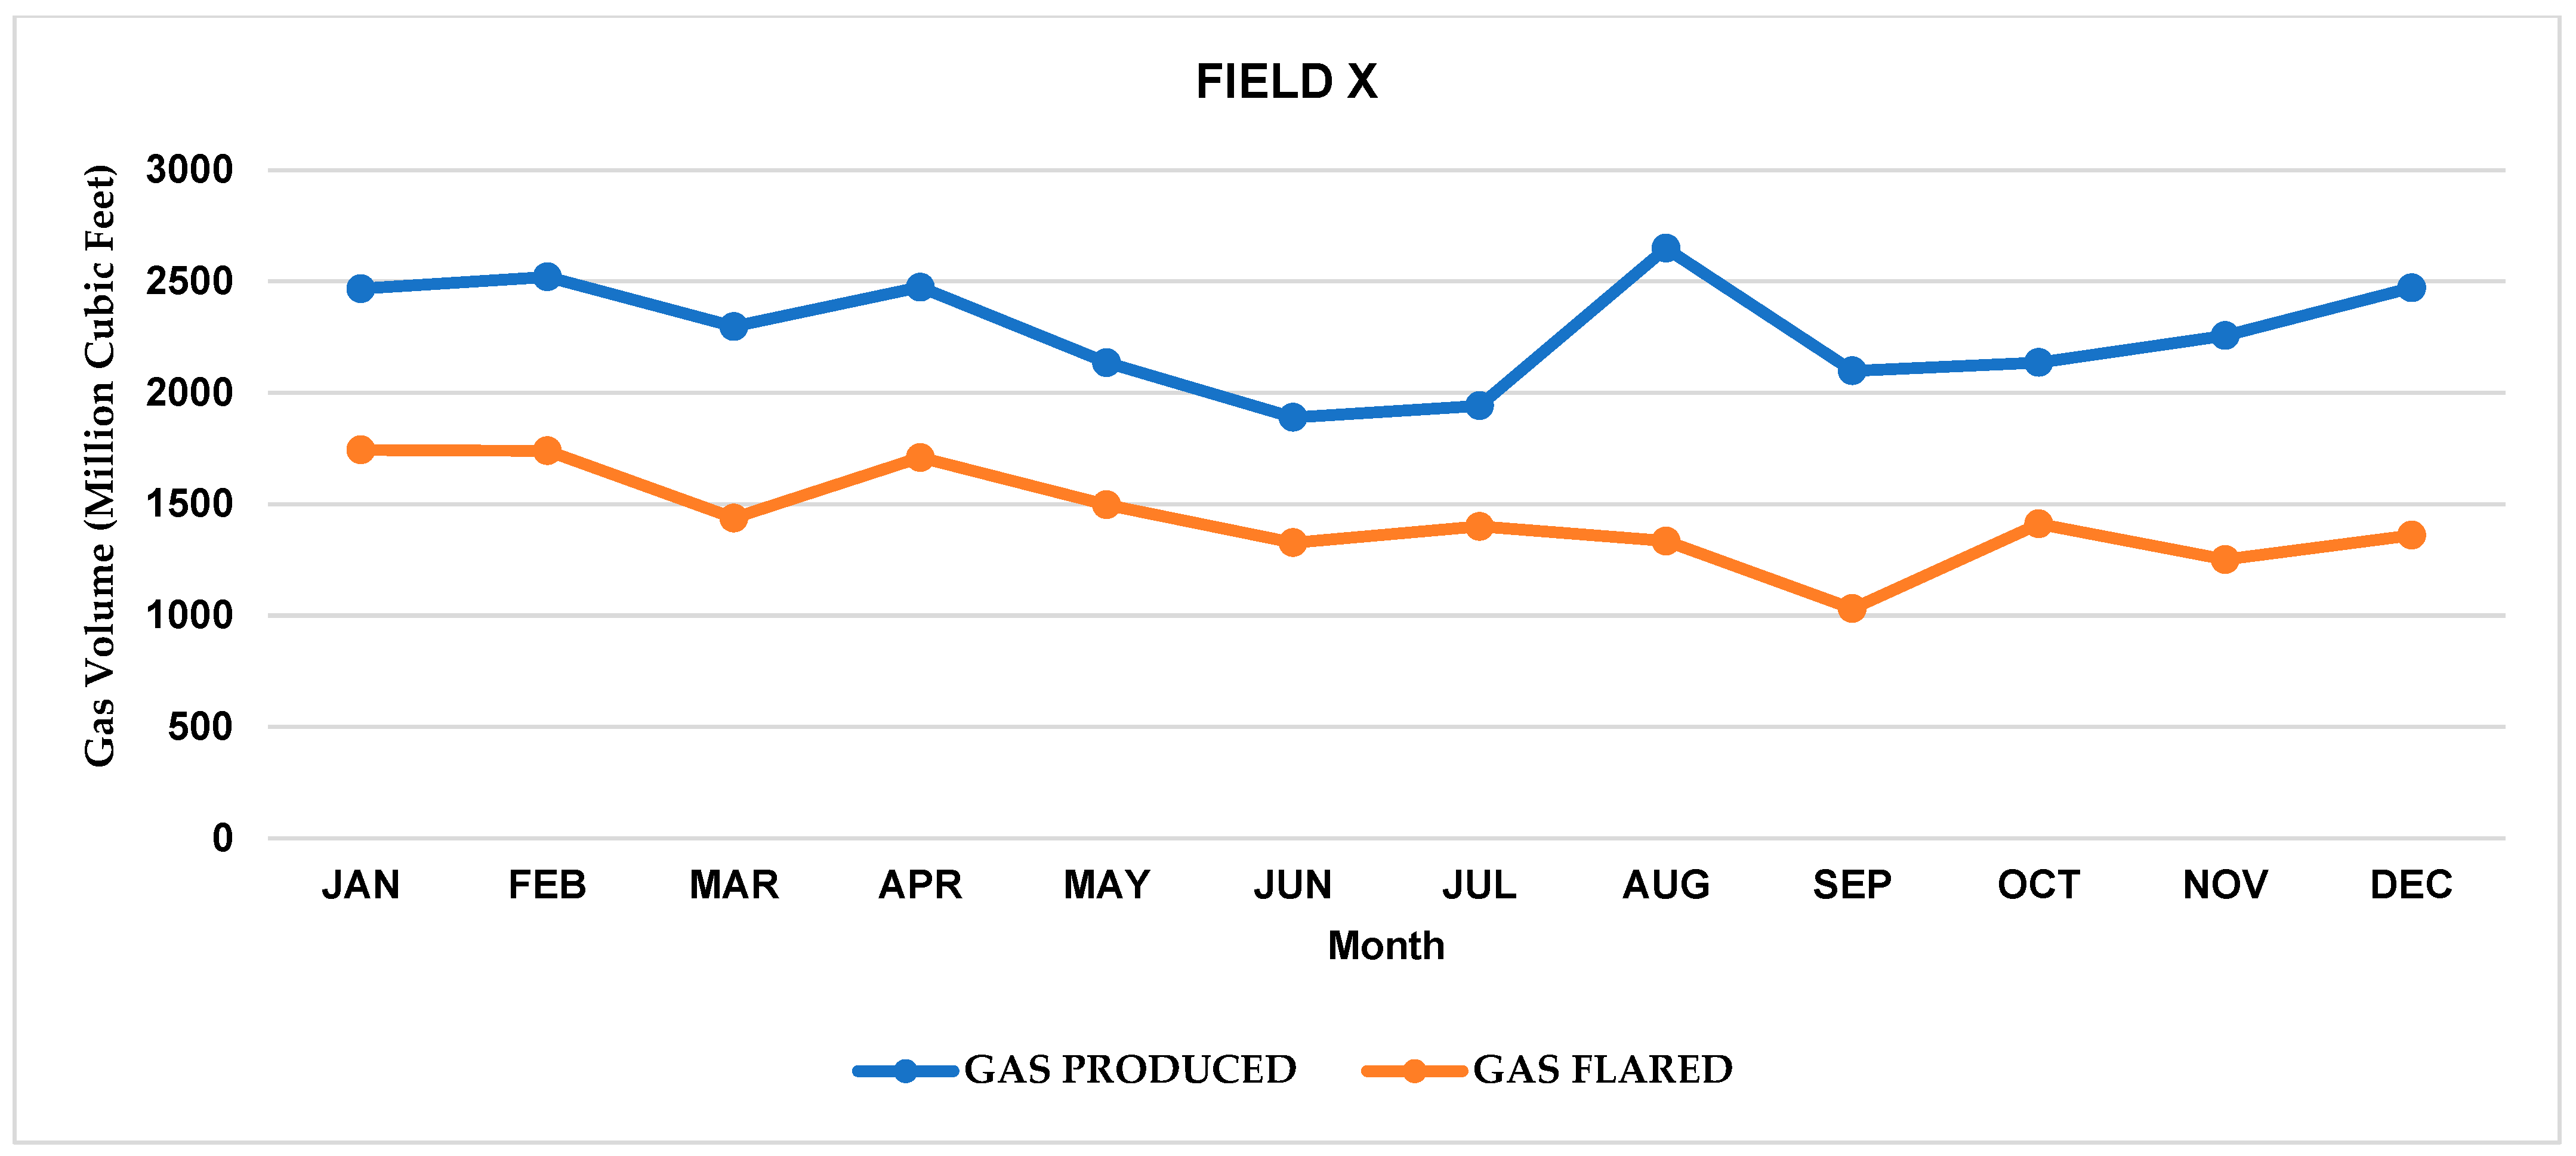
2.1.2. Case Study: Field X
2.2. Process Model Description
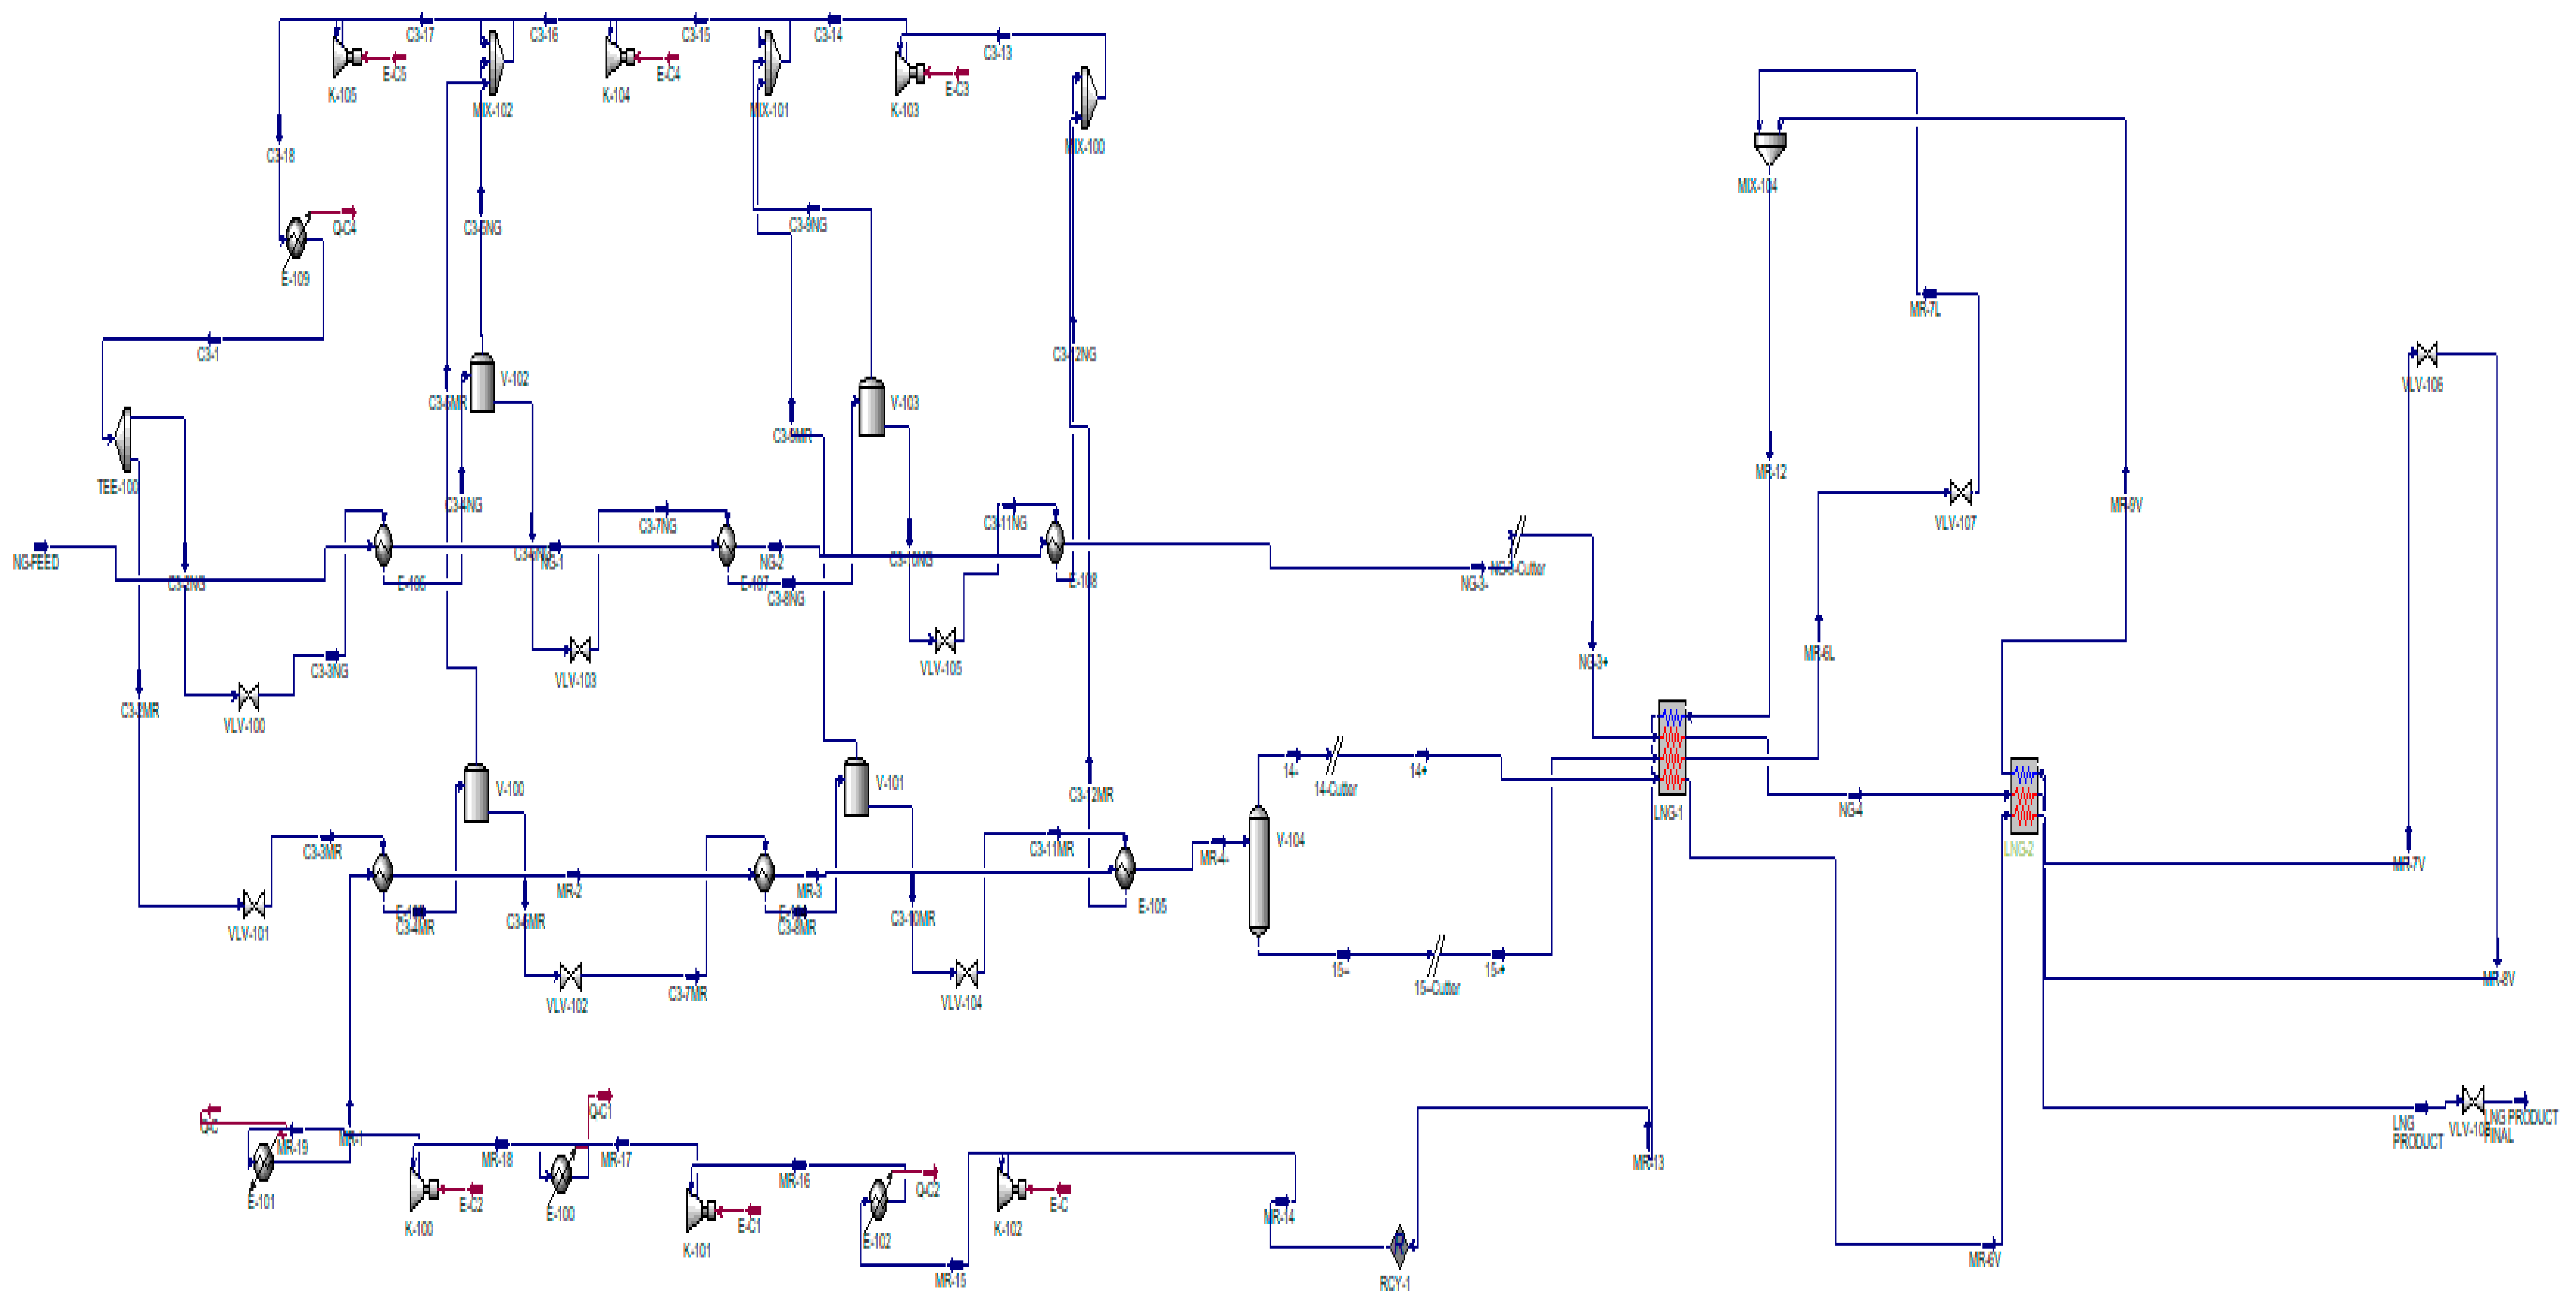
2.2.1. LNG Process Model Description
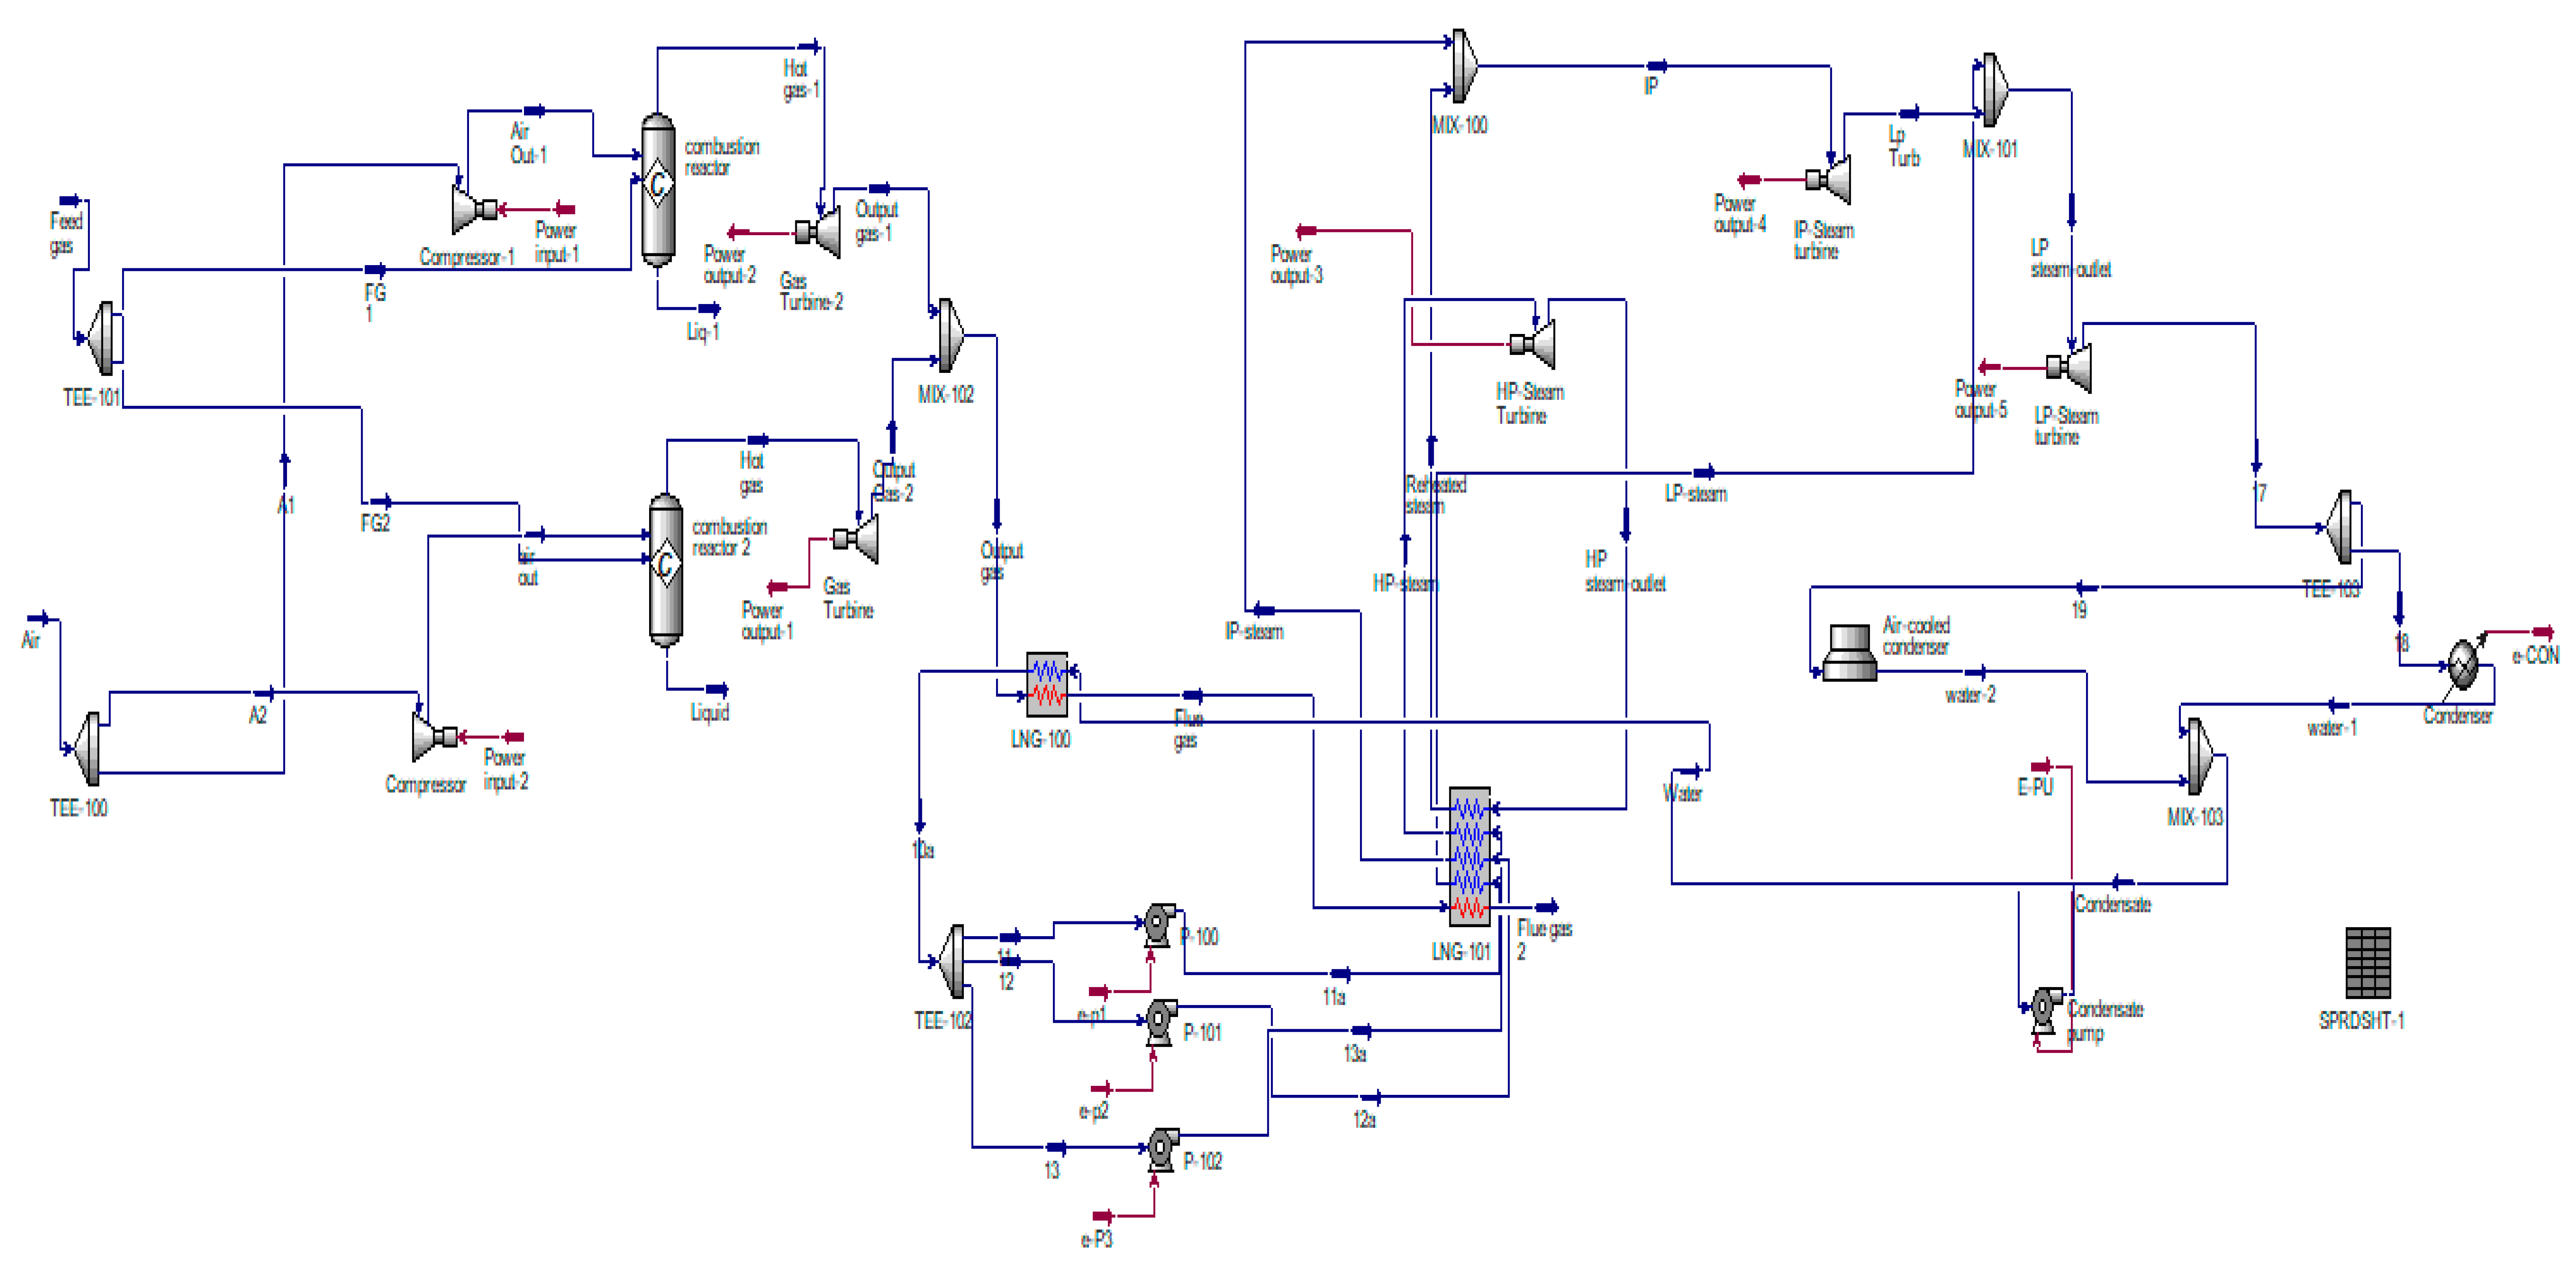
2.2.2. GTW Process Model Description
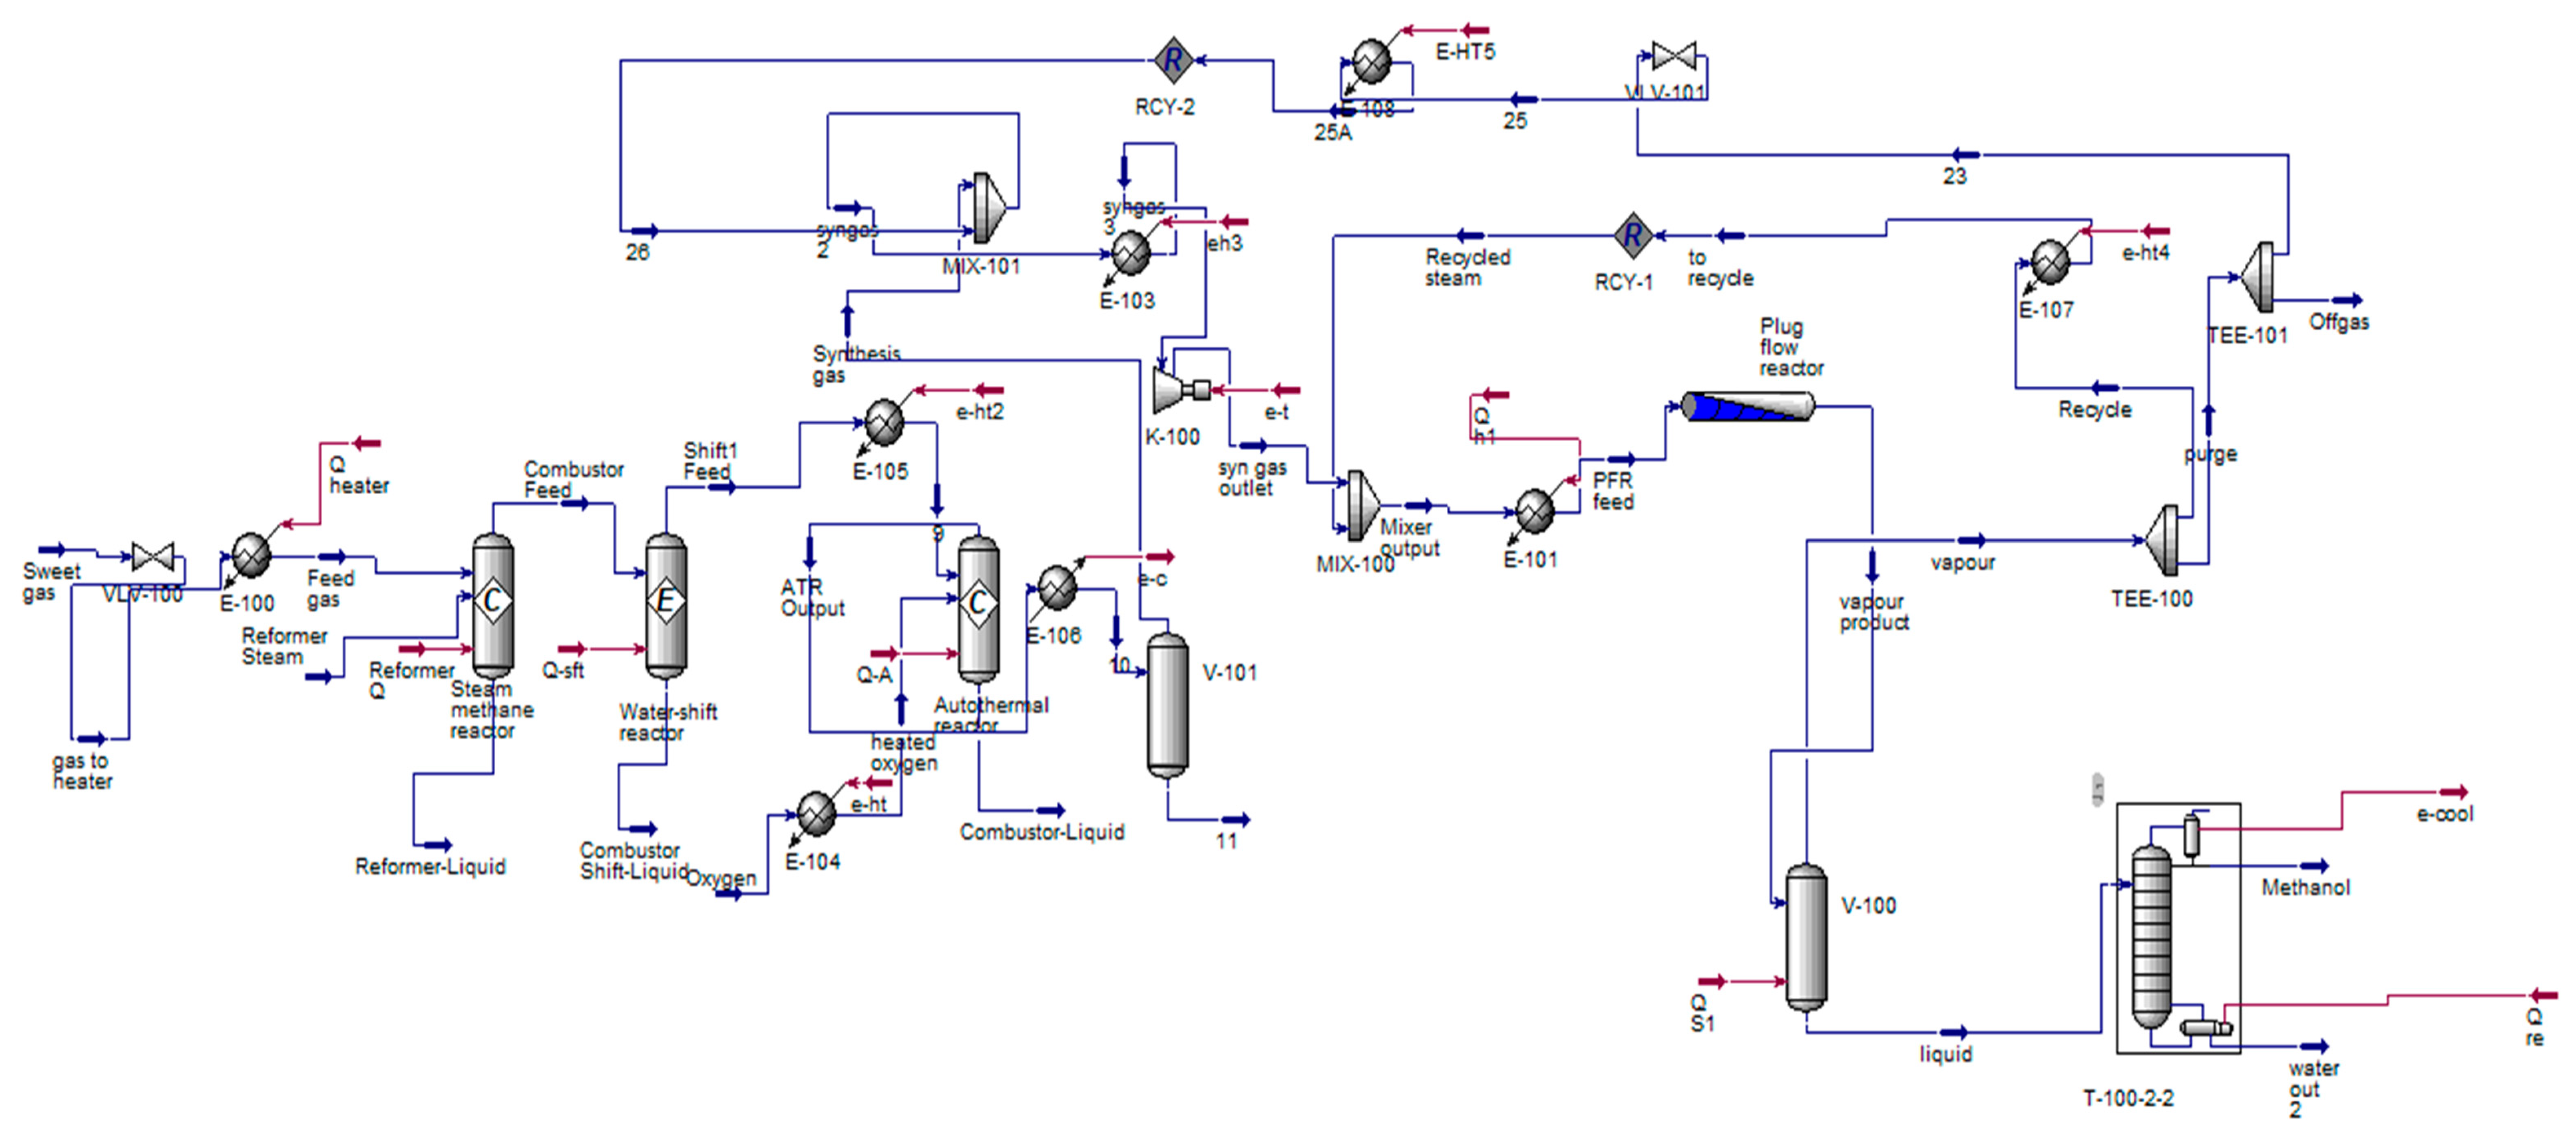
2.2.3. GTM Process Model Description

2.3. Development of ANG Management Framework and Tool
2.3.1. Proposed Tools and Techniques and Operating Environment
2.3.2. Development and Implementation
Development Methodology
Implementation
- I.
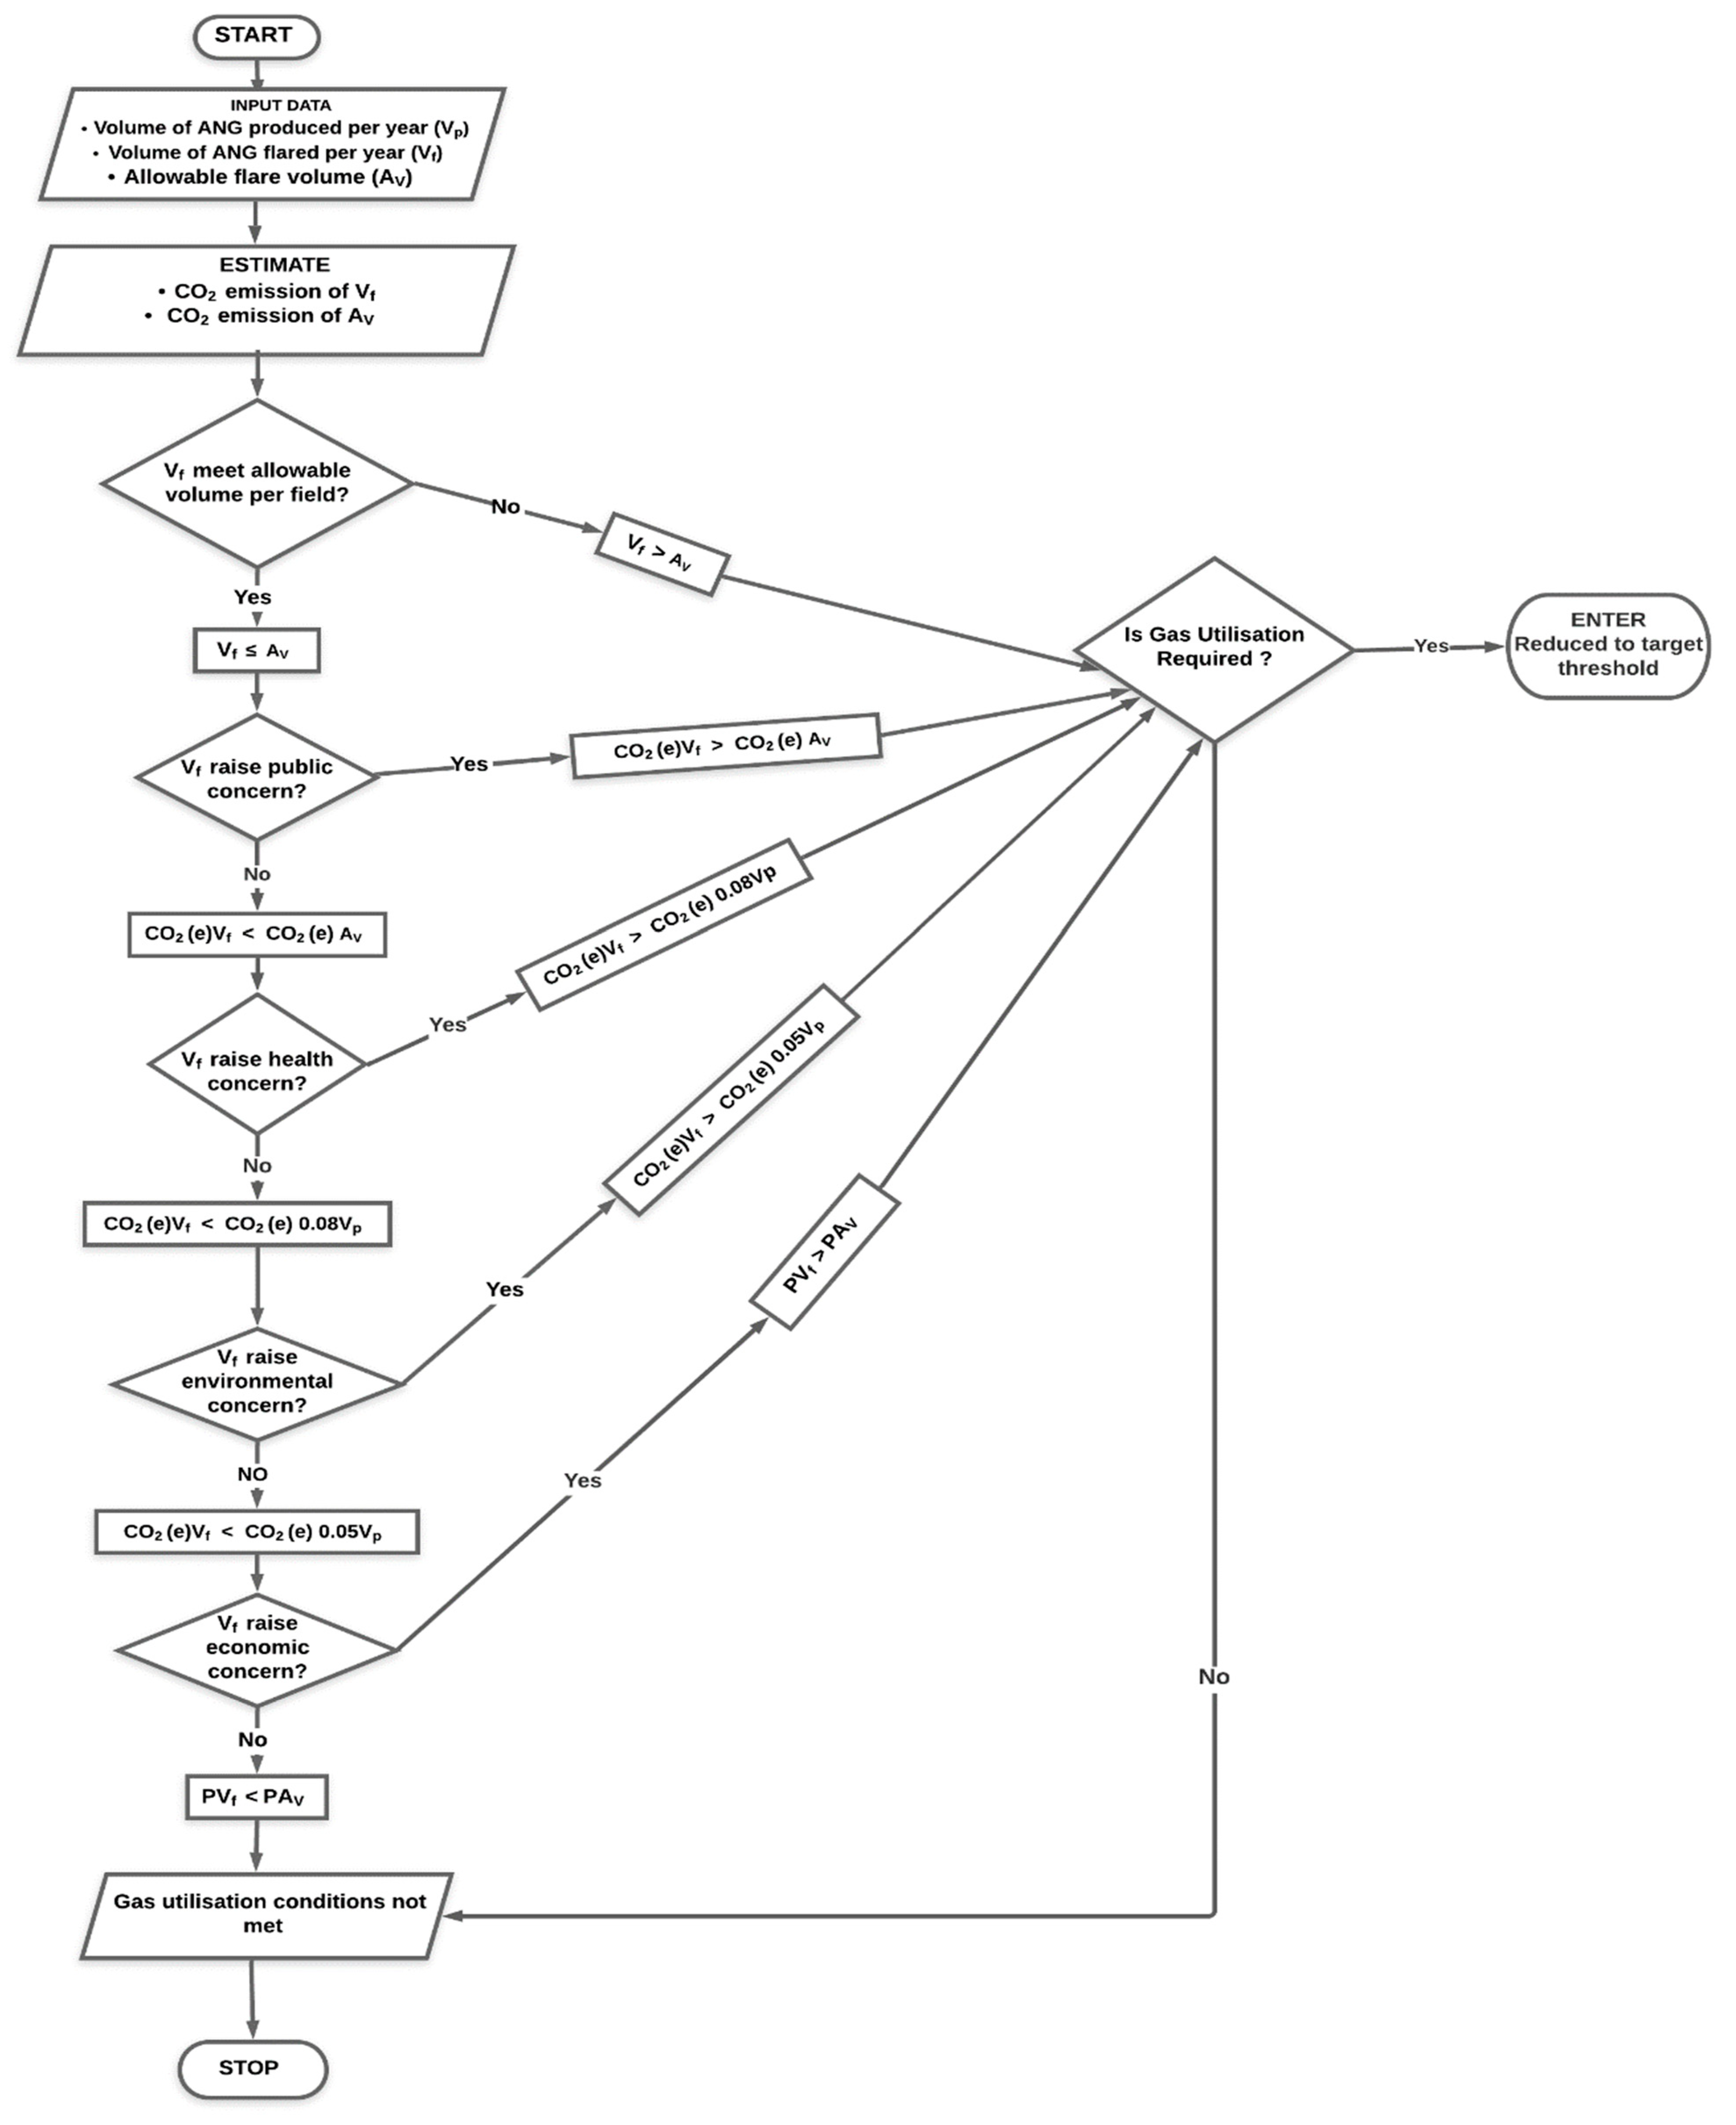
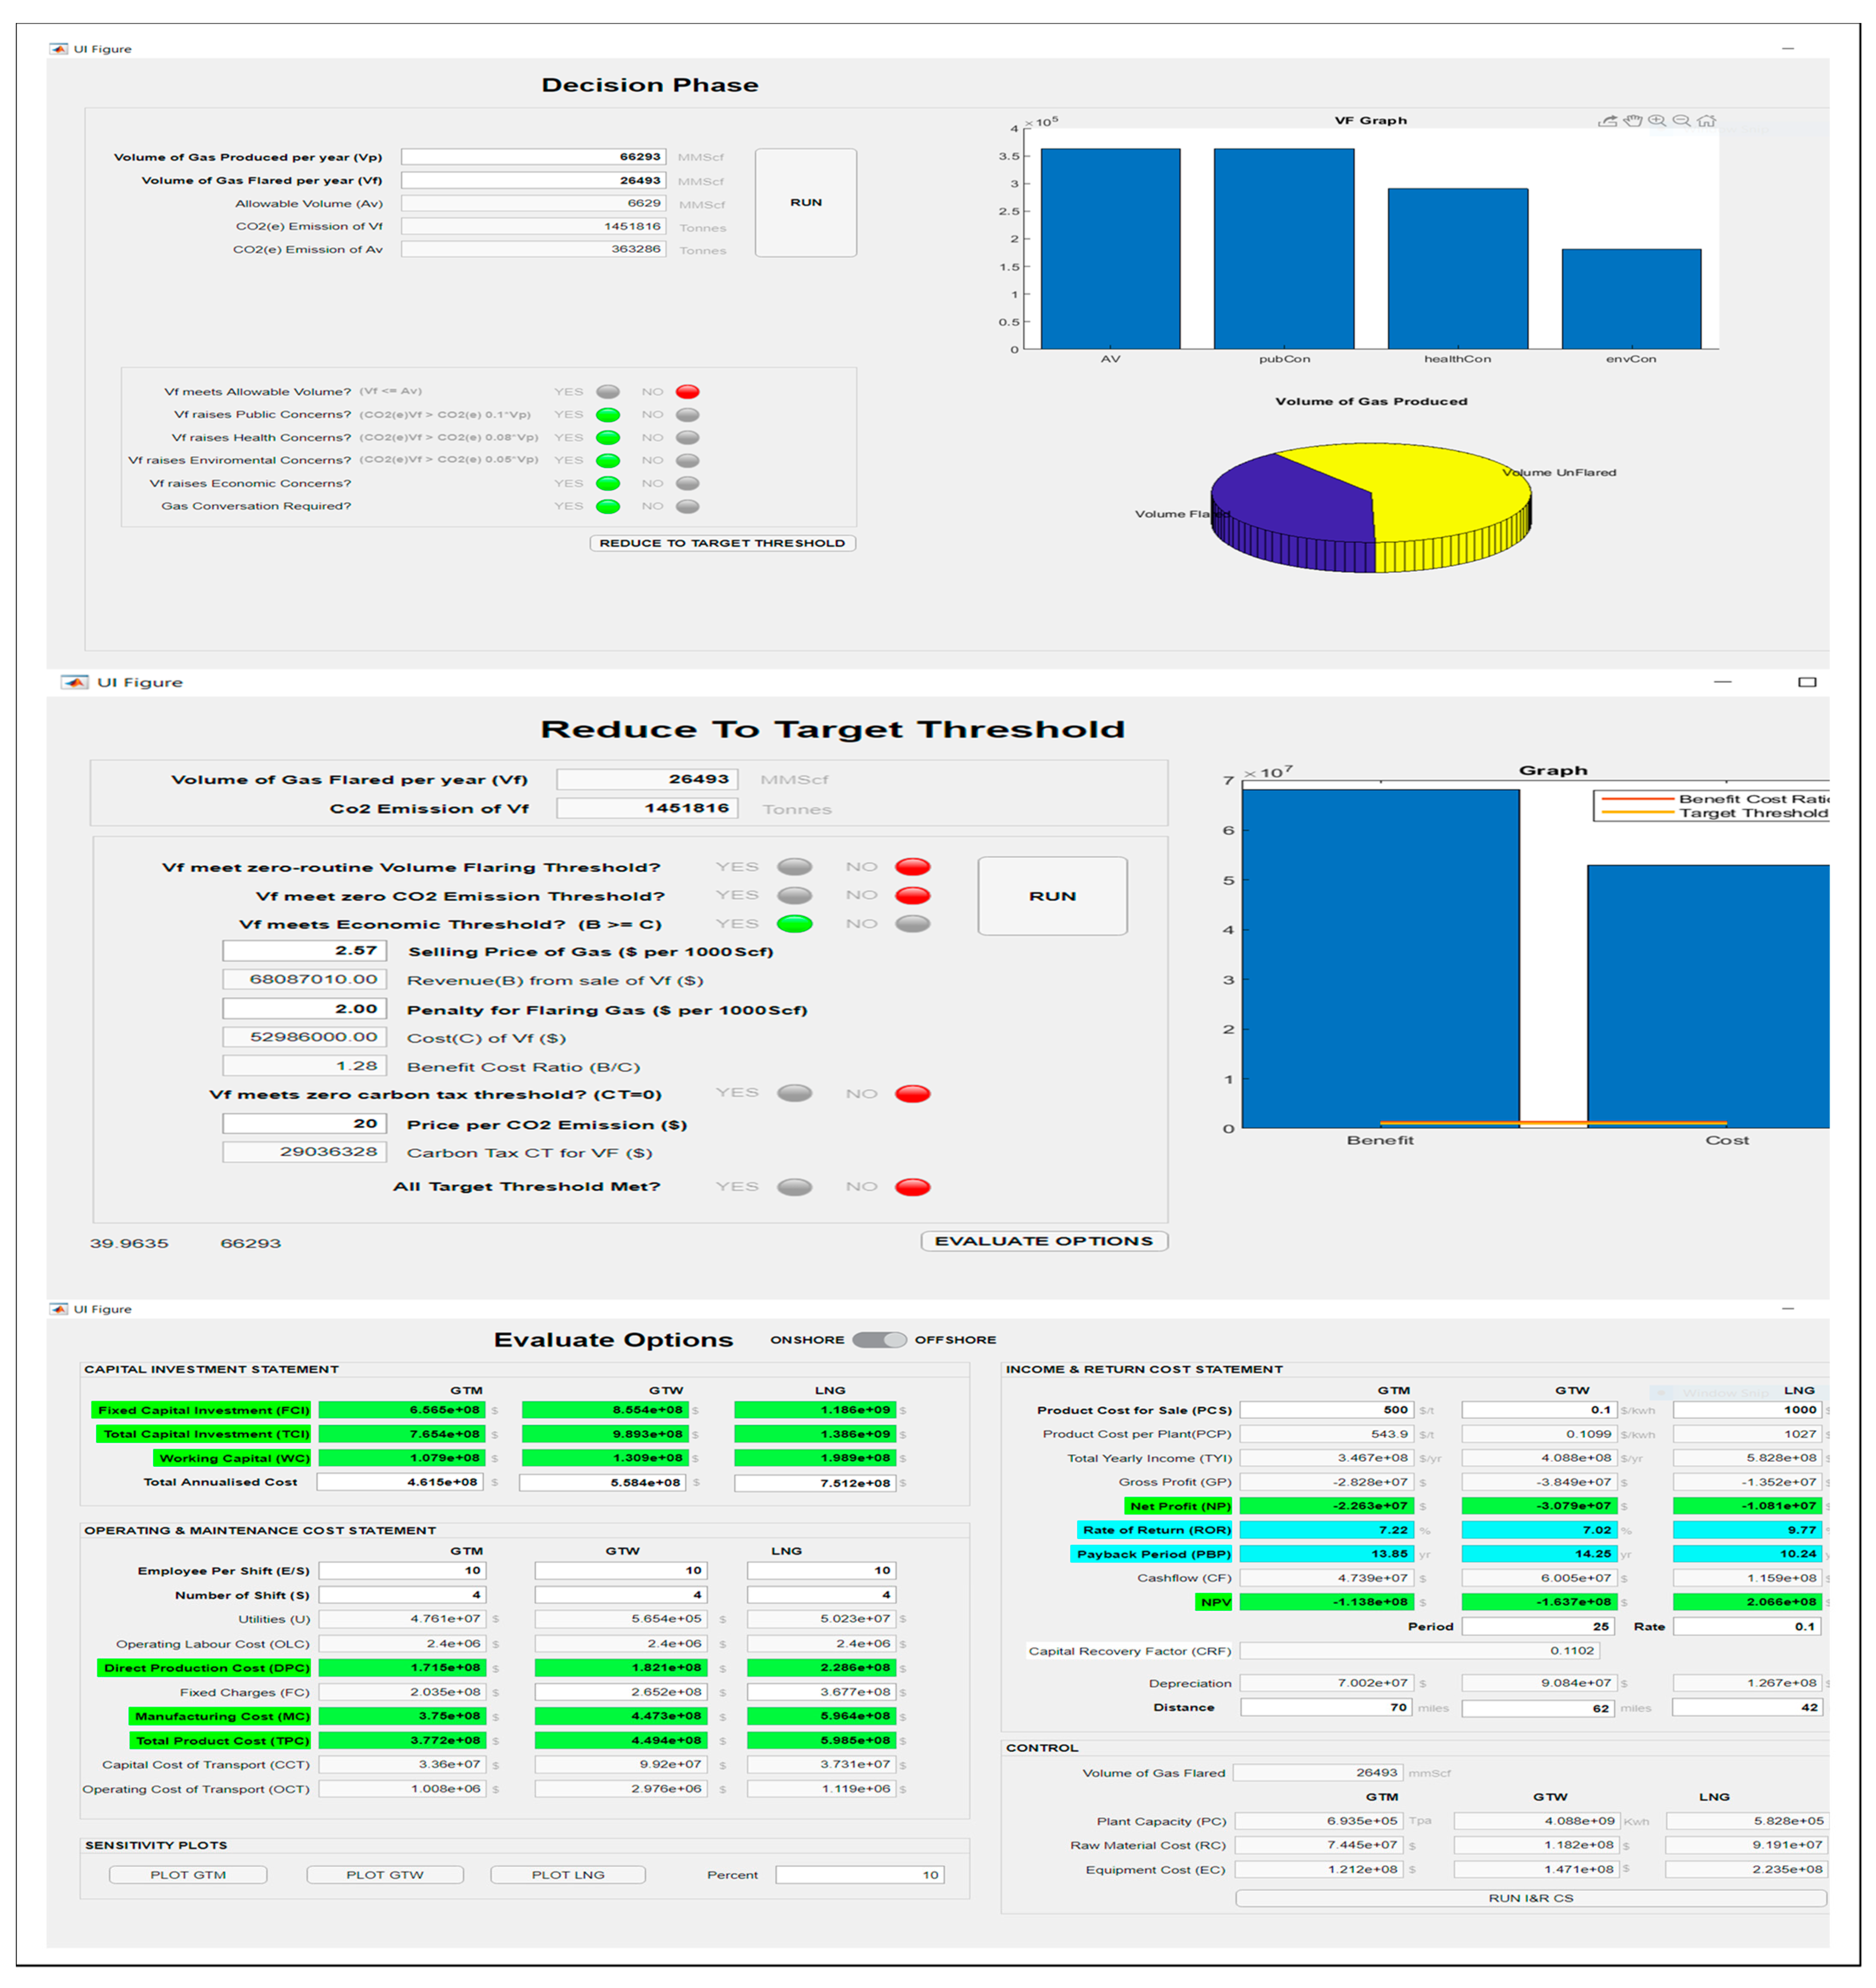
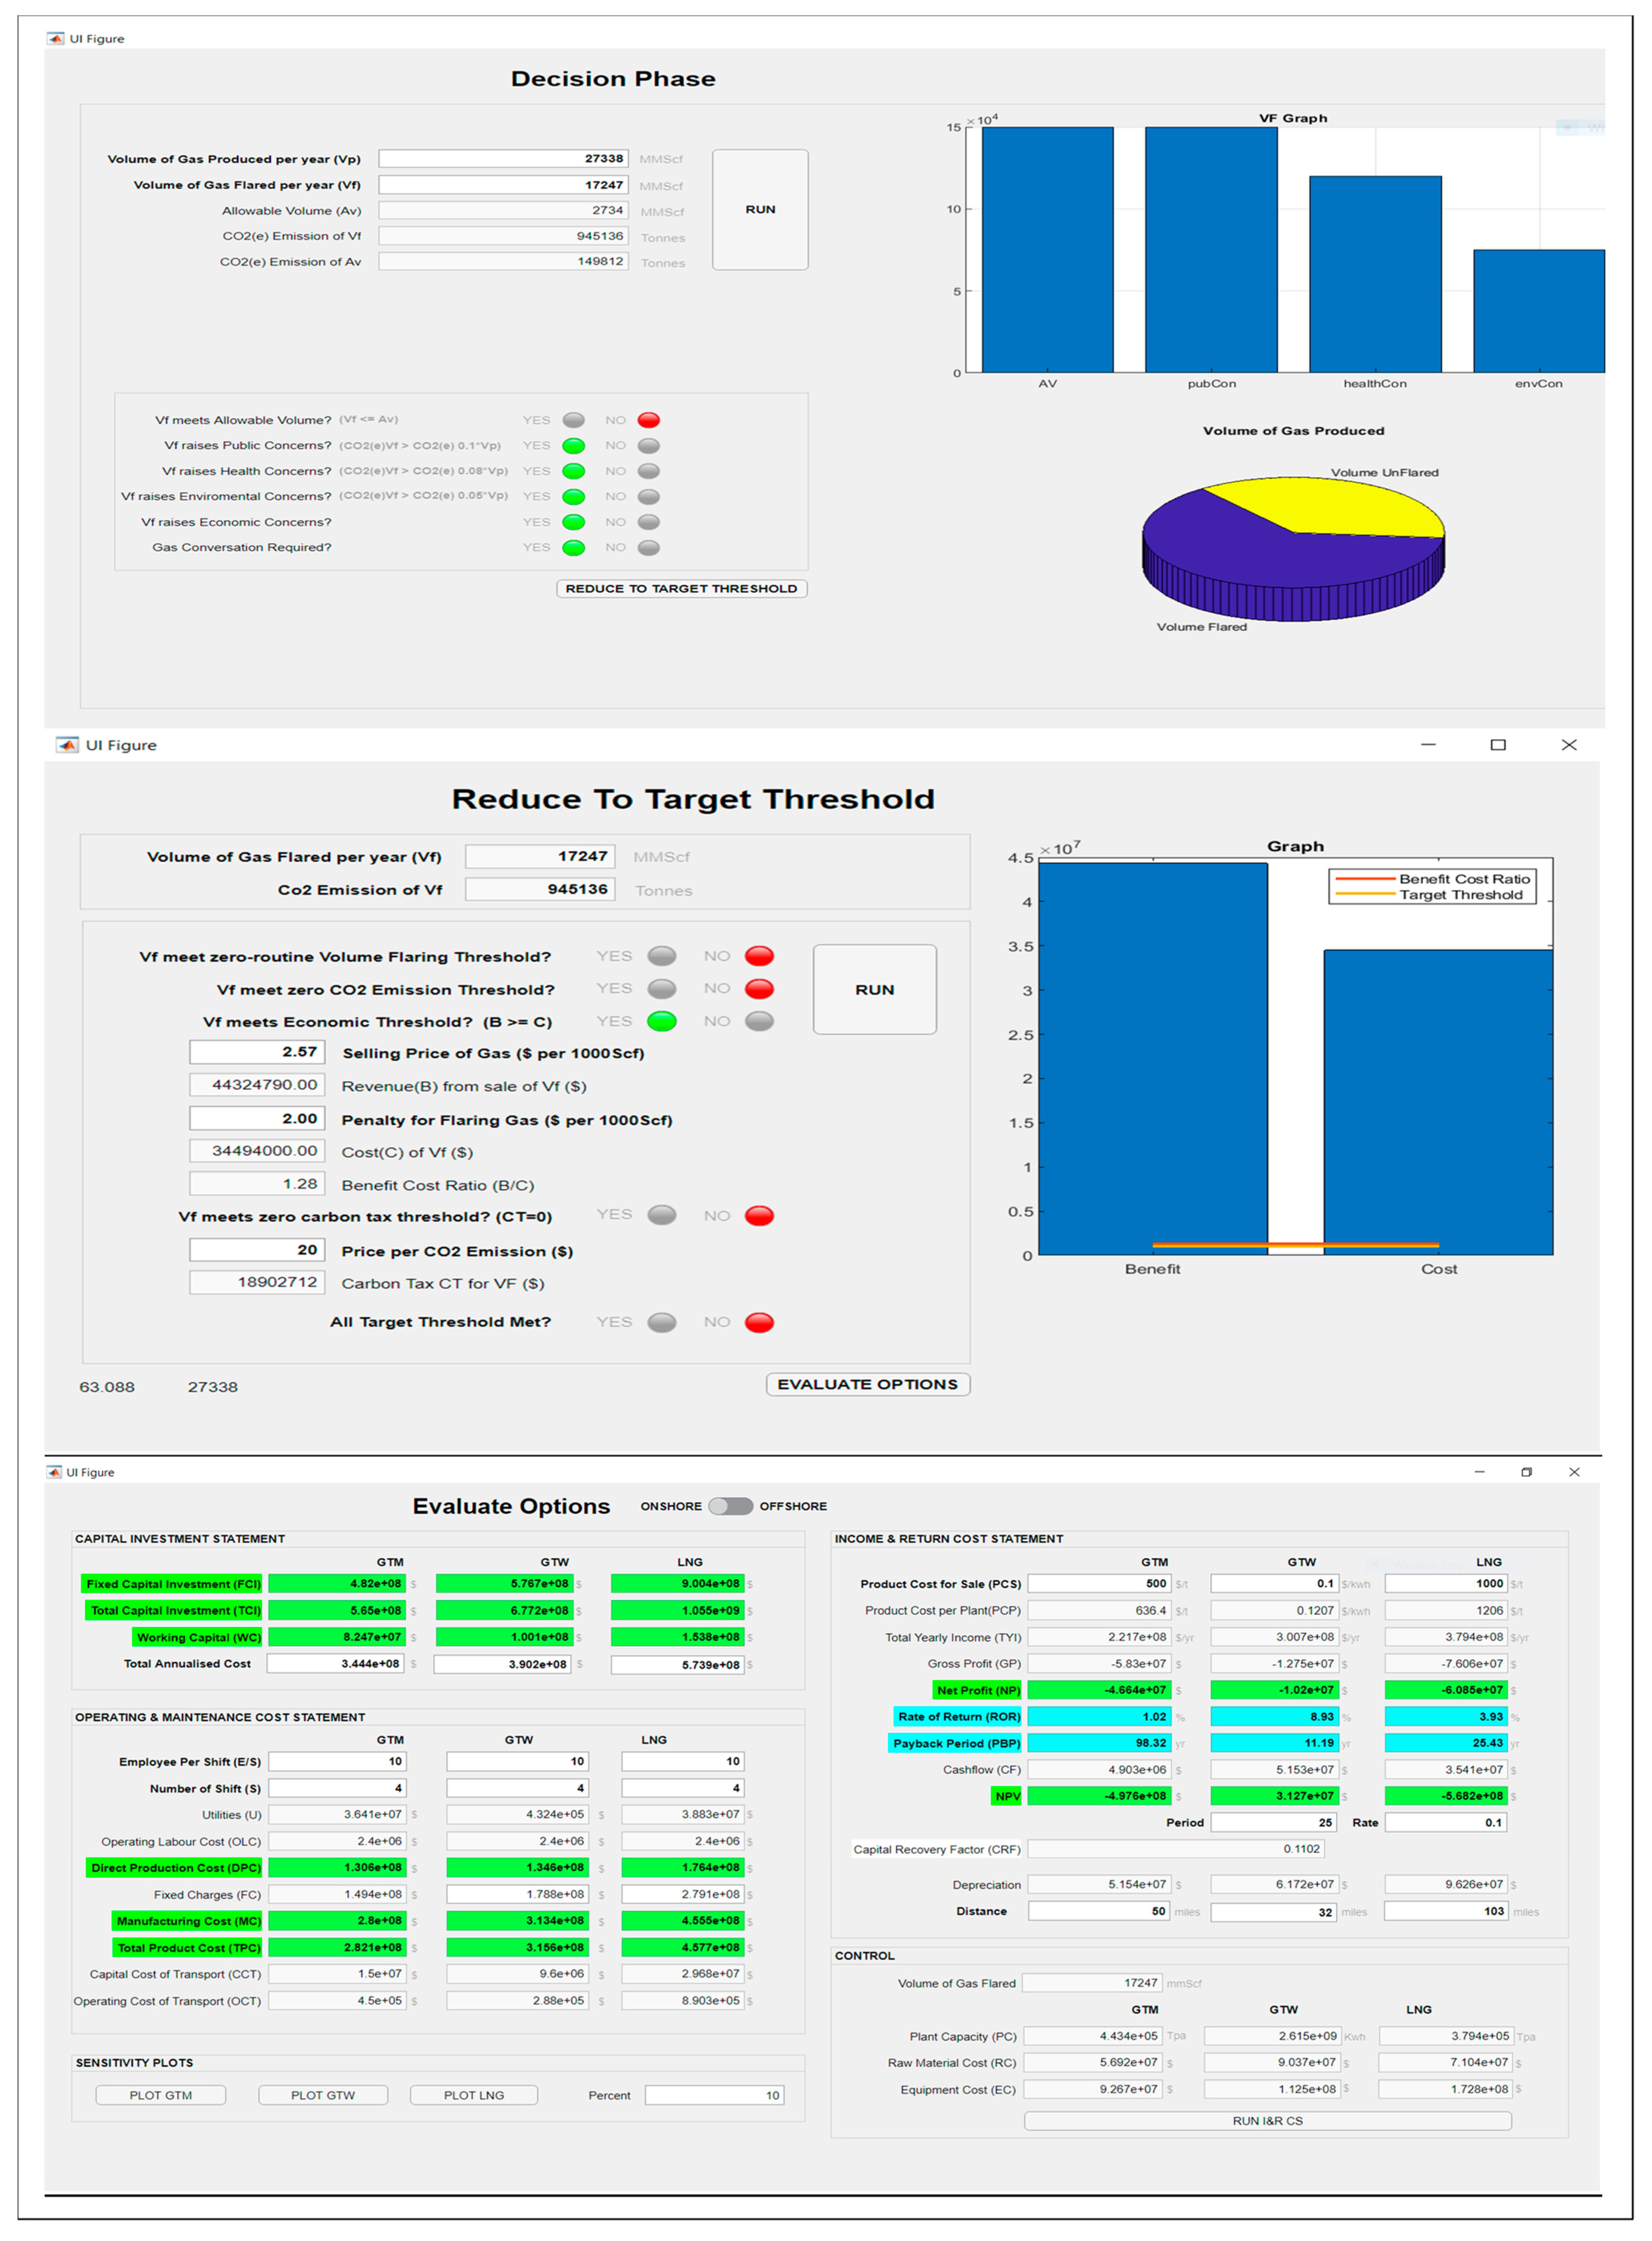
- Decision Phase Sub-tool
Decision Phase—How It Works
Decision Phase—The Backend
- II.
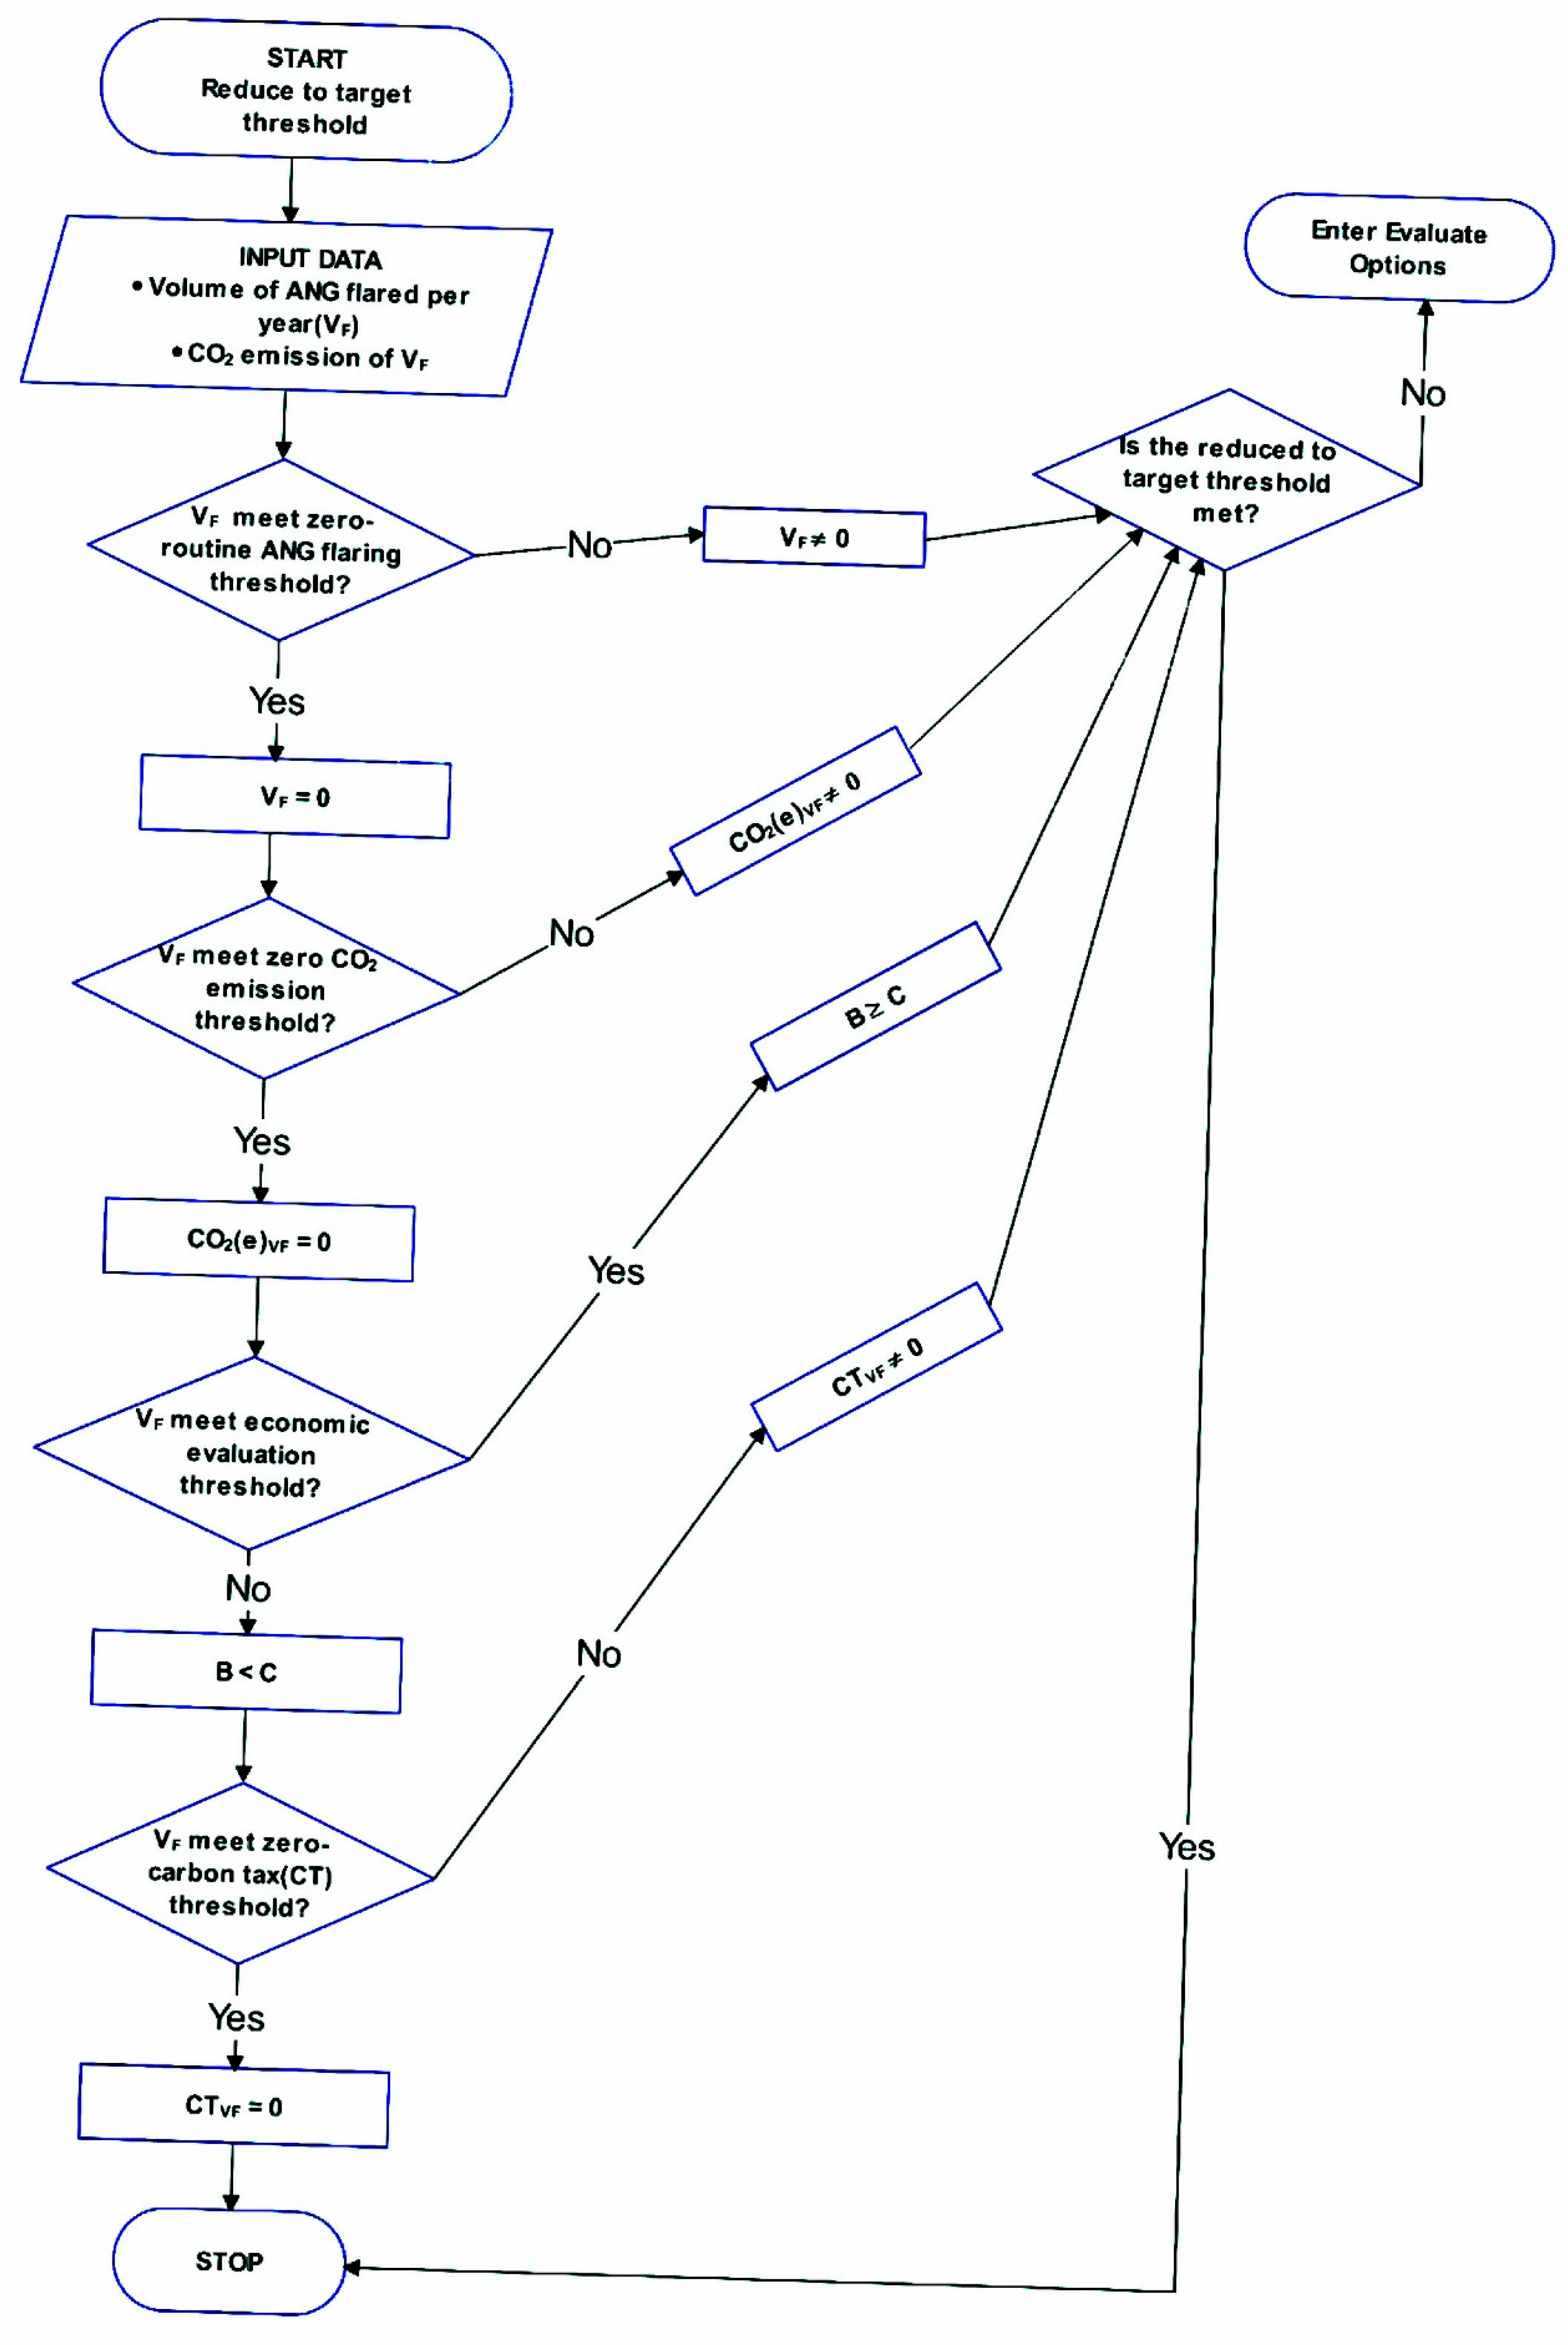
- Reduce to Target Threshold Sub-tool
Reduce to Target Threshold—How It Works
Reduce to Target Threshold—The Backend
- III.
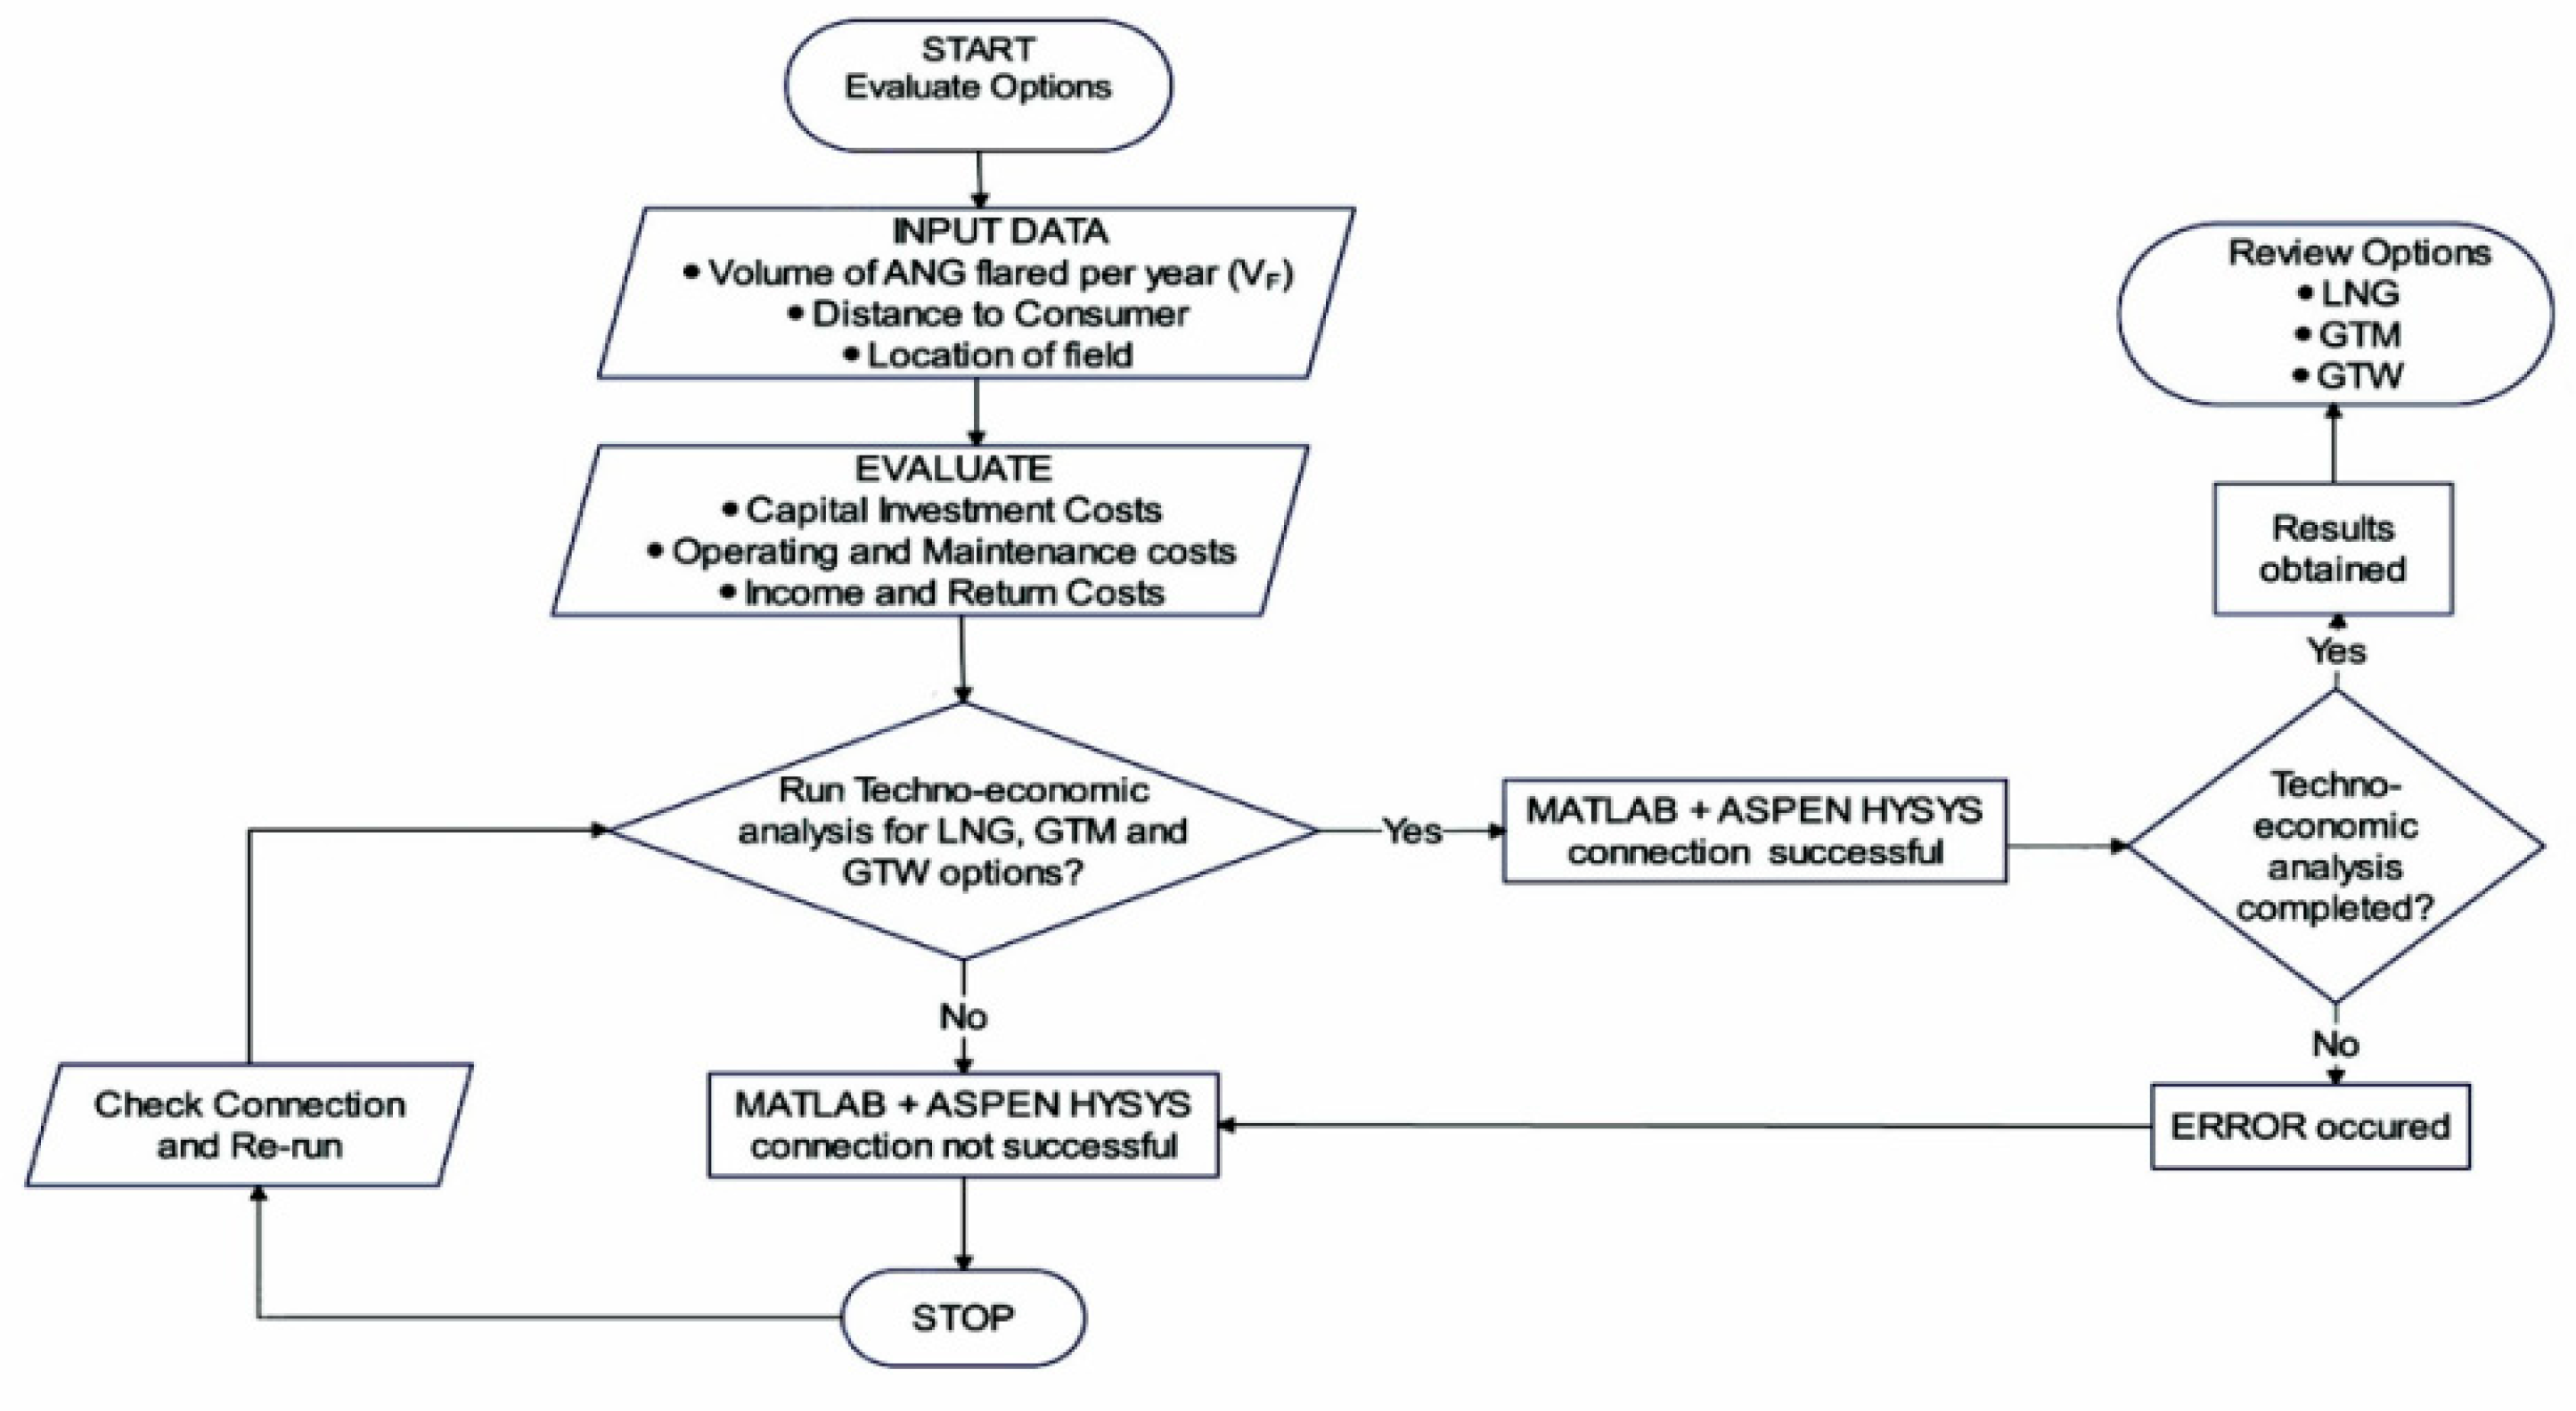
- Evaluate Options Sub-tool
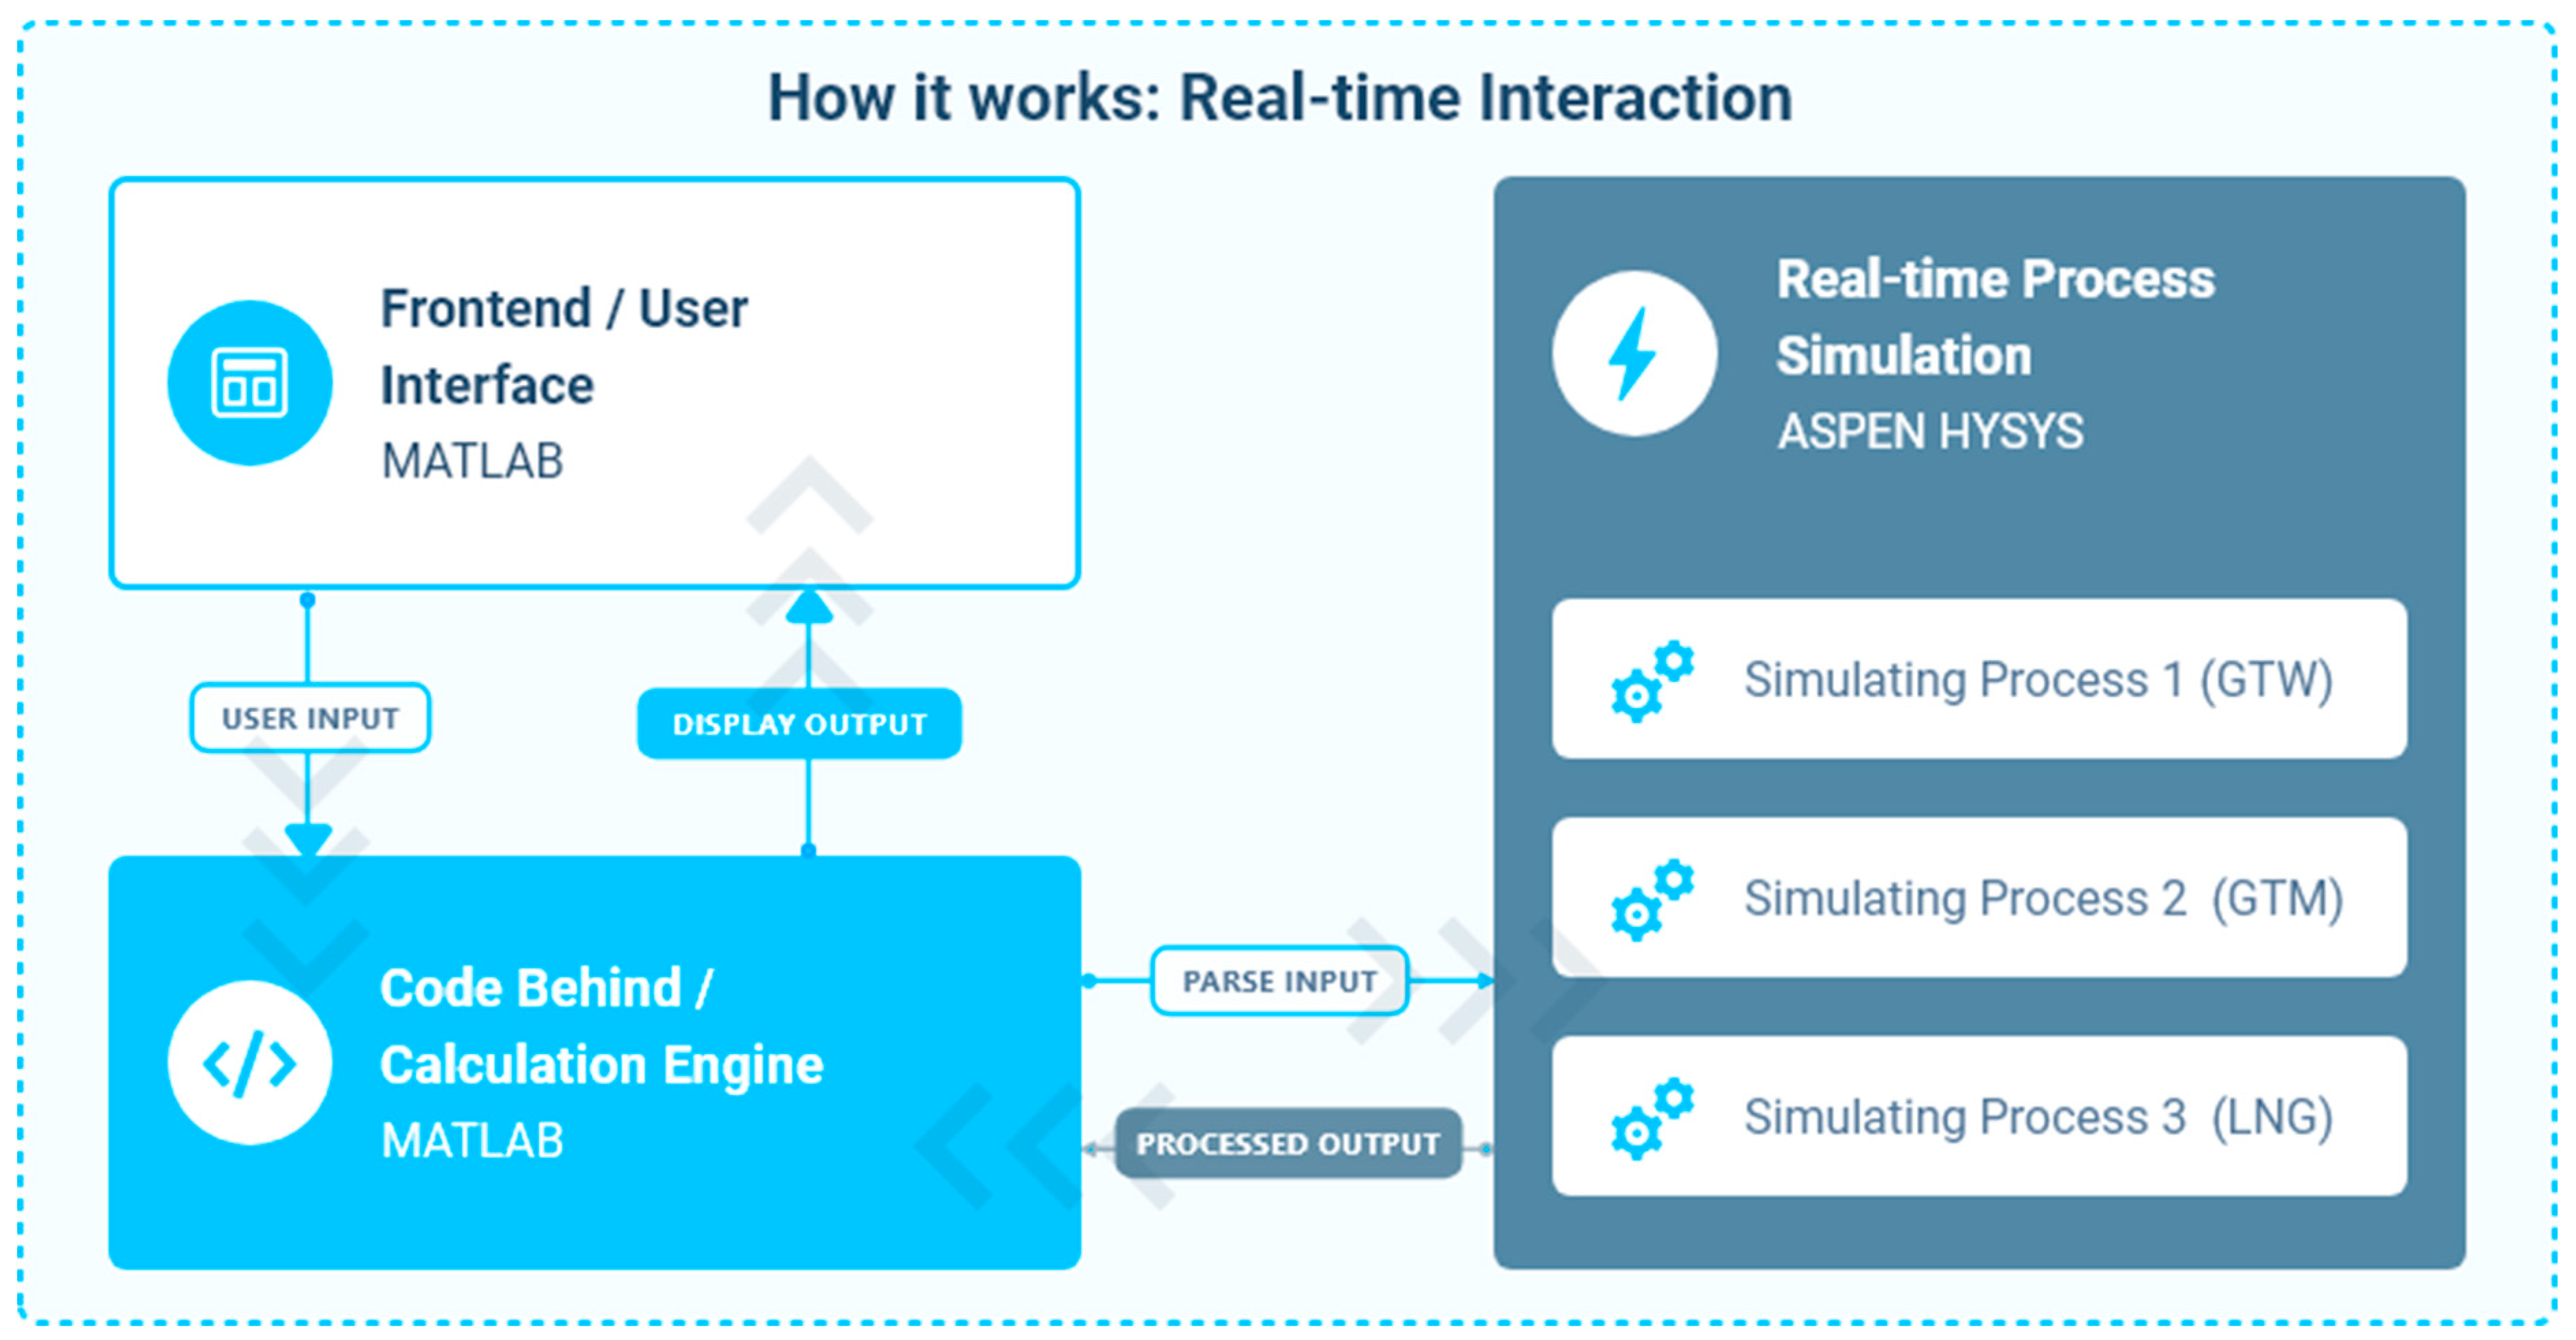
Evaluate Option—How It Works
Evaluate Options Sub-Tool—The Backend
- Connecting to Aspen HYSYS process simulations in real time.
- Connecting to Aspen HYSYS from MATLAB.
- Running the corresponding steady-state simulation depending on VF input.
- Obtaining final output from the simulation.
- Calculating and evaluating economic statements using values from the simulation.
- i.
- Connecting to Aspen HYSYS Process Simulations in Real Time
- ii.
- Connecting to Aspen HYSYS from MATLAB
- iii.
- Running the Corresponding Steady-State Simulation Depending on VF Input
- iv.
- Getting Final Output from the Simulation
- v.
- Evaluating Economic Models
- = the approximate cost (USD) of equipment having size or capacity SB;
- = the known cost (USD) of equipment having corresponding size or capacity SA.
- CT = estimated cost at present time t;
- CO = cost at previous or original time to;
- IT = index value at present time t;
- IO = index value at time original cost obtained to.
- Ct = net adjusted cash inflow during the period t;
- C0 = total initial investment costs;
- r = discount rate;
- t = number of periods.
3. Results and Discussion
3.1. Process Model Results
3.1.1. GTW Process Simulation Results
3.1.2. LNG Process Model Result
3.1.3. GTM Process Simulation Results
3.2. ANG Management Tool Simulation Result
3.2.1. For Field Y
3.2.2. For Field X
4. Conclusions
Author Contributions
Funding
Institutional Review Board Statement
Informed Consent Statement
Data Availability Statement
Conflicts of Interest
Appendix A

| Field Name | Month | 2014 | 2015 | 2016 | 2017 | 2018 | ||||||||||||
|---|---|---|---|---|---|---|---|---|---|---|---|---|---|---|---|---|---|---|
| Gas Produced | Gas Flared | Gas Used | Gas Produced | Gas Flared | Gas Used | Gas Produced | Gas Flared | Gas Used | Gas Produced | Gas Flared | Gas Used | Gas Produced | Gas Flared | GAS Used | AVR. GAS. PROD. | AVR.GAS FLARED | ||
| Field X | JAN | 2633.61 | 2616.53 | 17.08 | 3900.61 | 2596.44 | 1304.17 | 2091.46 | 842.66 | 1248.80 | 1386.56 | 883.96 | 502.60 | 2326.03 | 1782.78 | 543.25 | 2467.65 | 1744.47 |
| FEB | 2495.57 | 2479.12 | 16.45 | 3532.55 | 2354.66 | 1177.89 | 1814.82 | 746.76 | 1068.06 | 2617.23 | 1500.1 | 1117.13 | 2140.95 | 1617.7 | 523.25 | 2520.22 | 1739.67 | |
| MAR | 186.97 | 168.7 | 18.27 | 3888.36 | 2584.19 | 1304.17 | 2046.94 | 864.5 | 1182.44 | 3208.59 | 1956.92 | 1251.67 | 2155.79 | 1614.97 | 540.82 | 2297.33 | 1437.86 | |
| APR | 2402.47 | 2384.83 | 17.64 | 3063.76 | 2070.67 | 993.09 | 1961.33 | 854.63 | 1106.7 | 3078.53 | 1827.42 | 1251.11 | 1864.66 | 1410.15 | 454.51 | 2474.15 | 1709.54 | |
| MAY | 2392.32 | 2374.68 | 17.64 | 3650.85 | 2346.68 | 1304.17 | 1974.77 | 792.33 | 1182.44 | 511.77 | 332.15 | 179.62 | 2147.74 | 1641.71 | 506.03 | 2135.49 | 1497.51 | |
| JUN | 1734.32 | 1716.68 | 17.64 | 3181.57 | 2048.2 | 1133.37 | 1778.98 | 655.69 | 1123.29 | 629.58 | 611.94 | 17.64 | 2122.61 | 1603.42 | 519.19 | 1889.41 | 1327.19 | |
| JUL | 1411.13 | 1399.37 | 11.76 | 2449.86 | 1544.41 | 905.45 | 1475.04 | 553.56 | 921.48 | 1644.44 | 1309.07 | 335.37 | 2730.21 | 2193.94 | 536.27 | 1942.14 | 1400.07 | |
| AUG | 3616.83 | 2288.16 | 1328.67 | 3538.71 | 458.99 | 3079.72 | 1734.88 | 675.99 | 1058.89 | 2132.83 | 1558.34 | 574.49 | 2223.06 | 1691.27 | 531.79 | 2649.26 | 1334.55 | |
| SEP | 3433.64 | 2185.47 | 1248.17 | 2156.42 | 216.51 | 1939.91 | 623.63 | 605.99 | 17.64 | 2173.99 | 1632.05 | 541.94 | 2104.76 | 516.88 | 1587.88 | 2098.49 | 1031.38 | |
| OCT | 3837.19 | 2543.66 | 1293.53 | 2220.54 | 212.73 | 2007.81 | 120.19 | 883.75 | −763.56 | 2313.85 | 1774.99 | 538.86 | 2187.29 | 1644.01 | 543.28 | 2135.81 | 1411.83 | |
| NOV | 3436.02 | 2184.21 | 1251.81 | 1813.49 | 231.07 | 1582.42 | 1953.91 | 792.89 | 1161.02 | 2188.48 | 1667.33 | 521.15 | 1892.17 | 1383.13 | 509.04 | 2256.81 | 1251.73 | |
| DEC | 3741.71 | 2464.84 | 1276.87 | 2106.44 | 209.51 | 1896.93 | 2003.61 | 719.88 | 1283.73 | 2345.63 | 1794.73 | 550.9 | 2158.59 | 1615.41 | 543.18 | 2471.2 | 1360.87 | |
| 31,321.78 | 24,806.25 | 6515.53 | 35,503.16 | 16,874.06 | 18,629.10 | 19,579.56 | 8988.63 | 10,590.93 | 24,231.48 | 16,849.00 | 7382.48 | 26,053.86 | 18,715.37 | 7338.49 | 27,338 | 17,247 | ||
| 79% | 48% | 46% | 70% | 72% | ||||||||||||||
| Field Y | JAN | 5502.66 | 4388.37 | 1114.29 | 4966.13 | 2176.88 | 2789.25 | 6537.76 | 2207.46 | 4330.3 | 7010.16 | 1792.47 | 5217.69 | 4683.32 | 1602.74 | 3080.58 | 5740.01 | 2433.58 |
| FEB | 4461.2 | 3629.31 | 831.89 | 5118.08 | 1413.9 | 3704.18 | 5628.88 | 2116.75 | 3512.13 | 6190.96 | 1795.32 | 4395.64 | 4688.34 | 1464.68 | 3223.66 | 5217.49 | 2083.99 | |
| MAR | 4499.17 | 3808.73 | 690.44 | 5907.64 | 1979.748 | 3927.892 | 6067.39 | 2100.02 | 3967.37 | 5295.55 | 2099.81 | 3195.74 | 4705.8 | 1720.24 | 2985.56 | 5295.11 | 2341.71 | |
| APR | 4251.44 | 3530.11 | 721.33 | 6340.1 | 1934.39 | 4405.71 | 5227.58 | 2037.62 | 3189.96 | 4427.35 | 2039.21 | 2388.14 | 4155.39 | 1817.66 | 2337.73 | 4880.37 | 2271.8 | |
| MAY | 6316.15 | 3251.22 | 3064.93 | 6527.19 | 2061.74 | 4465.45 | 6656.75 | 2093.38 | 4563.37 | 5047.82 | 2081.43 | 2966.39 | 3903.69 | 1661.44 | 2242.25 | 5690.32 | 2229.84 | |
| JUN | 4446.84 | 4156.42 | 290.42 | 6684.25 | 2130.41 | 4553.84 | 5888.48 | 1936.1 | 3952.38 | 5206.2 | 1973.02 | 3233.18 | 3571.89 | 1592.83 | 1979.06 | 5159.53 | 2357.76 | |
| JUL | 6791.07 | 1870.4 | 4920.67 | 6123.44 | 2094.35 | 4029.09 | 3745.85 | 1752.91 | 1992.94 | 5032.54 | 1921.27 | 3111.27 | 3936.91 | 1376.06 | 2560.85 | 5125.96 | 1803 | |
| AUG | 7865.55 | 1831.26 | 6034.29 | 6449.4 | 2122.88 | 4326.52 | 6061.53 | 2030.16 | 4031.37 | 4624.39 | 1733.27 | 2891.12 | 4187.68 | 1447.27 | 2740.41 | 5837.71 | 1832.97 | |
| SEP | 7541.36 | 2010.36 | 5531 | 5656.83 | 1673.77 | 3983.06 | 5799.31 | 1944.96 | 3854.35 | 4571.11 | 1645.13 | 2925.98 | 3940.45 | 11480 | -7539.55 | 5501.81 | 3750.84 | |
| OCT | 7931.64 | 2270.93 | 5660.71 | 6447.38 | 1879.84 | 4567.54 | 6543.56 | 1660.9 | 4882.66 | 4865.61 | 1643.86 | 3221.75 | 4282.96 | 1518.21 | 2764.75 | 6014.23 | 1794.75 | |
| NOV | 7433.43 | 2117.8 | 5315.63 | 6678.17 | 1903.42 | 4774.75 | 7224.61 | 1982.03 | 5242.58 | 4705.64 | 1528.01 | 3177.63 | 4161.82 | 1434.17 | 2727.65 | 6040.73 | 1793.09 | |
| DEC | 7817.14 | 2380.63 | 5436.51 | 6708.5 | 2110.04 | 4598.46 | 5220.51 | 1691.78 | 3528.73 | 4998.9 | 1274.27 | 3724.63 | 4203.41 | 1542.24 | 2661.17 | 5789.69 | 1799.79 | |
| 74,857.65 | 35,245.54 | 39,612.11 | 73,607.11 | 23,481.37 | 50,125.74 | 70,602.21 | 23,554.07 | 47,048.14 | 61,976.23 | 21,527.07 | 40,449.16 | 50,421.66 | 28,657.54 | 21,764.12 | 66,293 | 26,493 | ||
| 47% | 32% | 33% | 35% | 57% | ||||||||||||||
| k = A exp(B/RgT) | A | B |
|---|---|---|
| Ka () | 0.499 | 17,197 |
| Kb | 6.62 × 10¹¹ | 124,119 |
| Kc | 3453.38 | - |
| kd () | 1.07 | 36,696 |
| Ke () | 1.22 × 10¹⁰ | −94,765 |
| Keq = | A | B |
| (bar − 2) | 3066 | 10.592 |
| 2073 | 2.029 |
| Item | Formula |
|---|---|
| Plant Capacity (PC) This is the final output from the simulation | %GTM PCGTM = GTM_Final_A; %GTW PCGTW = GTW_Final*8760; %LNG PCLNG = LNG_Final; |
| Raw Material Cost (RMC) | % GTW RMCGTW= RMCGTW1 × [PCGTW/PCGTW1]0.6 % GTM RMCGTM= RMCGTM1 × [PCGTM/PCGTM1]0.6 % LNG RMCLNG= RMCLNG1 × [PCLNG/PCLNG1]0.6 N/B—GTM1, GTW1, and LNG1 are ANG processes that have established capacities and costs. |
| Equipment Cost (EC) | % GTW ECGTW= ECGTW1 × [PCGTW/PCGTW1]0.6 % GTM ECGTM= ECGTM1 × [PCGTM/PCGTM1]0.6 % LNG ECLNG= ECLNG1 × [PCLNG/PCLNG1]0.6 N/B—GTM1, GTW1, and LNG1 are ANG processes that have established capacities and costs. |
| Capital Cost of Transport (CCT) | For GTM CCT Onshore—USD 300,000 × Distance (D) (cost per mile of pipeline assuming 12 inch) CCT Offshore—USD 480,000 × Distance (D) For GTW CCT Onshore—USD 300,000 × Distance (D) (cost per mile assuming transmission via 65 kV lines) CCT Offshore—USD 1,600,000 × Distance (D) For LNG CCT Offshore C = 1.40 + 0.0002(D) CCT Onshore C = 1.70 + 0.0002(D) Where C = Cost per 1000 scf D = Distance in miles Therefore, CCT = [C × Volume flared (VF) × 1000] (assumed LNG Carrier price per volume) |
| Utilities (U) | % GTW UGTW= UGTW1 × [PCGTW/PCGTW1]0.6 % GTM UGTM= UGTM1 × [PCGTM/PCGTM1]0.6 % LNG ULNG= ULNG1 × [PCLNG/PCLNG1]0.6 N/B—GTM1, GTW1, and LNG1 are ANG processes that have established capacities and costs. |
References
- Jorgenson, A.K. Global warming and the neglected greenhouse gas: A cross-national study of the social causes of methane emissions intensity, 1995. Soc. Forces 2006, 84, 1779–1798. [Google Scholar] [CrossRef]
- Kearns, J.; Armstrong, K.; Shirvill, L.; Garland, E.; Simon, C.; Monopolis, J. Flaring and venting in the oil and gas exploration and production industry, international association of oil. Gas Prod. Rep. 2000, 2, 288. [Google Scholar]
- Shore, D. Making the flare safe. J. Loss Prev. Process Ind. 1996, 9, 363–381. [Google Scholar]
- Ngene, S.; Tota-Maharaj, K.; Eke, P.; Hills, C. Environmental and economic impacts of crude oil and natural gas production in developing countries. Int. J. Econ. Energy Environ. 2016, 1, 64–73. [Google Scholar]
- EPA. Air Pollution Cost Manual, 6th ed.; EPA/452/B-02-001; U.S. Environment Protection Agency: Washington, DC, USA, 2002.
- Wang, D.; Bao, A.; Kunc, W.; Liss, W. Coal power plant flue gas waste heat and water recovery. Appl. Energy 2012, 91, 341–348. [Google Scholar] [CrossRef]
- Roosa, S.A.; Jhaveri, A.G. Carbon Reduction: Policies, Strategies, and Technologies; River Publishers: Gistrup, Denmark, 2020. [Google Scholar]
- Creamer, A.E.; Gao, B. Carbon Dioxide Capture: An Effective Way to Combat Global Warming; Springer: Cham, Switzerland, 2015. [Google Scholar]
- Svensson, B. Global gas flaring-a burning issue. In Proceedings of the 20th World Petroleum Congress, OnePetro, Doha, Qatar, 4–8 December 2011. [Google Scholar]
- Odumugbo, C.A. Natural gas utilisation in Nigeria: Challenges and opportunities. J. Nat. Gas Sci. Eng. 2010, 2, 310–316. [Google Scholar] [CrossRef]
- EIA. How Much Carbon Dioxide Is Produced When Different Fuels Are Burned? Energy Information Administration, Office of Oil and Gas, 2021. Available online: https://www.eia.gov/tools/faqs/faq.php?id=73&t=11 (accessed on 10 August 2022).
- IEA. Global Energy and CO2 Status Report 2019. International Energy Agency, Paris, 2019. Available online: https://www.iea.org/reports/global-energy-co2-status-report-2019 (accessed on 10 September 2022).
- Funds, H. The Growing Importance of Natural Gas. Nat. Gas White Pap. 2014, 1–8. Available online: https://www.raymondjames.com/neunuebelbarrantes/pdfs/natural_gas_may_2014.pdf (accessed on 15 August 2022).
- PriceWaterhouseCoopers (PwC). Assessing the Impact of Gas Flaring on the Nigerian Economy. 2019. Available online: https://www.pwc.com/ng/en/assets/pdf/gas-flaring-impact1.pdf (accessed on 7 August 2022).
- Organisation of the Petroleum Exporting Countries (OPEC) Website, 2021. Available online: https://www.opec.org/opec_web/en/about_us/167.htm (accessed on 9 August 2022).
- Department of Petroleum Resources (DPR). Annual Oil and Gas Report; Ministry of Petroleum in Nigeria: Abuja, Nigeria, 2018.
- Ajugwo, A.O. Negative effects of gas flaring: The Nigerian experience. J. Environ. Pollut. Hum. Health 2013, 1, 6–8. [Google Scholar]
- Abu, R.; Patchigolla, K.; Simms, N. A Review on Qualitative Assessment of Natural Gas Utilisation Options for Eliminating Routine Nigerian Gas Flaring. Gases 2023, 3, 1–24. [Google Scholar] [CrossRef]
- Schick, L. Mapping Gas Flares in the Niger Delta. Code of Africa (Impact Africa). 2017. Available online: https://medium.com/code-for-africa/mapping-gas-flares-in-the-niger-delta-f8963f327593 (accessed on 6 July 2022).
- Mondal, S.K.; Uddin, M.R.; Majumder, S.; Pokhrel, J. HYSYS Simulation of Chemical Process Equipments. Chem. Eng. Process. 2015, 1–7. [Google Scholar] [CrossRef]
- Mokhatab Mak, J.Y.; Mokhatab, S.; Valappil, J.V. Handbook of Liquefied Natural Gas; Elsevier: Amsterdam, The Netherlands, 2014. [Google Scholar]
- Helgestad, D.E. Modelling and optimization of the C3MR process for liquefaction of natural gas. In Specialization Project, TKP 4550 Process Systems Engineering; Norges Teknisk Naturviten Skapelige University (NTNU): Stavanger, Norway, 2009; 44p, Available online: https://folk.ntnu.no/skoge/diplom/prosjekt09/helgestad/Helgestad_project.pdf (accessed on 18 August 2022).
- Fragkou, E. LNG Production Technologies and Process Simulation. Master’s Thesis, School of Mineral Resources Engineering, Technical University of Crete, Chania, Greece, 2019. [Google Scholar] [CrossRef]
- Chou, V.H.; Haslback, J.L.; Kyle, A.; Lewis, E.; Pinkerton, L.L.; Shah, V.; Varghese, E.; Woods, M.C. Cost and Performance Baseline for Fossil Energy Plants-Volume 3c: Natural Gas Combined Cycle at Elevation (No. DOE/NETL-2010/1396); National Energy Technology Laboratory (NETL): Pittsburgh, PA, USA; Morgantown, WV, USA; Albany, OR, USA, 2011.
- Arthur, T. Control Structure Design for Methanol Process; Norwegian University of Science and Technology: Trondheim, Norway, 2010. [Google Scholar]
- Arthur, T. Simulation, optimal operation, and self-optimising control of methanol process. In Specialization Project TKP 4555; Norges Teknisk Naturviten Skapelige University (NTNU): Stavanger, Norway, 2012. [Google Scholar]
- Fogler, H.S.; Fogler, S.H. Elements of Chemical Reaction Engineering; Pearson Educacion: London, UK, 1999. [Google Scholar]
- EPA. Greenhouse Gases Equivalencies Calculator-Calculator and References; Energy and Environment, U.S. Environmental Protection Agency: Washington, DC, USA, 2021.
- Nigeria Gas Flare Commercialization Programme (NGFCP). The Flare Gas (Prevention of Waste and Pollution) Regulations. 2018. Available online: https://ngfcp.dpr.gov.ng/resources/regulations/ngfcp-regulations/ (accessed on 10 September 2022).
- The World Bank. State and Trends of Carbon Pricing 2021; World Bank: Washington, DC, USA, 2021; ISBN 978-1-4648-1728-1. Available online: http://hdl.handle.net/10986/35620 (accessed on 20 August 2022).
- Peters, M.S.; Timmerhaus, K.D.; West, R.E. Plant Design and Economics for Chemical Engineers; McGraw-Hill Companies: New York, NY, USA, 2003. [Google Scholar]
- U.S. Energy Information Administration (EIA). Engineering Economic Analysis Guide: Liquid Fuels Technologies, Independent Statistics and Analysis. 2015. Available online: https://www.eia.gov/outlooks/documentation/workshops/pdf/EEAGuide_1132016.pdf (accessed on 15 August 2022).
- General Electric (GE). GE Power Gas Turbine. General Electric. 2021. Available online: https://www.ge.com/power/gas/gas-turbines/9ha (accessed on 7 July 2022).
- Mitsubishi Heavy Industries Group. Mitsubishi Power Gas Turbine. Mitsubishi Power Ltd., 2021. Available online: https://power.mhi.com/products/gasturbines/lineup/h100 (accessed on 5 March 2022).
- Tractebel Engineering. Mini and Micro LNG for Commercialization of Small Volumes of Associated Gas. World Bank, 2015. Available online: https://openknowledge.worldbank.org/bitstream/handle/10986/25919/112131.pdf?sequence=4&isAllowed=y (accessed on 21 August 2022).
- Lim, O.S. Optimization of Gas Transmission Design. 2011. Available online: http://utpedia.utp.edu.my/id/eprint/10565/1/2011%20-%20Optimizing%20of%20gas%20transmission%20design.pdf (accessed on 20 August 2022).
- South Asia Regional Initiative/Energy’s (SARI/E). Natural Gas Value Chain: Pipeline Transportation. Global Energy Markets Trade Programme. 2015. Available online: https://docplayer.net/7351060-Natural-gas-value-chain-pipeline-transportation.html (accessed on 23 July 2022).
- Alonso, F.; Greenwell, C. Underground vs. overhead: Power line installation-cost comparison and mitigation. Electr. Light Power 2013. Available online: https://www.power-grid.com/td/underground-vs-overhead-power-line-installation-cost-comparison/#gref (accessed on 20 August 2022).
- Nieradzinska, K.; MacIver, C.; Gill, S.; Agnew, G.A.; Anaya-Lara, O.; Bell, K.R.W. Optioneering analysis for connecting Dogger Bank offshore wind farms to the GB electricity network. Renew. Energy 2016, 91, 120–129. [Google Scholar] [CrossRef] [Green Version]


| Component | Methane | Ethane | Propane | Nitrogen |
|---|---|---|---|---|
| Mole Fraction | 0.45 | 0.45 | 0.02 | 0.08 |
| Reaction | ΔH (kJ/mol) | ΔG (kJ/mol) | ΔS (J/kmol) | TCarnot (°C) | |
|---|---|---|---|---|---|
| 1 | C2H6 + 2H2O → 2CO + 5H2 | 348 | 216 | 441.8 | 514 |
| 2 | C3H8 + 3H2O → 3CO + 7H2 | 522 | 283 | 802.5 | 377 |
| 3 | n-C4H10 + 4H2O → 4CO + 9H2 | 677 | 366 | 1042.3 | 376 |
| 4 | CH4 + H2O ↔ CO + 3H2 | 207 | 143 | 215.44 | 687 |
| 6 | CO + H2O ↔ H2 + CO2 | −42 | −29 | −42.87 | 706 |
| Reaction | ΔH (kJ/mol) | ΔG (kJ/mol) | ΔS (J/kmol) | TCarnot (°C) | |
|---|---|---|---|---|---|
| 1 | CH4 + 1.5O2 ↔ CO + 2H2O | −522 | −546 | 81.52 | −6670 |
| 2 | CH4 + H2O ↔ CO + 3H2 | 207 | 143 | 215.44 | 687 |
| 3 | CO + H2O ↔ H2 + CO2 | −43 | −30 | −43.93 | 705 |
| Reaction | ΔH (kJ/mol) | ΔG (kJ/mol) | ΔS (J/kmol) | TCarnot (°C) | |
|---|---|---|---|---|---|
| 1 | CO + 2H2 ↔ CH3OH | −92 | −27 | −222.6 | 140 |
| 2 | CO + 3H2 ↔ CH3OH + H2O | −50 | 4 | −179.13 | 6 |
| 3 | CO2 + H2 ↔ H2O + CO | +43 | 29 | 43.89 | 706 |
| Parameter | Value |
|---|---|
| Number of tubes | 2962 |
| Density (kgm−3) | 1770 |
| Particle diameter (m) | 5.47 × 10⁻³ |
| Heat capacity (kJ kg−1k−1) | 5 |
| Length of reactor (m) | 7.022 |
| Bed void fraction | 0.39 |
| Density of catalyst bed (kgm−3) | 1140 |
| Tube inner diameter (m) | 0.038 |
| Tube outer diameter (m) | 0.042 |
| Item | Formula |
|---|---|
| Fixed Capital Investment (FCI) | FCI Onshore = (5.04 × EC) + CCT FCI Offshore = (5.14 × EC) + CCT |
| Total Capital Investment (TCI) | TCI= FCI + WC |
| Depreciation (D) | D = (0.1 × FCI) + 0.2 × (0.18 × EC); |
| Operating Labour Cost (OLC) | OLC = Employee per shift (E) × Number of shift (S) × salary per year |
| Operating Cost of Transport (OCT) | OCT = CCT × 0.03; |
| Direct Production Cost (DPC) | DPC = RC + OLC + U+ (0.45 × OLC) + (0.07 × FCI) |
| Fixed Charges (FC) | FC = 0.31 × FCI |
| Manufacturing Cost (MC) | MC = DPC + FC |
| Total Product Cost (TPC) | TPC = MC + (0.9 × OLC) |
| Product Cost for Plant (PCP) | PCP = TPC ÷ PC |
| Total Yearly Income (TYI) | TYI = Plant Capacity (PC) × Plant Cost of Sale (PCS) |
| Gross Profit (GP) | GP = TYI − MC |
| Net Profit (NP) | NP = Gross Profit (GP) × [1 − Income Tax Rate (20%)] = 0.8 × GP |
| Cashflow (CF) | CF = Net Profit (NP) + Depreciation (D) |
| Rate of Return on Investment (ROR) | ROR = Net Cashflow (CF) ÷ Capital Investment × 100% |
| Payback Period (PBP) | PBP = Capital Investment ÷ Net Cashflow (CF) |
| Working Capital (WC) | WC = 0.89 × EC + OCT |
| Capital Recovery Factor (CRF) | CRF = rate ÷ (1 − (1 + rate) ^-period) |
| Total Annualised Cost (TAC) | TAC = (CRF × TCI) + TPC |
| Power Summary | Model Simulation Result for Field Y | Model Simulation Result for Field X |
|---|---|---|
| Gas Turbine Power (MWe) | 303 | 193 |
| Steam Turbine Power (MWe) | 167 | 108 |
| Total Power (MWe) | 471 | 301 |
| Total Auxiliaries (kWe) | 3966 | 2592 |
| Net Power (MWe) | 467 | 299 |
| Net Plant Efficiency (HHV) | 52% | 49.6% |
| Net Plant Efficiency (LHV) | 57% | 54.5% |
| Net Plant Heat Rate (HHV) (kJ/kWh) | 6982 | 7282 |
| Net Plant Heat Rate (LHV) (kJ/kWh) | 6343 | 7254 |
| CONSUMABLES | ||
| Natural Gas Feed Flow (kg/h) | 61,760 | 40,790 |
| Thermal Input (HHV) (kWth) | 905,018 | 601,510 |
| Thermal Input (LLV) (kWth) | 822,136 | 546,423 |
| Parameter | Model Simulation Output for Field Y | Model Simulation Output for Field X |
|---|---|---|
| LNG Output | ||
| LNG Output Feed Rate (tpa) | 580,000 | 380,000 |
| Field Y | Field X | |||||
|---|---|---|---|---|---|---|
| Synthesis Gas | Methanol | Off-Gas | Synthesis Gas | Methanol | Off-Gas | |
| Conditions | ||||||
| Mass flow (kgmole/h) | 12,930 | 3053 | 873.5 | 8333 | 1952 | 329 |
| Pressure (kPa) | 2995 | 90 | 7400 | 2995 | 90 | 7400 |
| Temperature (°C) | 17 | 9 | 40 | 17 | 24 | 40 |
| Mole Fraction | ||||||
| Methane | - | - | - | - | - | - |
| Ethane | 0.006 | - | 0.292 | 0.012 | - | 0.292 |
| Propane | 0.001 | - | 0.050 | 0.001 | - | 0.049 |
| n-Butane | - | - | 0.037 | - | - | 0.035 |
| Carbon dioxide | 0.251 | 0.005 | 0.040 | 0.258 | 0.005 | 0.071 |
| Carbon Monoxide | 0.017 | - | 0.457 | 0.008 | - | 0.434 |
| Hydrogen | 0.720 | - | - | 0.718 | - | - |
| Water | - | - | - | - | - | - |
| Nitrogen | 0.003 | - | 0.118 | 0.003 | - | 0.112 |
| Methanol | - | 0.9950 | 0.006 | - | 0.9950 | 0.007 |
| Cost Items | LNG | GTW | GTM | |||
|---|---|---|---|---|---|---|
| Field Y | Field X | Field Y | Field X | Field Y | Field X | |
| Key Financial Indicators | ||||||
| Rate of Return of Investment (%) | 10 | 4 | 7 | 9 | 7 | 1 |
| Payback Period (yr.) | 10.24 | 25.43 | 14.25 | 11.19 | 13.85 | 98.32 |
| Net Present Value (M USD) | 210 | −568 | −164 | 31 | −114 | −498 |
Disclaimer/Publisher’s Note: The statements, opinions and data contained in all publications are solely those of the individual author(s) and contributor(s) and not of MDPI and/or the editor(s). MDPI and/or the editor(s) disclaim responsibility for any injury to people or property resulting from any ideas, methods, instructions or products referred to in the content. |
© 2023 by the authors. Licensee MDPI, Basel, Switzerland. This article is an open access article distributed under the terms and conditions of the Creative Commons Attribution (CC BY) license (https://creativecommons.org/licenses/by/4.0/).
Share and Cite
Abu, R.; Patchigolla, K.; Simms, N.; Anthony, E.J. Natural Gas Flaring Management System: A Novel Tool for Sustainable Gas Flaring Reduction in Nigeria. Appl. Sci. 2023, 13, 1866. https://doi.org/10.3390/app13031866
Abu R, Patchigolla K, Simms N, Anthony EJ. Natural Gas Flaring Management System: A Novel Tool for Sustainable Gas Flaring Reduction in Nigeria. Applied Sciences. 2023; 13(3):1866. https://doi.org/10.3390/app13031866
Chicago/Turabian StyleAbu, Robin, Kumar Patchigolla, Nigel Simms, and Edward John Anthony. 2023. "Natural Gas Flaring Management System: A Novel Tool for Sustainable Gas Flaring Reduction in Nigeria" Applied Sciences 13, no. 3: 1866. https://doi.org/10.3390/app13031866
APA StyleAbu, R., Patchigolla, K., Simms, N., & Anthony, E. J. (2023). Natural Gas Flaring Management System: A Novel Tool for Sustainable Gas Flaring Reduction in Nigeria. Applied Sciences, 13(3), 1866. https://doi.org/10.3390/app13031866