Article

Method for Prevention of Liquefaction Caused by Earthquakes Using Grouting Applicable to Existing Structures

1
Department of Civil and Environmental Engineering, Pusan National University, Busan 46241, Republic of Korea
2
Department of Architectural and Civil Engineering, Kyungil University, Gyeongsan 38428, Republic of Korea
*
Author to whom correspondence should be addressed.
Appl. Sci. 2023, 13(3), 1871; https://doi.org/10.3390/app13031871
Submission received: 12 October 2022 / Revised: 28 December 2022 / Accepted: 28 December 2022 / Published: 31 January 2023

Abstract

:
Ground liquefaction is causing great damage to the structure of land during earthquakes. Accordingly, various liquefaction damage reduction methods have been studied and developed. However, most of the ground liquefaction prevention methods have limitations in their application to existing structures. Therefore, in this study, a ground liquefaction damage reduction method, applicable to existing structures, was studied using the grouting method. A 1-G shaking table test was performed, and the ground was created with Jumunjin standard sand. A two-story model structure was manufactured by applying the similarity law, and an input wave applied a sinusoidal motion with an acceleration level of 0.6 g and a frequency of 10 Hz. The grouting chemical was produced by mixing water and cement, and the effect of reducing structural damage was analyzed according to various mixing ratios; in addition, the separation distance between the grouting chemical injection point and the structure was analyzed. As a result of the analysis, when the ground was reinforced by applying the grouting method, the settlement of the structure was about 84% smaller than when the ground was not reinforced, and the mixing ratio with the smallest settlement was 0.45. In addition, when there was no separation distance between the structure and the grouting chemical injection point, it was confirmed that the effect of reducing structural damage was the greatest. These research results will be used as basic data for developing a grouting method applicable to existing structures in the future.

1. Introduction

Researchers are increasingly interested in earthquakes as the number of earthquakes increases annually worldwide [1]. Earthquakes cause various forms of damage, such as landslides, tsunamis, and ground liquefaction, which can cause physical damage, such as paralysis of public infrastructure, destruction of facilities, and human casualties. In the case of ground liquefaction, both primary damage caused by the earthquake and secondary damage caused after the earthquake are serious, and damage prevention and reinforcement are important. The major earthquakes that caused liquefaction include the Nikata (Japan, 1964), Kobe (1995), Northridge (2011), and Rome Prieta (1989) earthquakes. Interest in liquefaction is also increasing in Korea, where liquefaction was observed for the first time in 2017. Many studies have already been conducted on liquefaction globally. In the case of the United States and Japan, research on liquefaction has been conducted to research and develop prevention methods. Many studies have been conducted on the prevention of liquefaction, which leads to ground improvements.
A study by H.B. Seed and I.M. Idriss (1970) describes a simplified procedure for evaluating the liquefaction potential, and compares the results obtained by the method to several cases in which liquefaction has or has not occurred in the field [2]. Mejia and Boulenger (1995) studied the effect of the firm grouting method on liquefaction ground reinforcement and reported that this method is effective in improving the ground [3]. Andrus and Chung (1995) studied a ground improvement method to prevent liquefaction near existing structures [4]. Hausler and Sitar (2002) studied the behavior of improved and unimproved ground on liquefaction phenomena during earthquakes [5]. In addition, Hausler (2002) studied the effect of ground improvement on ground settlement and liquefaction, based on field cases and centrifuge experiments, and suggested that it effectively improves ground strength and prevents ground deformation in the case of liquefaction [6]. Kawamura (2004) studied the effect of the penetration grouting method on liquefaction; they presented the results of a country in which penetration grouting is different from the existing grouting method, and is also effective in strengthening the ground and preventing liquefaction [7]. Yasuda (2007) studied the anti-liquefaction methods applicable to existing structures, categorized by method, and reported the reinforcement of the foundation of existing structures by various methods, such as the sheet file, micro file, and grouting methods [8]. Caballero (2008) conducted a numerical analysis of the effect of liquefaction during earthquakes and reported that ground reinforcement is necessary to prevent liquefaction damage [9]. Sitar (2012) studied the effect of ground improvement on ground subsidence when liquefaction occurs [10], and Rasouli (2015) studied the ability of ground improvement to reduce ground shear resistance and liquefaction damage [11]. Bray et al. (2016) studied the ground behavior during liquefaction through case analysis, field verification, and numerical analysis, as well as the need for a countermeasure method [12]. Rasouli (2016) studied the effectiveness of the type and time of grouting injection in preventing liquefaction, using penetration grouting to reinforce the ground by controlling the shape and time of the grouting injection [13]. Park (2017) studied the injection effect of penetration grouting using penetration packers, and suggested that if PC packers and penetration grouting are always applied to high-level ground, such as reservoirs, penetration effects can be achieved that meet the performance standards of reservoir order grouting. In recent years, research has been conducted on ground improvement and liquefaction prevention methods that use grouting [14]. Yasuyuki (2020) studied penetration grouting, using ultrafine particle cement on sandy soil ground, as well as the stabilization of ultrafine particle cement by injecting it into the ground [15]. Duan (2021) studied the effect of the relative density and confining pressure of the ground on cyclic stress or liquefaction, through the GMDH method; they used the database obtained through CPT and presented a state parameter [16]. Hasheminezhad (2022) studied the effect of drainage agents, such as gravel and rubber, on the liquefaction of sandy soil during an earthquake through a 1-G Shaking table test [17].
Kobayashi (2009) studied the reinforcement effect of liquefied ground, when applying penetration grouting, using a 1-g shaking table; for comparison, the experiment was divided into reinforced and not reinforced ground. The results showed that when the ground was reinforced through penetration grouting, the ground acceleration, excess clearance water pressure, and structure subsidence decreased, which was very effective in suppressing liquefaction [18].
Mitrani (2010) attempted to suppress the sinking of a structure due to liquefaction by solidifying existing structures with a chemical solution using a centrifuge experiment. If the depth of solidification was greater than that of a liquefaction-prone layer, ground reinforcement did not significantly affect acceleration [19].
Sitar (2012) studied the effect of ground improvement on subsidence to prevent liquefaction by conducting case analyses and centrifuge experiments. In a case study of approximately 100 areas, areas where the ground was improved to prevent liquefaction had less subsidence than areas where it was not. In addition, the results of the centrifuge experiments were based on data from the ground improvement area. If the ground acceleration was small, it was most effective to improve up to 70% of the total ground, whereas if the ground acceleration was large, the entire ground should potentially be improved [10].
Weihong (2016) studied a method for efficiently assisting penetration grouting using ultrafine cement; this method is applicable to the foundation of existing structures with a high possibility of liquefaction. Although the amount of cement was small, injecting cement alternately with water resulted in longer solidification and penetration, depending on the sample [20].
Erminio (2020) presented the low pressure injection effect and applicability of colloidal nanosilica chemicals for liquefaction by conducting various studies on particle size, shear strength, viscosity, and shear wave velocity on the reinforcing materials; this was to ensure the economic feasibility and safety of developing ground reinforcement materials such as colloidal nanosilica [21].
Arpit (2021) conducted a study on the presence or absence of ground reinforcement by creating a loose ground with a relative density of 35% and a dense ground with a relative density of 65%; this was to check the liquefaction prevention effect of cement grouting [22].
Ciardi (2021) conducted a study on the effect of colloidal silica grouting chemicals on the ground properties of liquefied ground; they reviewed the compressibility, ground strength, and rigidity of the ground under static and seismic load conditions. Based on these results, the points to be pursued in future research on colloidal silica grouting were discussed [23].
Nabeshima (2021) studied the penetration of grouting chemicals made of ultrafine cement into dry and saturated sand; they found that, in both cases, these chemicals had high permeability to the sand in a wide area and stabilized the ground [24].
Most previous studies have shown that reinforcing the ground through grouting prevents liquefaction damage to the ground and structures in the event of an earthquake, and is sufficiently applicable to existing structures.
In this study, the viscosity of the grouting chemical was changed by varying the mixing ratio of cement and water through the 1-g shaking table, and the effect of liquefaction prevention was determined based on the gap between the grouting chemical injection point and the foundation. The ground was composed using the Jumunjin standard history and divided into a non-liquefaction and a liquefaction layer. To analyze the anti-liquefaction effect of grouting chemicals on structural settlement, we used five types of grouting chemicals (mixing ratios of 0.4, 0.45, 0.475, 0.5 and 0.55) of different cement weights (see Section 3.1). In addition, we analyzed the effect of the separation distance between the grouting injection point and the existing structure on structural subsidence.

2. Materials and Methods

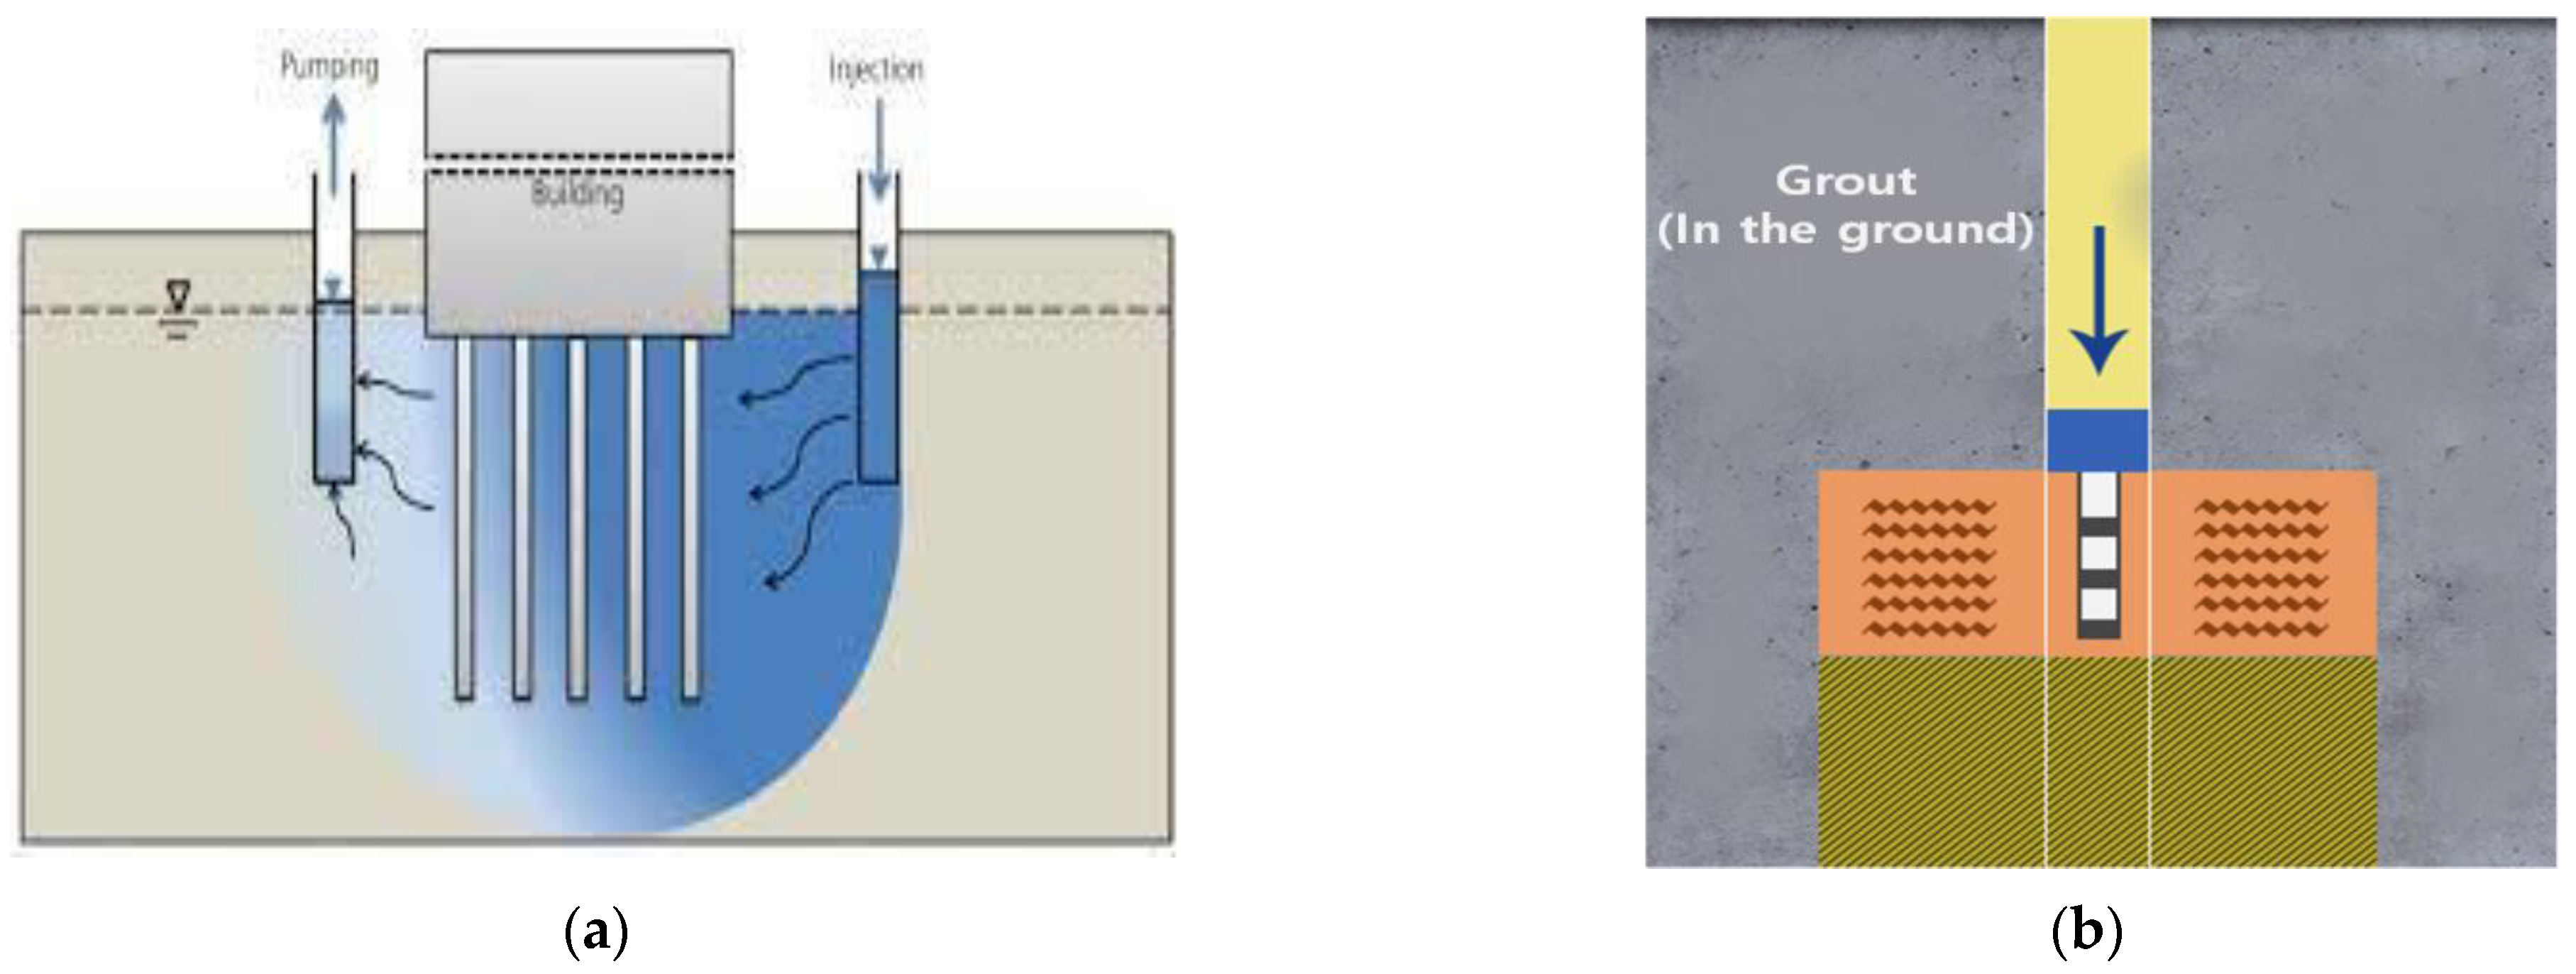
2.1. Penetration Grouting

Penetration grouting is a method of increasing ground strength and suppressing damage to the ground and structures in the case of an earthquake; this is achieved by inserting a grouting agent into the ground at low pressure, in contrast to conventional grouting injection. In a general grouting method, a high-pressure spraying device is required to inject the grouting agent into the ground; however, the high-pressure spraying device is large, and large equipment cannot be easily used around an existing concentrated structure. To overcome these limitations, many studies have been conducted on penetration grouting, which enables penetration into the ground even at low pressures. Accordingly, various grouting agents have been developed, including colloidal silica, micro silica, and a space grouting rocket system (Figure 1).

2.2. Preparation

2.2.1. Vibration Testing Table

The vibration testing table used in this study consisted of an actuator and a steel frame, capable of applying a force of up to 500 kg; a dynamic load could be applied in the axial direction. The model soil was rigid soil made of acrylic, and the size of the acrylic was W 800 × D 400 × H 700 mm. Unlike ductile soil, rigid soil has a phase difference problem under boundary conditions (Ryu et al., 2011); thus, a 5 cm thick buffer was installed on each side of the rigid soil to absorb input waves at the side boundary.

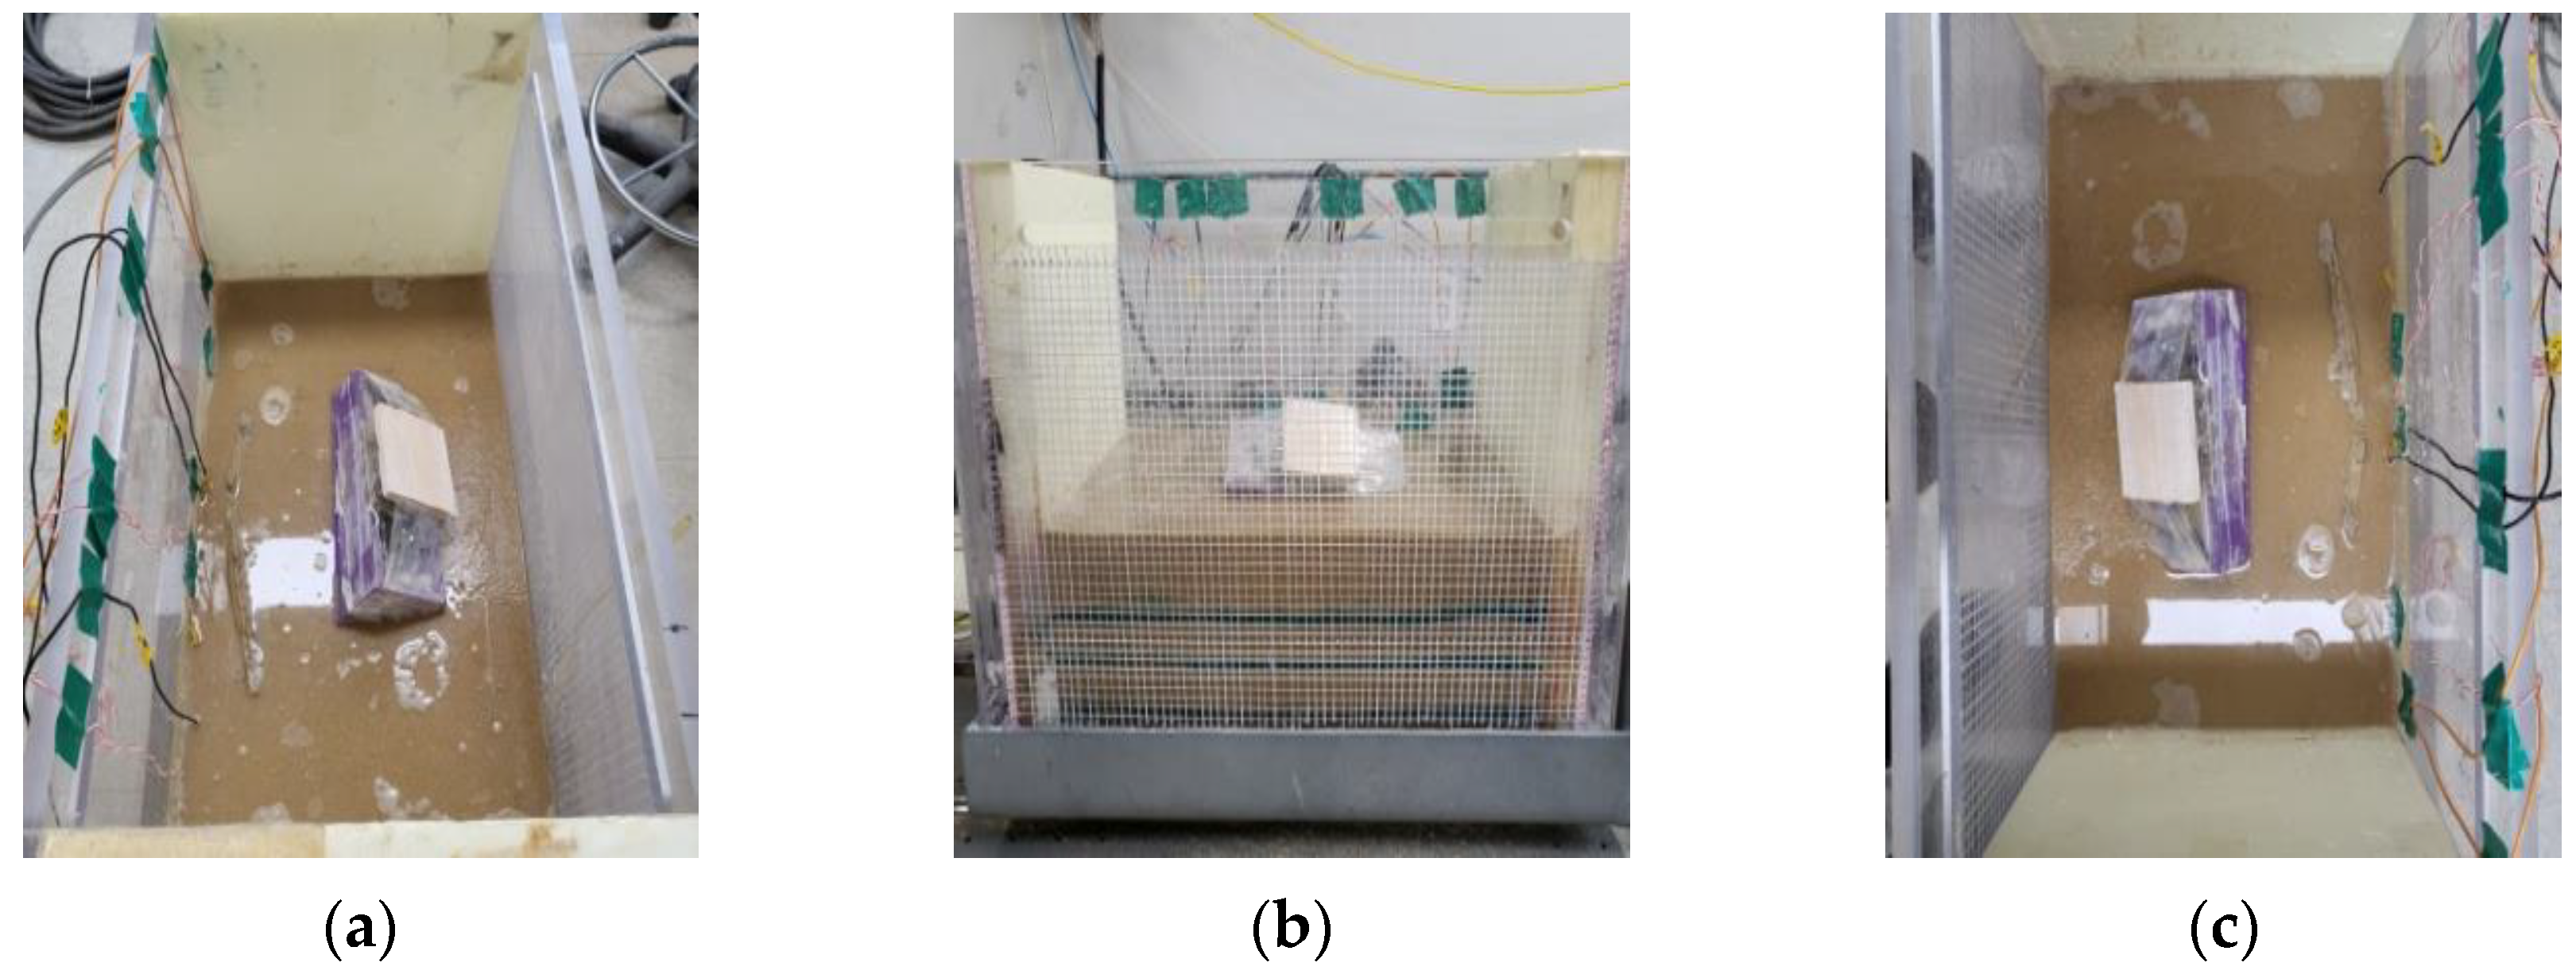
2.2.2. Ground Construction and Installation of Instrumentation Sensor

The Jumunjin standard yarn was used to prepare the ground, and the grain size distribution curve is shown in Figure 2. The physical properties of the Jumunjin standard are summarized in Table 1. For the ground composition, we used a dry and an underwater falling method, in which sand is scattered at a certain height and in the water, respectively; a non-liquefied and a liquefied layer were separated. The non-liquefied layer was formed with a relative density of 85% via the dry falling method, and with a thickness of 5 cm and 3 cm on the top of the earth’s bottom surface and the ground, respectively. The liquefied layer was formed with a total thickness of 15 cm by forming the first layer with a relative density of 45% via the underwater falling method, and the ground was formed to properly saturate the soil. An experiment was performed after 24 h. An accelerometer, a pore water pressure meter, and a linear variable differential transformer (LVDT) were installed to measure the acceleration, change in pore water pressure, and displacement in the ground, respectively (Figure 3). To prepare the grouting chemical, ultrafast light cement was used, based on the similarity law for the curing time of the grouting chemical, and 1000 g of water was used.

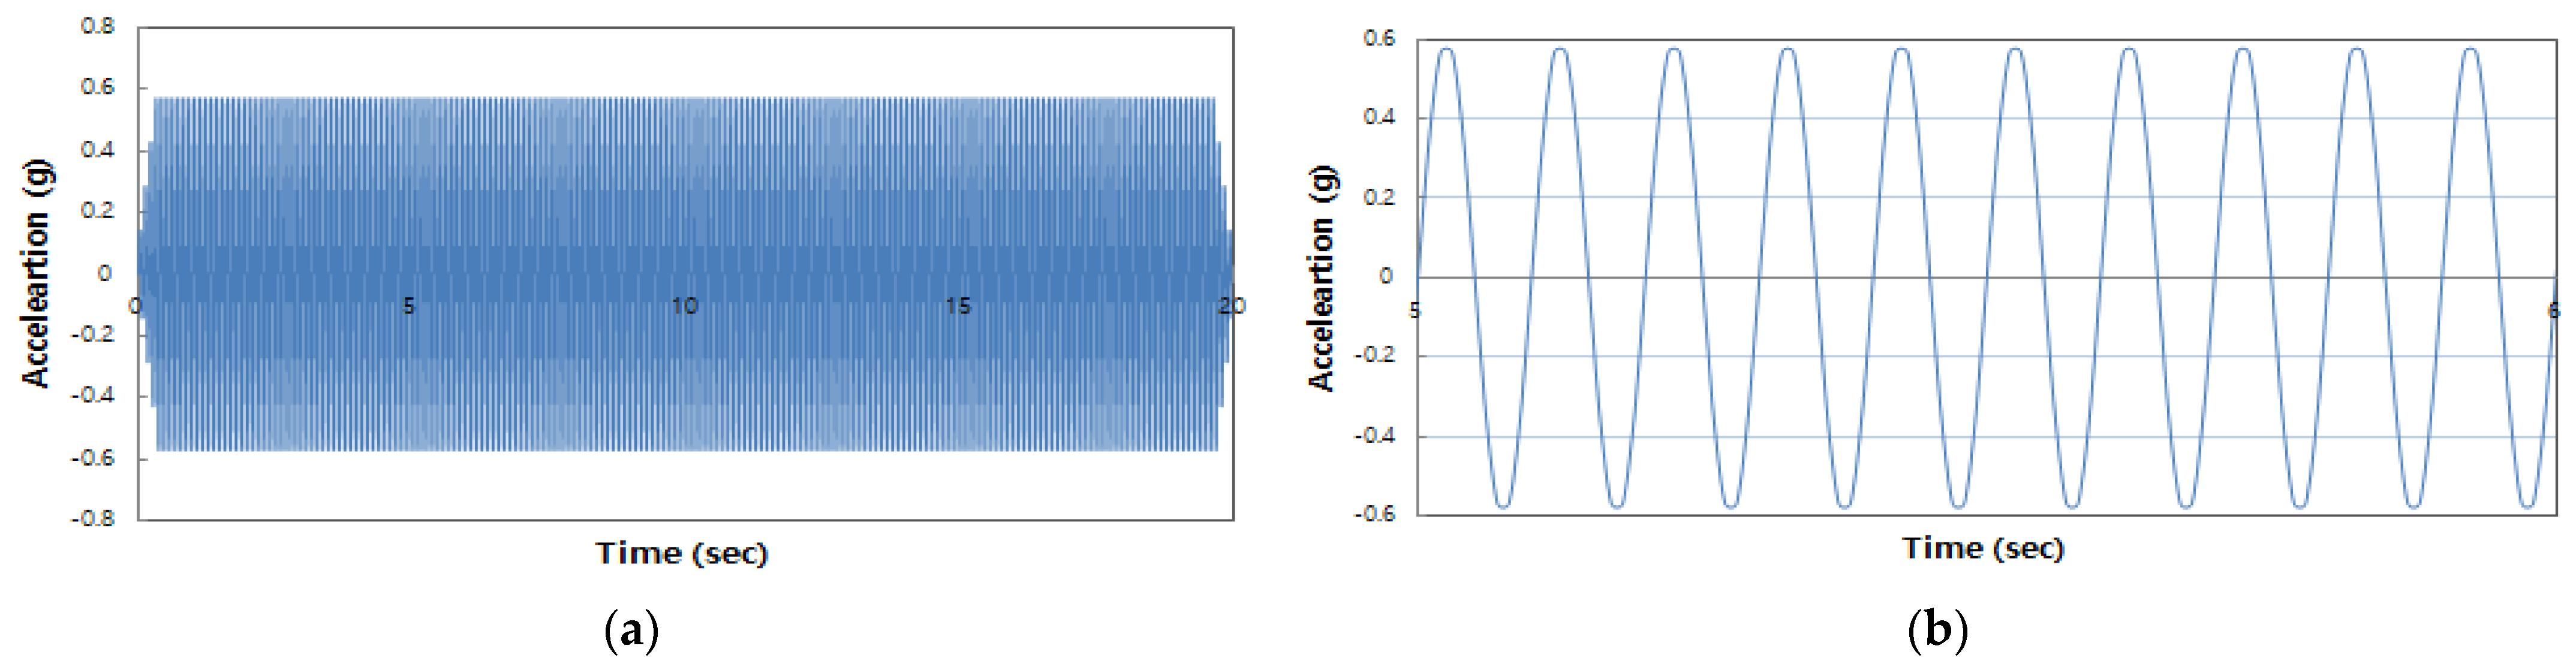
2.2.3. Input Earthquake Wave and Experimental Program

For the input seismic waves, an acceleration of 0.6 g and frequency of 10 Hz were selected to perform a vibration band experiment. The presented seismic wave is an input seismic wave applied to cause liquefaction on the ground, and the input acceleration and frequency are the same for both non-reinforcement and reinforcement of the ground (Table 2). The occurrence of liquefaction was determined by synthesizing the change in the level of the model’s ground, depending on the performance of the experiment, structural subsidence, ground behavior, and pore water pressure ratio. Figure 4 shows the typical input seismic waves applied in the experiment.

2.2.4. Model Experiment Similarity Ratio

Iai (1989) proposed a similitude law applicable to the 1-G shaking table test using equilibrium equations, compositional laws, and displacement–strain relationships for soil–fluid–structure systems. This law is divided into Types 1, 2, and 3. Type 1 cannot be applied because there is a limit to implementing the mass of the circular model equally, by making the mass equal to the circular and reducing the remaining elements. In the case of Type 2, the effect of gravity cannot be ignored when evaluating the seismic performance of the reduced model because the time is set to the basic dimension and the remaining elements are reduced. In Type 3, the mass and time can be numerically processed by controlling the input acceleration applied by the load. Types 1 and 2 can be applied when the ground deformation is a repetitive flow behavior that occurs only when a vibration load is applied; however, Type 3 can be applied to the deformation rate softening behavior, where soil deformation continues after vibration stops. Therefore, in this study, Type 3 of Iai’s similitude law was applied because it is possible to adjust the load input acceleration, the model ground is loose, and deformation continues to occur even after the vibration is stopped (Table 3). The circle was targeted at a two-story structure located in Busan with a width of 12 m and a width of 7 m. The experimental model was reduced to 1/50th of the size of the circle. The model structure was made of acrylic boxes with a length of 250 mm and a width of 100 mm, and the height of the model structure was 100 mm. Furthermore, it weighed 8 kg and had a surface pressure of 3.136 kPa.

3. Results and Discussion

The values derived in this study were converted into circular reference result values and are presented in the result analysis.

3.1. Cement Water Mixing Ratio and Separation Distance

In this study, it was important to prepare a chemical solution that has a lower viscosity than existing chemical solutions, so that it could naturally penetrate the ground like water. Accordingly, we tested the ratio of the weight of the cement powder to 1000 g of water, and expressed it as a mixing ratio of constant water weight to cement powder. In addition, we tested the liquefaction reinforcement effect, based on the presence or absence of a gap between the grouting chemical injection point and the model structure. When the grouting chemical is injected, there is a large difference in the amount of settlement in the model structure, according to the interval between the grouting chemical injection point and the model structure. Therefore, the interval between the grouting chemical injection point and the model structure is an important part of this study. The interval between the grouting chemical injection point and model structure is expressed as the separation distance (Figure 5).

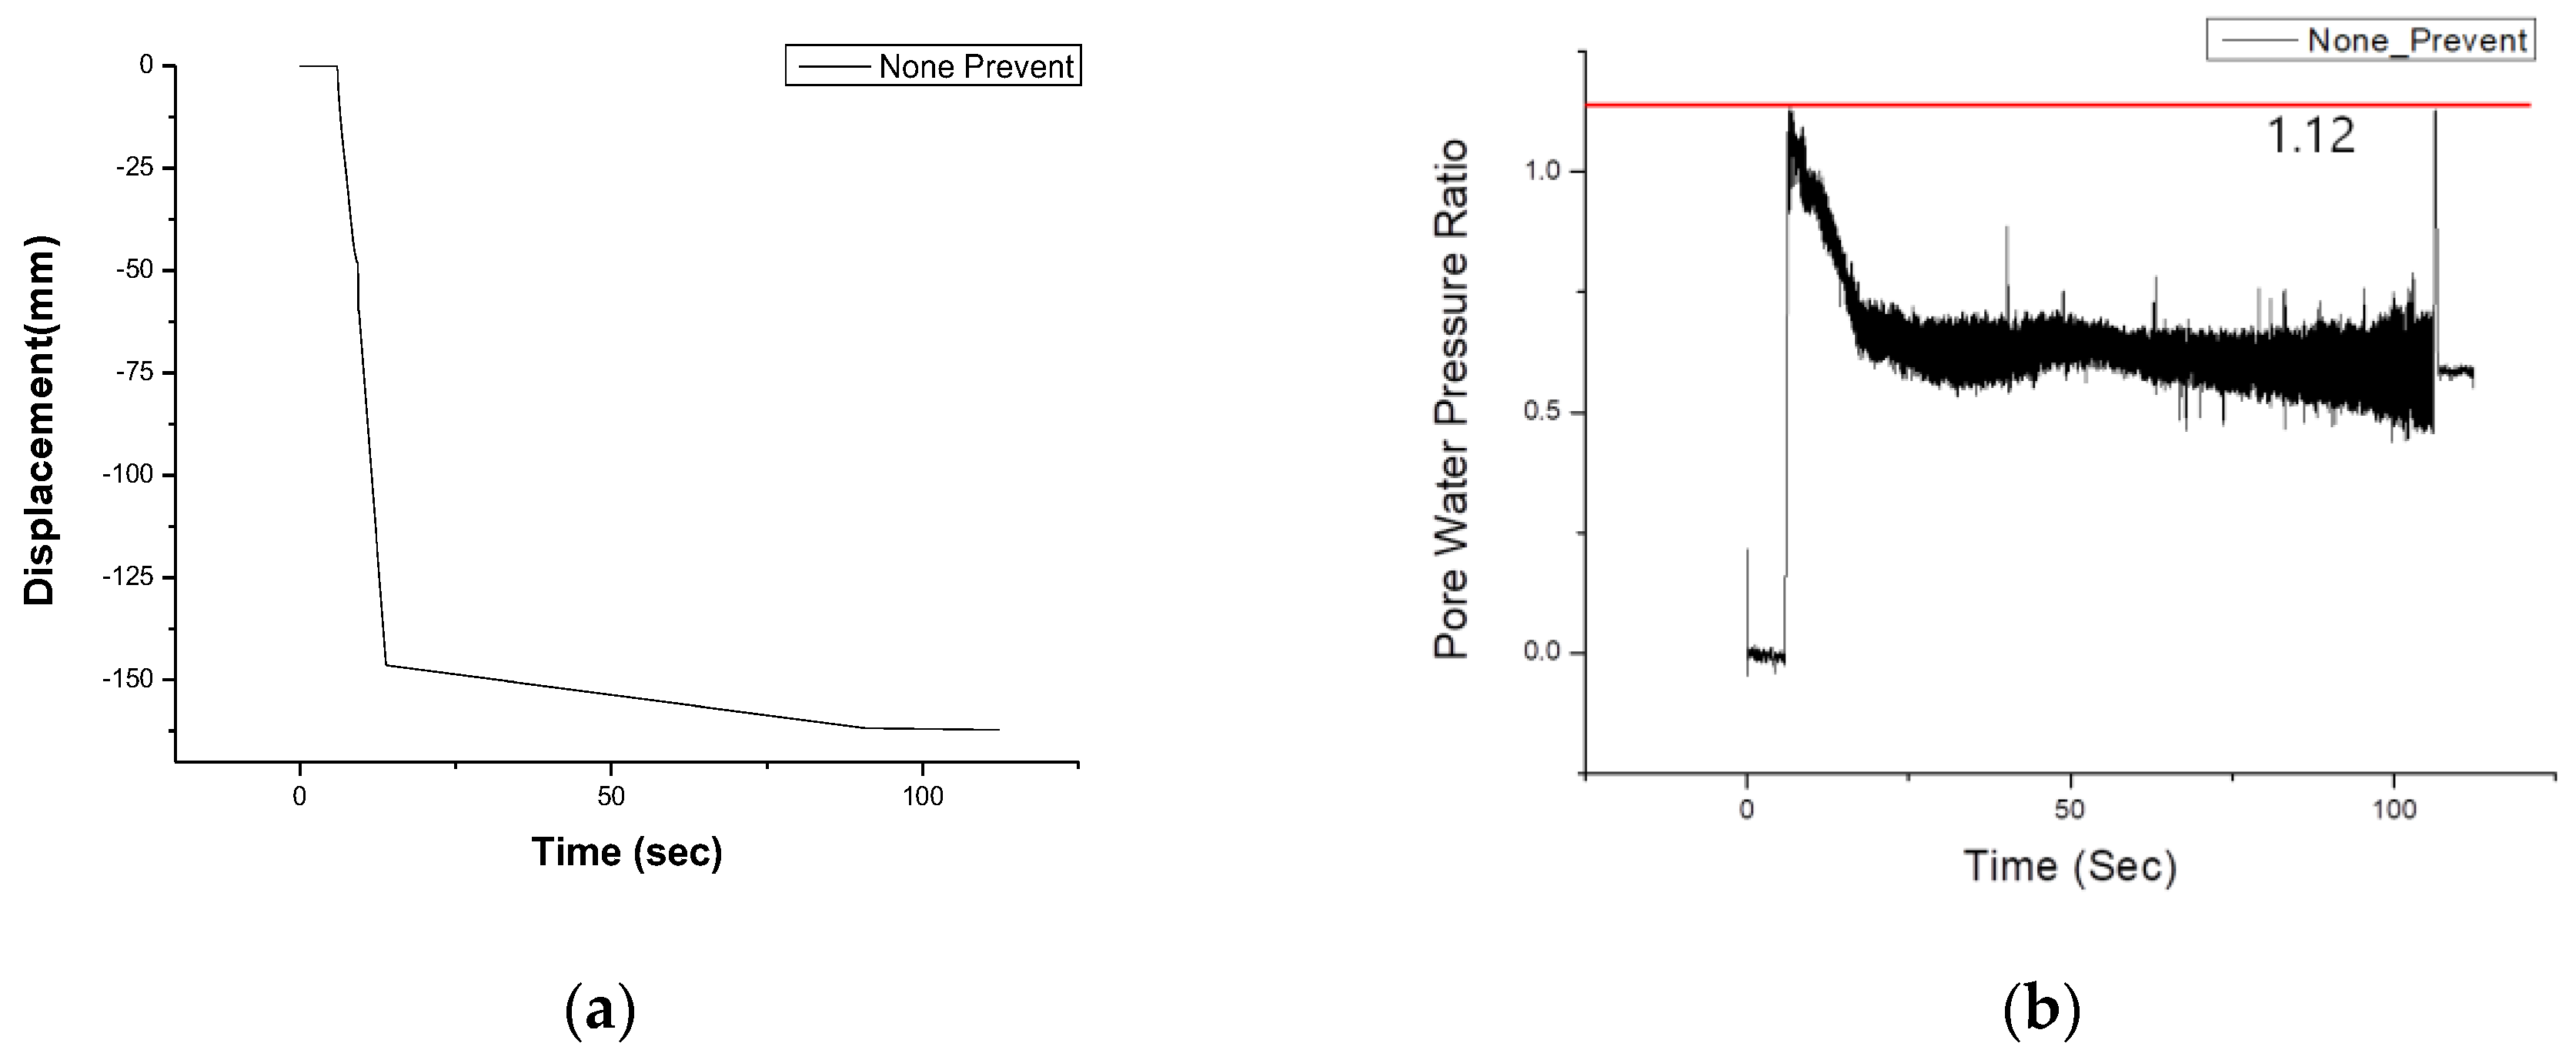
3.2. Settlement and Pore Water Pressure

The settlement amount of the model structure was analyzed using the value measured through the LVDT, installed in the center of the model structure; in the case of the pore water pressure, the value measured through the PWP1 sensor, installed closest to the base surface of the model structure, was analyzed. In both the non-reinforcing and reinforcing experiments, the results were analyzed using the LVDT and pore water pressure measurement values at the same location.

3.3. Non-Reinforcement

A vibration table test was performed on non-reinforced ground. Rapid subsidence occurred between 5 and 6 s, and the final subsidence amount of the circular reference structure was 8.5 m. When subsidence occurred rapidly, the pore water pressure also increased rapidly. The pore water pressure ratio (ru) was 1.11, and ground liquefaction occurred (Figure 6).

3.4. Reinforcement

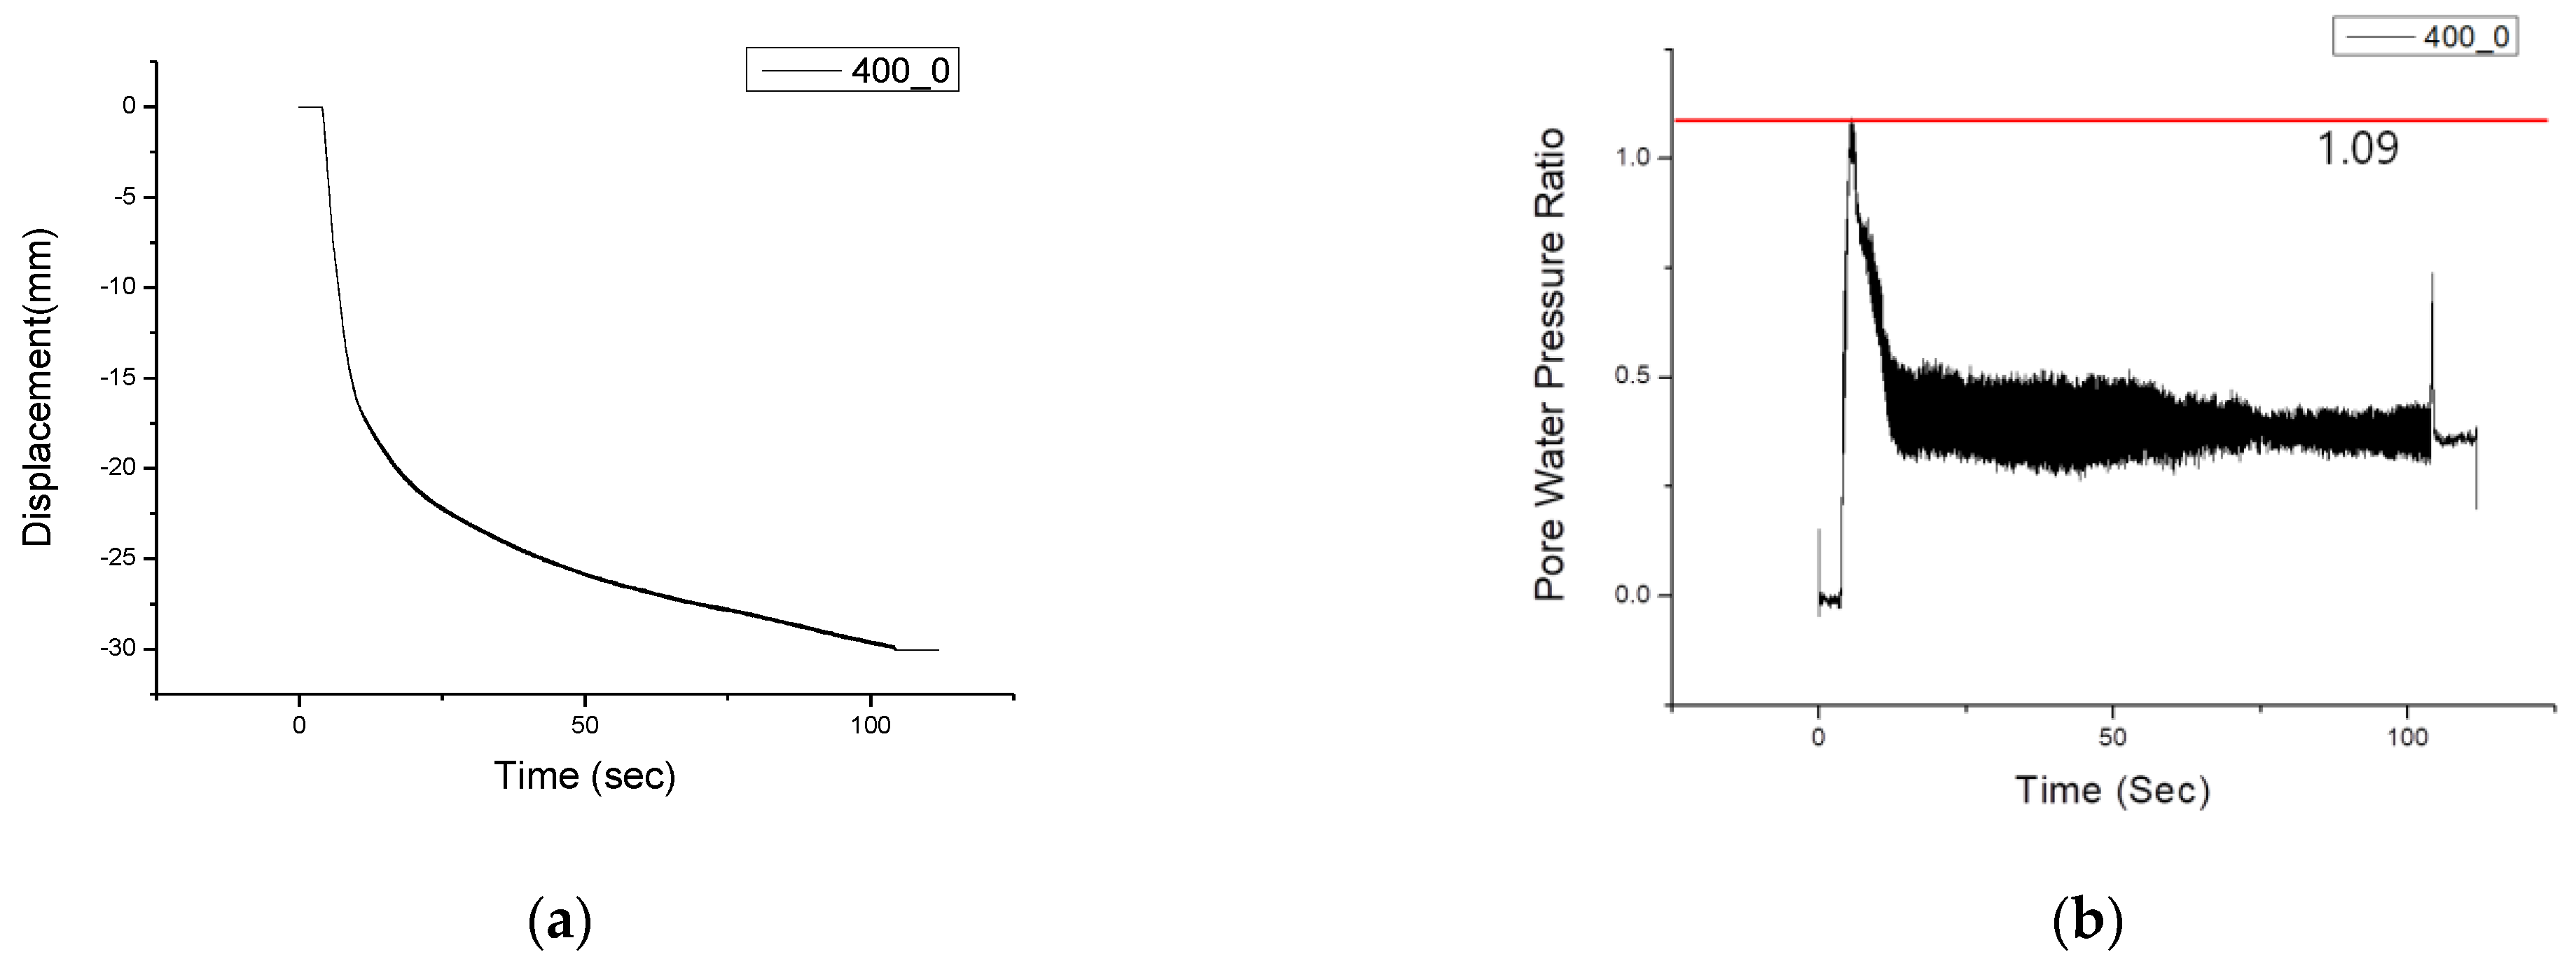
3.4.1. Mixing Ratio 0.4—Separation Distance 0 cm

A vibration table test was performed with a grouting mixing ratio of 0.40 and a separation distance of 0 cm. Rapid subsidence occurred between 5 and 6 s, and the final subsidence amount of the structure was 1.65 m on a circular basis. When subsidence occurred rapidly, the pore water pressure also increased sharply, and the ru measurement was 1.09, indicating that ground liquefaction had occurred (Figure 7 and Figure 8).

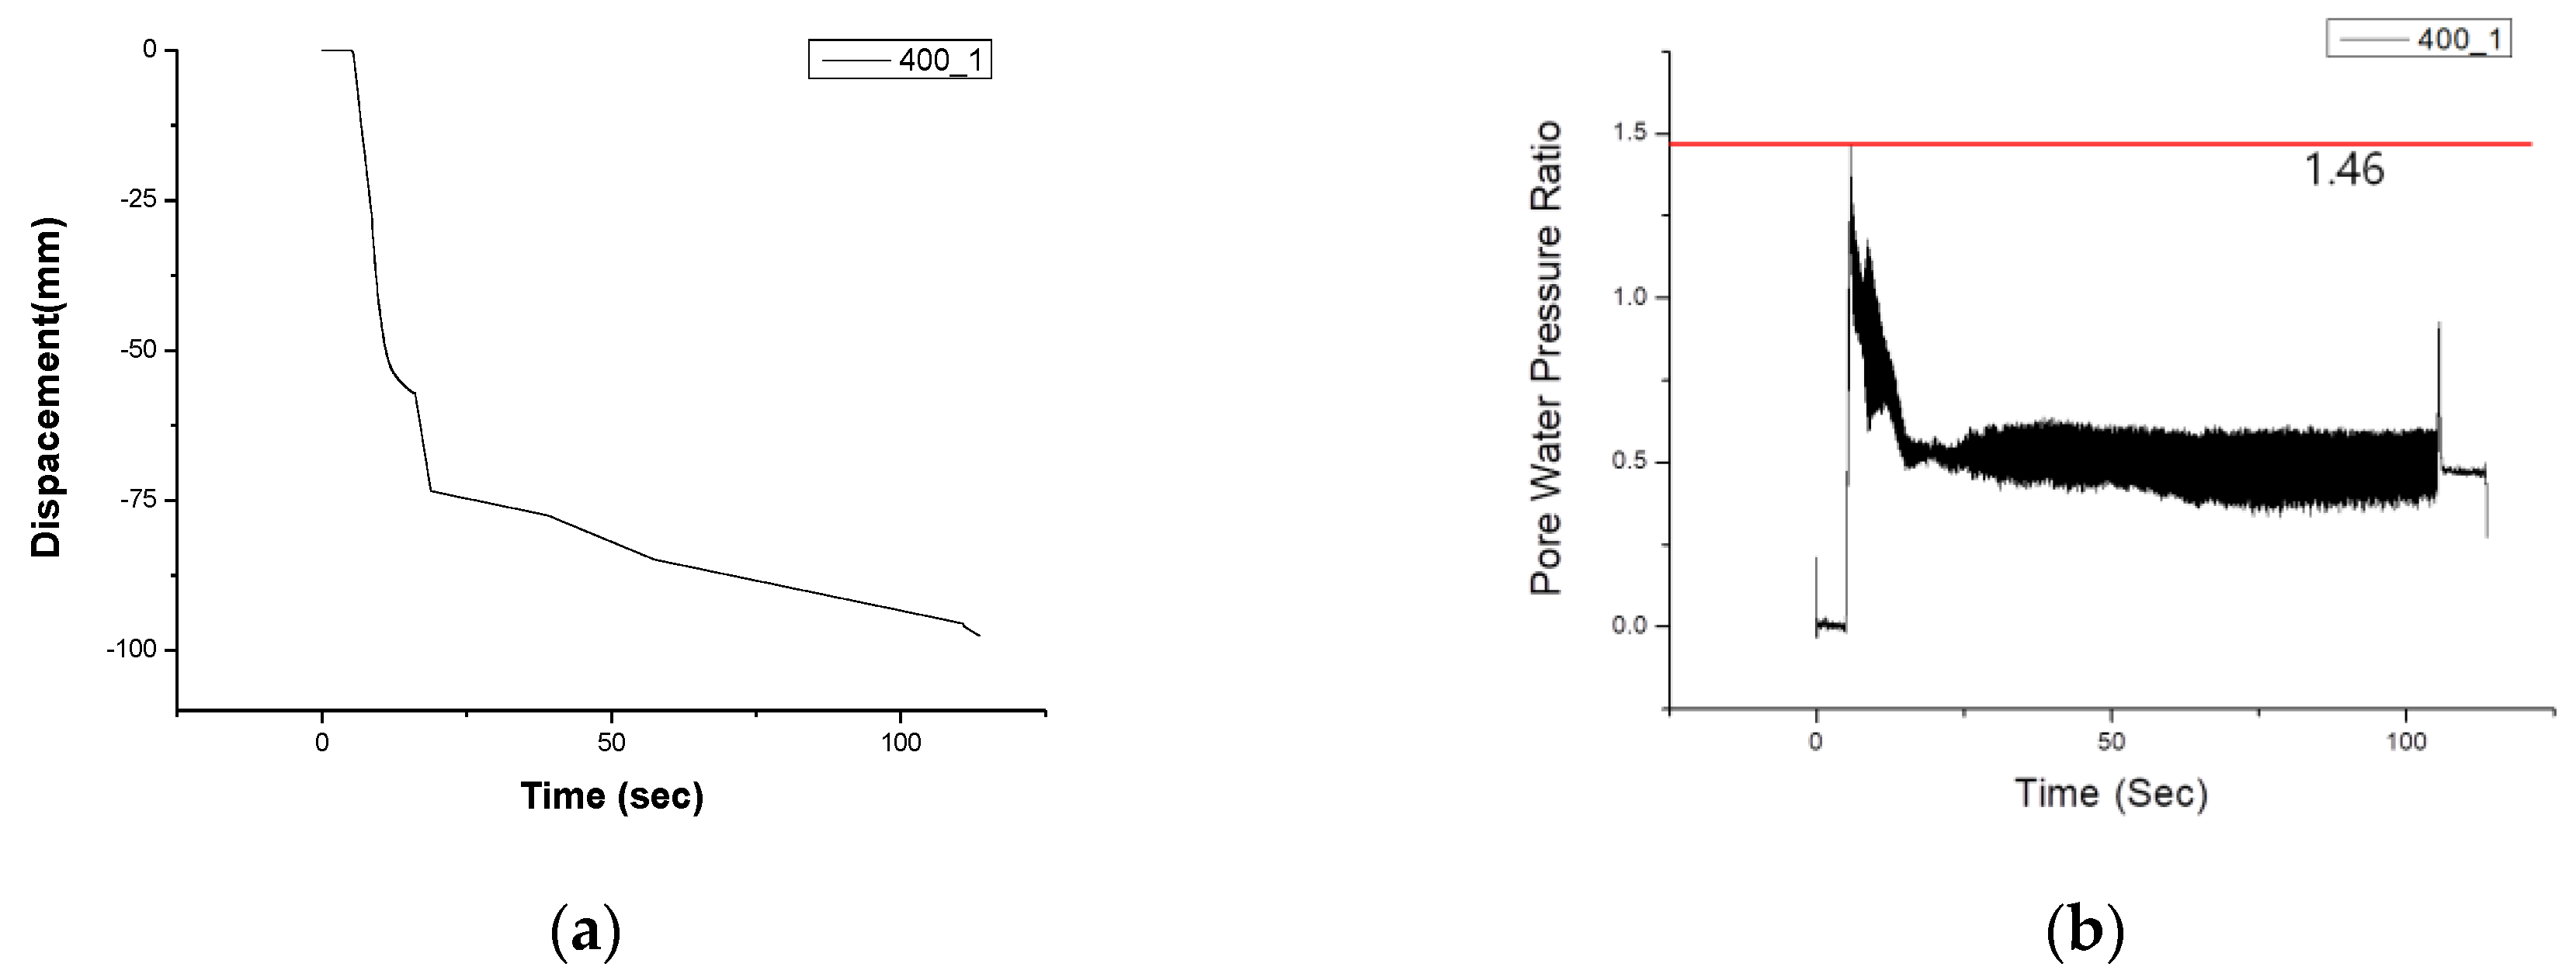
3.4.2. Mixing Ratio 0.4—Separation Distance 1 cm

A vibration table test was performed with a grouting mixing ratio of 0.40 and a separation distance of 1 cm. Rapid subsidence occurred between 5 and 6 s, and the final subsidence amount of the structure was 4.9 m on a circular basis. When subsidence occurred rapidly, the pore water pressure also increased sharply, and the ru measurement, based on the pore water pressure, showed that liquefaction occurred at 1.46 (Figure 9 and Figure 10).

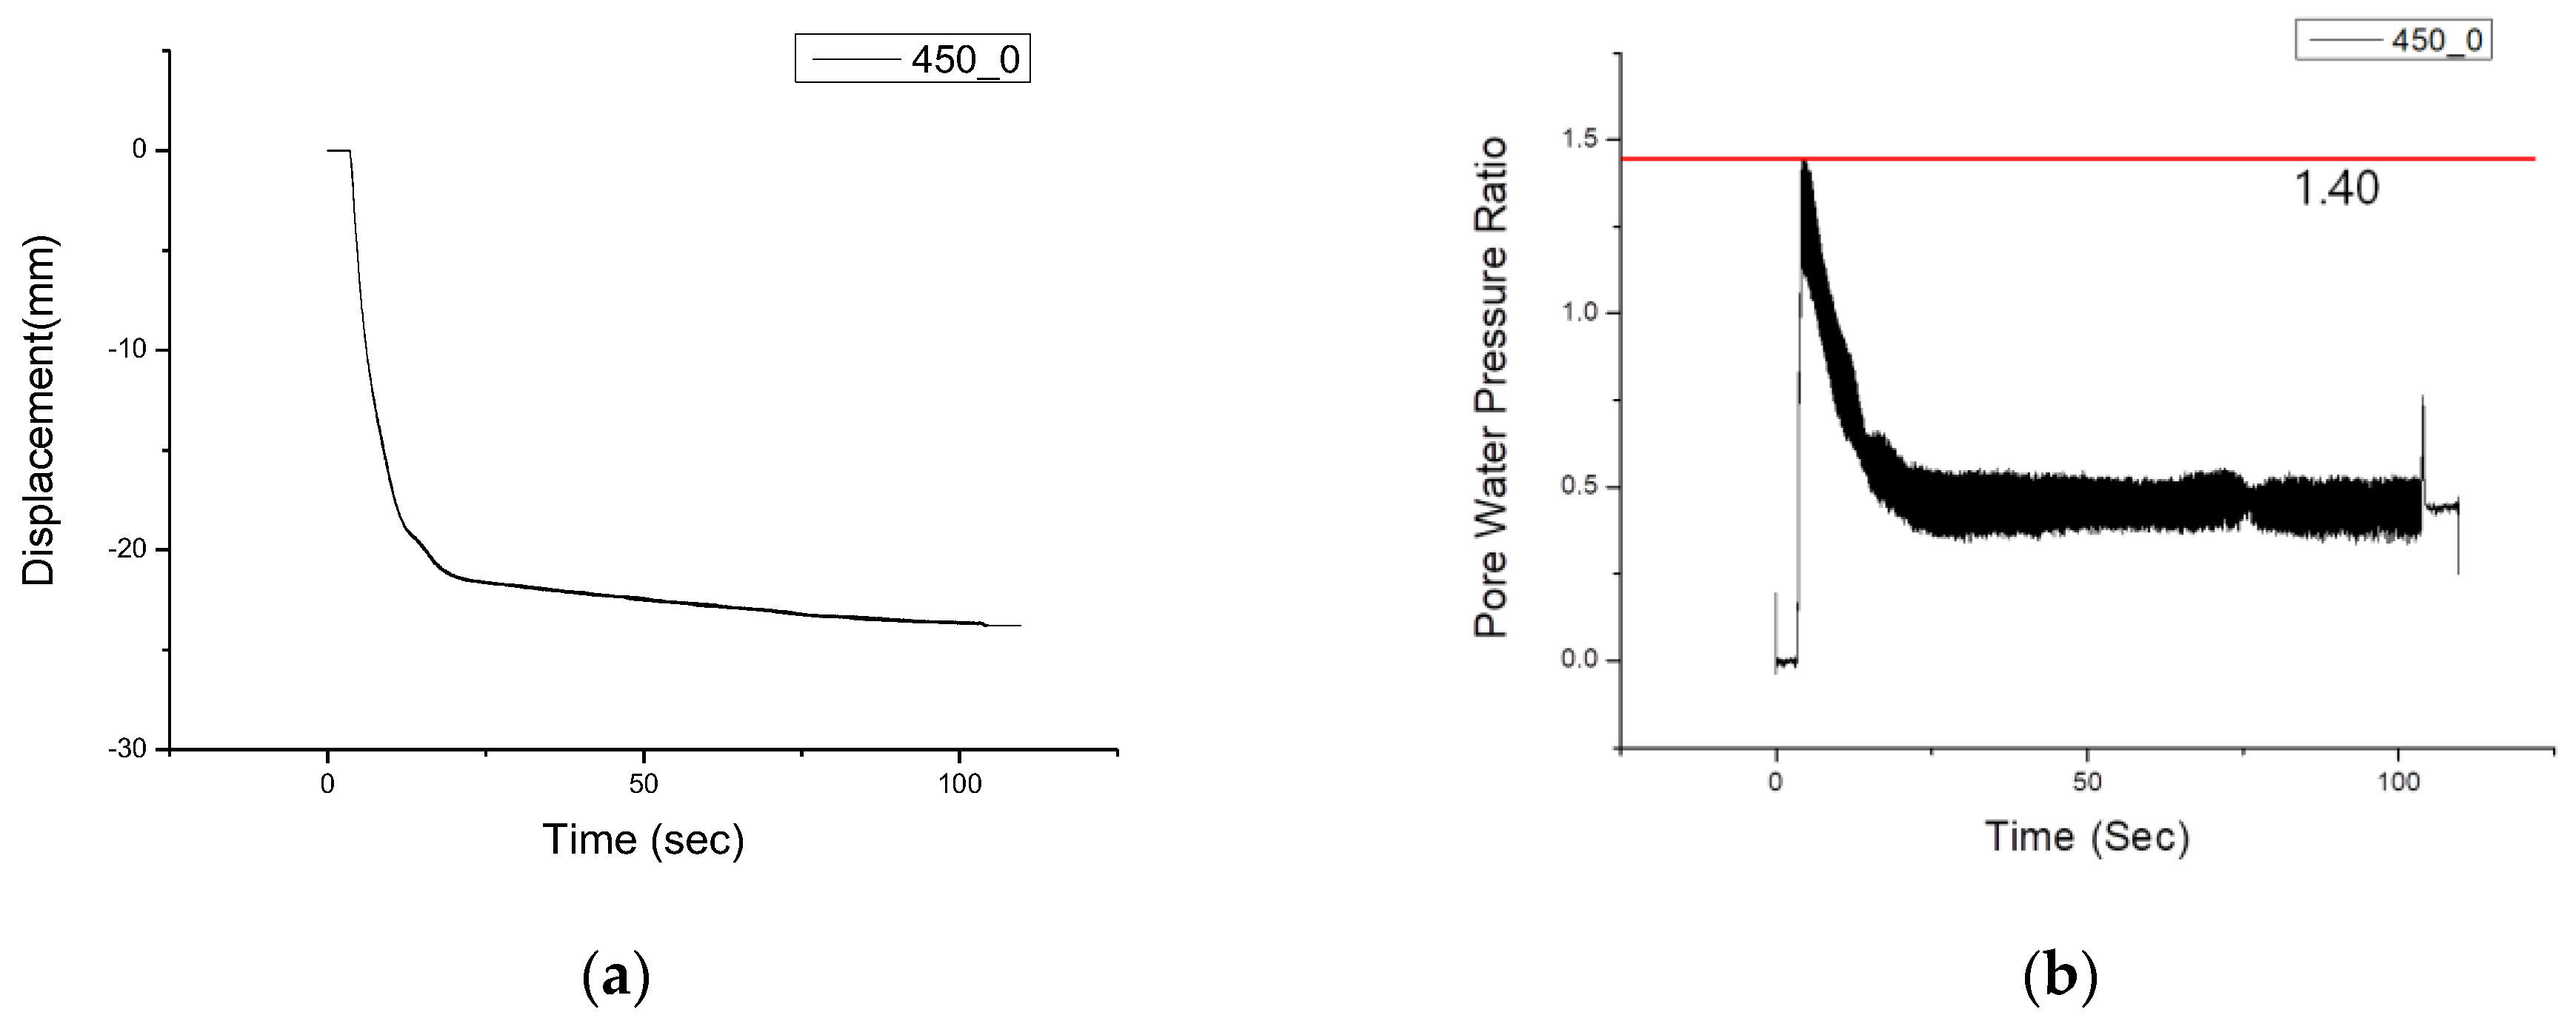
3.4.3. Mixing Ratio 0.45—Separation Distance 0 cm

A vibration band test was performed with a grouting mixing ratio of 0.45 and a separation distance of 0.0. Rapid subsidence occurred between 5 and 6 s, and the final subsidence amount of the structure was 1.15 m on a circular basis. When subsidence occurred rapidly, the pore water pressure also increased rapidly, and the ru measurement, based on the pore water pressure, showed that liquefaction occurred at 1.40 (Figure 11).

3.4.4. Mixing Ratio 0.475—Separation Distance 0 cm

A vibration table test was performed with a grouting mixing ratio of 0.475 and a separation distance of 0.0. Rapid subsidence occurred between 11 and 12 s, and the final subsidence amount of the structure was 1.3 m on a circular basis. When subsidence occurred rapidly, the pore water pressure also increased rapidly, and the ru measurement, based on the pore water pressure, showed that liquefaction occurred at 1.69 (Figure 12).

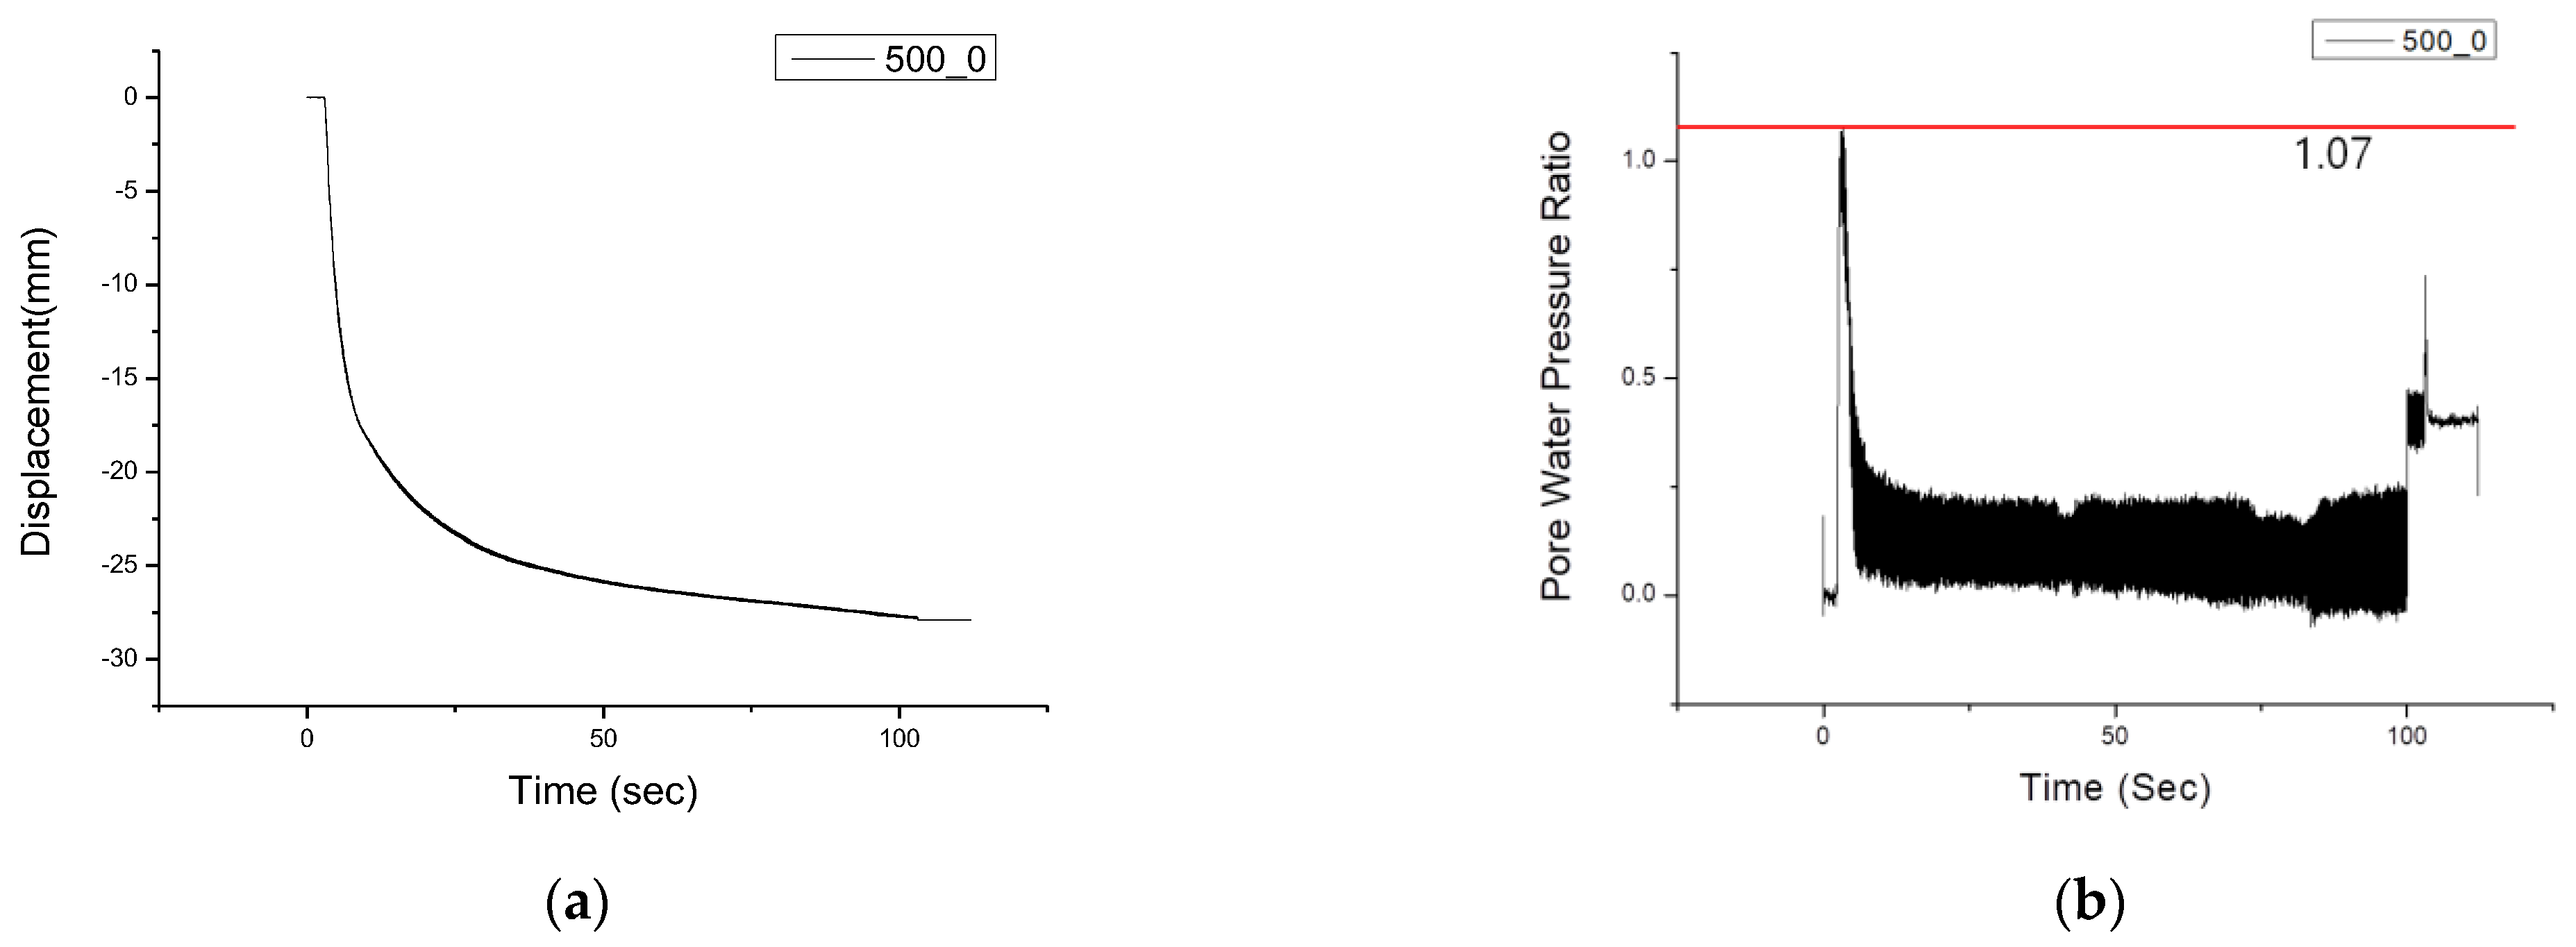
3.4.5. Mixing Ratio 0.5—Separation Distance 0 cm

A vibration band test was performed with a grouting mixing ratio of 0.50 and a separation distance of 0.0. Rapid subsidence occurred between 5 and 6 s, and the final subsidence amount of the structure was 1.5 m on a circular basis. When subsidence occurred rapidly, the pore water pressure also increased rapidly, and the ru measurement, based on the pore water pressure, showed that liquefaction occurred at 1.07 (Figure 13).

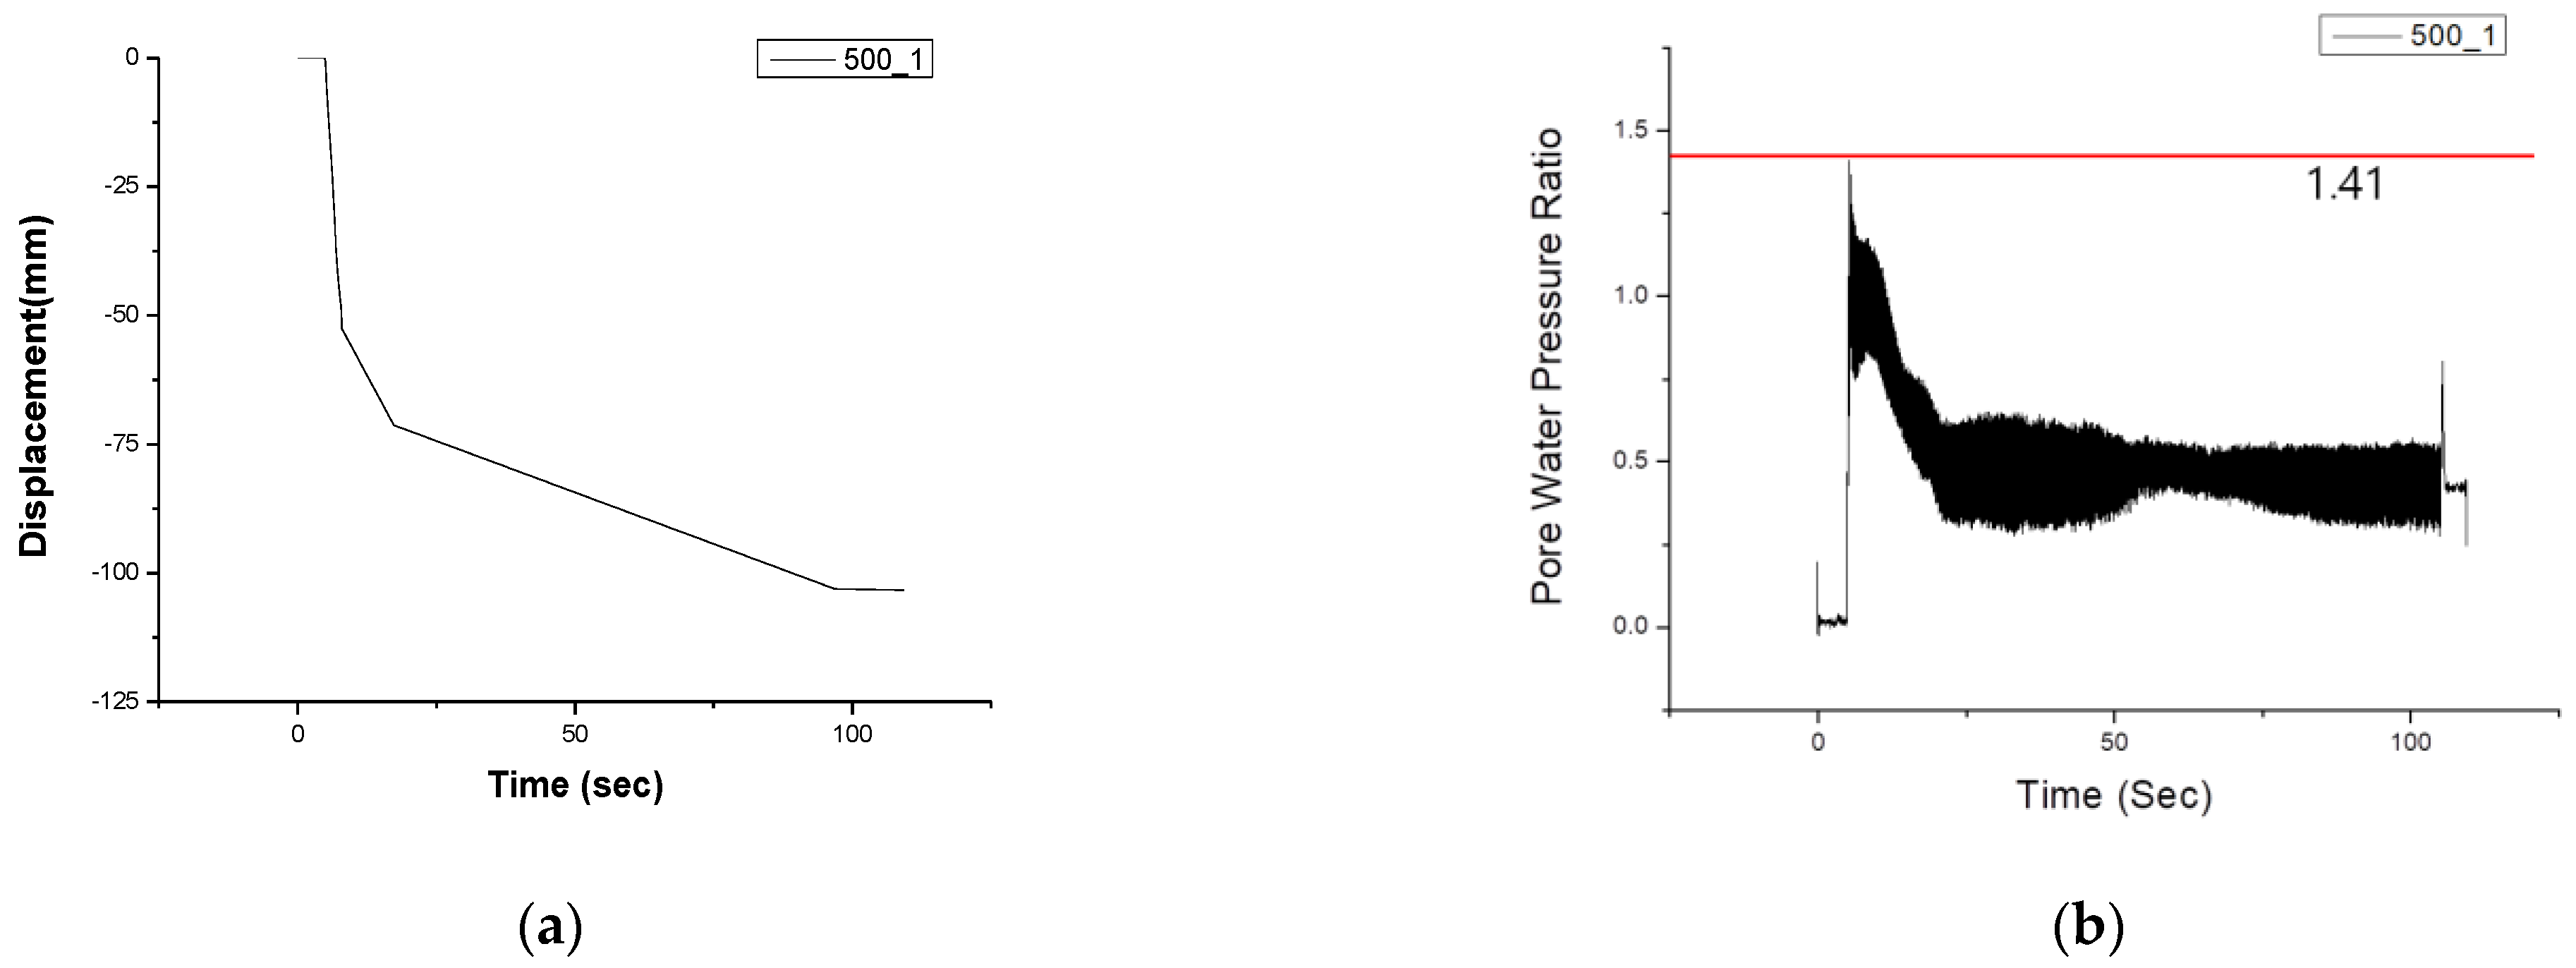
3.4.6. Mixing Ratio 0.5—Separation Distance 1 cm

A vibration table test was performed with a grouting mixing ratio of 0.50 and a separation distance of 1 cm. Rapid subsidence occurred between 5 and 6 s, and the final subsidence amount of the structure was 5.2 m on a circular basis. When subsidence occurred rapidly, the pore water pressure also increased rapidly, and the ru measurement, based on the pore water pressure, showed that liquefaction occurred at 1.41 (Figure 14).

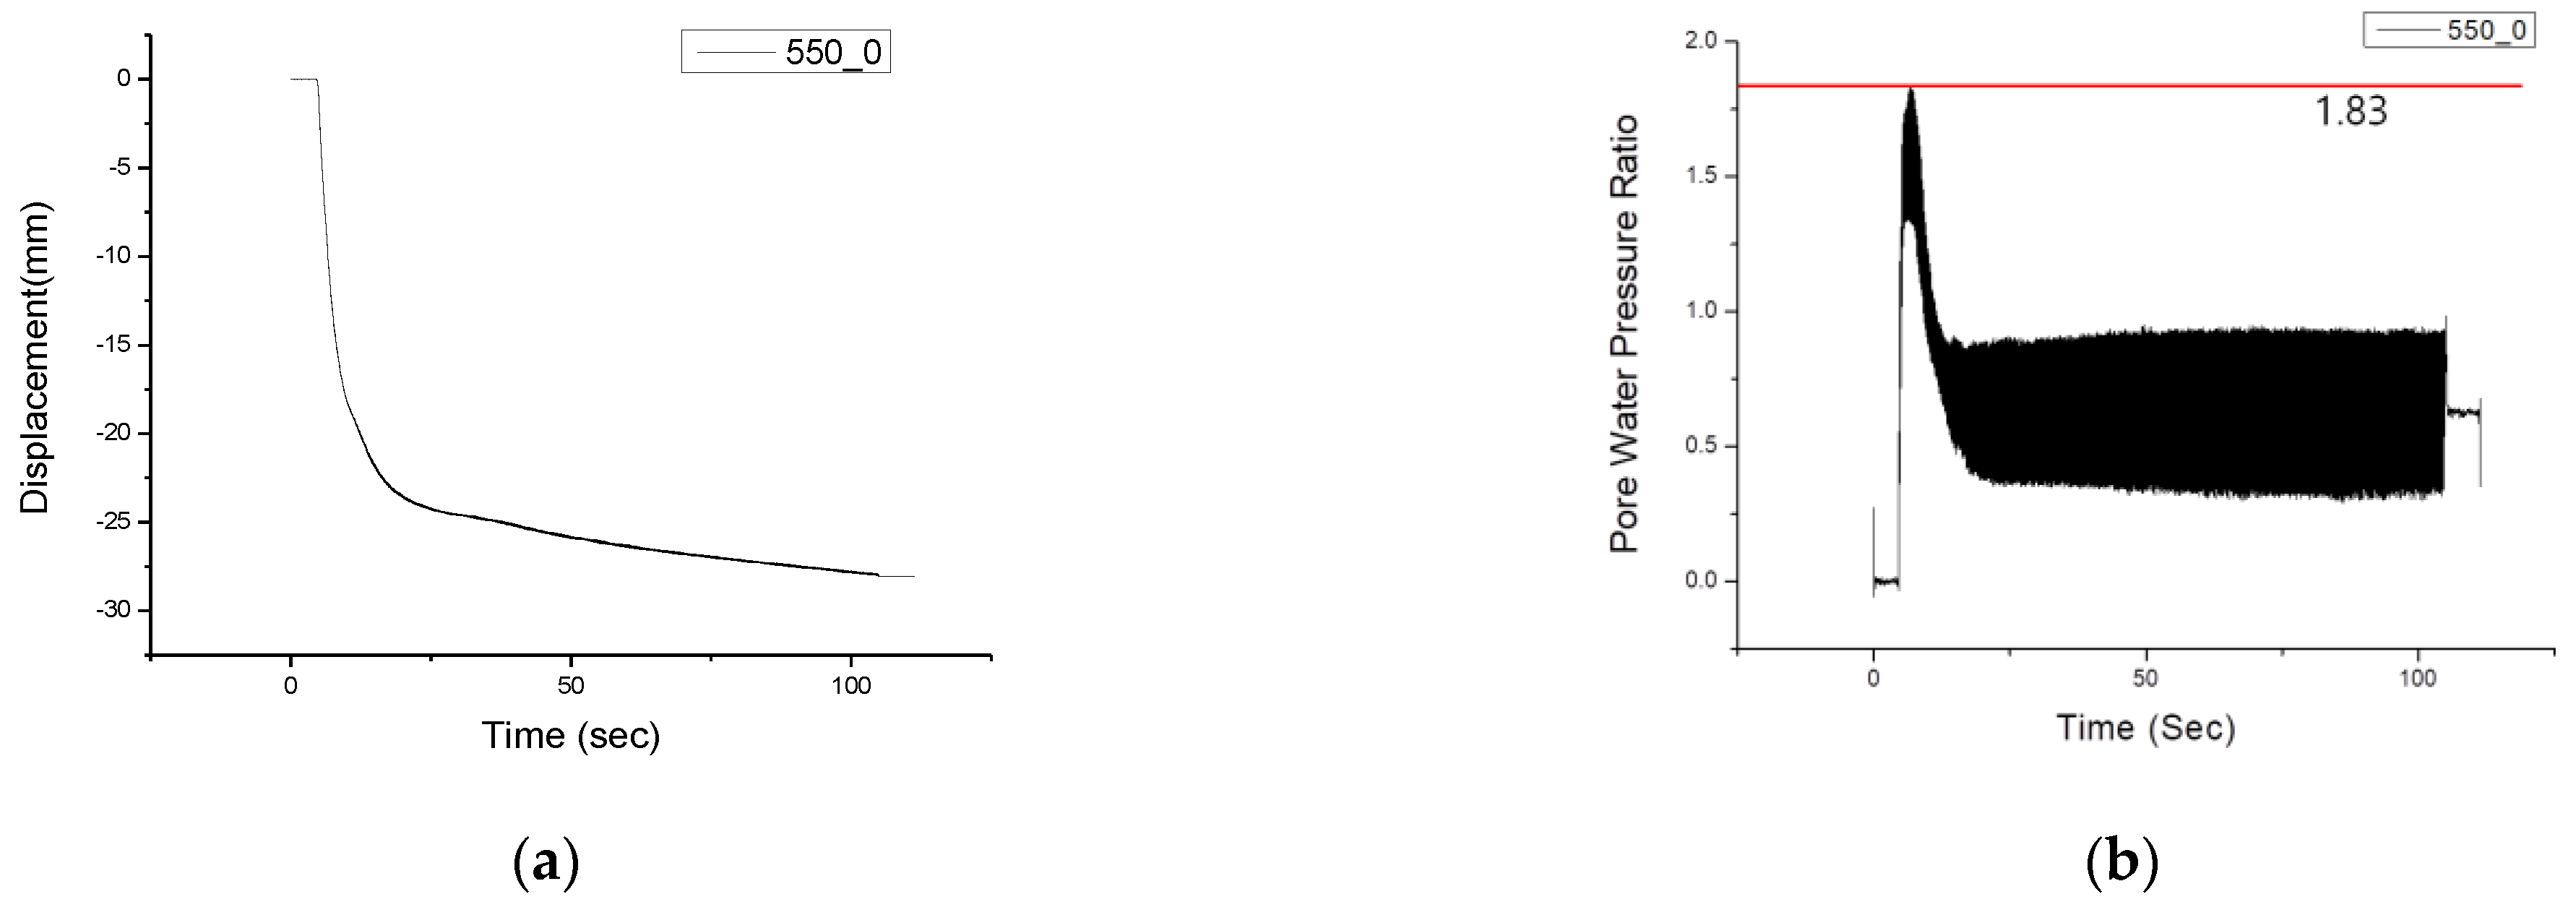
3.4.7. Mixing Ratio 0.55—Separation Distance 0 cm

A vibration band test was performed with a grouting mixing ratio of 0.55 and a separation distance of 0 cm. Rapid subsidence occurred between 5 and 6 s, and the final subsidence amount of the structure was 1.35 m on a circular basis. When subsidence occurred rapidly, the pore water pressure also increased rapidly, and the ru measurement, based on the pore water pressure, showed that liquefaction occurred at 1.83.

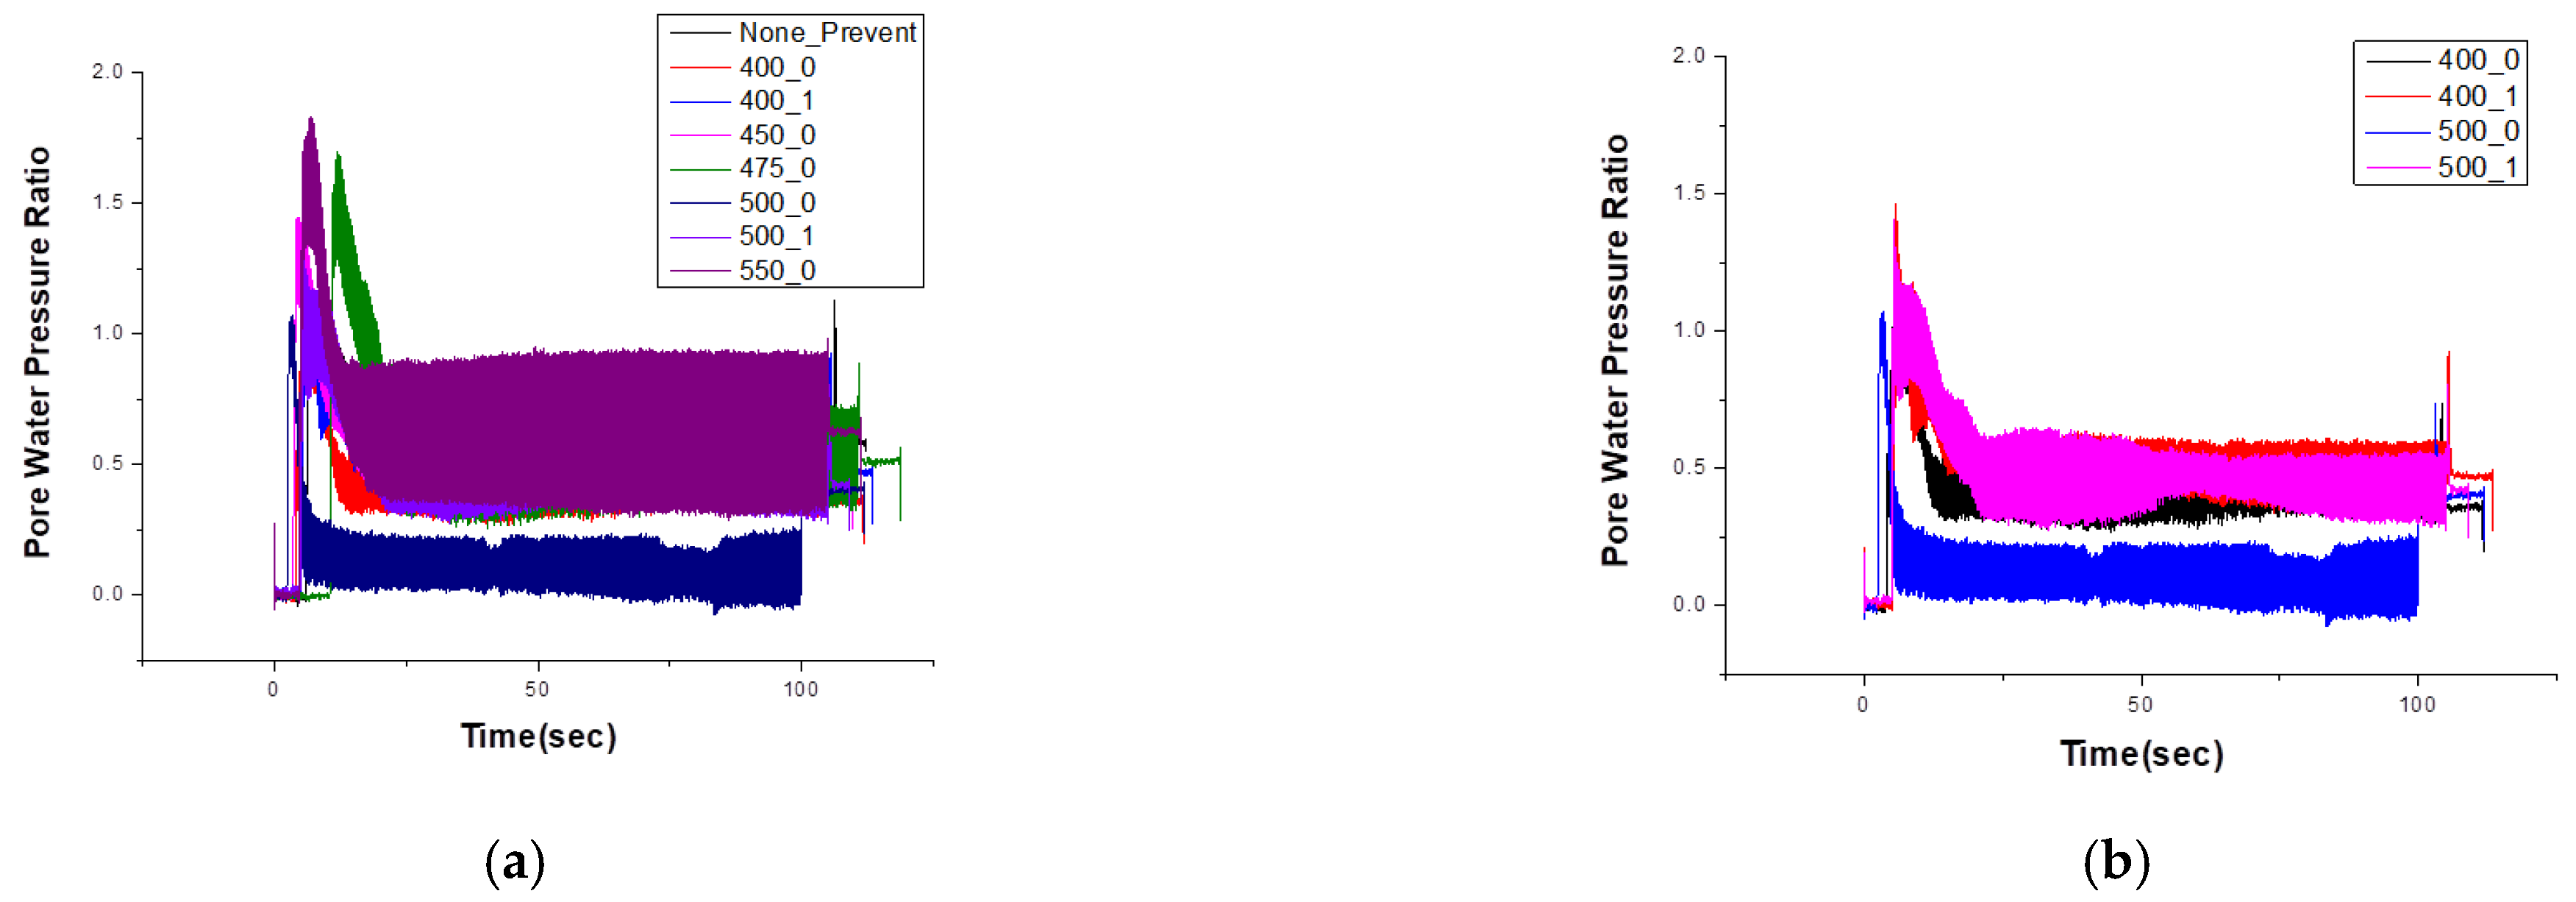
3.5. Comparison of Settlement Amount Based on Grouting Mixing Ratio

Figure 15 shows the amount of settlement based on the mixing ratio of the grouting chemicals, and the separation distance between the grouting and structure. The settlement amount of the structure decreased as the grouting mixing ratio increased. However, when the mixing ratio exceeded a certain value, the tendency to increase was due to the amount of subsidence. This is believed to be due to the generation of an additional load from the grouting. A comparison between the amount of settlement, based on the separation distance between the grouting chemical injection unit and the structure, showed that the amount of settlement of the structure decreased when the separation distance was 0 cm. When the separation distance between the grouting chemical injection part and the structure increased, the structure and grouting exhibited independent behavior; we concluded that there was no effect of suppressing the sinking of the structure or reinforcing the ground. Table 4 summarizes the blending ratio of the grouting chemicals and the amount of settlement, based on the separation distance between the grouting and structure (Figure 15).
The results of this study confirmed that when the grouting mixing ratio was less than 0.4, the condensation strength of the grouting chemical was weak and was thus destroyed by a dynamic load. Accordingly, the minimum mixing ratio of the grouting chemical was selected as 0.4, and an equation representing the correlation between the grouting mixing ratio and settlement amount was proposed as a trend equation (Figure 16 and Figure 17).
Based on the results of this study, the correlation equation between the grouting mixing ratio and the amount of sedimentation was calculated, as shown in Figure 18. As shown in the graph of Figure 18, when the ground is reinforced with grouting, it has a great effect on reducing the amount of structural settlement; from this, it can be confirmed that the ground must be reinforced. As a result of checking the correlation between the grouting mixing ratio and the structure settlement amount, when the grouting mixing ratio is at least 0.4, the settlement amount tends to converge to a similar value, which is not significantly different due to the difference in the grouting mixing ratio. However, the grouting mixing ratio is closely related to the grouting strength, and the grouting strength is an important factor in determining the ground reinforcement ability and the safety of the structure; therefore, using a minimum grouting mixing ratio of 0.45 or more is considered safe.

4. Conclusions

This study shows the effect of the grouting mixing ratio and separation distance, between the grouting injection part and the structure, on the amount of structure deposition and the reduction in liquefaction damage. The conclusions of this study are as follows:
  • The ground reinforcement effect, using grouting, significantly affected the amount of structural subsidence. While the settlement amount of the structure, due to liquefaction, was measured at approximately 8.5 m on the ground without reinforcement, when ground reinforcement was performed through grouting, the smallest value of the structure was measured at approximately 1.15 m, which reduced the amount of settlement by approximately 84%.
  • A comparison of the reinforcement effect of the separation distance, between the grouting injection part and the structure, showed that the structure subsided up to 5.2 and 1.65 m when there was or was not a separation distance between the grouting injection part and the structure, respectively. The amount of structural subsidence decreased by approximately 73% when there was no separation distance between the grouting injection part and the structure.
  • When there is no separation distance between the grouting injection part and the structure, the grouting chemical penetrates and hardens the ground due to the decrease in the structure settlement amount; this combines with the structure foundation and thus expands the cross-sectional area. As a result, it is thought that the structure’s own load is dispersed and the buoyancy against the excess pore water pressure is increased, thereby reducing structure settlement. Based on these results, it is considered that the absence of a separation distance between the grouting injection part and the structure is more effective in suppressing structure settlement.
  • The amount of structure settlement tended to decrease as the grouting mixing ratio increased; however, when the grouting mixing ratio exceeded a certain value, the amount of structure settlement slightly increased. An increase in the grouting, which acted as an additional load on the structure, and the grouting mixing ratio, were considered to increase the amount of settlement in the structure.
  • By comparing the pore water pressure change, according to the grouting chemical mixing ratio and the separation distance between the grouting injection part and the structure, it was confirmed that penetrating the grouting did not significantly affect the suppression of the increase in the pore water pressure. In general, when the ground is reinforced through a high-pressure injection grouting method, the ground is hardened to a deep position in the ground, due to the injected grouting chemical; this suppresses an increase in the pore water pressure during an earthquake. However, unlike the general high-pressure injection grouting method, this study lowers the grouting chemical injection pressure and allows the grouting chemical to penetrate the ground; therefore, the penetration depth of the grouting chemical is smaller than that of the general high-pressure injection grouting method. This seems to cause difficulty in penetrating the grouting chemical into the deep position in the ground, making it difficult to harden the deep ground; for this reason, reinforcing the ground with the penetrating grouting method does not have a significant impact on suppressing the increase in the pore water pressure in the ground.
  • No significant difference was found between the input and the ground acceleration, based on the grouting mixing ratio and the separation distance between the grouting injection point and the structure; therefore, we concluded that there is no significant increase or attenuation in the ground acceleration due to penetration grouting.
  • The rapidly increasing pore water pressure during an earthquake causes ground liquefaction. The pore water pressure, which increased rapidly in this study, tends to decrease again after reaching the maximum pore water pressure and dissipates. The dissipation rate of such pore water pressure can be seen as one of the important factors in determining the time it takes to recover ground strength. Therefore, the effect of ground reinforcement, via penetrating grouting, on the dissipation of pore water pressure is considered an important process to understand in this study. Accordingly, the change in pore water pressure was confirmed after a certain period of time after liquefaction occurred; as a result, the penetrating grouting method showed no tendency to interfere with or suppress the dissipation of pore water pressure after liquefaction occurred. This is considered to be the case because the grouting chemical does not penetrate to a deep position in the ground, so it does not affect the dissipation of the pore water pressure.
  • Considering the effect of grouting on ground reinforcement in the event of liquefaction, it is considered that the optimal grouting mixing ratio is 0.45; this has the smallest structure settlement, has excellent grouting strength, and ensures economic feasibility.
  • Based on the results of this study, the correlation equation between the grouting mixing ratio and the structure settlement amount was proposed. This relational equation is expected to enable the effective and efficient calculation of the grouting mixing ratio when the penetrating grouting method is applied on-site in the future.
Based on the experimental results, we propose an equation representing the correlation between the grouting mixing ratio and settlement amount. This research was conducted only on single-layered ground; research on multi-layered ground should be conducted, as well as research on the depth of penetration and scope of influence of chemical solutions using various grouting injection methods.

Author Contributions

Conceptualization and methodology, J.C.Y. and J.M.K.; investigation and analysis, J.C.Y. and S.W.S.; writing—original draft preparation, J.C.Y., S.W.S. and J.M.K.; writing—review and editing, J.C.Y., S.W.S. and J.M.K. All authors have read and agreed to the published version of the manuscript.

Funding

This paper was financially supported by the National Research Foundation of Korea (NRF- 2021R1I1A3052245).

Institutional Review Board Statement

Not applicable.

Informed Consent Statement

Not applicable.

Data Availability Statement

Not applicable.

Conflicts of Interest

The authors declare no conflict of interest.

References

  1. Korea Meteorological Administration Weather Nuri. Available online: https://www.weather.go.kr/w/eqk-vol/archive/stat/trend.do (accessed on 11 October 2022).
  2. Seed, H.B.; Idriss, I.M. A Simplified Procedure for Evaluating Soil Liquefaction Potential. J. Soil Mech. Found. Div. 1971, 97, 1249–1273. [Google Scholar] [CrossRef]
  3. Mejia, L.H.; Boulanger, R.W. A Long-Term Test of Compaction Grouting for Liquefaction Mitigation. In Earthquake-Induced Movements and Seismic Remediation of Existing Foundations and Abutments; Soil Dynamics Committer of the Geotechnical Engineering: San Diego, CA, USA, 1995. [Google Scholar]
  4. Andrus, D.; Chung, M. Ground Improvement Techniques for Liquefaction Remediation near Existing Lifelines; NISTIR 5714; US National Institute of Standards and Technology: Gaithersburg, MD, USA, 1995.
  5. Hausler, E.; Sitar, N. Performance of Improved Ground. In Proceedings of the Annual Meeting Research Digest, 2002–16; The Pacific Earthquake Engineering Research Center: Oackland, CA, USA, 2002. [Google Scholar]
  6. Hausler, E. Influence of Ground Improvement on Settlement and Liquefaction: A Study Based on Field Case History Evidence and Dynamic Geotechnical Centrifuge Tests. Ph.D. Thesis, University of California, Berkeley, CA, USA, 2002. [Google Scholar]
  7. Kawamura, K.; Yamazaki, H.; Sugano, T.; Hayashi, K. Proof Experiment Using Artificial Earthquake Concerning Effect Of Permeable Grouting Method As Measures Against Liquefaction. In Proceedings of the 13th World Conference on Earthquake Engineering, Vancouver, BC, Canada, 1–6 August 2004. [Google Scholar]
  8. Yasuda, S. Remediation methods against liquefaction which can be applied to existing structures. Earthq. Geotech. Eng. 2007, 6, 385–406. [Google Scholar]
  9. Caballero, F.L.; Razavi, A.M.F. Numerical simulation of liquefaction effects on seismic SSI. Soil Dyn. Earthq. Eng. 2008, 28, 85–98. [Google Scholar] [CrossRef] [Green Version]
  10. Sitar, N.; Hausler, E. Influence of Ground Improvement on Liquefaction Induced Settlement: Observations from Case Histories and Centrifuge Experiments. Invited Lecture Presented to the Korean Geotechnical Society Seoul, Korea. Int. J. Geo-Eng. 2012, 4, 5–15. [Google Scholar]
  11. Rasouli, R.; Hayashi, K. Liquefaction resistance and residual shear strength of soil improved by permeable grouting method. In Proceedings of the Conference of Japanese Geothechnical Society Symposium on Practical Design of Chemical Grouting, Tokyo, Japan, 5 June 2015. [Google Scholar]
  12. Bray, J.D.; Boulanger, R.W.; Cubrinovski, M.; Tokimatsu, K.; Kramer, S.L.; O’Rourke, T.; Rathje, E.; Green, R.A.; Robertson, P.K.; Beyzaei, C.Z. Liquefaction-Induced Ground Movements Effects. In Proceedings of the U.S.–New Zealand–Japan International Workshop, Berkeley, CA, USA, 2–4 November 2016. [Google Scholar]
  13. Rasouli, R.; Hayashi, K.; Zen, K. Controlled permeation grouting method for mitigation of liquefaction. J. Geotech. Geoenviron. Eng. 2016, 142, 04016052. [Google Scholar] [CrossRef]
  14. Park, S.Y.; Shim, H.G.; Kang, H.J.; Lim, O.B.; Kim, Y.S. Grouting injection effectiveness of a permeable compacting grout using permeable compaction type packer. J. Korean Geosynth. Soc. 2017, 16, 149–158. [Google Scholar]
  15. Nabeshima, Y. Permeation of Ultra-Fine Particle Cement to Sandy Ground and Cement Stabilization. In Proceedings of the International Ocean and Pore Engineering Conference, Shanghai, China, 11–16 October 2020. [Google Scholar]
  16. Duan, W.; Congress, S.S.C.; Cai, G.; Liu, S.; Dong, X.; Chen, R.; Liu, X. A Hybrid GMDH neural networks and Logistic Regression Framework for State Parameter-Based Liquefaction Evaluation. J. Can. Geotech. 2021, 99, 1801–1811. [Google Scholar] [CrossRef]
  17. Hasheminezhad, A.; Farazalizadeh, R.; Rahimi, H.; Bahadori, H. Seismic Performance Assessment of Wall-type Gravel and Rubber Drains in Liquefaction Mitigation of Sands. Bull. Earthq. Eng. 2022, 20, 3699–3714. [Google Scholar] [CrossRef]
  18. Kobayashi, M.; Zen, K.; Chen, G.; Kasama, K. Shaking Table Test on the Improvement Dimension Of Permeable Grouting Method For Liquefaction Countermeasure. In Proceedings of the ASME 2009 28th International Conference on Ocean, Offshore and Arctic Engineering OMAE2009, Honolulu, HI, USA, 31 May–6 June 2009. [Google Scholar]
  19. Mitrani, H.; Madabhushi, S.P.G. Cementation liquefaction remediation for existing buildings. Ground Improv. 2010, 163, 81–94. [Google Scholar] [CrossRef]
  20. Wang, W.; Hashimoto, K.; Hyodo, T.; Tsukamoto, Y.; Oji, S.; Nishihara, S.; Kanazawa, T. Examining efficient assisting geotechnology for permeation grouting of ultra microfine cement for soil liquefaction countermeasure. In Proceedings of the 6th Japan-Korea Geotechnical Workshop, Okayama, Japan, 12 September 2016. [Google Scholar]
  21. Salvatore, E.; Modoni, G.; Mascolo, M.C.; Grassi, D.; Spagnoli, G. Experiment Evidence of the Effectiveness and Applicability of Colloidal Nanosilica Grouting for Liquefaction Mitigation. J. Geotech. Geoenviron. Eng. 2020, 146, 04020108. [Google Scholar] [CrossRef]
  22. Arpit, J.; Satyendra, M.; Tshering, C. Liquefaction Mitigation Measures of Fine Sand Using Cement Grout Under Cyclic Loading. ISET J. Earthq. Tech. 2020, 57, 555. [Google Scholar]
  23. Ciardi, G.; Vannucchi, G.; Madial, C. Effects of colloidal silica grouting on geotechnical properties of liquefiable soils: A review. Geotechnics 2021, 1, 460–491. [Google Scholar] [CrossRef]
  24. Nabeshima, Y. Permeation of ultra-fine particle cement grout into sandy ground. Int. J. Struct. Civ. Eng. 2021, 10, 3. [Google Scholar] [CrossRef]
Figure 1. Types of grouting methods: (a) Colloidal silica grouting; (b) Space grouting rocket system [23].
Applsci 13 01871 g001
Figure 2. Particle distribution of Jumunjin standard sand.
Applsci 13 01871 g002
Figure 3. Schematic diagram of model: (a) Plan view; (b) Front view.
Applsci 13 01871 g003
Figure 4. Input motion at 0.6 g and 10 Hz: (a) Whole shaking; (b) Shaking wave between 5 and 6 s.
Applsci 13 01871 g004
Figure 5. The Description of Separation Distance.
Applsci 13 01871 g005
Figure 6. Non-reinforced: (a) Settlement (b) Pore Water Pressure Ratio.
Applsci 13 01871 g006
Figure 7. Grouting mixing ratio of 0.40 and separation distance of 0 cm: (a) Settlement (b) Pore Water Pressure Ratio.
Applsci 13 01871 g007
Figure 8. Grouting mixing ratio of 0.40 and separation distance of 0 cm: (a) Plane View (b) Crack of Grouting (c) Side View.
Applsci 13 01871 g008
Figure 9. Grouting mixing ratio of 0.40 and separation distance of 1 cm: (a) Settlement (b) Pore Water Pressure Ratio.
Applsci 13 01871 g009
Figure 10. Grouting mixing ratio of 0.40 and separation distance of 1 cm: (a) Plane View (b) Side View.
Applsci 13 01871 g010
Figure 11. Grouting mixing ratio of 0.45 and separation distance of 0 cm: (a) Settlement (b) Pore Water Pressure Ratio.
Applsci 13 01871 g011
Figure 12. Grouting mixing ratio of 0.475 and separation distance of 0 cm: (a) Settlement (b) Pore Water Pressure Ratio.
Applsci 13 01871 g012
Figure 13. Grouting mixing ratio of 0.5 and separation distance of 0 cm: (a) Settlement (b) Pore Water Pressure Ratio.
Applsci 13 01871 g013
Figure 14. Grouting mixing ratio of 0.5 and separation distance of 1 cm: (a) Settlement (b) Pore Water Pressure Ratio.
Applsci 13 01871 g014
Figure 15. Grouting mixing ratio of 0.55 and separation distance of 0 cm: (a) Settlement (b) Pore Water Pressure Ratio.
Applsci 13 01871 g015
Figure 16. Settlement of grouting mixing ratio and separation distance. (a) Settlement of grouting mixing ratio. (b) Settlement of separation distance.
Applsci 13 01871 g016
Figure 17. Pore Water Pressure of grouting mixing ratio and separation distance. (a) Pore Water Pressure of grouting mixing ratio. (b) Pore Water Pressure of separation distance.
Applsci 13 01871 g017
Figure 18. Relationship between settlement and grouting mixing ratio.
Applsci 13 01871 g018
Table 1. Properties of Jumunjin standard sand.
G s . e m a x e m i n D 10 (mm) D 60 (mm) C u
2.630.9370.650.3310.5861.93
Table 2. Characteristics of experiments.
No.Cement Past/WaterAcceleration (g)Frequency (Hz)
100.610
20.45 (0 cm)0.610
30.45 (1 cm)0.610
40.4750.610
50.5 (0 cm)0.610
60.5 (1 cm)0.610
70.550.610
Table 3. Law of similitude based on Iai (1989).
Scale Factor (λ = 50)
ParameterPrototype/Experiment
Lengthλ50
Stress and Pressureλ50
Acceleration11
Time λ 0.5 7.07
Stiffnessλ50
Table 4. Maximum settlement of grouting mixing ratio.
Grouting
Mixing Ratio (a Separation Distance)
Non-Reinforced0.40
(0)
0.40
(1 cm)
0.45
(0)
0.475
(0)
0.50
(0)
0.50
(1 cm)
0.55
(0)
Maximum amount of settlement (cm)8.51.654.91.151.31.55.21.35
Disclaimer/Publisher’s Note: The statements, opinions and data contained in all publications are solely those of the individual author(s) and contributor(s) and not of MDPI and/or the editor(s). MDPI and/or the editor(s) disclaim responsibility for any injury to people or property resulting from any ideas, methods, instructions or products referred to in the content.

