Abstract
Epidermal growth factor receptor (EGFR) and Kirsten rat sarcoma (KRAS) are the most common driver genes in non-small cell lung cancer patients. However, frequent gene mutation testing raises a potential risk of cancer metastasis. In our paper, a Mut-SeResNet model based on the ResNet network that incorporated a residual block and attention mechanism was proposed to solve the performance degradation problem caused by a deepening of the network. We introduced a residual structure and extracted small differences between different levels to enhance the feature learning ability. The squeeze and excitation attention mechanism was adapted to fully extract the dependence between different channels of the feature image, and it calibrated the channel feature information. We used the dataset of 363 patients that were collected from collaborating hospitals to train our Mut-SeResNet model. The prediction accuracy for EGFR and KRAS mutations was 89.7% and 88.3%, respectively, with a loss accuracy of 6.4% and 9.2%, respectively. The results showed that the model provided a non-invasive and easy-to-use method to improve the accuracy and stability of clinical diagnosis.
1. Introduction
According to 2022 National Cancer Center data, China ranked first with 4.064 million new cancer cases and 828,000 [1] lung cancer cases. The mortality rate of lung cancer in China has increased by 465% [2] in the past 30 years, making it one of the most significant in numbers of lung cancer countries. Non-small cell lung cancer (NSCLC) accounts for 80% to 85% of lung cancers [3,4]; lung adenocarcinoma and lung squamous cell carcinoma are common non-small cell lung cancers [5,6].
Medical images contain a large amount of potential pathophysiological information. Computer-aided [7,8,9,10] diagnosis using CT images can improve the accuracy and stability of clinical diagnosis, reduce the time needed for clinical diagnosis, and decrease clinical misdiagnosis risks and judgment omissions caused by various subjective factors [11].
In recent years, studies have been proposed to predict gene mutations based on CT images. Most of these are based on imaging-omics approaches, and a few are based on machine learning or statistical approaches to predict gene mutations. Although imaging-omics, statistics, and machine learning methods have achieved some results in the research using CT images to predict gene mutations, these methods often require complex processes and the guidance of an experienced imaging physician throughout the process. In this paper, we proposed a multi-task deep learning model (Mut-SeResNet) for extracting deep features from CT images to predict both EGFR and KRAS mutations.
2. Related Work
Deep learning is a process that simulates the cognition of human things and learns them. Deep learning techniques take data through nonlinear transformations [12,13] to perform high-dimensional abstractions. They extract and combine various types of shallow features to transform them into more representative higher-level features, which describe the intrinsic properties of things.
In recent years, deep learning [14,15,16,17] has been widely used in the medical field. The convolutional neural network (CNN) solves the tedious engineering of traditional manual feature extraction by mimicking the mechanism of biological visual perception to achieve automatic feature extraction from data [18].
Shen et al. [19] designed a MCNN (multi-scale convolutional neural network). The input images were processed from three scales. They were passed as inputs to three convolutional networks with shared weights to overcome the classification challenges brought on by the variable size of lung nodules. Hussein et al. [20] proposed to train 3D CNN architecture for non-specialized pathology images. The images were extended to a specialized pathology image dataset using transfer learning to overcome the difficulty of accessing a CT pathology lung nodules image dataset; Zhu et al. [21] proposed deep learning architecture that used the combination of the dual path network (DPN) [22] and the gradient boosting machine (GBM). In 2017, Nibali [23] et al. proposed using a deep residual network to solve the problem of benign and malignant classification of CT images. Previous studies focused on the benign and malignant classification of lung nodules, while our paper focuses on predicting the mutation or lack thereof of genes by CT image information. In the past, the medical approach was used to predicted gene mutation, while we used deep learning methods.
Studies have shown that mutations in the epidermal growth factor receptor (EGFR) and Kirsten rat sarcoma (KRAS) are the most common driver genes in NSCLC [24,25,26,27]. Biopsies are usually performed using endoscopic or fine-needle aspiration methods to obtain specimens for EGFR and KRAS mutation testing. However, some patients cannot undergo invasive mutation testing at high frequencies [28,29]. Exploring a non-invasive way to detect mutations has some clinical value. However, gene mutation diagnosis relies on a large amount of imaging datasets. The morphological features of lung nodules show complex and irregular shapes. There is no clear cut-off for whether a gene is mutated or not. This puts high demands on the deep convolutional networks’ extraction of critical graphical information embedded in lung CT images.
Based on the above problems, this paper proposed a genetic mutation model based on the ResNet [30] network that incorporated the residual block [31] and attention mechanism, or a Mut-SeResNet model. The residual structure was introduced to solve the performance degradation problem caused by the deepening of network depth. When the network cannot learn new features, the model can realize identity mapping through the residual structure, extract the slight differences between different levels, and enhance the feature learning ability. The Mut-SeResNet model introduced the squeeze and excitation attention mechanism [32] to portray the interdependence between channels of the CNN. The net is expected to calibrate the self-adaptive strength of channel feature and improve the performance of deep convolutional networks. Finally, the constructed model combined multi-task learning to predict EGFR and KRAS mutations [33]. Our proposed Mut-SeResNet model could effectively determine whether a patient has lung cancer or not based on the predicted gene mutation, and it may provide an aid for doctors to make a judgment.
3. Materials and Methods
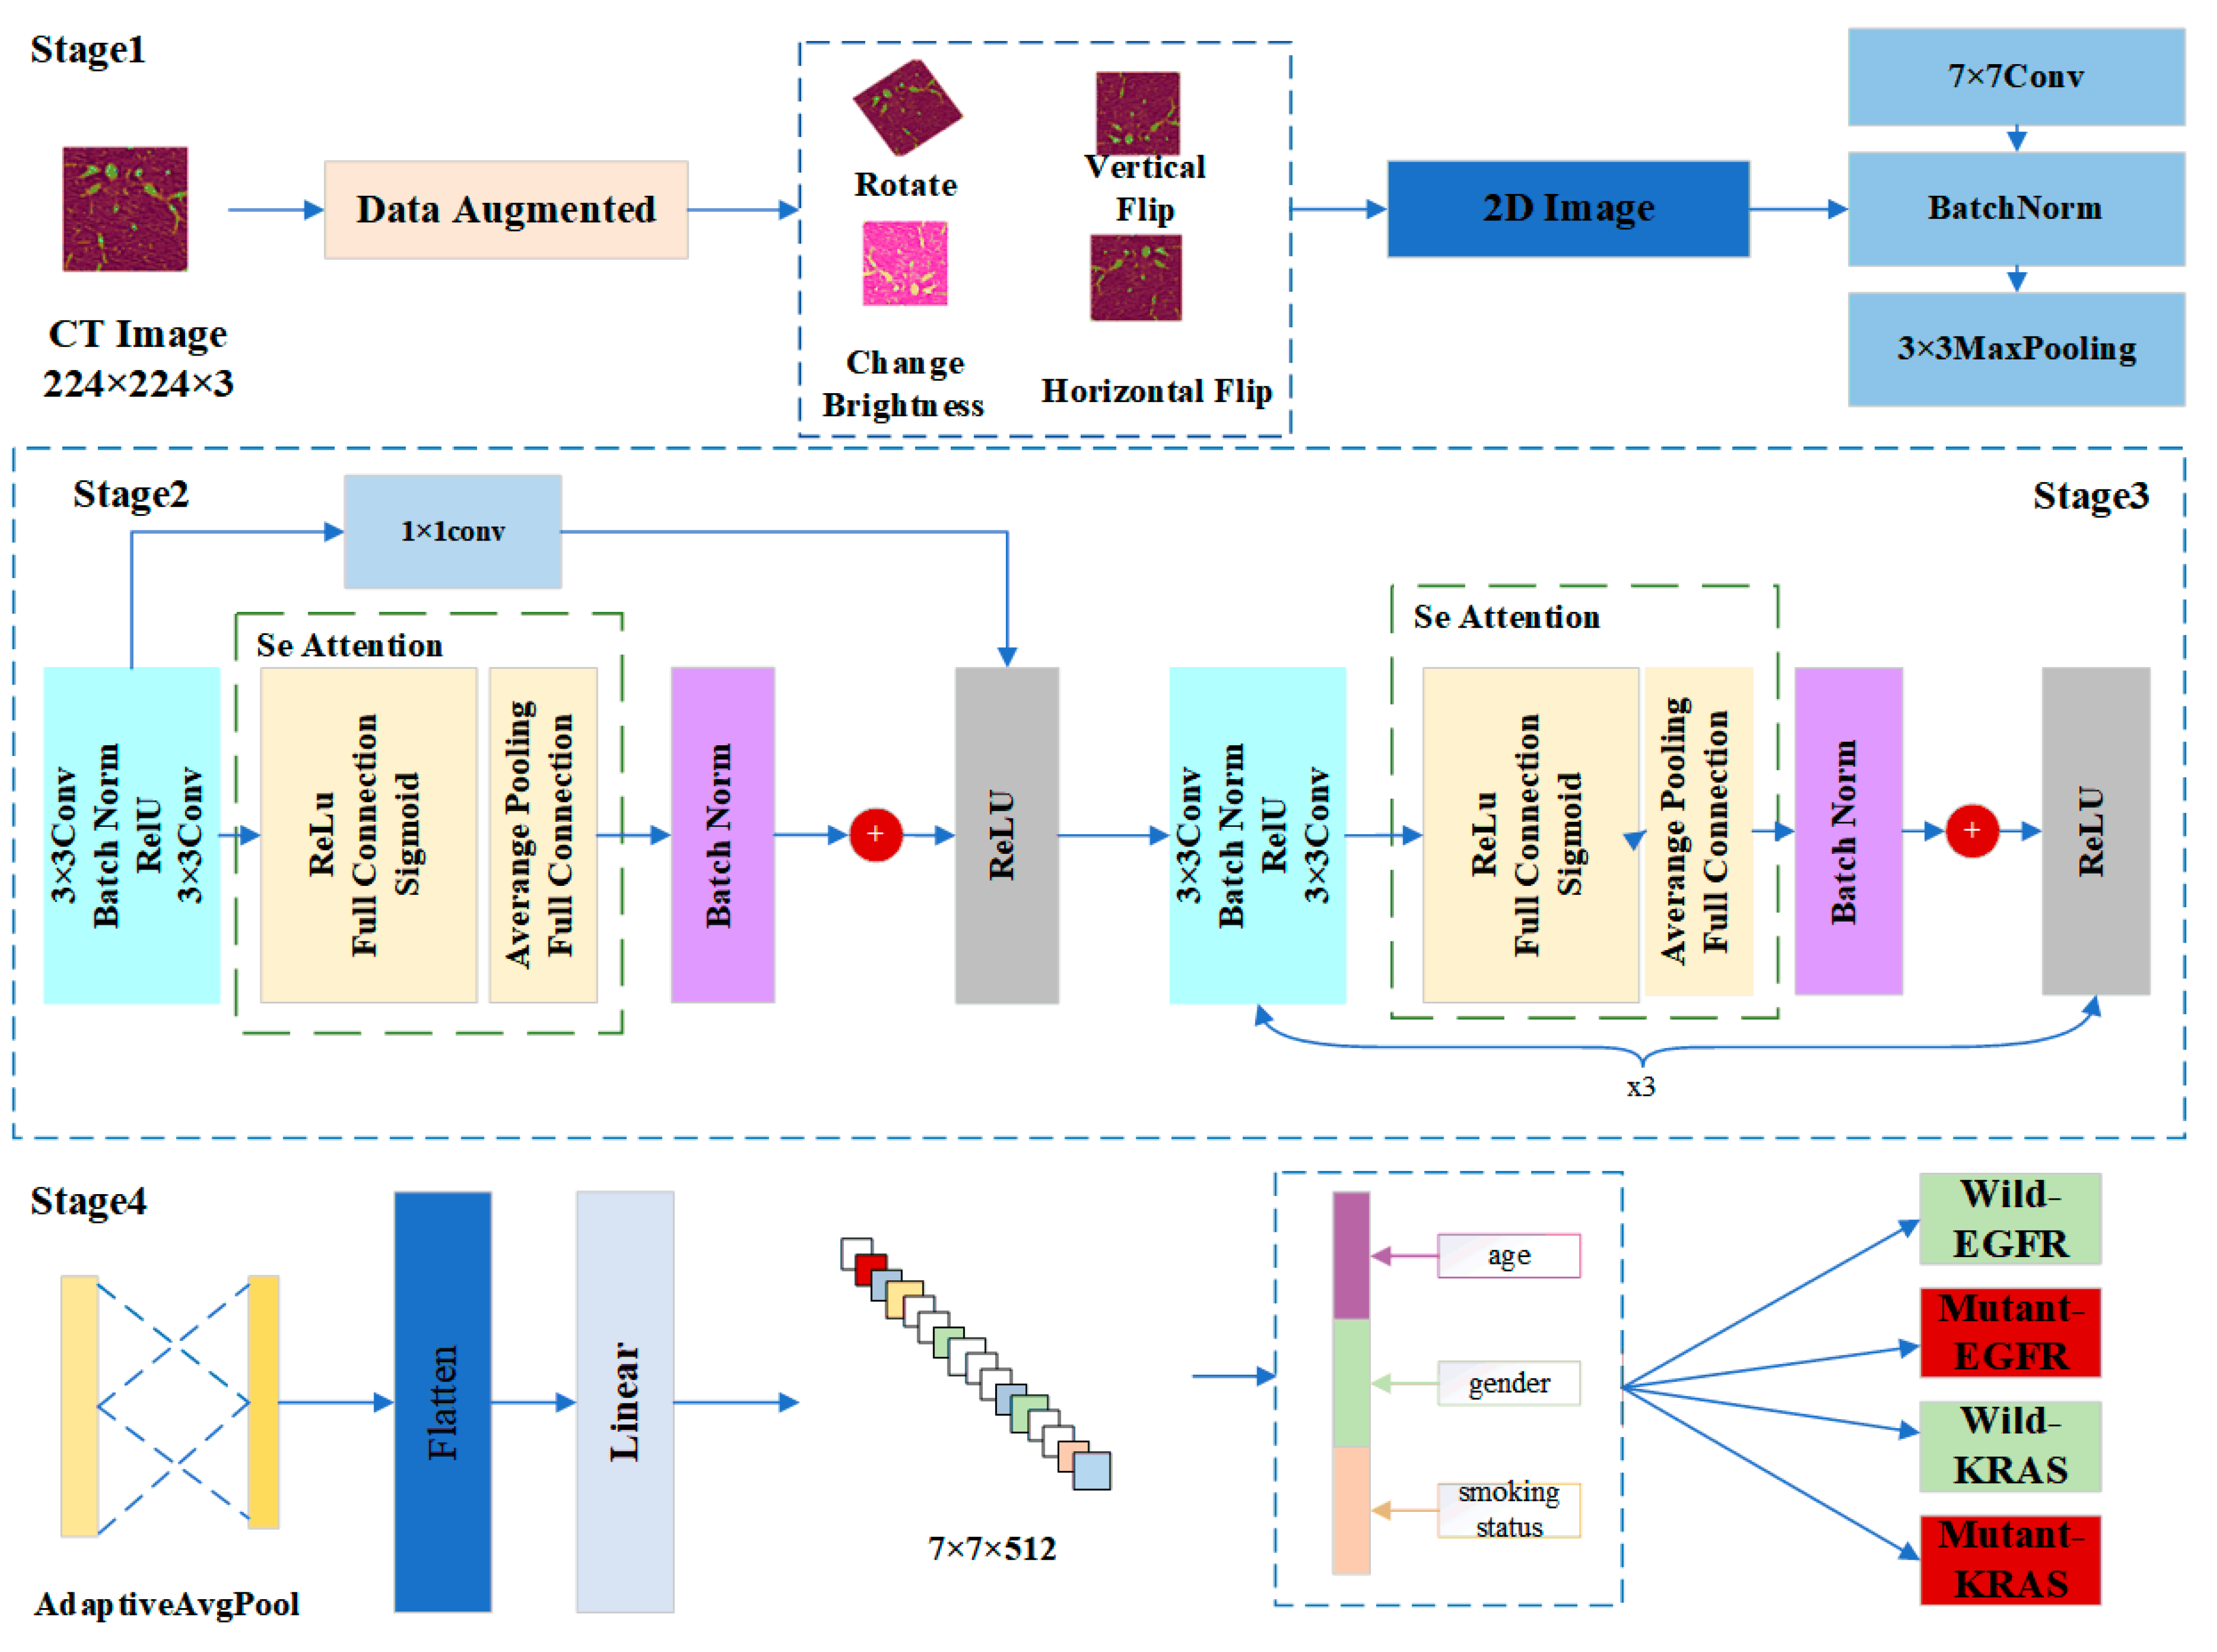
In this paper, we designed a model called Mut-SeResNet, which consisted of four parts that were differentiated according to the depth of nodule feature extraction. The framework of our proposed Mut-SeReSnet model was shown in Figure 1. Stage1 mainly performed the convolutional processing of images to extract nodule features initially. Stage2 used a 1 × 1 convolutional layer to connect residual and attention blocks to achieve cross-channel interaction and to integrate lung nodule information from previous modules. Stage3 consisted of a residual block and an attention block repeated three times to extract the fine features of lung nodules. Stage4 performed a multi-task prediction of whether EGFR and KRAS genes were mutated by connecting the adaptive mean pooling layer and the fully connected layer.
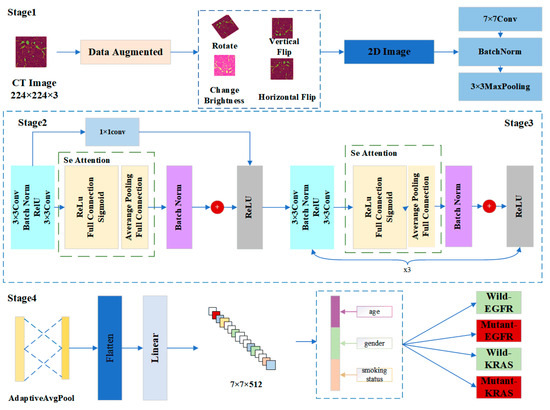
Figure 1.
The framework of our proposed Mut-SeReSnet model.
The model used the ResNet-18 network as the base network by using four modules consisting of residual blocks. The block had four convolutional layers. Finally, a fully connected layer was passed. The Mut-SeResnet adds residual blocks without increasing the parameters, and it is therefore suitable for extracting the depth features of nodules.
Stage1 was the input layer, which was responsible for processing and loading images. To alleviate the overfitting problem of the model caused by insufficient data, the data augmentation technique was used to expand the training dataset. Each slice generated four enhanced images by performing an image rotation, a vertical flip, a horizontal flip, and by changing the image brightness for each 2D nodule slice. The input images were processed from EGFR and KRAS datasets. Then, all images were uniformly scaled to 224 × 224 to accommodate subsequent model processing. Immediately after the data augmentation, the input images were down sampled through a series of convolutional layers. These layers were a 7 × 7 convolutional layer, a batch normalization layer, and a 3 × 3 maximum pooling layer. They were used to retain as much original information about the images as possible.
Stage2 adjusted channels and resolution by introducing an additional 1 × 1 convolution layer. The layer changed the number of channels so that the input and output could be consistently added. The nonlinear expression capability and the network’s performance were improved while keeping the feature map’s scale unchanged. Since Stage 1 already used a maximum pooling layer with a step size of 2, the desired feature extraction effect could be obtained without reducing the channel width. The squeeze and excitation network attention mechanism was used after the residual module (specifically described in Stage3). CT images are natural 3D image sequences. Each section often has complex context and semantics. The attention mechanism uses the global field of perception to dynamically adjust the importance of each channel in the feature map. The mechanism mines the correlation information between different dimensions of the feature map to assist in the extraction of CT image features of lung nodules, thus improving the accuracy of distinguishing malignant nodules.
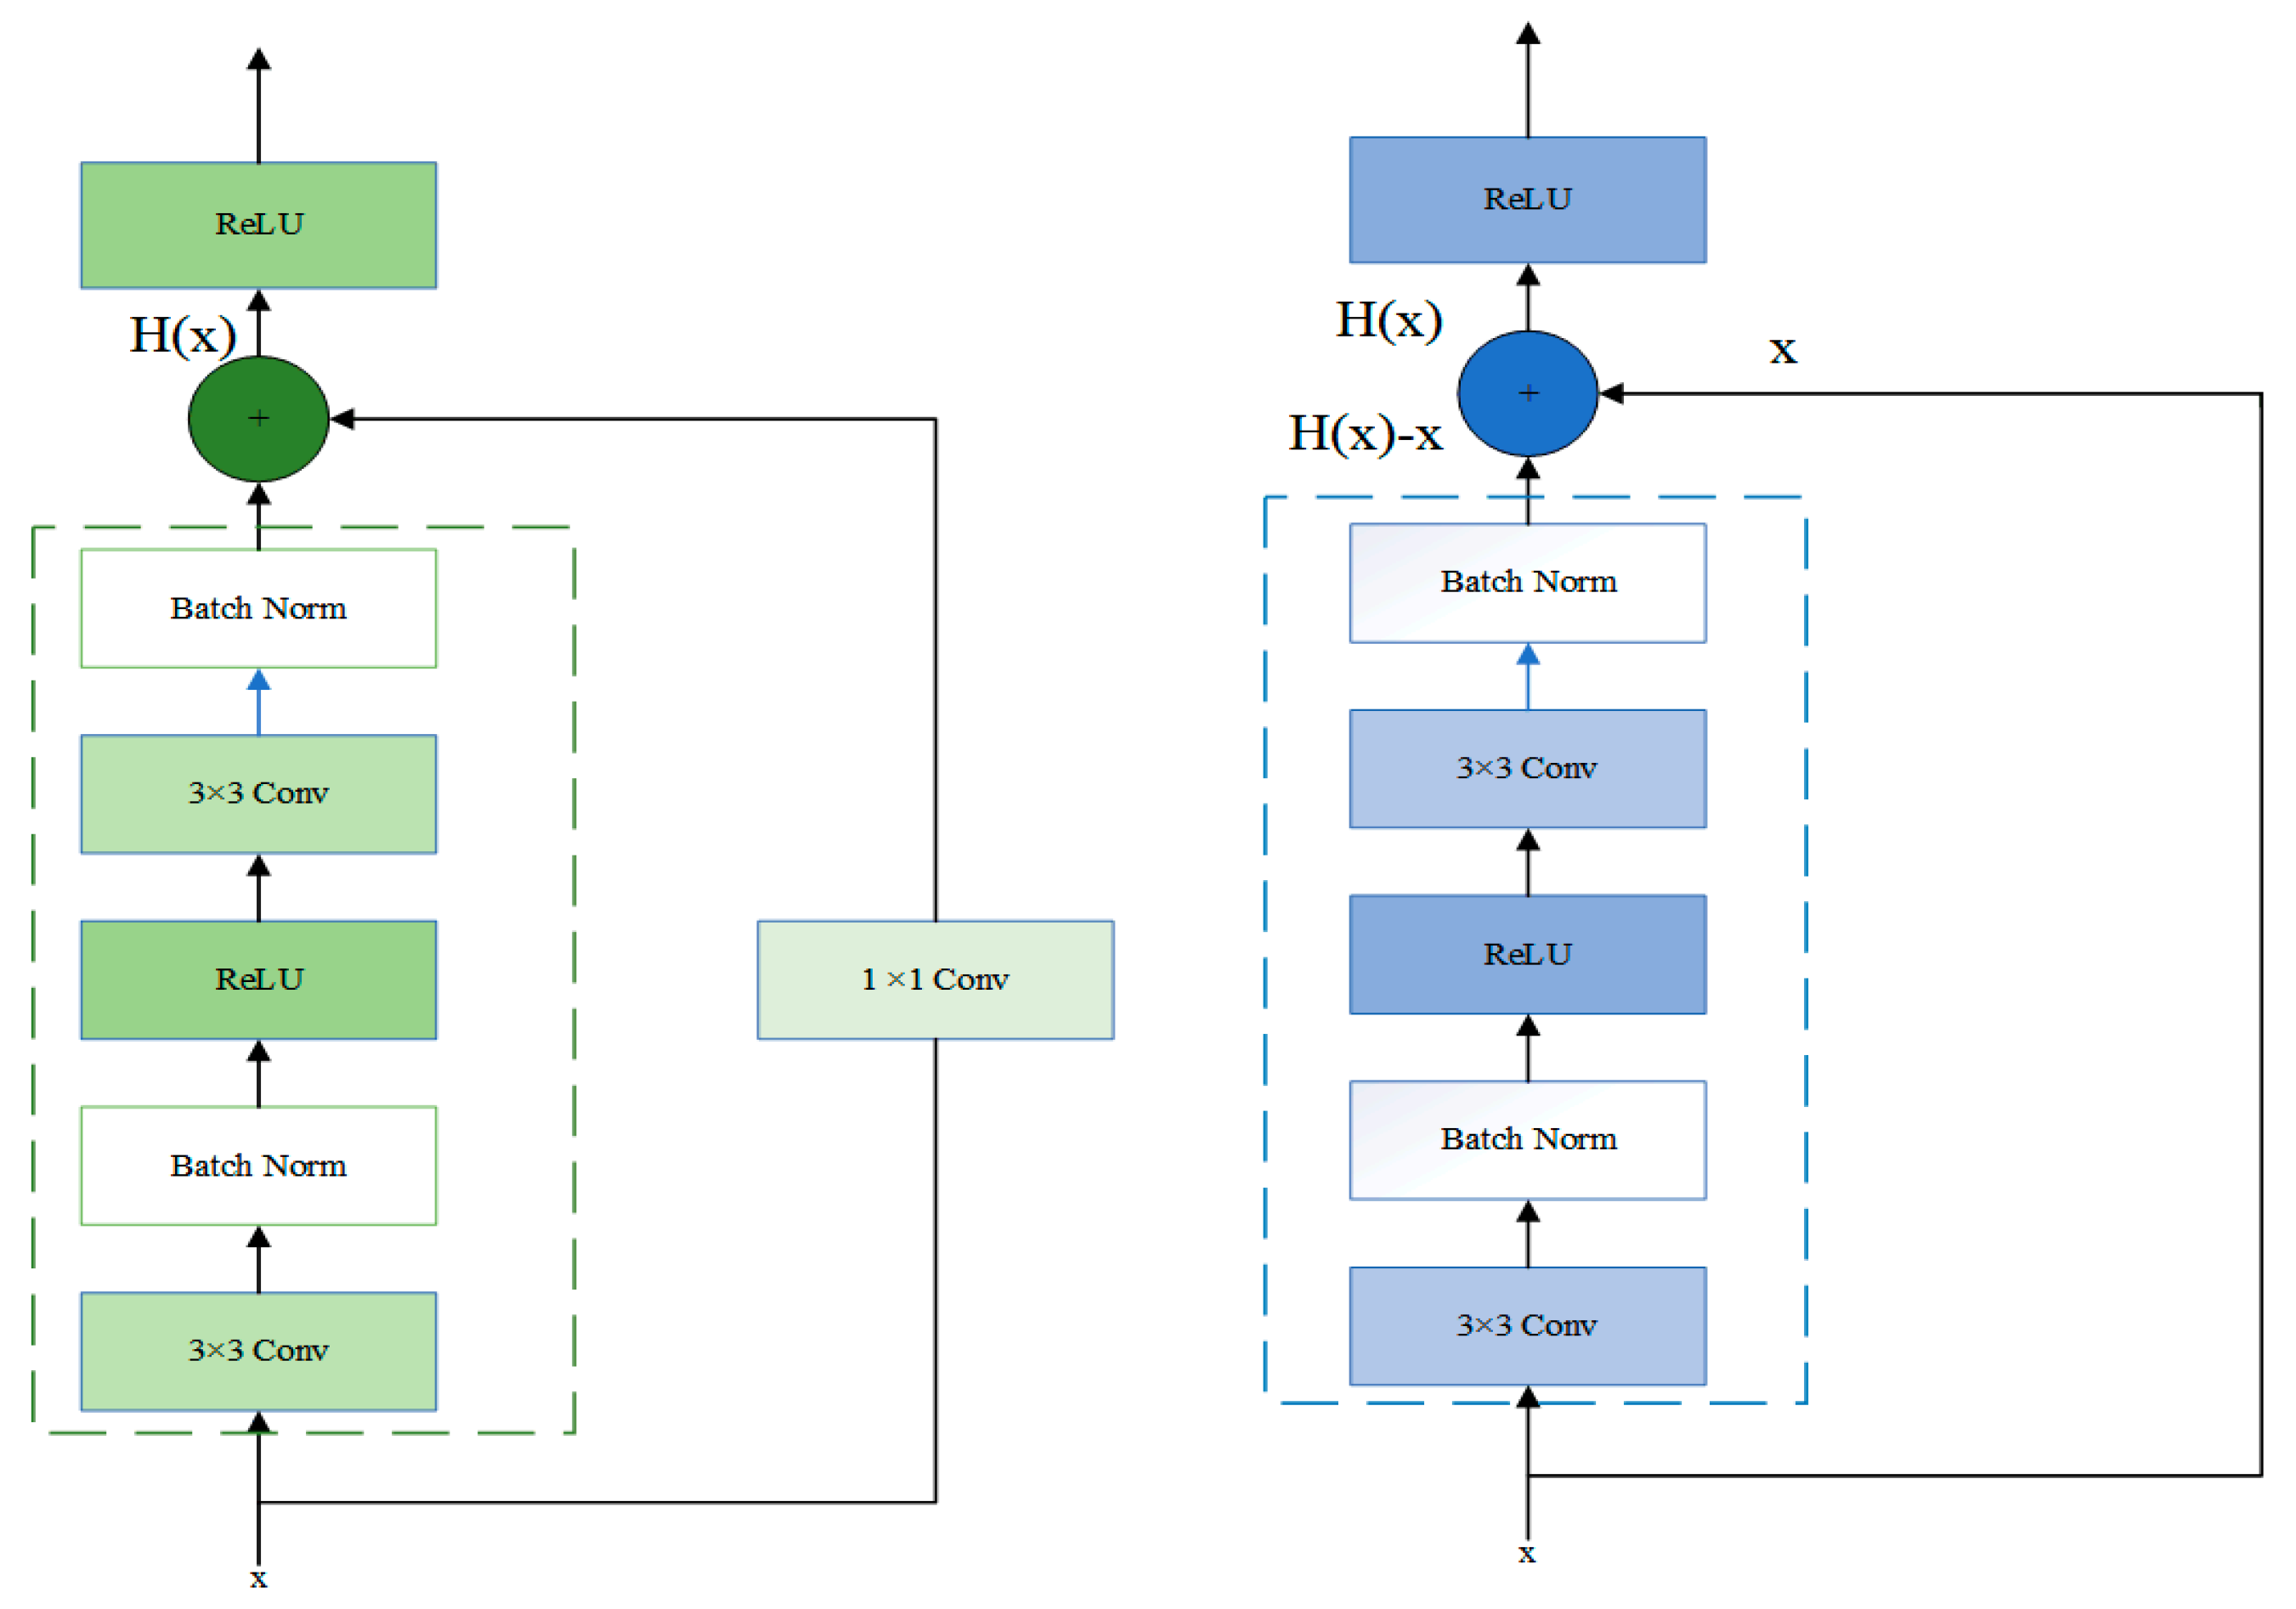
In Stage3, the residual block was passed through two identical output channels of 3 × 3 convolutional layers. A batch normalization layer and the ReLU function followed the convolutional layers. Then, the input was added directly before the final ReLU activation function through the cross-layer data path by skipping two convolutional operations. In contrast to Stage2, Stage3 did not include a 1 × 1 convolution layer. After the first residual block, each subsequent module halved the height and width of the previous module to expand the perceptual field. The block doubled the number of channels to make the information between different channels of the graph able to be fused. The structure of Stage2 and Stage3 was shown in Figure 2.
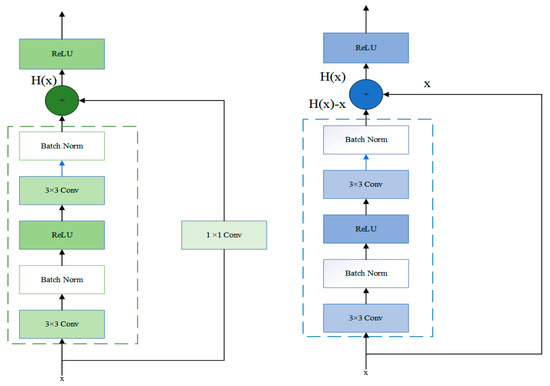
Figure 2.
The specific layers of Stage 2 and Stage 3 residual block.
Let the input in a network model be x. The desired output of the network is . The residual mapping is .
If x is passed directly to the output H(x), then the target to be learned by this network model is the residual mapping. As shown in Figure 2, this structure represented the residual learning unit that consisted of convolutional layers and shortcuts. The input x is passed to the output of the residual learning unit through the shortcuts, thus allowing it to learn the residuals directly. Precisely, the residual network consists of a series of residual blocks. The mathematical expression of the residual blocks takes the form of Equation (2):
The deformation of Equation (1) gives the following equation:
where is the weight matrix of the ith layer convolution kernel.
Learning the residual mapping is more straightforward than learning the original mapping. This is because, on the one hand, the shortcut connections in the residual learning unit do not change the size of the model nor the number of parameters. On the other hand, the network with the residual learning unit can backpropagate at the existing depth. After adding the shortcut connection, the bias derivative of z concerning x, which is denoted by Equation (4), must be greater than 1. It corresponds to the fact that the gradient does not disappear as the number of the network model layers increases. The activation function between layers uses the rectified linear unit (ReLU).
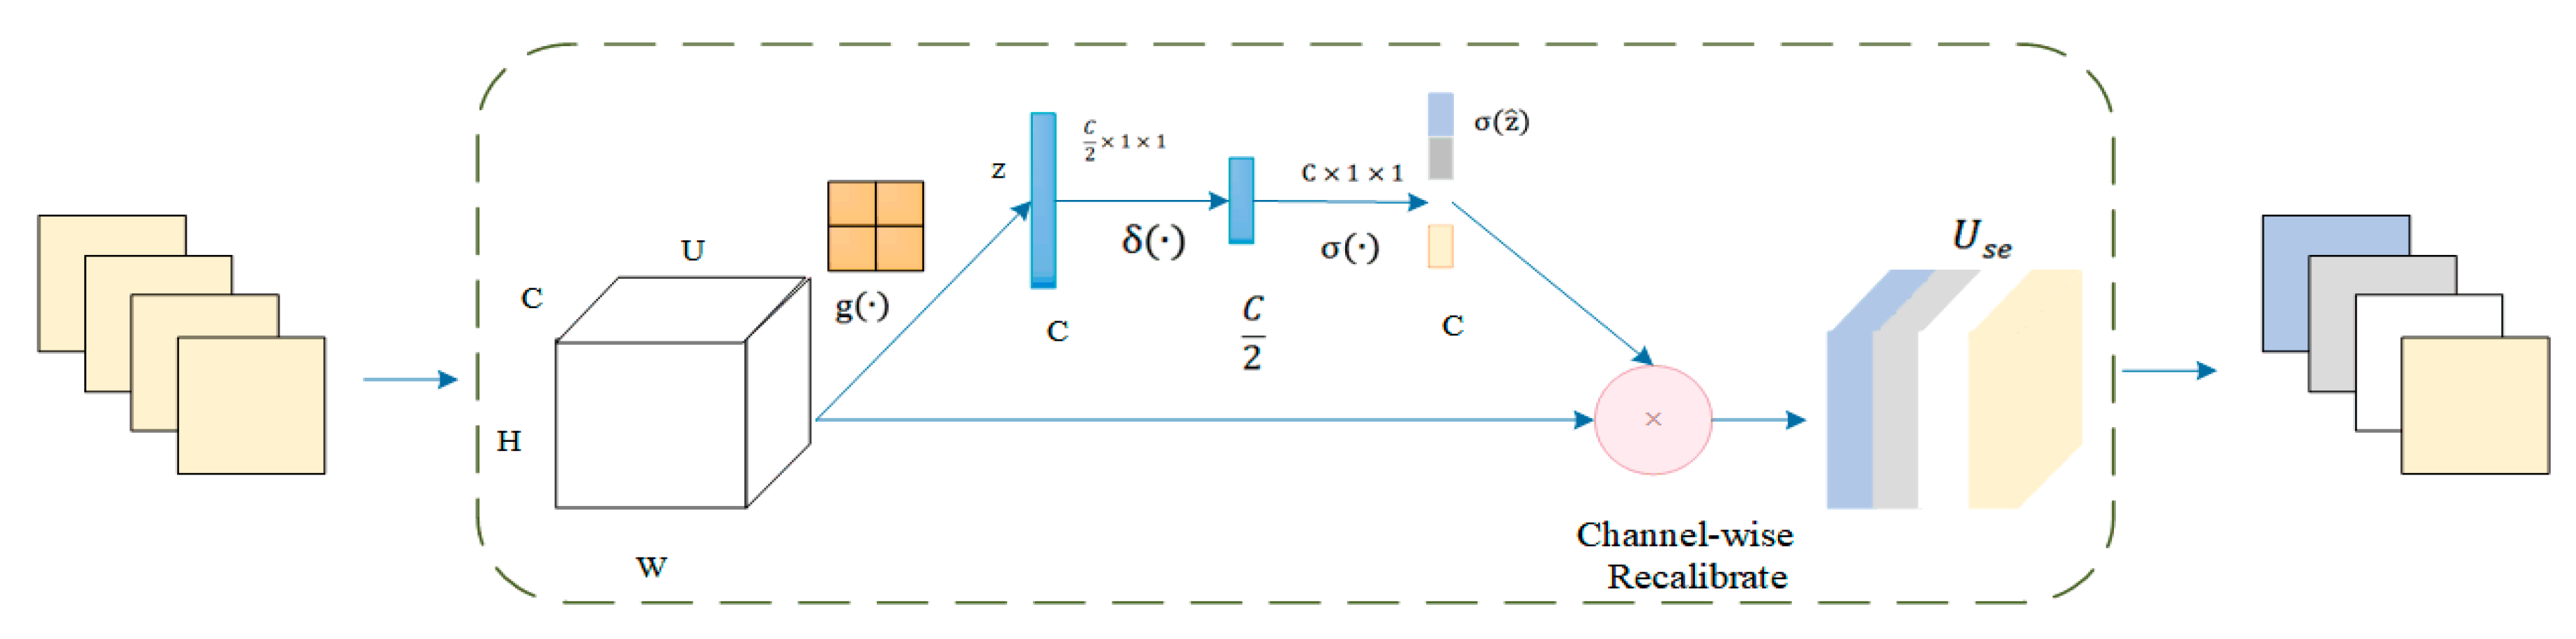
The squeeze and excitation network attention mechanism was added before the final ReLU activation function. The architecture of the squeeze and excitation model was shown in Figure 3. The attention mechanism performs two essential operations: squeeze and excitation. The squeeze operation performs the global average pooling of each input channel to obtain the channel descriptors. The excitation operation generates weights for each channel by using two fully connected pooling layers. Finally, the output weights of excitation are reweighted with the previous features to complete the calibration of the original features in the channel dimension, thus improving the accuracy of image classification.
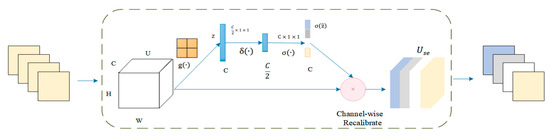
Figure 3.
Architecture of the squeeze and excitation model.
To improve the model’s generalization ability and speed up the training, batch normalization was performed on the data. Suppose the number of an input batch B = {x1…xm} is a total of m data. Then, the mean value of this batch data is:
The variance is:
The normalization of x results in:
Introducing the sum of the scaling and translation quantities and gives the output as:
The size in Equation (9) was set to , which improved the normalization calculation’s stability.
where .
The squeeze activation module includes a global average pooling layer and two fully connected layers. The input feature map is U = [u1,u2, …, uc]. The value U performs a global average pooling operation for space compression. The process is defined as . Then, the vector z is obtained. The value of each channel of z is obtained by the calculation method shown in Equation (10).. H is the height of the feature map; W is the width of the feature map; C is the number of channels; and is the spatial coordinate in the feature map. The z is input into the fully connected layer. The degree of importance of the ith channel feature is calculated using the activation function and the normalization layer function in turn. The final standard sampling process was completed by recalibrating the channels. In summary, the SE module is implemented in Equation (11). In essence, the feature image was introduced a dynamic prior to the input image by the squeeze and excitation unit.
Stage 4 consisted of a fully connected layer and an adaptive average pooling layer. The convolution obtained local features. The full connection refers to the reassembly of these local features into a complete graph by the weight matrix. Also, to alleviate the overfitting problem of the model, the DropOut layer was added after the first residual block of Stage 2 and before the fully connected layer, thus setting the probability of temporary receding to 0.2 and 0.5, respectively. The last fully connected layer of the ResNet-18 classified the images. The prediction task in this paper was to distinguish the wild type or mutant type, so the classification label was 2. The pooling layer reduced the feature map’s dimension and decreased the convolutional layer’s sensitivity to the unknown and spatial down sampling. Common down sampling includes max-pooling and mean-pooling. Adaptive mean-pooling was used in this paper for a multi-scale fusion of lung nodule features to expand the depth of extracted lung nodules.
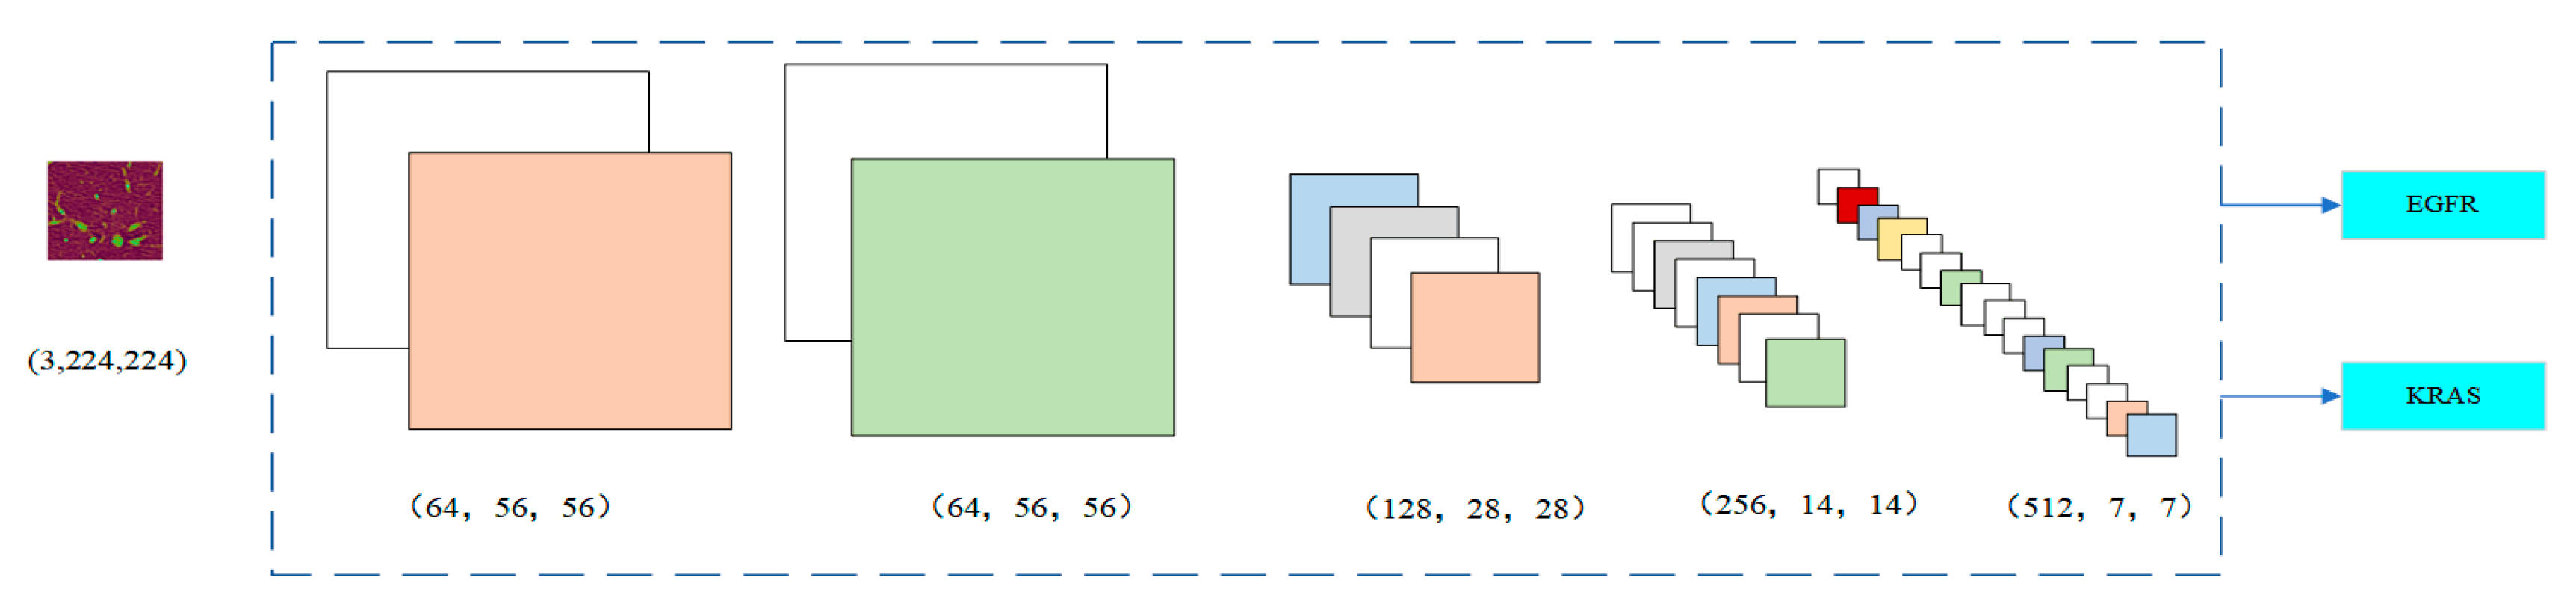
Figure 4 shows the change in the number of channels of the image after each stage. In Stage 1, the image was 64 × 56 × 56. Since Stage 2 had a 1 × 1 convolution layer, the number of channels did not change. In Stage 3, the number of channels was doubled from 128 to 256 and finally to 512 by three residual blocks, respectively. The input was directly connected to the output of each layer so that the fitting target changed from the objective function to the residual (the difference between the objective function and the input). The residual fits the difficulty of the benign and malignant lung nodule classification problem for highlighting the small changes in the input value. It also avoids the dissipation of feature information when extracting the image features. By nesting the attention mechanism into the ResNet module, it helps to capture the internal connections in the global space without increasing the supervision of the model. For some channels, it can play a more significant role in increasing their weight status. At the same time, it weakens the dimensions whose roles are not that important. The dependency information between different image channels is carried out to improve the network’s performance.
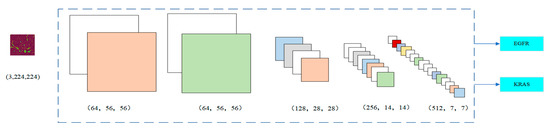
Figure 4.
Number of image channels in each stage.
By stacking a series of convolutional layers with four residual blocks, inserting the non-linear function (i.e., activation functions), and down sampling, the convolutional neural network can depict the layered features of the image within the global field of perception, thus becoming a powerful image feature exponent. While retaining the spatial structure of internal data, the relevant features of pulmonary nodules can be obtained as much as possible. The area of nodules can be more accurately divided from the original image so that the hidden information about the shape and internal structure of pulmonary nodules can be captured. The recognition accuracy improved significantly.
4. Results
4.1. Dataset Preparation
The training dataset in this paper was collected from the partner hospitals in Shanxi province. From 2017 to 2019, the dataset included a total of 363 mutated patients, which had 156 males and 207 females. Ages ranged from 43 to 80 years, with a median age of 61 years, 236 cases of smoking, 164 cases of the EGFR mutant, 199 cases of its wild type, 84 cases of the KRAS mutant, and 279 cases of its wild type. Among them, 500 mutant and 1500 wild-type images were selected for multi-task training. The clinical characteristics of the training dataset are shown in Table 1.

Table 1.
The clinical characteristics of the training dataset.
This paper used Legion R7000p, AMD i7, and PyTorch frameworks based on Python for training and testing. Due to the limitation of GPU video memory, the batch size of training parameters was set to 32, followed by iterative training in 15 epochs. The stochastic gradient descent algorithm was used to make the parameters update much faster. The learning rate during the training process was 0.001.
In the data preprocessing stage, a random transformation operation was performed on the CT images to prevent data overfitting and to enhance the model’s generalization ability.
4.2. Experiment Result
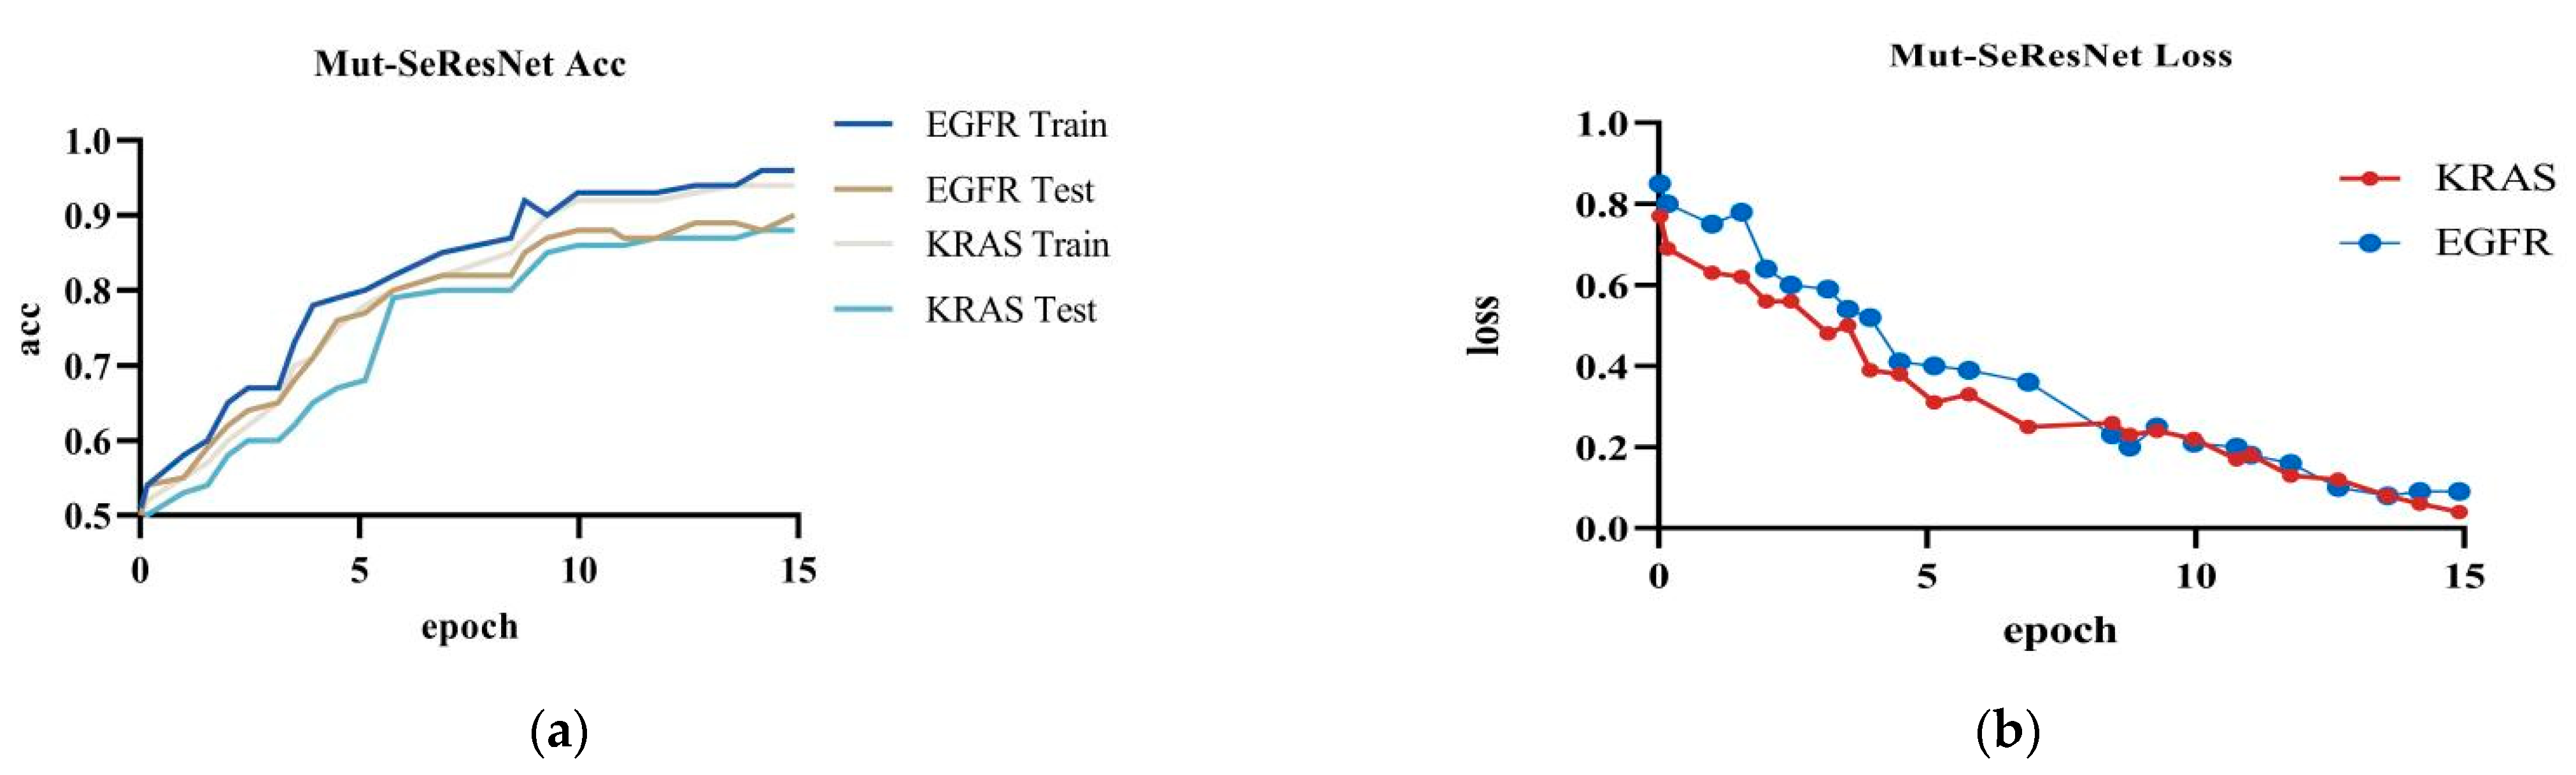
The Mut-SeResNet model achieved 89.7% accuracy in predicting EGFR, with 6.4% training loss accuracy, and 88.3% accuracy in predicting KRAS, with 9.2% training loss accuracy, when performing the prediction of gene mutations on the test dataset.It can be shown in Figure 5.

Figure 5.
Mut-SeResNet: (a) the accuracy of Mut-ResNet in predicting EGFR and KRAS; (b) the loss of Mut-ResNet in predicting EGFR and KRAS genes.
4.3. Ablation Experiment
In this paper, ablation experiments were performed to verify that the joined attention mechanism and to multi-task impact the prediction of gene mutations. The settings of the experimental items are shown in Table 2.
Table 2.
Results of different combinations of ablation experiments.
Figure 6 showed the comparison of the prediction results between the base model ResNet and the model with the attention mechanism on the test dataset; the prediction accuracy of the original ResNet model was 72.1%. The model’s accuracy was 82.6% after adding the squeeze and excitation attention mechanism. The combination of ResNet with the SE attention mechanism significantly improved the accuracy when compared to the original model. The attention mechanism uses the global sensory field to dynamically adjust the importance of each channel in the feature map. The mechanism exploits the correlation information between the feature maps to assist in the extracting of CT image features of pulmonary nodules. Adding the squeeze and excitation attention mechanism can effectively improve the accuracy of lung nodule classification and model performance.
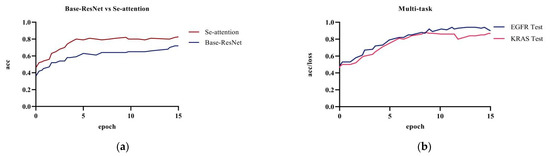
Figure 6.
Experiment a, b, and d: (a) base Resnet and ResNet network with only the attention mechanism added; (b) multi-task training in the ResNet network.
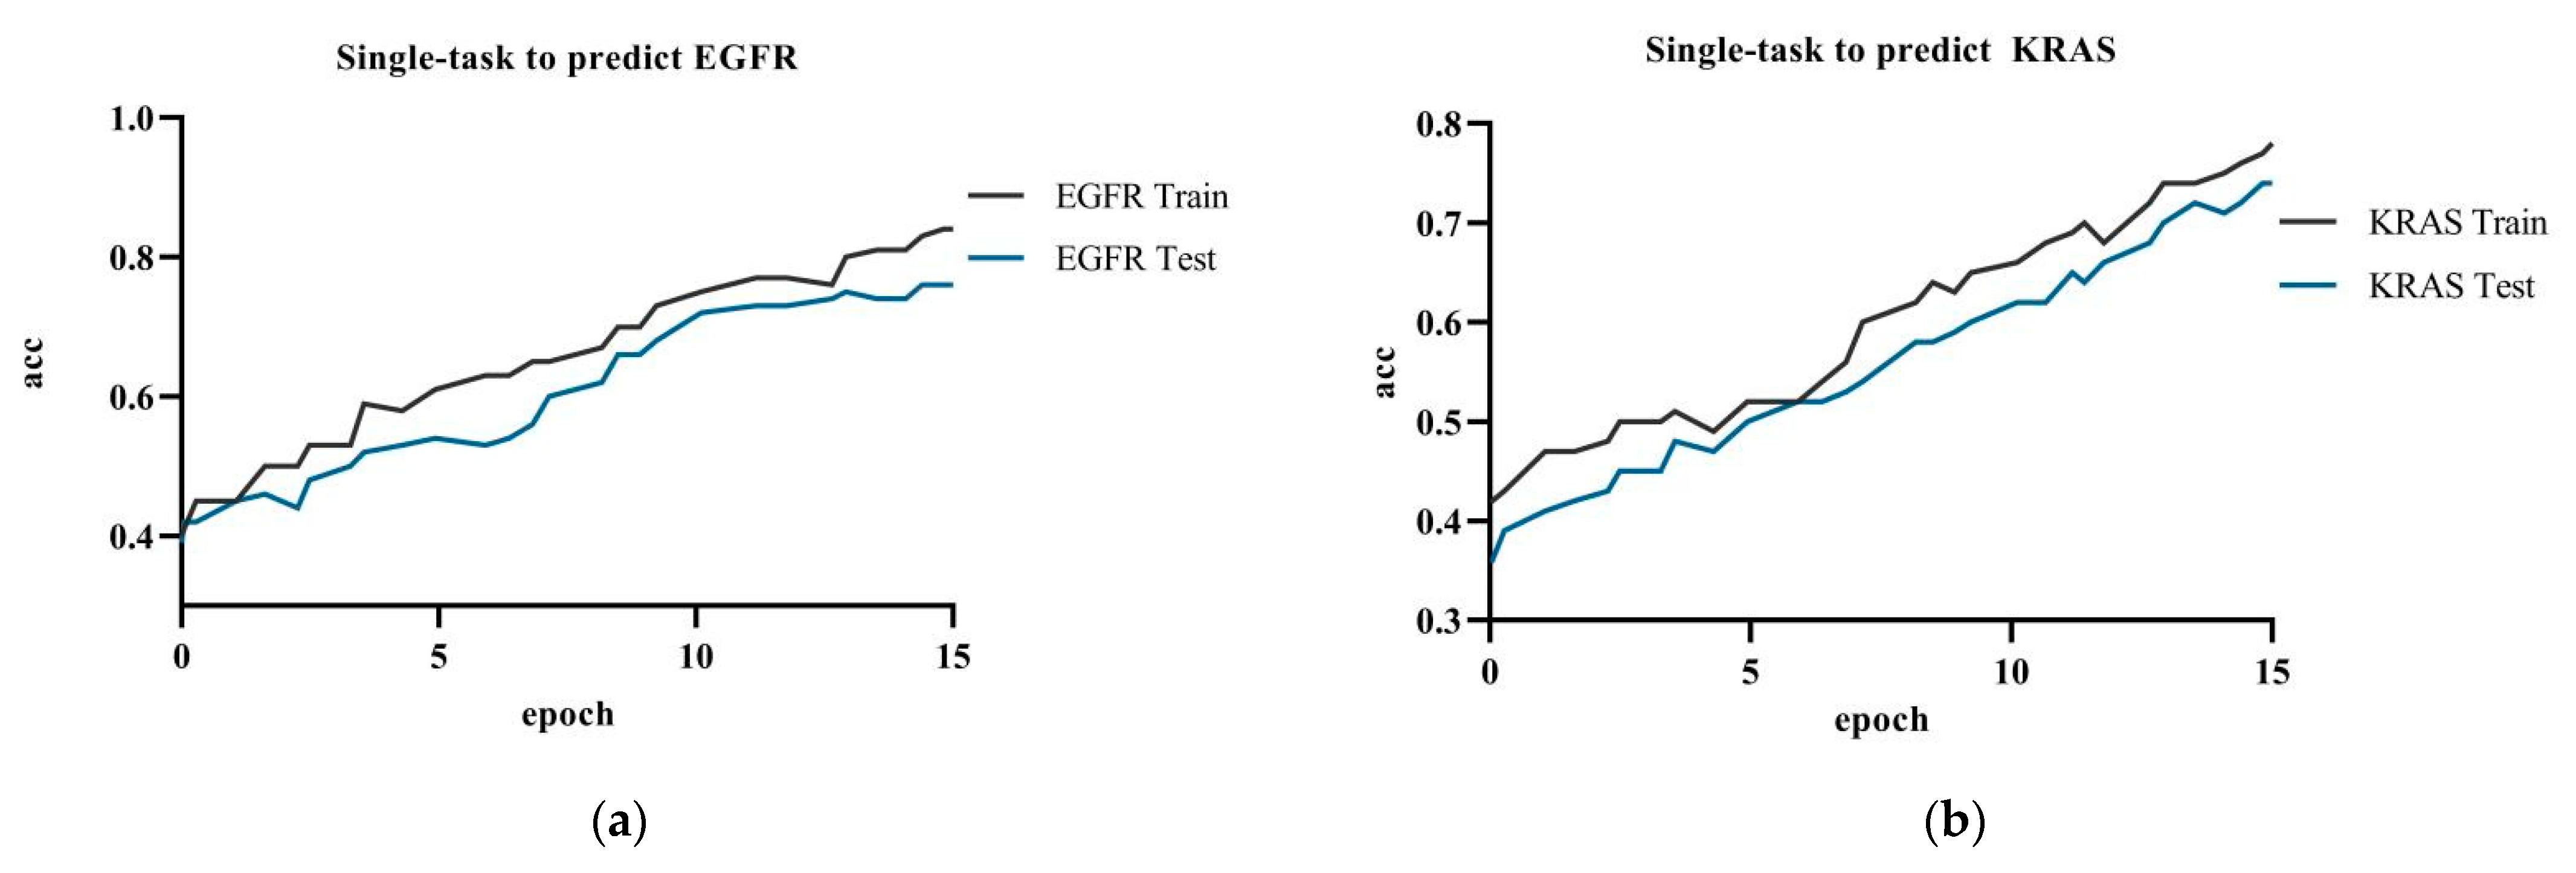
Figure 7 showed the model accuracy of single-task prediction to predict EGFR and KRAS and the model accuracy of multi-task prediction. The results showed that the multi-task prediction results were higher than the single-task prediction. The training accuracy for the single-task prediction of EGFR was 84.9%, and the testing accuracy was 76.1%; the training accuracy for predicting KRAS was 78.2%, and the testing accuracy was 74.0%. The multi-task prediction model predicted EGFR with 87.8% accuracy and KRAS with 86.7% in test dataset. The accuracy of single-task prediction was much lower than that of multi-task prediction. The tasks influenced and promoted each other when the multi-task prediction was performed.
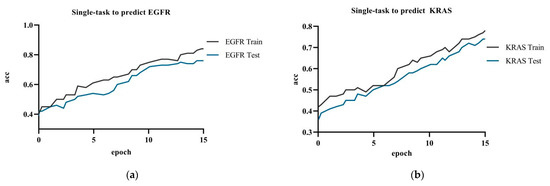
Figure 7.
Experiment c: (a) single-task training in the ResNet network to predict EGFR gene; (b) single-task training in the ResNet network to predict KRAS gene.
When compared to only adding the squeeze and excitation attention mechanism and multi-task training, the Mut-SeResNet model achieved better prediction performance and higher accuracy.
4.4. Visualization of the Models
4.4.1. Single-Task versus Multi-Task Attention
A visualization of the single-task versus multi-task attention to nodules was made to further illustrate the results.
In Figure 8, the a2 images showed the graph of the EGFR gene visualization results, b2 showed the KRAS gene visualization results, and a3 and b3 were the superimposed heat map images and CT images, respectively. It can be seen from the graph that the model gave less weighted attention to the corresponding nodal regions of EGFR/KRAS when compared to the multitasking. The attention given to the EGFR gene was even more weighted. Consequently, the mutation prediction effect of the EGFR was better than that of the KRAS, which was related to the sensitivity of the EGFR to images.

Figure 8.
Epidermal growth factor (EGFR) mutation and wild type: (a1) KRAS tumor image; (a2) KRAS class activation map (CAM); (a3) KRAS suspicious area; (b1) EGFR tumor image; (b2) EGFR class activation map (CAM); (b3) EGFR suspicious area.
4.4.2. Nodules under Different Gene Mutation Types
To compare the model’s performance objectively, nodules under different gene mutation types (EGFR mutation or wild type, KRAS mutation or wild type) were randomly selected when adding the attention mechanism. Their characteristic activation was plotted before and after the addition of the attention mechanism was visualized, as is shown in Figure 9.
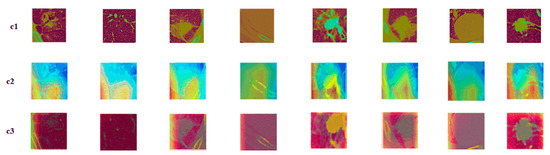
Figure 9.
Attention mechanism contrast visualization: (c1) tumor image; (c2) class activation map (CAM) without attention mechanism; (c3) class activation map (CAM) with attention mechanism.
The c1 was the original nodule image, c2 was the feature activation map without the attention mechanism added, and c3 was the feature activation map with the attention mechanism added. As is seen from the figures, adding attention to the model could make the model focus more on the features of the most discriminative nodules and ignore the features of the underlying background, thus improving the model’s performance. When compared to the spatial attention model, the squeeze and excitation attention mechanism was chosen, because this attention mechanism captures the relationship between different feature representations. The mechanism learns the attention weights and judges the importance of features on the channels based on the weights. The squeeze and excitation attention mechanism improved the classification performance by focusing on more representative features.
5. Discussion
5.1. Impact of PatientPpersonal Information on Results
This paper delved further into the effect of adding a priori information (age, gender, and smoking status on the prediction results) to the multi-task prediction on predicting EGFR. In Figure 10, the effects of the three factors on the prediction results were in descending order: smoking status, gender, and age. In Table 3, the predicted mutation results increased by 0.03% after adding age information to the model. The accuracy prediction results increased by 0.29% after adding gender information to the model. The predicted accuracy increased by 0.295% after adding smoking status information to the model. Statistical analysis of the dataset in the experimental dataset preliminarily concluded that mutations were higher in females and smokers. In the studies of Liu Y [34] and Ying L [35], the effect of smoking on carcinogenesis was also found to be more significant.
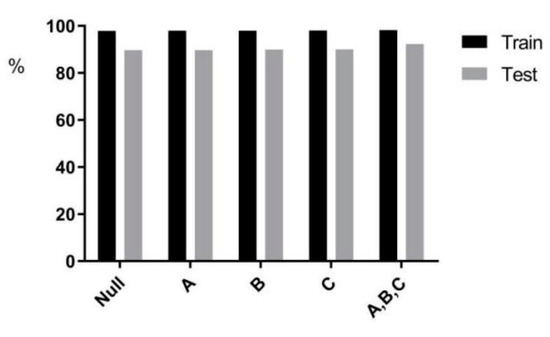
Figure 10.
Statistical chart of a priori information.
Table 3.
A priori information on the model impact.
The CNN classifier for EGFR and KRAS mutations showed good accuracy. Moreover, the sensitivity and specificity could be further improved by adding clinical features (age, gender, and smoking status). This paper showed that it is feasible to use CT images and CNN to identify EGFR and KRAS gene mutations in lung cancer. This medical image-based approach has many advantages over other testing methods:
- It has the potential to support treatment decisions when surgical resection and puncture biopsy are difficult;
- It can be applied to the entire therapeutic EGFR mutation status, as CT images are repeatedly captured in clinical practice;
- CNN tools analyze the entire tumor, not just the tissue sample. They may be able to overcome the problem of heterogeneity;
- The use of CNN is a fast, easy, and low-cost method.
Given that the field of radionics is expanding, new methods for extracting information from medical images benefit disease diagnosis, treatment, and prognosis. Tumor phenotypes, including its aggressiveness, driver genes, heterogeneity, response to treatment, and recurrence, can be more precisely identified and defined with the help of quantitative analysis of the medical images.
5.2. Comparison with Deep Methods
In Table 4, by replacing the Mut-SeResNet by embedding the popular deep learning models (VGG16, InceptionV3, Inception-ResNet-V2) into it, each model’s accuracy, sensitivity, and specificity were compared by conducting single-task (predicting EGFR and KRAS separately) and multi-task training (simultaneous prediction of EGFR and KRAS).
Table 4.
Predictive performance of various deep methods on the dataset.
Horizontal axis 1 represents the VGG16 model, horizontal axis 2 represents the InceptionV3 model, horizontal axis 3 represents Inception-ResNet-v2, and horizontal axis 4 represents Mut-SeResnet.
The Table 2 showed that, in almost all models, multi-task prediction results were higher than single-task. The accuracy, specificity, and sensitivity of our model Mut-SeResnet all performed well when compared to other models.
5.3. Comparison with Recent Studies and Methods
Among the studies on deep learning methods for predicting gene mutations, the comparison is shown in Table 5.
Table 5.
Comparison with recent studies.
Literature A predicted EGFR gene mutations and achieved a prediction AUC (Area Under Curve) of 0.85. When compared to other studies, A was used for a larger dataset and was using deep learning techniques to predict gene mutations. However, A required experimental equipment with better performance. Literature B predicted gene mutations by using imaging omics and achieved an AUC value of 0.670, which further validated that the extraction of clinical features facilitated improved prediction performance.
Literature C trained weakly supervised learning algorithms on whole lymph node images of lung cancer patients, and had an accuracy and AUC of 84% and 0.903 with a small amount of training data, respectively.
Literature D used 3D CNN to predict EGFR gene mutations in lung adenocarcinoma, and achieved AUC prediction values of 0.776 and then 0.838 with the addition of clinical information, respectively. It was verified that adding a small amount of clinical information to the model could effectively improve the predictive performance of the model.
Both literature E and literature F built 3D convolutional neural networks. Literature E mainly consisted of two different 3D CNNs that used the softmax activation function to obtain the final disease probability. It finally achieved 82.89% accuracy. Literature F built a 3D convolutional neural network (3D CNN) model based on the processed images. By improving the baseline model, it eventually achieved 65% accuracy.
Literature G proposed the Otsu method combined with morphological operations for segmentation, using 6306 CT images from the LIDC-IDRI database for the experiment, and achieved 84.31% accuracy, with sensitivity and specificity results of 91.69% and 73.16%, respectively.
The Mut-SeResNet model in this paper predicted gene mutations in both EGFR and KRAS by learning the features of genes. The multi-task influence and promote each other. Although imaging detection cannot replace biopsy, it can be used as a complement to biopsy methods. When compared to existing depth models and imaging omics models, the model proposed in this paper achieved higher prediction accuracy and better prediction performance. The main advantage of predicting gene mutations based on images, compared to pathological biopsies, is to provide an alternative solution when patients cannot receive biopsies at high frequencies. Our proposed prediction model can be tracked repeatedly throughout the treatment process, thus continuously learning and continuously improving the accuracy.
6. Conclusions
This paper proposed a deep learning model based on residual networks to predict EGFR and KRAS gene mutations in non-small cell lung cancer. We used the dataset of 363 patients collected from collaborating hospitals to train our Mut-SeResNet model. The prediction accuracy for EGFR and KRAS mutations was 89.7% and 88.3%, respectively.
The reason for choosing ResNet as the base network is that the residual learning network solves the problem of gradient disappearance in deep networks. It also has the advantages of simple and modular network structure. However, the residual network has problems, such as channel interaction and restricted perceptual field, which result in the loss of local features of the model. By introducing a squeeze and excitation attention mechanism to capture the correlation between features, the channel-wise feature representation wass adaptively recalibrated. To verify the rigor of this work, we (1) explored the impact of different combinations of ResNet and self-attention on the model performance; (2) to further validate the performance of the model proposed in this paper, we presented the experimental results visually, which showed that the module was able to focus more model attention on more discriminative features; and (3) we compared recent studies, which showed that this experiment achieved a high accuracy rate.
However, this work still has limitations. Only one hospital dataset was collected, and the proposed method will be validated using at least two hospital datasets in the next study.
The results showed that the model could predict both EGFR and KRAS mutations in non-small cell lung cancer. The main advantage of the proposed Mut-SeResnet model is that it can dynamically extract image features and change the weight of different channels during the training process to improve performance. In addition, the analysis of medical images (CT, PET, or Mr/CT) by this method may also reveal other features of the disease, including the proliferative activity of the tumor, the hypoxic state, and the surrounding tumor environment. The development of deep networks can actively advance the development of individualized medicine and clinical applications.
There is room for improvement in CT image-based gene mutation detection methods, which may be valuable in future clinics.
Author Contributions
Conceptualization, L.S. and Y.D.; methodology, L.S. and Y.D.; software, L.S. and X.F. (Xiaole Fan); validation, Y.D. and X.F. (Xiufang Feng); formal analysis, Y.D. and X.F. (Xiaole Fan); investigation, L.S. and Y.D.; resources, Y.D., X.F. (Xiaole Fan) and S.X.; data curation, Y.D.; writing—original draft preparation, L.S. and Y.D.; writing—review and editing, L.S., Y.D. and S.X.; visualization, S.X. and X.F. (Xiufang Feng); supervision, Y.D.; project administration, L.S. and Y.D.; funding acquisition, L.S., Y.D., S.X. and X.F. (Xiufang Feng). All authors have read and agreed to the published version of the manuscript.
Funding
This work is supported by the National Natural Science Foundation of China (No. 62102280); the Key Research and Development Program of Shanxi Province (No. 202102020101001, 202102020101007); and the Applied Basic Research Program of Shanxi Province (NO. 20210302124167).
Conflicts of Interest
The authors declare no conflict of interest.
References
- Zeng, H.; Wang, S.; Sun, K.; Chen, R.; Li, L.; Wei, W.; He, J. Cancer incidence and mortality in China, 2016. J. Natl. Cancer Cent. 2022, 2, 1–9. [Google Scholar] [CrossRef]
- Liu, F.; Chen, Z.; Sun, P. Detection and segmentation of pulmonary nodules based on improved 3D VNet algorithm. SPIE 2022, 12176, 51–59. [Google Scholar]
- Goldstraw, P.; Ball, D.; Jett, J.R.; Le Chevalier, T.; Lim, E.; Nicholson, A.G.; Shepherd, F.A. Non-small-cell lung cancer. Nat. Rev. Dis. Prim. 2015, 1, 15048. [Google Scholar] [CrossRef] [PubMed]
- Siegel, R.L.; Miller, K.D.; Jemal, A. Cancer statistics, 2018. CA Cancer J. Clin. 2018, 68, 7–30. [Google Scholar] [CrossRef] [PubMed]
- Coudray, N.; Ocampo, P.S.; Sakellaropoulos, T.; Narula, N.; Snuderl, M.; Fenyo, D.; Moreira, A.L.; Razavian, N.; Tsirigos, A. Classification and mutation prediction from non-small cell lung cancer histopathology images using deep learning. Nat. Med. 2018, 24, 1559–1567. [Google Scholar] [CrossRef]
- Motono, N.; Funasaki, A.; Sekimura, A.; Usuda, K.; Uramoto, H. Prognostic value of epidermal growth factor receptor mutations and histologic subtypes with lung adenocarcinoma. Med. Oncol. 2018, 35, 22. [Google Scholar] [CrossRef]
- Murphy, K.; van Ginneken, B.; Schilham, A.M.R.; de Hoop, B.J.; Gietema, H.A.; Prokop, M. A large scale evaluation of automatic pulmonary nodule detection in chest CT using local image features and k-nearest-neighbour classifification. Med. Image Anal. 2009, 13, 757–770. [Google Scholar] [CrossRef]
- Messay, T.; Hardie, R.C.; Rogers, S.K. A new computationally effificient CAD system for pulmonary nodule detection in CT imagery. Med. Image Anal. 2010, 14, 390–406. [Google Scholar] [CrossRef]
- Jacobs, C.; van Rikxoort, E.; Twellmann, T.; Scholten, E.; de Jong, P.; Kuhnigk, J.; Oudkerk, M.; de Koning, H.; Prokop, M.; Schaefer-Prokop, C.; et al. Automatic detection of subsolid pulmonary nodules in thoracic computed tomography images. Med. Image Anal. 2014, 18, 374–384. [Google Scholar] [CrossRef] [PubMed]
- Wan, C.; Ma, L.; Liu, X.; Fei, B. Computer-aided classification of lung nodules on CT images with expert knowledge. Proc. SPIE Int. Soc. Opt. Eng. 2021, 11598, 115982K. [Google Scholar] [CrossRef] [PubMed]
- Choi, J.K.; Yang, E.; Chin, A.Y.; Park, M.; Moon, J.W.; Kim, J.H. Can deep learning model undergo the same process as a human radiologist when determining malignancy of pulmonary nodules? SPIE 2022, 12033, 844–848. [Google Scholar]
- Mahdy, A.M.S. A numerical method for solving the nonlinear equations of Emden-Fowler models. J. Ocean. Eng. Sci. 2022. [Google Scholar] [CrossRef]
- Mahdy, A.M.S.; Lotfy, K.; El-Bary, A.A. Use of optimal control in studying the dynamical behaviors of fractional financial awareness models. Soft Comput. 2022, 26, 3401–3409. [Google Scholar] [CrossRef]
- Prasoon, A.; Petersen, K.; Igel, C.; Lauze, F.; Dam, E.; Nielsen, M. Deep feature learning for knee cartilage segmentation using a triplanar convolutional neural network. In Proceedings of the Medical Image Computing and Computer-Assisted Intervention–MICCAI 2013: 16th International Conference, Nagoya, Japan, 22–26 September 2013; pp. 246–253. [Google Scholar]
- Cruz-Roa, A.A.; Arevalo Ovalle, J.E.; Madabhushi, A.; González Osorio, F.A. A deep learning architecture for image representation, visual interpretability and automated basal-cell carcinoma cancer detection. In Proceedings of the Medical Image Computing and Computer-Assisted Intervention–MICCAI 2013: 16th International Conference, Nagoya, Japan, 22–26 September 2013; pp. 403–410. [Google Scholar]
- Li, R.; Zhang, W.; Suk, H.I.; Wang, L.; Li, J.; Shen, D.; Ji, S. Deep learning based imaging data completion for improved brain disease diagnosis. In Proceedings of the Medical Image Computing and Computer-Assisted Intervention–MICCAI 2014: 17th International Conference, Boston, MA, USA, 14–18 September 2014; pp. 305–312. [Google Scholar]
- Roth, H.R.; Lu, L.; Seff, A.; Cherry, K.M.; Hoffman, J.; Wang, S.; Liu, J.; Turkbey, E.; Summers, R.M. A new 2.5 D representation for lymph node detection using random sets of deep convolutional neural network observations. In Proceedings of the Medical Image Computing and Computer-Assisted Intervention–MICCAI 2014: 17th International Conference, Boston, MA, USA, 14–18 September 2014; pp. 520–527. [Google Scholar]
- Brosch, T.; Yoo, Y.; Li, D.K.B.; Traboulsee, A.; Tam, R. Modeling the variability in brain morphology and lesion distribution in multiple sclerosis by deep learning. In Proceedings of the Medical Image Computing and Computer-Assisted Intervention–MICCAI 2014: 17th International Conference, Boston, MA, USA, 14–18 September 2014; Volume 8674, pp. 462–469. [Google Scholar]
- Shen, W.; Zhou, M.; Yang, F. Mutil-scale convolutional neural networks for lung nodule classification. In Proceedings of the International Conference on Information Processing in Medical Imaging, Isle of Skye, UK, 28 June–3 July 2015; pp. 588–599. [Google Scholar]
- Hussein, S.; Cao, K.; Song, Q. Risk stratification of lung nodules using 3d cnn-based multi-task learning. In Proceedings of the International Conference on Information Processing in Medical Imaging, Boone, NC, USA, 25–30 June 2017; pp. 249–260. [Google Scholar]
- Zhu, W.; Liu, C.; Fan, W.; Xie, X.H. Deeplung: 3d deep convolutional nets for automated pulmonary nodule detection and classfication. arXiv 2017, arXiv:1709.05538. [Google Scholar]
- Chen, Y.; Li, J.; Xiao, H.; Jin, X.; Yan, S.; Feng, J. Dual path networks. arXiv 2017, arXiv:1707.01629. [Google Scholar]
- Nibali, A.; He, Z.; Wollersheim, D. Pulmonary nodule classification with deep residual networks. Int. J. Comput. Assist. Radiol. Surg. 2017, 12, 1799–1808. [Google Scholar]
- Ettinger, D.S.; Wood, D.; Akerley, W.; Bazhenova, L.; Borghaei, H.; Camidge, D.R.; Cheney, R.T.; Chirieac, L.R.; Damico, T.A.; Dilling, T.J. NCCN Guidelines Insights: Non-Small Cell Lung Cancer, Version 4.2016. J. Natl. Compr. Cancer Netw. 2016, 14, 255–264. [Google Scholar] [CrossRef]
- Nakatani, K.; Yamaoka, T.; Ohba, M.; Fujita, K.; Arata, S.; Kusumoto, S.; Takitakemoto, I.; Kamei, D.; Iwai, S.; Tsurutani, J. KRAS and EGFR Amplifications Mediate Resistance to Rociletinib and Osimertinib in Acquired Afatinib-Resistant NSCLC Harboring Exon 19 Deletion/T790M in EGFR. Mol. Cancer Ther. 2019, 18, 112–126. [Google Scholar] [CrossRef]
- Ye, Z. Genetic Mutations in Causing Non-small Cell Lung Cancers and Related Drugs’ Efficiency. In 2022 International Conference on Social Sciences and Humanities and Arts (SSHA 2022); Atlantis Press: Amsterdam, The Netherlands, 2022; pp. 1141–1145. [Google Scholar]
- Zhou, C.; Wu, Y.L.; Chen, G.; Feng, J.; Liu, X.Q.; Wang, C.; Zhang, S.; Wang, J.; Zhou, S.; Ren, S.; et al. Erlotinib versus chemotherapy as first-line treatment for patients with advanced EGFR mutation-positive non-small-cell lung cancer (OPTIMAL, CTONG-0802): A multicentre, open-label, randomised, phase 3 study. Lancet Oncol. 2011, 12, 735–742. [Google Scholar] [CrossRef]
- Selvaraju, R.R.; Cogswell, M.; Das, A.; Vedantam, R.; Parikh, D.; Batra, D. Grad-CAM: Visual Explanations from Deep Networks via Gradient-Based Localization. In Proceedings of the 2017 IEEE International Conference on Computer Vision (ICCV), Venice, Italy, 22–29 October 2017. [Google Scholar]
- Zhang, J.; Zhao, X.; Zhao, Y.; Zhang, J.; Zhang, Z.; Wang, J.; Wang, Y.; Dai, M.; Han, J. Value of pre-therapy 18 F-FDG PET/CT radiomics in predicting EGFR mutation status in patients with non-small cell lung cancer. Eur. J. Nucl. Med. Mol. Imaging 2020, 47, 1137–1146. [Google Scholar] [CrossRef]
- He, K.; Zhang, X.; Ren, S.; Sun, J. Deep residual learning for image recognition. In Proceedings of the Conference on Computer Vision and Pattern Recognition, Las Vegas, NV, USA, 27–30 June 2016; pp. 770–778. [Google Scholar]
- Simonyan, K.; Zisserman, A. Very Deep Convolutional Networks for Large-Scale Image Recognition. arXiv 2014, arXiv:1409.1556. [Google Scholar]
- Hu, J.; Shen, L.; Sun, G. Squeeze-and-excition networks. In Proceedings of the IEEE Conference on Computer Vision and Pattern Recognition, Salt Lake City, UT, USA, 18–22 June 2018; pp. 7132–7141. [Google Scholar]
- Guan, Q.J.; Huang, Y.P. Multi-label chest X-ray image classification via category-wise residual attention learning. Pattern Recognit. Lett. 2020, 130, 259–266. [Google Scholar] [CrossRef]
- Velazquez, E.R.; Liu, Y.; Parmar, C.; Narayan, V.; Gillies, R.; Aerts, H. MO-DE-207B-08: Radiomic CT Features Complement Semantic Annotations to Predict EGFR Mutations in Lung Adenocarcinomas. Med. Phys. 2016, 43, 3706. [Google Scholar] [CrossRef]
- Ying, L.; Kim, J.; Balagurunathan, Y.; Qian, L.; Garcia, A.L.; Stringfield, O.; Ye, Z.; Gillies, R.J. Radiomic Features Are Associated With EGFR Mutation Status in Lung Adenocarcinomas. Clin. Lung Cancer 2016, 17, 441. [Google Scholar]
- Wang, S.; Shi, J.; Ye, Z.; Dong, D.; Yu, D.; Zhou, M.; Liu, Y.; Gevaert, O.; Wang, K.; Zhu, Y. Predicting EGFR Mutation Status in Lung Adenocarcinoma on CT Image Using Deep Learning. Eur. Respir. J. 2019, 53, 1800986. [Google Scholar] [CrossRef]
- Rios Velazquez, E.; Parmar, C.; Liu, Y.; Coroller, T.P.; Cruz, G.; Stringfield, O.; Ye, Z.; Makrigiorgos, M.; Fennessy, F.; Mak, R.H.; et al. Somatic Mutations Drive Distinct Imaging Phenotypes in Lung Cancer. Cancer Res. 2017, 77, 3922–3930. [Google Scholar] [CrossRef]
- Gwerder, M.; Khan, A.; Neppl, C.; Zlobec, I. Detection of lung cancer metastases in lymph nodes using a multiple instance learning approach. SPIE 2022, 12039, 332–337. [Google Scholar]
- Xiong, J.F.; Jia, T.Y.; Li, X.Y.; Yu, W.; Xu, Z.Y.; Cai, X.W.; Fu, L.; Zhang, J.; Qin, B.J.; Fu, X.L.; et al. Identifying epidermal growth factor receptor mutation status in patients with lung adenocarcinoma by three-dimensional convolutional neural networks. Br. J. Radiol. 2018, 91, 20180334. [Google Scholar] [CrossRef]
- Yuchen, G.; Jialong, Z. Lung cancer diagnosis system based on 3D CNN. SPIE 2022, 12179, 255–263. [Google Scholar]
- Diao, Y.; Shi, Y.; Hou, Y.; Gao, Y.; Yu, H. Lung Cancer Detection with 3D Ensemble Convolution Neural Network. In Proceedings of the 2019 3rd International Conference on Computer Science and Artificial Intelligence, Normal, IL, USA, 6–8 December 2019; pp. 64–70. [Google Scholar]
- Sharma, M.; Bhatt, J.S.; Joshi, M.V. Early detection of lung cancer from CT images: Nodule segmentation and classification using deep learning. SPIE 2018, 10696, 226–233. [Google Scholar]


Disclaimer/Publisher’s Note: The statements, opinions and data contained in all publications are solely those of the individual author(s) and contributor(s) and not of MDPI and/or the editor(s). MDPI and/or the editor(s) disclaim responsibility for any injury to people or property resulting from any ideas, methods, instructions or products referred to in the content. |
© 2023 by the authors. Licensee MDPI, Basel, Switzerland. This article is an open access article distributed under the terms and conditions of the Creative Commons Attribution (CC BY) license (https://creativecommons.org/licenses/by/4.0/).